School of Mathematics and Physics Queen’s University Belfast Belfast BT7 1NN Northern Ireland United Kingdom. \alsoaffiliationInstitute of Microelectronics Technology and High-Purity Materials, Russian Academy of Sciences, Chernogolovka, Moscow oblast, Russia \alsoaffiliationInstitute of Nanotechnology of Microelectronics, Russian Academy of Sciences, Moscow, 115487, Russia
Blocking of martensitic transition at the nano-scale in the Ti2NiCu wedge.
Abstract
Shape memory effect associated with martensitic transformations is of the rapidly developing field in nanotechnologies, where industrial use of systems established on that effect provide greater flexibility on the nano-devices fabrication of various kind. And therefore it addresses questions to the phase transition phenomena at low-scale and its limitations and control. In this report, we studied the crystal structure of tapered plates of Ti2NiCu alloy and the temperature at which the martensitic transition occurs. We demonstrated that has a strongly descending character as a function of the plate thickness . The critical thickness value at which the transition completely suppressed is 20 nm. Moreover, the obtained results for curves indicate the hysteretic nature of the transition. These findings open the pathway for size limits indication and regimes modulation where the alloy-based nano-mechanical devices can be tuned to operate more efficiently.
keywords:
martensite, phase transition, DFT, SME, nano-wedgeKeywords: nano-scaled martensite, nano-wedge, shape memory effect, TiNi alloys, phase transformation, DFT, dislocation-kinetic theory.
1 Introduction
One of the most challenging as well as fundamental limitations associated with condensed matter physics is to assess physical properties of different materials at the nano-scale. For instance, the quantum-dimensional effect, causing a change in the thermodynamic and kinetic properties of thin metallic films and nano-particles 1, 2, 3, 4, 5, 6, takes place in systems, where at least one of their dimensions is in the range of de Broglie wavelength. However, the problem is far deeper. Compared to phase transformations in massive systems such as bulk crystallines, size-dependent phase transitions developing in samples at the micro- and nano-level can play a significant role in their physicochemical nature and it’s understanding. For instance, the melting temperature of gold particles strongly depends on their size and environment 7, 8, 9, 10, 11, with their size reaching critical number 2.5 nm 12 at room temperature.
Not only liquid-to-solid but also solid-to-solid phase transformations involve dimensional changes. For example, it is essential for quasi-one-dimensional conductors with a charge density wave of cross sizes considerably lower than 1 where many properties are influenced by the size effect 13, 14. Among phase transformations in intermetallic compounds, thermoelastic martensitic transition from a cubic high-symmetry phase (austenite) to a low-symmetry phase (martensite) 15, 16, 17, 18 has attracted much interest these days. Here central to the entire discipline is the concept of shape memory effect (SME). SME is that a sample returning to its initial shape upon heating above the martensitic temperature as it been observed in some materials. SME finds presently a broader application in instrument-making, medicine, micro- and nano-mechanics 19, where micromechanical devices of smallest sizes have been fabricated and exploited successfully 20, 21, 22.
At present, a key issue in the field is the determination of physical and technological limits as to the minimum size of the device that can function based on SME. To iron out this obstacle, it is necessary to study the effect of thermoelastic martensitic transition in samples of submicron size and deformation of micro- and nano-size samples under the influence of temperature and external mechanical stresses. This can be rationalized to the problem of the critical size of a particle in which the martensitic transition occurs. And it is similar to the classical problem of determining the critical size of the nucleus in a first-order phase transition 23. Existing research on the nucleation of the martensitic phase recognises the important role of the grain size: if it decreases up to the nanometers size, the transition temperature of the alloy decrease in comparison with the bulk sample. With a further decrease in the grain size, the phase transition ceases 24, 25.
The critical role played by the particle size in the martensite properties is admitted likewise 26, 27, 28. In the work 29, it was shown that the B2 B19 thermoelastic martensitic transition arising in the Ti2NiCu nanoparticles is blocked at the minimum nanoparticle size 15 nm, while the non-thermoelastic martensitic transition occurring within the Fe-Ni-B nanoparticles is suppressed at the greater nanocrystals size of the 100 nm order. A proposed theoretical model consider the energetic dispute between the volume free energy of favourable phase and the surface energy and the corresponding size factor, in analogous to the theory of rubber-like behaviour in Cu-nanowires 30. This approach allowed to estimate a critical radius. However, attempts to calculate the temperature dependence of the critical radius or consider another geometry, for example, the emergence of a new phase in a flat film or on the edge of a wedge, never been made.
A similar effect of the transformation temperature decrease been observed at the boundary between the amorphous and crystalline regions 31. These akin to that occurs in nano-spherulites, where the martensitic transformations are suppressed. Nevertheless, the authors did not attempt to cool down the sample and study the martensitic transformations at lower temperatures. In the same time, a non-monotonic behaviour for the temperature dependence on the thickness been observed for B2-R-B19′ transformation in a wedge-shaped NiTi plate 32 where the important role plays the transition phase R. Whereupon another yet mechanism related to the surface oxidation been proposed for a NiTi alloy exhibiting complete suppression of the martensitic transformation 33. As can be seen from above the exact mechanism and its fundamental aspects that underpin transformation blocking are not fully understood. And, neither the actual limiting values for effects nor reliable theoretical explanations have been obtained yet. This study, therefore, set out to an experimental investigation into the thermoelastic martensitic transition in wedge-shaped plates of the Ti2NiCu alloy. Along with the experimental analysis, the second aim is to performer theoretical investigation with the use of an adequate physical model explaining experimental results for the thickness and temperature in the range of 10-100 nm and 100-400 K correspondently.
2 Results and Discussion.
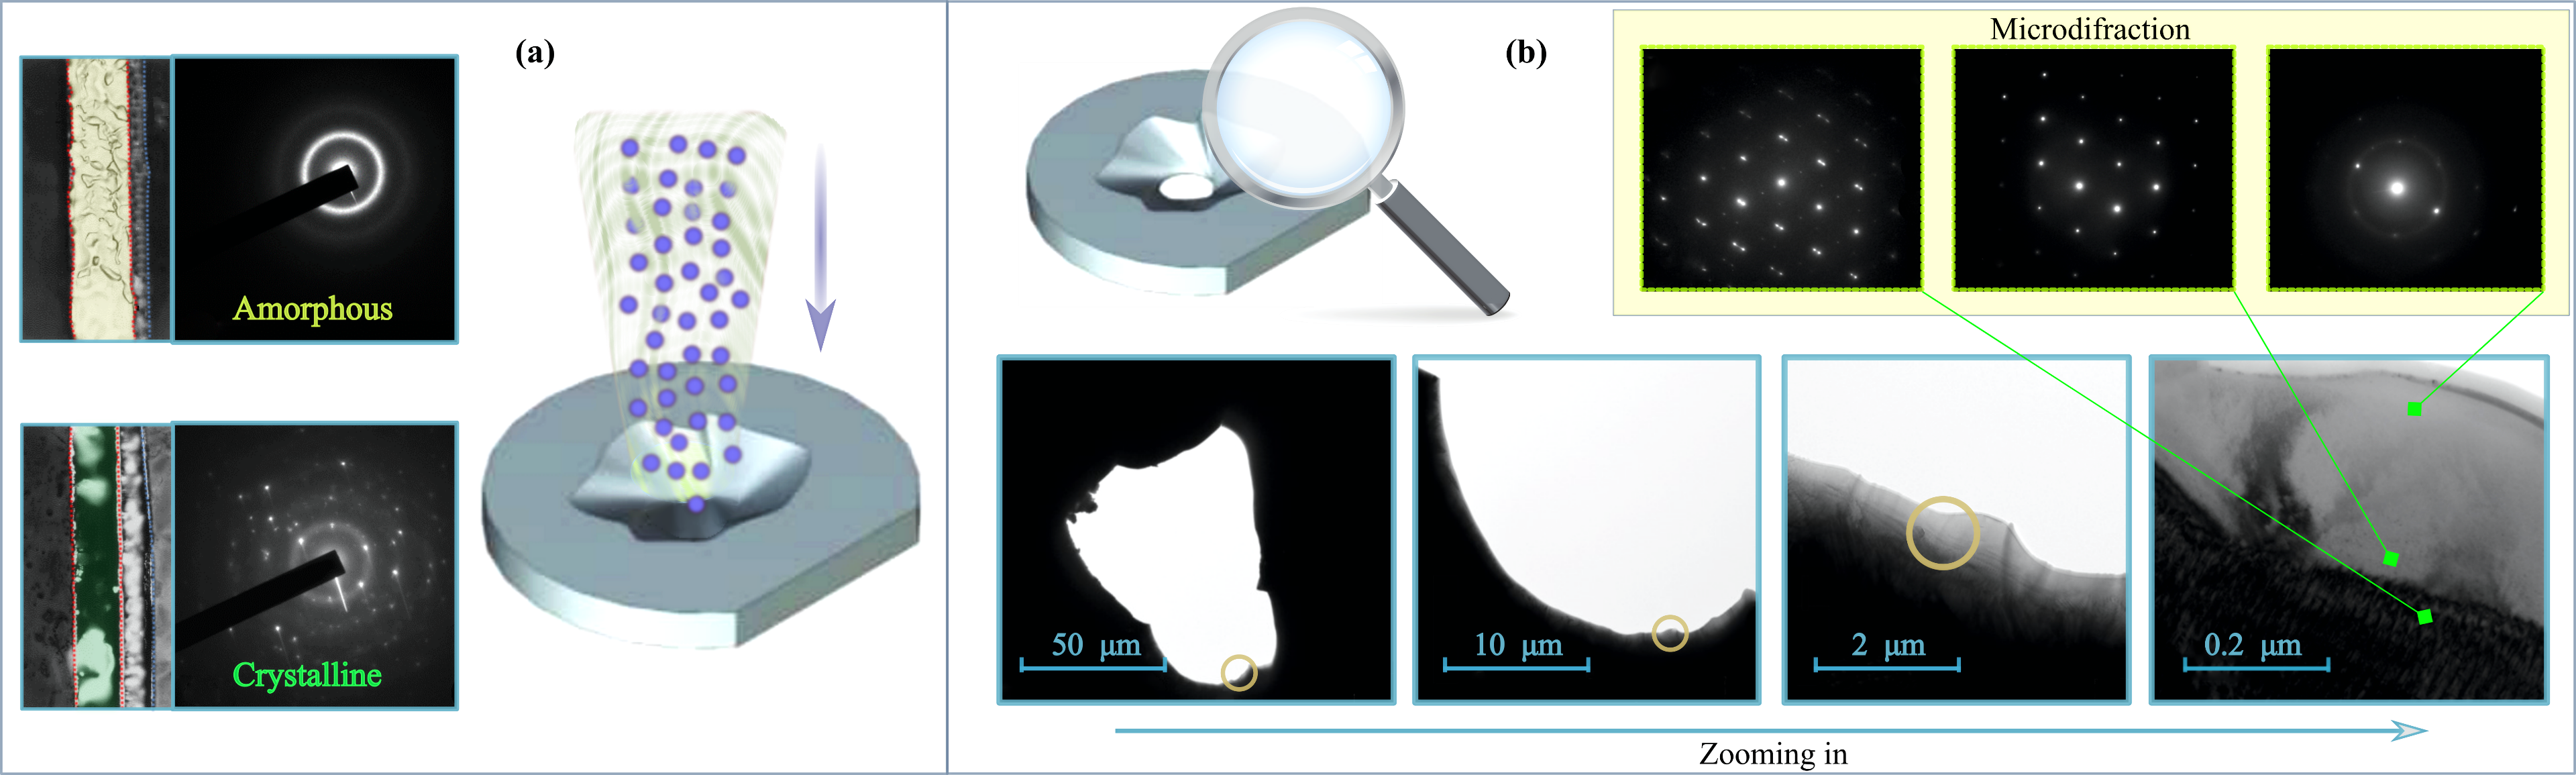
Initially, the Ti2NiCu alloy was produced in the form of an amorphous ribbon and examined with the use of TEM. After annealing it to the crystalline state, the alloy underwent a thermoelastic martensitic transition from the cubic austenitic phase with the B2 structure to the orthorhombic martensitic phase with the B19 structure (Fig. 1 (a)). Subsequently, a sample of rapidly quenched ribbon was thinned using the ion thinner by the focused ion beam method (FIBM) until a hole with wedge-shaped edges appeared. The next step was to use a high-resolution TEM along with thermal stabilizer, where we studied the crystal structure of individual local areas in the imaging and in diffraction mode. It has demonstrated the local region near the edge is precisely in the austenitic phase. Microdiffraction patterns unequivocally prove that part of the region near the plate edge is indeed austenitic, despite the fact that austenite in a bulk alloy sample disappears at temperatures well below K. Moreover, near the edge, the transition does not occur even at K. Since the reaction/transformation front movement stops even earlier, at K (Fig. 1 (b)).
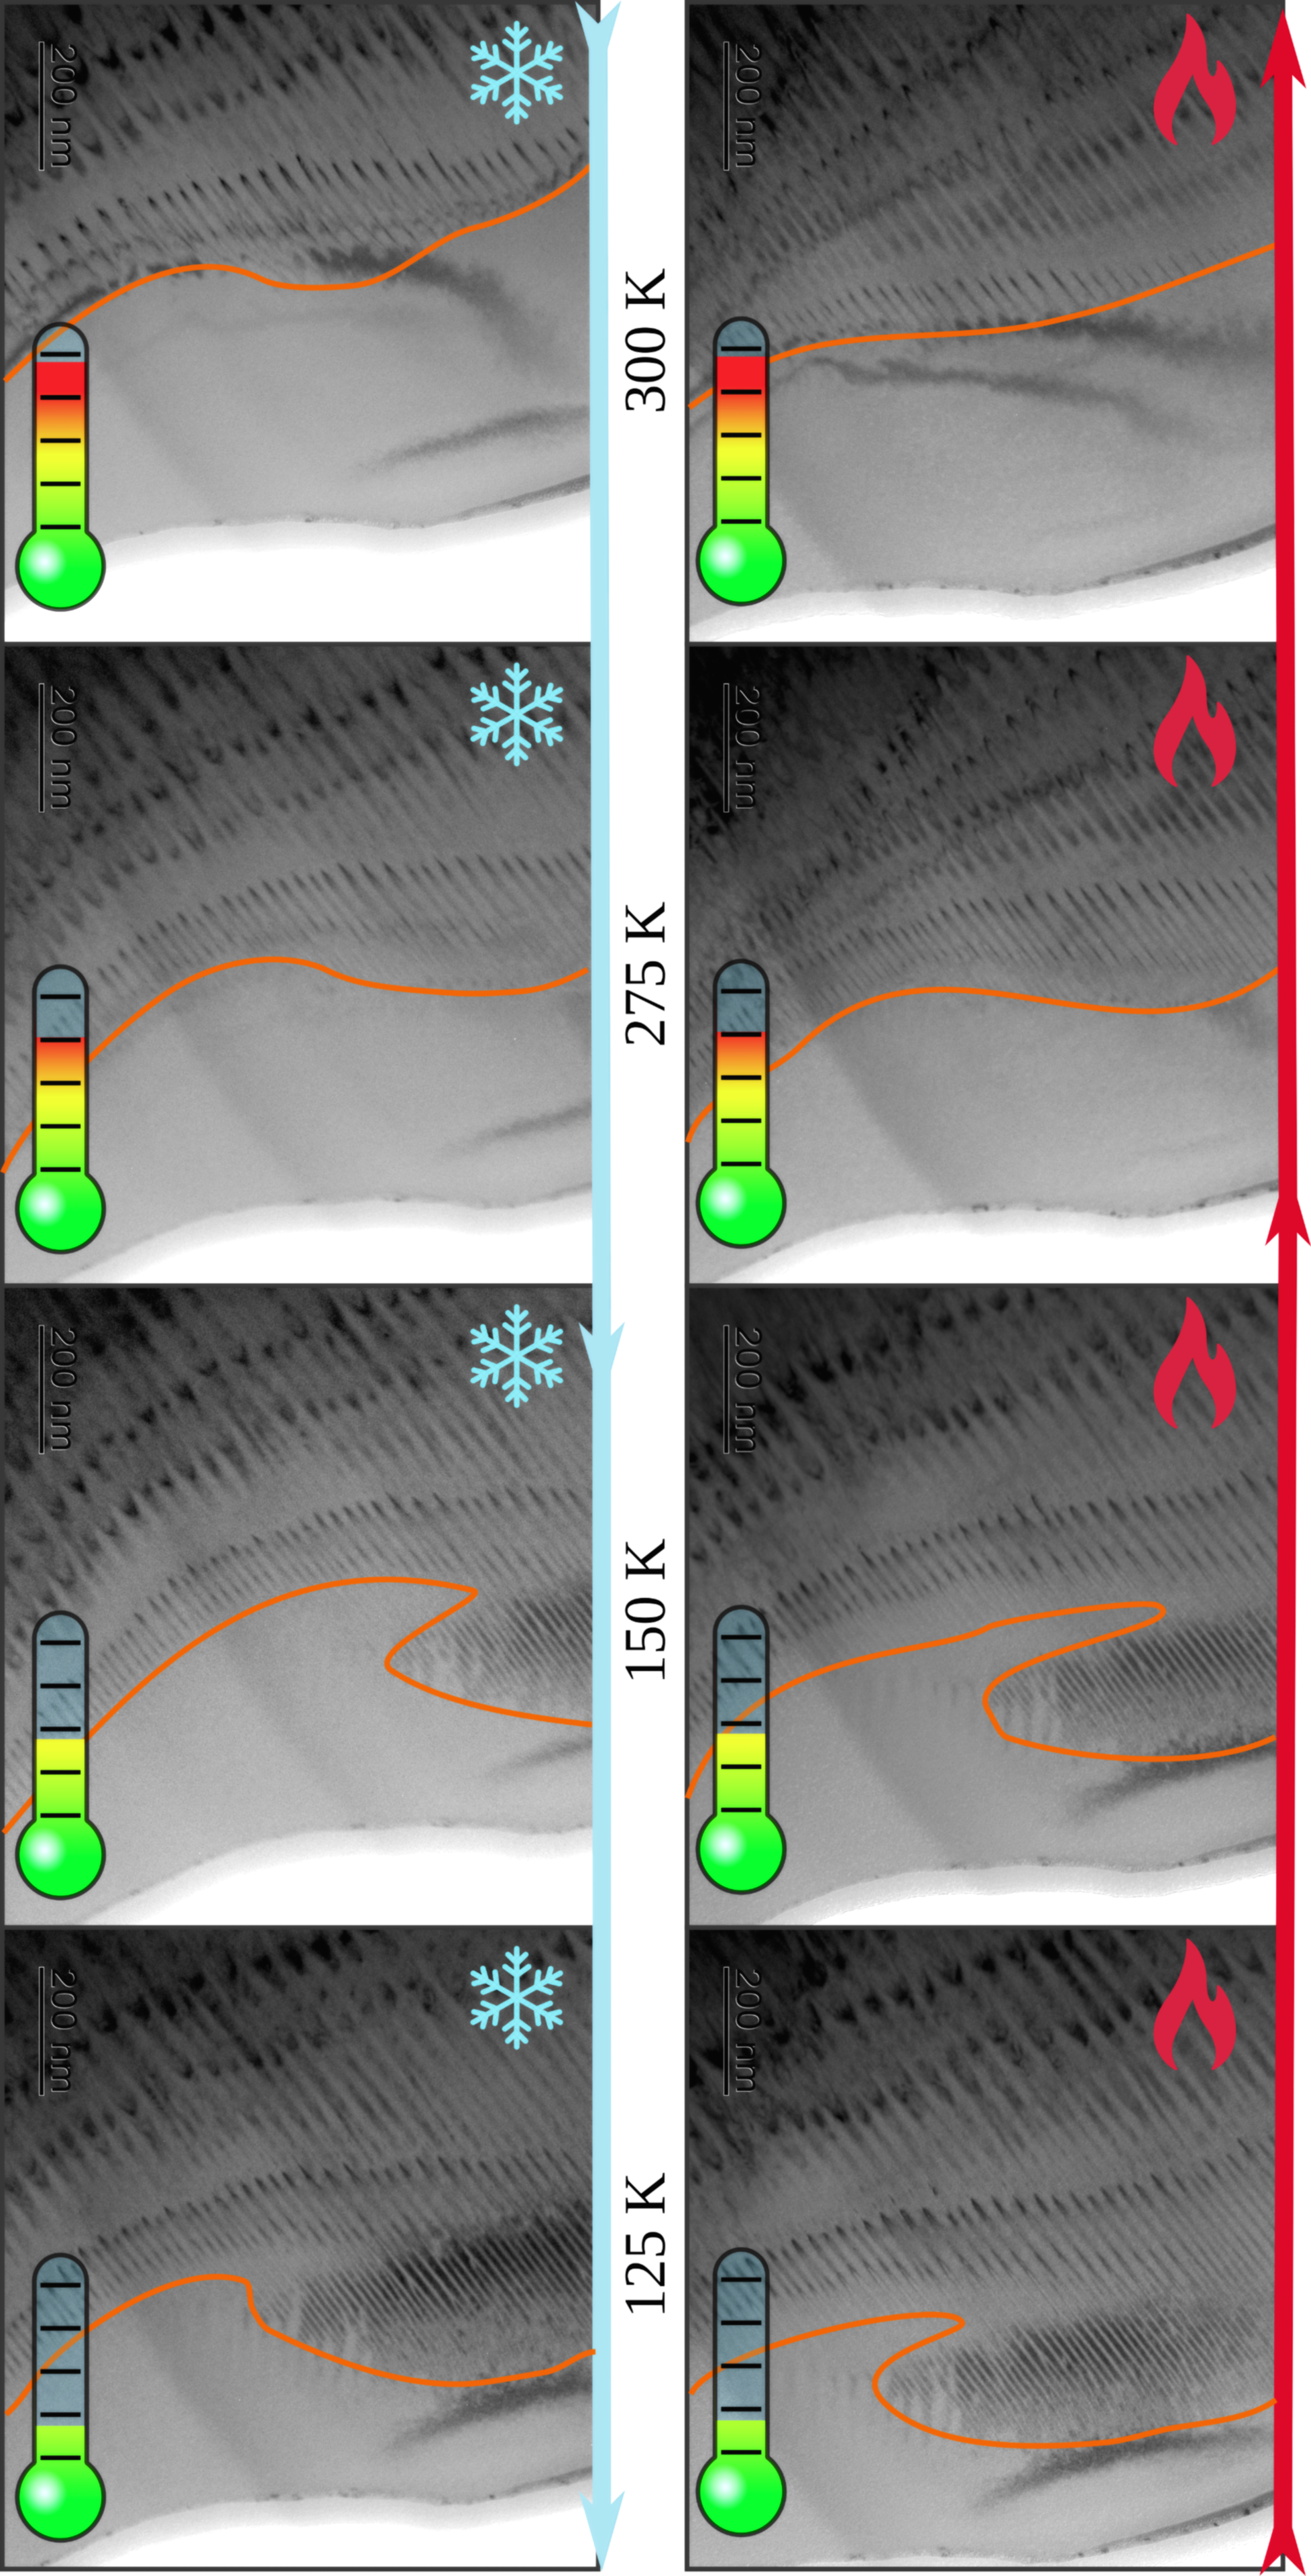
TEM images obtained in the imaging mode (see Fig. 2) allowed us to reveal the evolution of the regions, occupied by the martensitic and austenitic phases on the edge of the plate. Transition boundaries were clearly visible on all images, except the case of a bulk sample when it was filmed at the temperature above A K - no microtwins been observed due to the absence of the martensitic phase at high temperatures. Fig. 2 shows a set of microphotographs obtained from the same area that is closer to the edge of the sample using the TEM at different temperatures. Where the phase boundary is distinguishable by the characteristic pattern of twins in the martensitic phase. It clear that the boundary moves with decreasing temperature, approaching the edge, that is, closer to the region of the minimum thickness of the plate.
One can note that during the heating (see Fig. 2), the movement takes place at a higher temperature. And while the reaction front of the martensitic transition stops to move at K on the cooling, there is no propagation during the heating process up to the K. This pattern can be understood due to the fact that the first-order martensitic transition shows a hysteresis character. If the transformation has been reversed, i.e. when the sample been cooled the reaction front/boundary does not start to move immediately on the following heating. Front manoeuvres only after temperature reaching Af, where some overheating occur. From the energy point of view, this is necessary for the system in order to overcome the potential barrier - to achieve the stability loss of an unfavourable low-temperature martensitic phase.
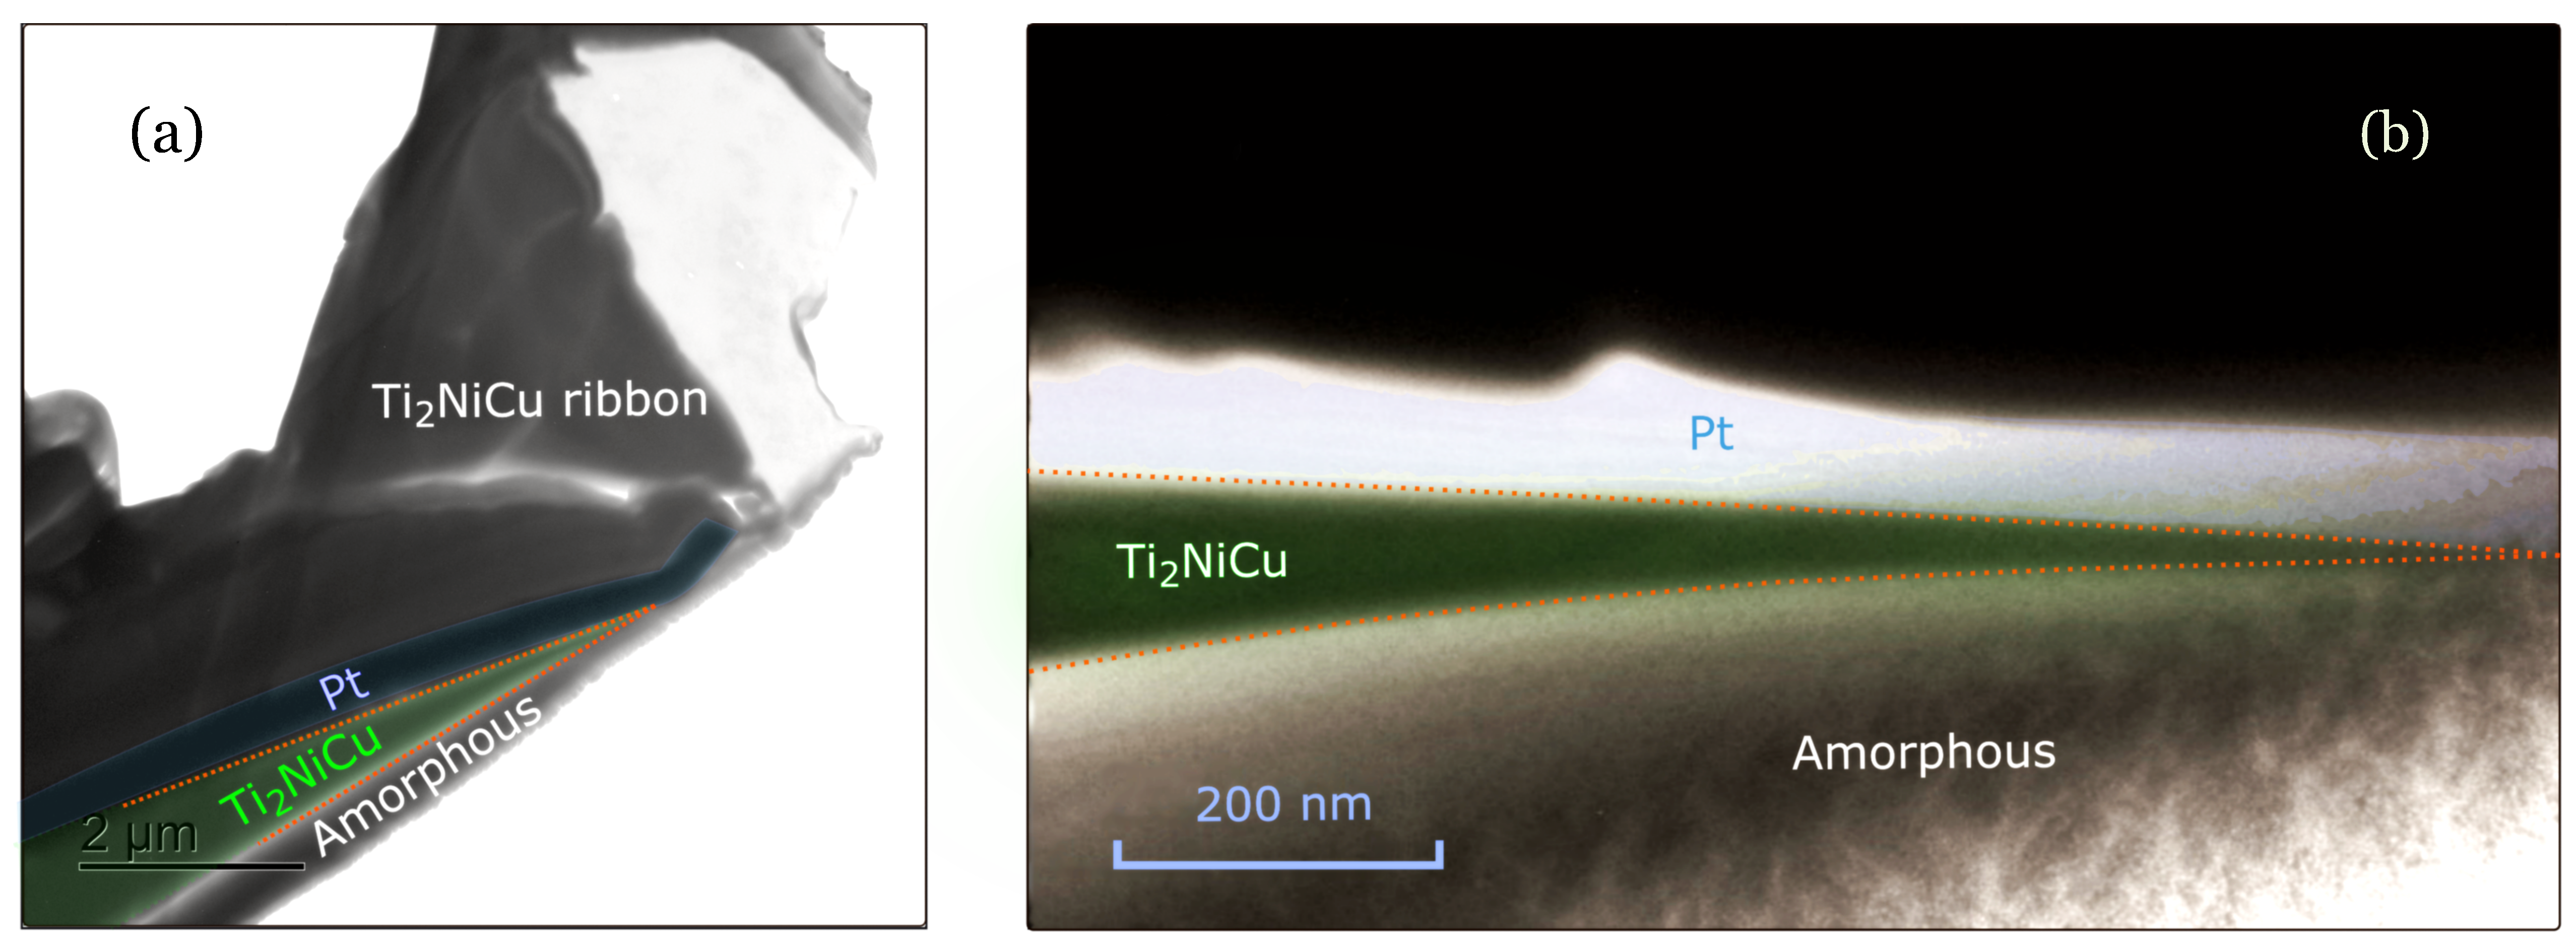
By means of the TEM measurements of the cross section in a sample, we have obtained the dependence of the plate thickness on the distance to the edge. Figure 3(a) illustrates the fabricated sample loaded into the transmission electron microscope (TEM) to examine its cross-section and to correlate the thickness of the wedge-shaped plate (Fig. 3(b)). Mobilizing the entire data set, we plotted the martensitic transformation temperature as the function of the plate thickness, as shown in Fig. 4. What can be clearly seen in this figure is the critical character of the transition temperature dependence. With a shrink in the thickness from the 80 nm down to the 20 nm, the transition temperature decreases down to the 150 K and then drops sharply. Further cooling does not provoke any expansion of the region of the martensitic phase and some part of the sample remains in the austenitic phase thereof. And hence it will not lead to the formation of a low-temperature phase in these areas.
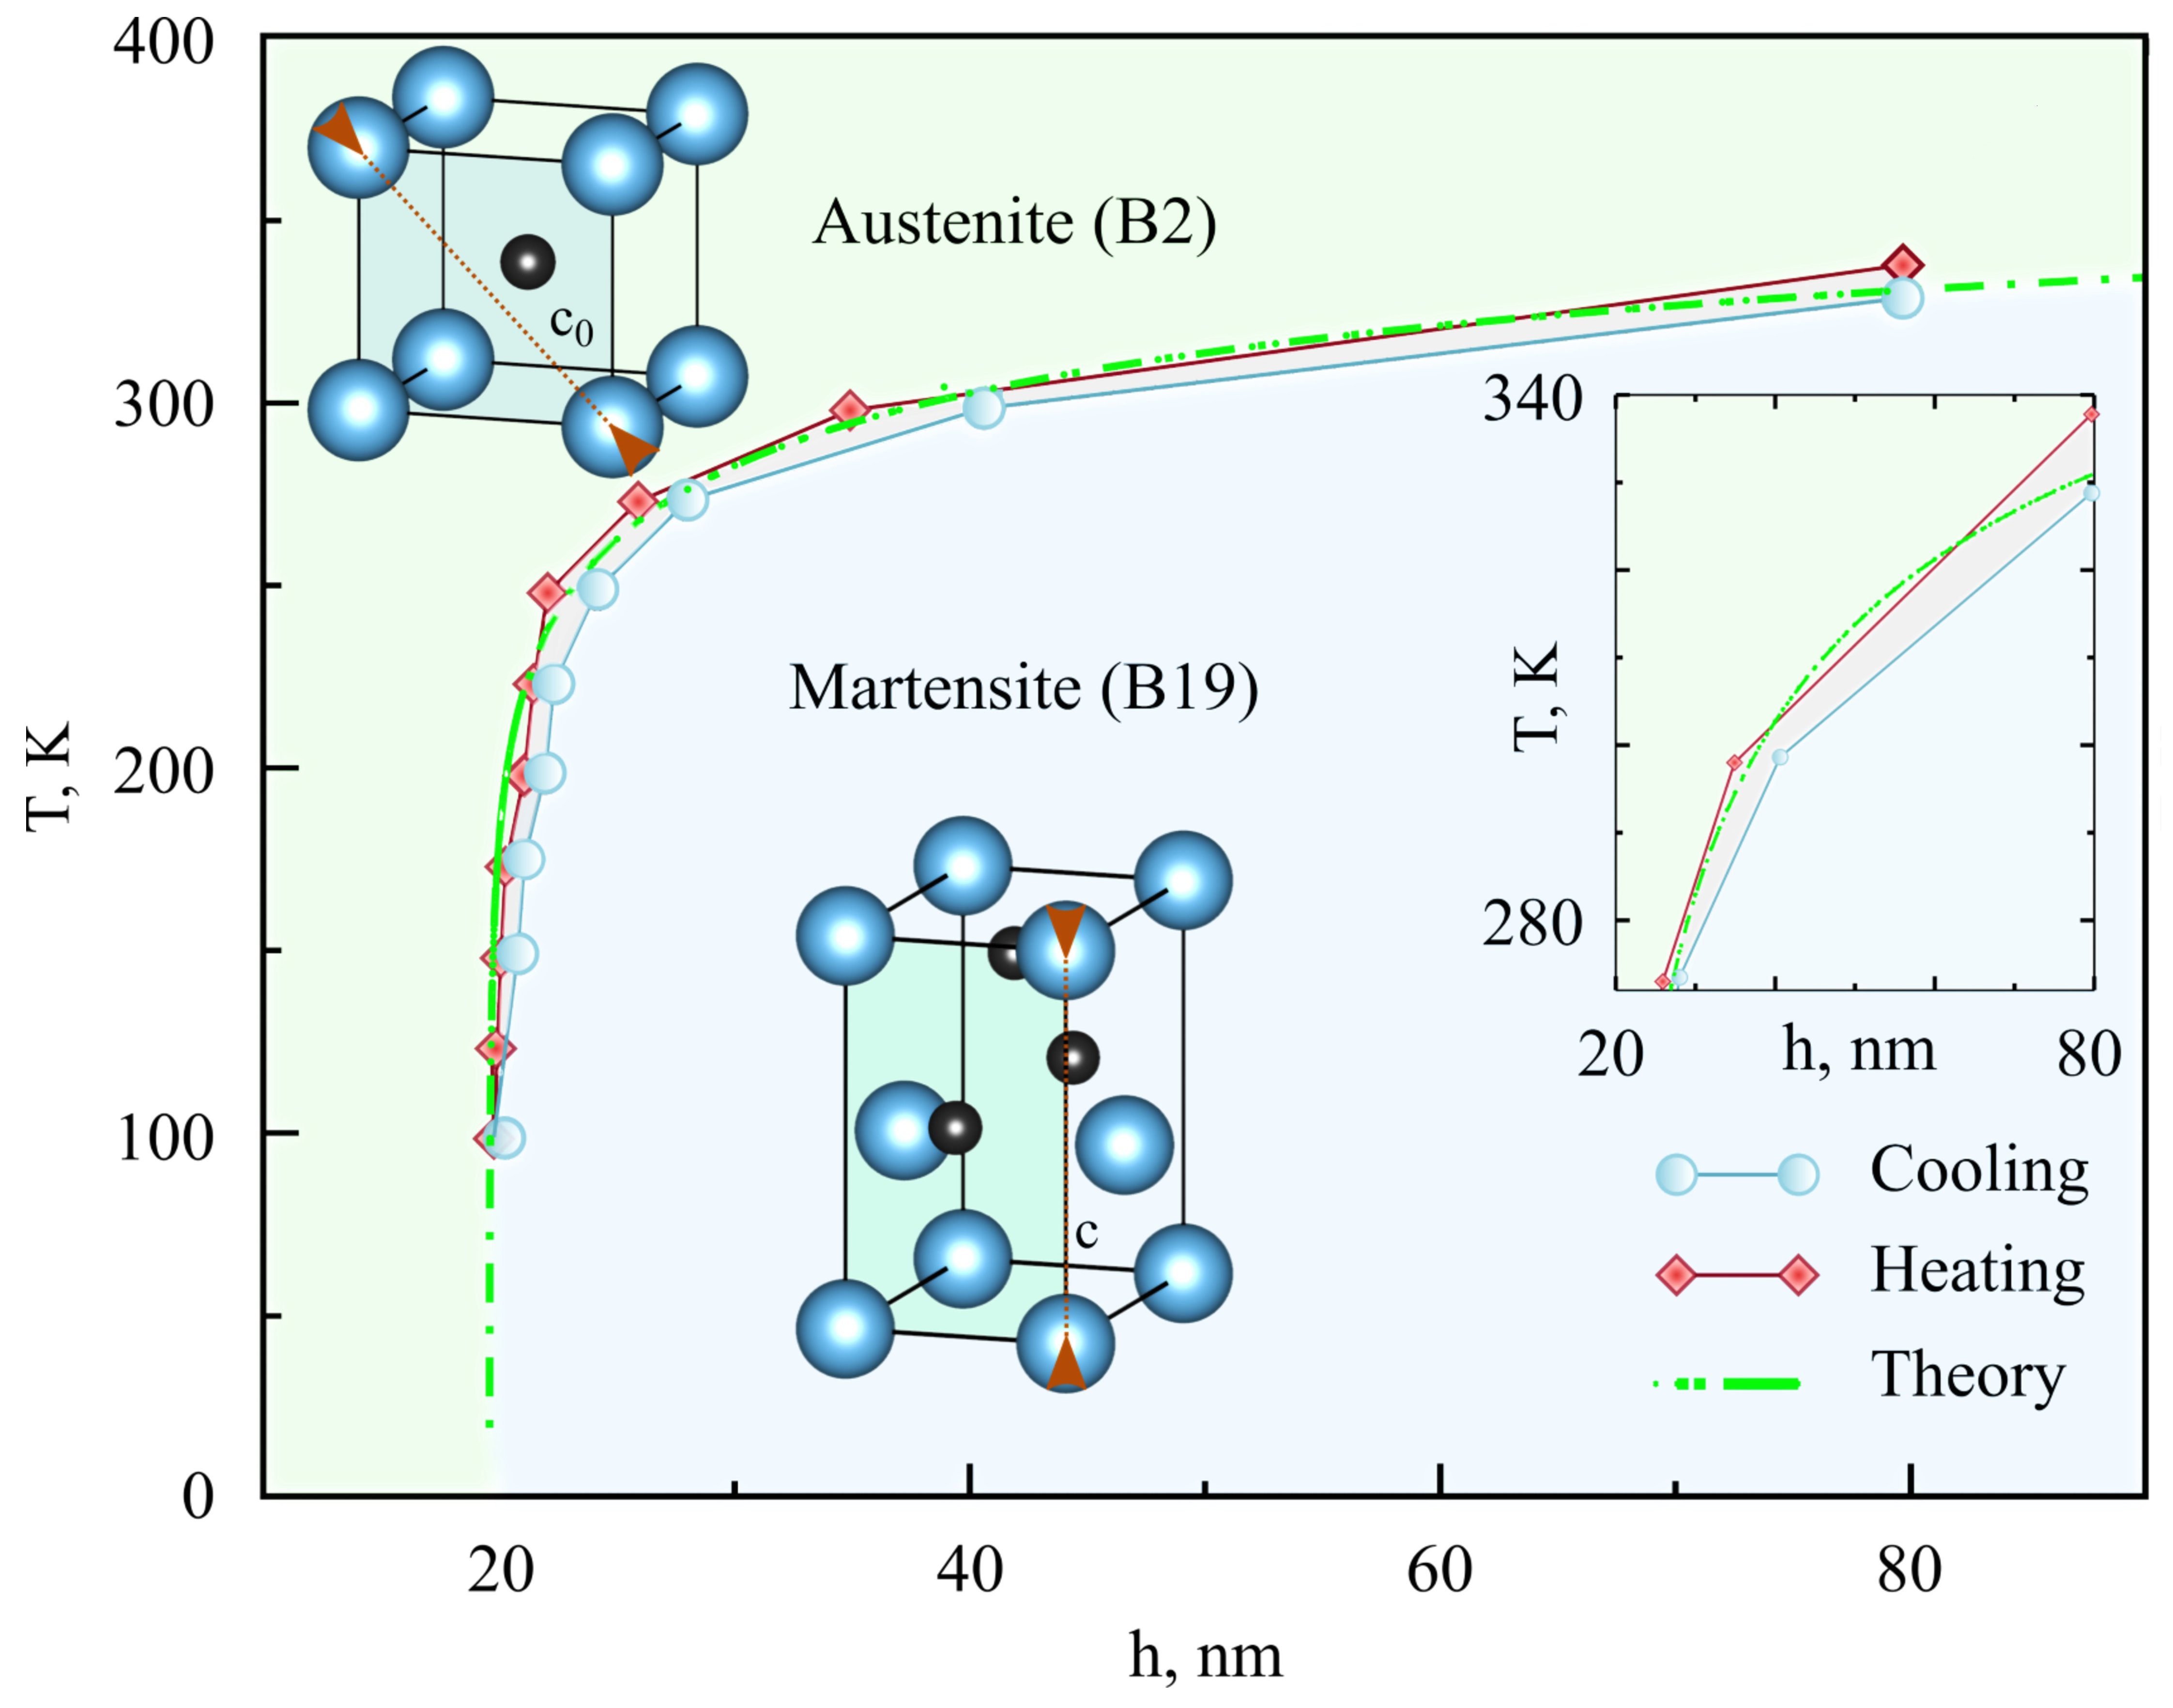
The most striking observation to emerge from the cooling and heating data comparison was a hysteresis. The same area on the edge of the sample, where austenite state been inhabited at room temperature, transforms to the martensite on cooling at a certain temperature . And proceeded by heating, it returns to the austenitic state at a bigger temperature . This hysteresis-like character obviously can be attributed to the intrinsic properties of the martensitic first-order phase transition and its nanoscale nature.
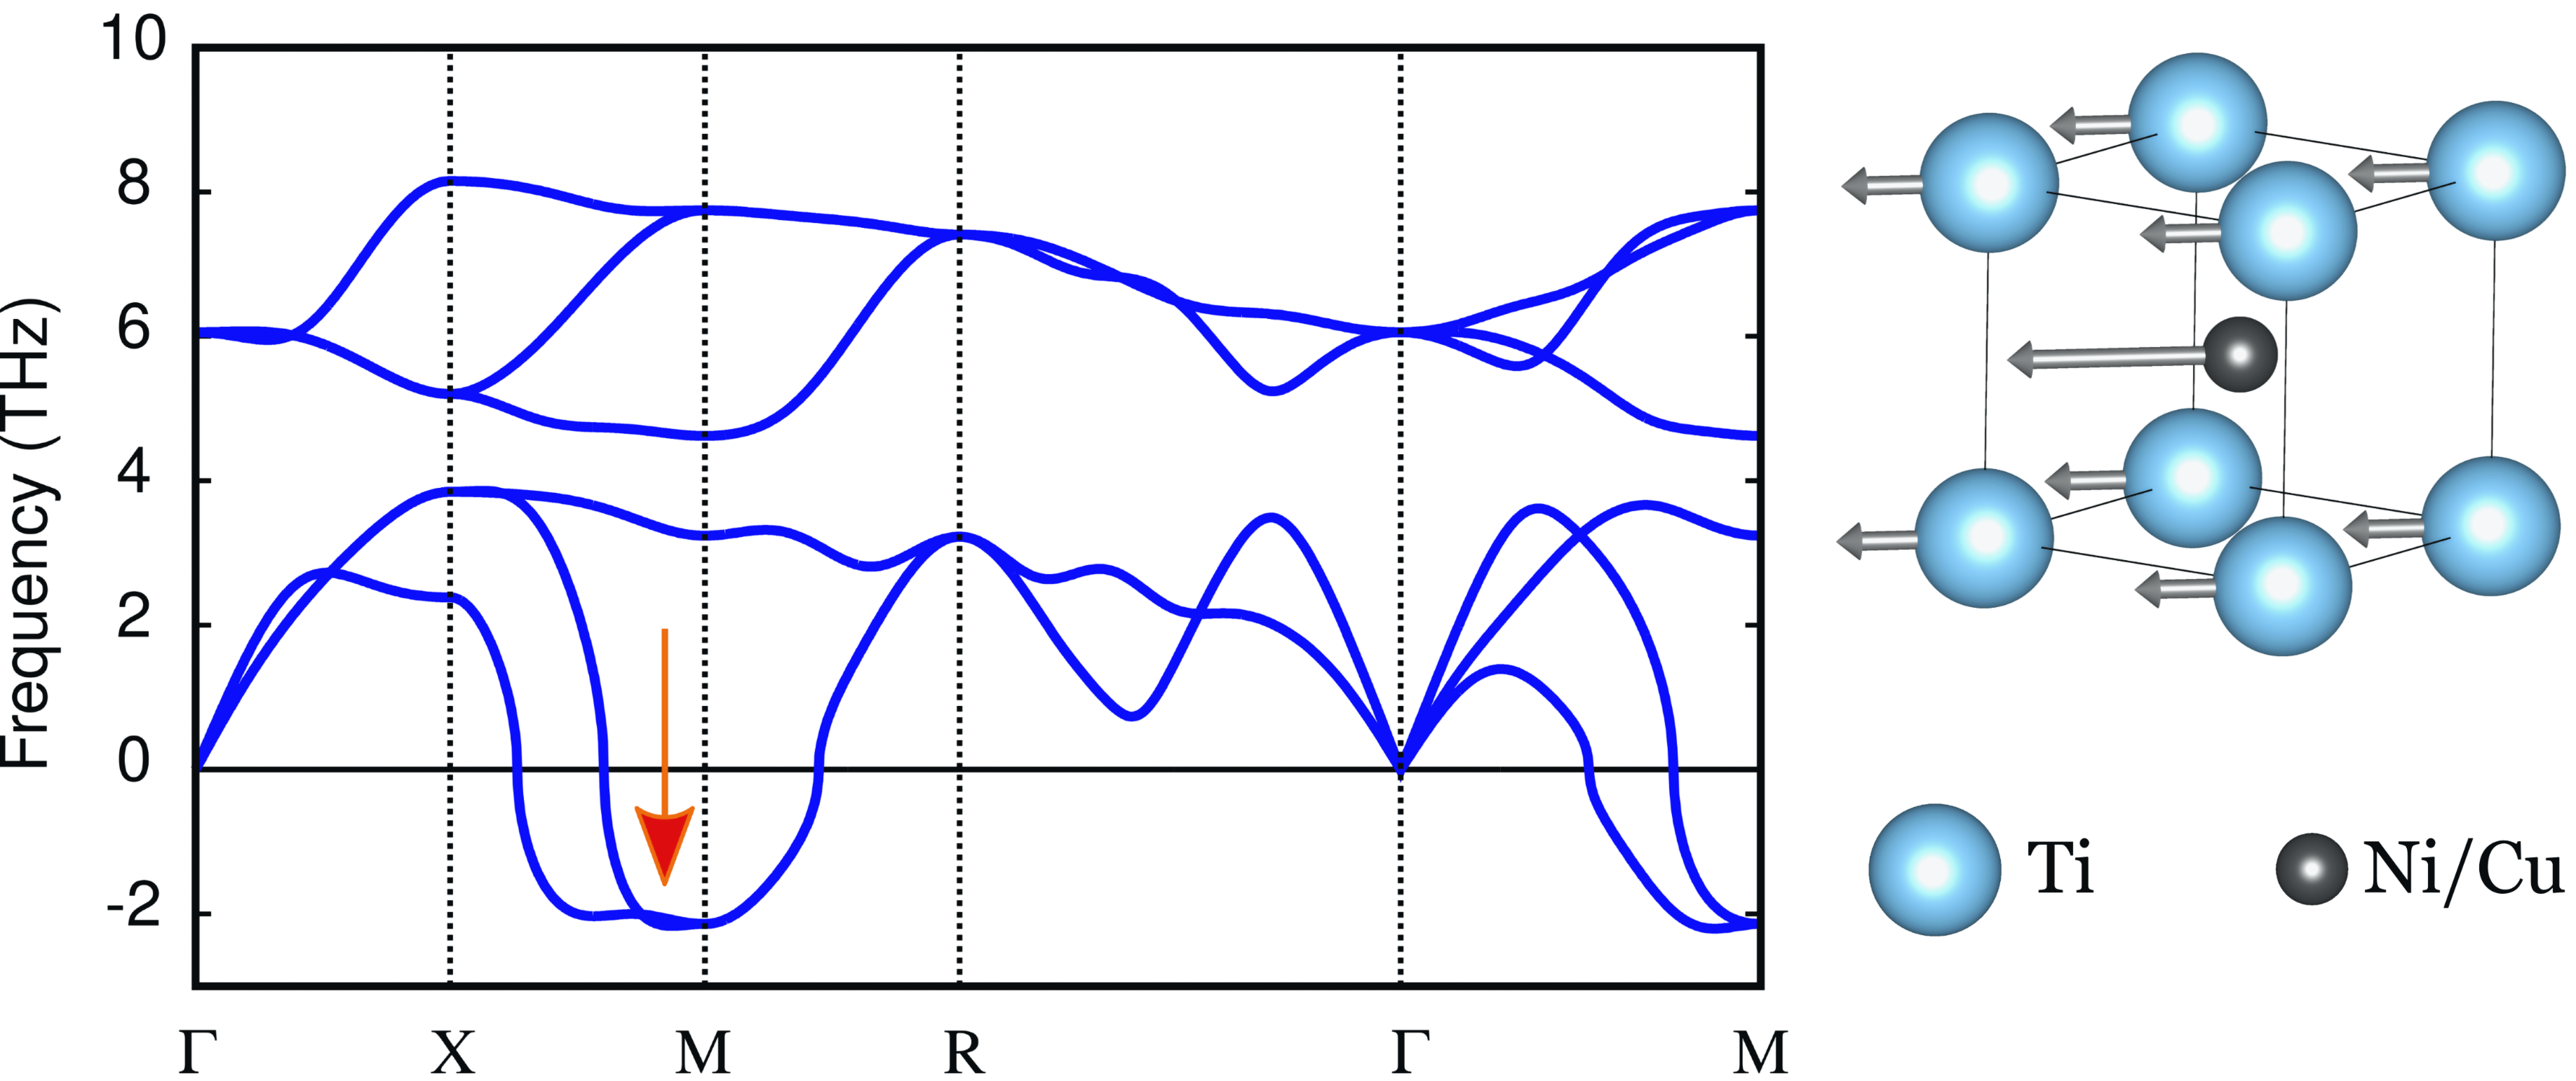
On the macroscopic level, this transition can be associated with the phonon softening during the martensitic transformation in the B2 phase 34. The phonon spectra at K of the Ti2NiCu austenitic phase been calculated using DFPT and shown on Fig. 5. The soft mode at the M point of the first Briliuon zone indicates the dynamic instability of the B2 phase. Where atomic displacements in the [110] direction correspond to martensitic transformation and define in-habit-plane {110} with a shear instability accompanied by the lattice distortion. The electronic nature of this softening originates from the to charge density wave instability related to nesting vectors in the Fermi surface. 35, 36, 37 (see supplement materials). It is obvious that phonon dispersion curves of the parent cubic phase contain information closely related to the potential martensite phases and related transformations. This is essential for the identifying of B2-B19 transformation in the Ti2NiCu system as the martensitic one. Where suppressing of the soft mode due to the finite size effect can lead to the metastable nature of austenite.
From the general thermodynamic point of view, the observed behaviour can be understood as a balance between different energetic impacts to the Gibbs energy. Consider the steady state of the system the following relation can be written 38 for the austenite to martensite transformation as a function of temperature and the sample thickness :
| (1) |
where is the free energies difference for bulk phases, the difference between surface energies and the is the energy consuming to create new interfaces such as the boundary between phases/coating and the coherent twin boundaries.
While in the bulk is the main driving force for martensitic transformation, in the low-scale system it is primarily counteracted by the and . We calculated the surface energies of Ti2NiCu with both cubic and orthorhombic structures. The calculated values bear witness that in the bulk Ti2NiCu martensite is more stable than the austenite at low temperatures. However, the Ni/Cu-terminated austenite Ti2NiCu is the most stable surface structures. Therefore at the low temperature limit and . While reflecting the fact that in bulk the austenite is the high temperature phase. The thicker plate likely facilitates the creation twin boundaries and interfaces with a small contacting area, which then be compensated by the transformation strain across the different variants in order maintain the structural integrity of the wedge 39, 40. With the decrease of , the surface energy will gain a major role and eventually may overcome leading to the austenite stabilization. While the opposite situation proceeds for the temperature decrease – increase and the martensite become more preferable. All the above arguments clearly indicate the importance of the interplay between surface and bulk energies in a wedge, where can be modulated via regulation and temperature regimes.
However, at the nano-scale, the finite-size effect is not visible for the heterogeneous thermodynamic treatment, hence it is deserved to describe the transformation blocking based on its microscopic nature. We applied another approach for the transformation description – the analysis of interfacial dislocation movements where finite size effects can emerge. Using the well-established kinetic theory of dislocation as a martensite formation mechanism we were able to reach an agreement with experimentally observed values (see Fig. 4), where defines by the following relation (see Appendices 3.3):
| (2) |
3 Methods
3.1 Sample and Experimental Details
For the present study the Ti2NiCu alloy was obtained in the amorphous state in the form of ribbons of 40 m thickness by ultrafast quenching of the molten alloy onto rotating copper drum 41. The amorphous alloy was annealed in a furnace at 500∘ C for 4-6 min. In the crystalline state, the alloy undergoes a thermoelastic martensitic transition from the cubic austenitic phase with a B2 structure to the orthorhombic martensitic phase with a B19 structure. The temperatures for the start and finish for the forward and reverse martensitic transitions of the samples used in this work are, respectively: Ms = 60∘ C, = 52∘ C, A 55∘ C, and Af = 64∘ C.
In the process of preparing the samples for the experiments, the samples of rapidly quenched ribbon were initially thinned using a GATAN Model 691 ion thinner (JEOL, Japan) until a hole with wedge-shaped edges appeared. Then, using a high-resolution TEM JEM-2100 (JEOL, Japan) with a GATAN thermal stabilizer, we studied the crystal structure of individual local areas in the imaging and in diffraction mode in the temperature range of 100-400 K. Images obtained using the TEM in the imaging mode allow us to reveal the evolution of the regions, occupied by the martensitic and austenitic phases, on the edge of the plate. The phase boundary is distinguishable by the characteristic pattern of twins in the martensitic phase. The current density on the sample was applies in a control way. Where under these experimental conditions, it did not exceed 1 mA/cm2, which can lead to a negligible small increase in the temperature of the sample ().
To determine the thickness of the wedge-shaped plate in the TEM study areas, a cross section of the sample was made using the focused ion beam (FIB) method. To prevent the destruction of the surface by an ion beam, the sample was initially coated with a protective film of platinum of 400 nm thickness. The sample obtained was loaded into the TEM to examine its cross-section and to correlate the thickness of the wedge-shaped plate to the distance to the edge. The structural conclusions of the results obtained from TEM were confirmed by microdiffraction patterns in local regions of a sample. Additionally, in order to verify observed numbers the thickness measurement been performed by employing the electron energy loss spectroscopy (EELS) where obtained results were in the correspondence with TEM measurements.
3.2 Computational details
The geometry optimization, total energies and electronic structures calculation were performed using the Vienna ab initio simulation package (VASP) under the framework of density-functional theory (DFT) 42, 43. The projector-augmented wave (PAW) method 44 was used for the electron-ion interactions and the generalized gradient approximation (GGA) of Perdew, Burke and Ernzerhof (GGA-PBE) 45 was employed to describe the exchange-correlation function. A cutoff energy of 500 eV was used and the irreducible Brillouin zone was sampled with a regular Monkhorst-Pack grid 46 of 5 5 5 and 4 5 5 k-points for the total energy calculation of bulk cubic and orthorhombic Ti2NiCu respectively, and 4 4 1 and 5 5 1 k-points for the surface calculation of cubic and orthorhombic Ti2NiCu, respectively. For the surface calculations, a vacuum region of 10 Å was added to avoid the unwanted interaction between slabs and its period images. All atoms were fully relaxed until the magnitude of forces on each atom converged to less than 0.05 eV/Å.
For the surface calculation in the framework of the super-cell method for cubic Ti2NiCu, two types of (001)-oriented surfaces are considered where occurs the most atomic rearrangement during the martensitic transformation. That are NiCu and Ti terminations. For the surface calculation of orthorhombic Ti2NiCu, we considered four types of (001) direction termination surfaces, i.e., NiCu-1, NiCu-2, Ti-1 and Ti-2 for Ti2NiCu (Supplementary Fig. 1). To ensure that the two sides of the surface slabs used in the calculation are thick enough to exhibit bulk-like interiors, we made calculations of the surface energy with respect to sufficiently thick slabs and then performed full surface relaxations. Surface energies of the Ti2NiCu under the condition that the chemical potential of the respective element equals its bulk total energy can be read as follows:
| (3) |
where and indicate total energies of a slab and X bulk, and NY and A represent the number of Y (Y = Ti, Ni, Cu) atoms and surface area, respectively. Using Eq. (3).
Finally, we also investigated the role of alloying by using the virtual crystal approximation (VCA) in the frame of a computational implementation of the density-functional theory (DFT) package Quantum Espresso 47. The ground states calculations were performed using ultrasoft pseudopotential approach and the Perdew-Burke-Ernzerhof (PBE) generalized gradient approximation 48 of the exchange and correlation functional where the scalar relativistic corrections were included. We have employed a 600 eV energy cut-off and a 60 eV wave functions cut-off to optimize the ground state. The for a single unit cell and for the supercells calculations Monkhorst and Pack -point meshes 46 were used for integration in the irreducible Brillouin zone by a special-points technique with broadening Ry according to the Marzari-Vanderbilt cold smearing method 49. Thus, these meshes ensure convergence of total energy to less than eV/atom. The enthalpies difference and optimised lattice parameters as a function of hydrostatic pressure have been calculated with the use of variable cell-shape relaxation method. Alloy vibrational properties are determined with the density-functional perturbation theory (DFPT), with vibrational spectra and the corresponding normal modes obtained from the first-principle interatomic force constants by using -meshes in the first Brillouin zones within frequency convergence less than 0.5 cm-1. Calculated equilibrium lattice parameters for Ti2NiCu are 3.05 Å for B2 phase, and Å, Å, Å for B19 phase correspondingly. And they are in the good agreement with experimental values 50, 51, 52 and previous theoretical estimations 53, 54.
3.3 Dislocation-kinetic approach
For the further discussion, a method similar to that proposed in the Ref. 55, namely, the kinetic approach to the formation of martensitic structures is considered, i.e. the process of self-organization of nucleus volumes of transformation. The transformation is carried out due to the movement of the dislocation transformations in the form of martensitic steps of atomic sizes at the interphase boundaries. In the theory of martensitic transitions, in early works, the following relations for the volume fractions of martensitic () and austenitic () phases were established:
| (4) | |||
| (5) |
where , – is the nucleus volume of transformation, T – correspond to the temperature, - is the change in internal energy per unit volume of a crystal during a structural transition, which can be determined by the following ratio:
| (6) |
where q – transition heat, - spontaneous shear deformation of the lattice associated with the transformation, shear stress at uniaxial crystal loading, k – Boltzmann constant.
On the other hand, based on the mean free path for dislocation involved in the transformation, we can write the kinetic equation for the relative proportion of martensite as the following phenomenological expression:
| (7) |
where – characteristic time, is the generation intensity of sources at finite temperature, – dislocation speed, - martensitic step height, bulk density of sources of transformation dislocations, - are characteristic distances, respectively, for the annihilation of martensitic and austenitic steps, multiplication of dislocations and diffusion of dislocations during their interaction with lattice defects, x – coordinate in the direction perpendicular to the plane of the boundary of the two phases.
Since we assume that the temperature changes adiabatically, the main interest for us is the analysis of static (solutions of the kinetic equation. The analysis of this solution was done by Malygin in details 55, 56. This paper aims to establish relationships between the coefficients for determining the critical temperature. As a consequence, it is possible to establish the dependence of temperature on the size of the grain and the thickness of the layer:
| (8) |
where the phase transition smearing defined by and is the Boltzmann constant.
In our work we consider a different approximation that the thickness of the plate is much smaller than the size of the grain, as a result of which we can neglect the member in brackets:
| (9) |
Thus, it turns out that the nucleus volume of the transformation per unit dislocation length is , where – lattice parameter. The boundary of the wedge are barriers to the dislocation of the transformation and at small sizes limits the length of their free path . The corresponding values of parameters critical temperature in the free bulk K, , , the nucleus volume of transformation nm3 and have been chosen to fit the curve to the experimentally observed values. Where the T=0 limit defines the minimal possible transverse size nm. This value well agrees with the geometrical estimation of the smallest possible martensitic block size which is based on the coherency principle to the parent B2 phase (see supplement materials). The obtained value of the standard enthalpy of martensite formation J/kg complies with estimated values 5.3-6.0 J/kg of martensitic formation energy calculated by two different methods in the frame of DFT. Such a reconciliation of quantities indicates the reliability of this approach.
4 Conclusion
We performed a versatile investigated the crystal structures in the local areas of the wedge-shaped plates of the Ti2NiCu alloy in the thickness range of 10-100 nm in the temperature range of 100-400K, where martensite phase been detected at the room temperature for plates thickness more than 80 nm. We also observed that the austenite phase proliferates with a decrease in temperature while the transition temperature decreases with decreasing plate thickness and has a hysteretic character. At a temperature of 150 K and a thickness of 20 nm, a critical point been identified, where the martensitic transformation is completely blocked. Aforementioned behaviour is found to be in good agreement with theoretical macroscopical and thermodynamic concepts. The approach based on a size-control paves a new way of the shape memory effect modulation at nano-scale and fine tuning work parameters of nanodevices. It will likely enable a broad variety of micromechanical machinery in the nanomechanics and nanotechnologies based on Ti2NiCu alloy.
5 Supplement material
Computational details of surface and bulk total energies calculations for Ti2NiCu and TiNi alloys.
Model for Laplace pressure as a driving force for martensitic transition in a cone-shape nano-rode.
Fermi surface for austenic phase and corresponding nesting vectors.
Parasitic heating of sample in the TEM during measurements.
Details on the surface energy calculations based on the super-cell approach.
6 Acknowledgements
The experimental part of this study was performed under support of the RSF grant No. 17-19-01748. The theoretical part was funded by the support of the RFBR grant No. 18-29-11051. We are grateful to the UK Materials and Molecular Modelling Hub for computational resources, which is partially funded by EPSRC (EP/P020194/1), and the Shared Facility Center resources "Data Center of FEB RAS" (Khabarovsk) 57 where the high-performance computing and data processing was performed under support of the RFBR grant No. 18-29-11051.
References
- Wei and Chou 2002 Wei, C. M.; Chou, M. Y. Phys. Rev. B 2002, 66, 233408
- Avouris and Lyo 1994 Avouris, P.; Lyo, I.-W. Science 1994, 264, 942–945
- Halperin 1986 Halperin, W. P. Rev. Mod. Phys. 1986, 58, 533–606
- Feibelman 1983 Feibelman, P. J. Phys. Rev. B 1983, 27, 1991–1996
- Yousefi Sarraf et al. 2019 Yousefi Sarraf, S.; Singh, S.; Garcia-Castro, A. C.; Trappen, R.; Mottaghi, N.; Cabrera, G. B.; Huang, C.-Y.; Kumari, S.; Bhandari, G.; Bristow, A. D.; Romero, A. H.; Holcomb, M. B. ACS Nano 2019, 13, 3457–3465, PMID: 30807694
- Luo et al. 2018 Luo, Z.; Tian, J.; Huang, S.; Srinivasan, M.; Maassen, J.; Chen, Y. P.; Xu, X. ACS Nano 2018, 12, 1120–1127, PMID: 29361229
- Shim et al. 2002 Shim, J.-H.; Lee, B.-J.; Cho, Y. W. Surface science 2002, 512, 262–268
- Mejia-Rosales et al. 2006 Mejia-Rosales, S. J.; Fernandez-Navarro, C.; Perez-Tijerina, E.; Montejano-Carrizales, J. M.; Jose-Yacaman, M. The journal of physical chemistry B 2006, 110, 12884–12889
- Safaei et al. 2008 Safaei, A.; Shandiz, M. A.; Sanjabi, S.; Barber, Z. The Journal of Physical Chemistry C 2008, 112, 99–105
- Richardson et al. 2006 Richardson, H. H.; Hickman, Z. N.; Govorov, A. O.; Thomas, A. C.; Zhang, W.; Kordesch, M. E. Nano Letters 2006, 6, 783–788, PMID: 16608284
- Kuhlicke et al. 2013 Kuhlicke, A.; Schietinger, S.; Matyssek, C.; Busch, K.; Benson, O. Nano Letters 2013, 13, 2041–2046, PMID: 23627496
- Buffat and Borel 1976 Buffat, P.; Borel, J. P. Physical review A 1976, 13, 2287
- Zaitsev-Zotov 2004 Zaitsev-Zotov, S. V. Physics-Uspekhi 2004, 47, 533
- Zybtsev et al. 2010 Zybtsev, S.; Pokrovskii, V. Y.; Zaitsev-Zotov, S. Nature communications 2010, 1, 85
- Kurdyumov and Khandros 1949 Kurdyumov, G.; Khandros, L. On the thermoelastic equilibrium on martensitic transformations. Dokl. Akad. Nauk SSSR. 1949; pp 211–214
- Oikawa et al. 2002 Oikawa, K.; Ota, T.; Ohmori, T.; Tanaka, Y.; Morito, H.; Fujita, A.; Kainuma, R.; Fukamichi, K.; Ishida, K. Applied Physics Letters 2002, 81, 5201–5203
- Kainuma et al. 2006 Kainuma, R.; Imano, Y.; Ito, W.; Morito, H.; Sutou, Y.; Oikawa, K.; Fujita, A.; Ishida, K.; Okamoto, S.; Kitakami, O.; Kanomata, T. Applied Physics Letters 2006, 88, 192513
- Liu et al. 2003 Liu, Z.; Zhang, M.; Cui, Y.; Zhou, Y.; Wang, W.; Wu, G.; Zhang, X.; Xiao, G. Applied Physics Letters 2003, 82, 424–426
- Fu et al. 2004 Fu, Y.; Du, H.; Huang, W.; Zhang, S.; Hu, M. Sensors and Actuators A: Physical 2004, 112, 395–408
- Irzhak et al. 2010 Irzhak, A. V.; Kalashnikov, V. S.; Koledov, V. V.; Kuchin, D. S.; Lebedev, G. A.; Lega, P. V.; Pikhtin, N. A.; Tarasov, I. S.; Shavrov, V. G.; Shelyakov, A. V. Technical Physics Letters 2010, 36, 329–332
- Kuchin et al. 2017 Kuchin, D. S.; Lega, P. V.; Orlov, A. P.; Koledov, V. V.; Irzhak, A. V. The smallest and the fastest shape memory alloy actuator for micro- and nanorobotics. 2017 International Conference on Manipulation, Automation and Robotics at Small Scales (MARSS). 2017; pp 1–4
- von Gratowski et al. 2018 von Gratowski, S.; Koledov, V.; Shavrov, V.; Petrenko, S.; Irzhak, A.; Shelyakov, A.; Jede, R. Advanced System for Nanofabrication and Nanomanipulation Based on Shape Memory Alloy. Frontiers in Materials Processing, Applications, Research and Technology. Singapore, 2018; pp 135–154
- Landau and Lifshitz 1980 Landau, L.; Lifshitz, E. Publisher: Butterworth-Heinemann 1980, 3
- Kajiwara et al. 1991 Kajiwara, S.; Ohno, S.; Honma, K. Philosophical Magazine A 1991, 63, 625–644
- Kexel et al. 2015 Kexel, C.; Schramm, S.; Solov’yov, A. V. The European Physical Journal B 2015, 88, 221
- Waitz et al. 2008 Waitz, T.; Antretter, T.; Fischer, F. D.; Karnthaler, H. P. Materials Science and Technology 2008, 24, 934–940
- Morito et al. 2006 Morito, S.; Yoshida, H.; Maki, T.; Huang, X. Materials Science and Engineering: A 2006, 438-440, 237 – 240, Proceedings of the International Conference on Martensitic Transformations
- Dunand and Müllner 2011 Dunand, D. C.; Müllner, P. Advanced Materials 2011, 23, 216–232
- Glezer et al. 2003 Glezer, A.; Blinova, E.; Pozdnyakov, V.; Shelyakov, A. Journal of Nanoparticle Research 2003, 5, 551–560
- Liang et al. 2005 Liang, W.; Zhou, M.; Ke, F. Nano Letters 2005, 5, 2039–2043, PMID: 16218734
- Santamarta and Schryvers 2004 Santamarta, R.; Schryvers, D. Scripta materialia 2004, 50, 1423–1427
- Pan et al. 2014 Pan, G.; Cao, Z.; Wei, M.; Shi, J.; Xu, L.; Meng, X. Materials Letters 2014, 130, 285–288
- Li et al. 2014 Li, H.; Mao, S.; Zang, K.; Liu, Y.; Guo, Z.; Wang, S.; Zhang, Y.; Yin, X. Journal of Alloys and Compounds 2014, 588, 337 – 342
- Otsuka and Ren 2005 Otsuka, K.; Ren, X. Progress in Materials Science 2005, 50, 511 – 678
- Shabalovskaya 1985 Shabalovskaya, S. physica status solidi (b) 1985, 132, 327–344
- Papaconstantopoulos et al. 1982 Papaconstantopoulos, D.; Kamm, G.; Poulopoulos, P. Solid State Communications 1982, 41, 93–96
- Shiotani et al. 2004 Shiotani, N.; Matsumoto, I.; Kawata, H.; Katsuyama, J.; Mizuno, M.; Araki, H.; Shirai, Y. Journal of the Physical Society of Japan 2004, 73, 1627–1630
- Chevalier et al. 2009 Chevalier, J.; Gremillard, L.; Virkar, A. V.; Clarke, D. R. Journal of the American Ceramic Society 2009, 92, 1901–1920
- Depner et al. 2014 Depner, S. W.; Cultrara, N. D.; Farley, K. E.; Qin, Y.; Banerjee, S. ACS nano 2014, 8, 4678–4688
- Waitz et al. 2009 Waitz, T.; Tsuchiya, K.; Antretter, T.; Fischer, F. MRS bulletin 2009, 34, 814–821
- Matveeva et al. 1997 Matveeva, N.; Pushin, V.; Volkova, S.; Shelyakov, A.; Bykovskii, Y. A.; Kraposhin, V. The Physics of Metals and Metallography 1997, 83, 626–632
- Kresse and Furthmüller 1996 Kresse, G.; Furthmüller, J. Physical review B 1996, 54, 11169
- Kresse and Hafner 1994 Kresse, G.; Hafner, J. Physical Review B 1994, 49, 14251
- Blöchl 1994 Blöchl, P. E. Physical review B 1994, 50, 17953
- Perdew et al. 1998 Perdew, J.; Burke, K.; Ernzerhof, M. Physical Review Letters 1998, 80, 891
- Monkhorst and Pack 1976 Monkhorst, H. J.; Pack, J. D. Physical review B 1976, 13, 5188
- Giannozzi et al. 2009 Giannozzi, P. et al. Journal of Physics: Condensed Matter 2009, 21, 395502 (19pp)
- Perdew et al. 1996 Perdew, J. P.; Burke, K.; Ernzerhof, M. Physical Review Letter. 1996, 77, 3865–3868
- Marzari et al. 1999 Marzari, N.; Vanderbilt, D.; De Vita, A.; Payne, M. C. Phys. Rev. Lett. 1999, 82, 3296–3299
- Potapov et al. 2001 Potapov, P.; Shelyakov, A.; Schryvers, D. Scripta materialia 2001, 44, 1–7
- Potapov et al. 2003 Potapov, P.; Kulkoval, S.; Shelyakov, A.; Okutsu, K.; Miyazaki, S.; Schryvers, D. Crystal structure of orthorhombic martensite in TiNi-Cu and TiNi-Pd intermetallics. Journal de Physique IV (Proceedings). 2003; pp 727–730
- Ari-Gur et al. 2014 Ari-Gur, P.; Madiligama, A.; Watza, S.; Shelyakov, A.; Kuchin, D.; Koledov, V.; Gao, W. Journal of Alloys and Compounds 2014, 586, S469–S471
- Gou et al. 2014 Gou, L.; Liu, Y.; Ng, T. Y. Intermetallics 2014, 53, 20–25
- Gou et al. 2015 Gou, L.; Liu, Y.; Ng, T. Metals 2015, 5, 2222–2235
- Malygin 2008 Malygin, G. Physics of the Solid State 2008, 50, 1538
- Malygin 2000 Malygin, G. Physics of the Solid State 2000, 42, 1512–1516
- Sorokin et al. 2017 Sorokin, A. A.; Makogonov, S. V.; Korolev, S. P. Scientific and Technical Information Processing 2017, 44, 302–304