R-process enrichment in ultrafaint dwarf galaxies
Abstract
We study the enrichment and mixing of r-process elements in ultrafaint dwarf galaxies (UFDs). We assume that r-process elements are produced by neutron-star mergers (NSMs), and examine multiple models with different natal kick velocities and explosion energies. To this end, we perform cosmological simulations of galaxy formation to follow mixing of the dispersed r-process elements driven by star formation and the associated stellar feedback in progenitors of UFDs. We show that the observed europium abundance in Reticulum II is reproduced by our inner explosion model where a NSM is triggered at the centre of the galaxy, whereas the relatively low abundance in Tucana III is reproduced if a NSM occurs near the virial radius of the progenitor galaxy. The latter case is realised only if the neutron-star binary has a large natal kick velocity and travels over a long distance of a kilo-parsec before merger. In both the inner and outer explosion cases, it is necessary for the progenitor galaxy to sustain prolonged star formation over a few hundred million years after the NSM, so that the dispersed r-process elements are well mixed within the inter-stellar medium. Short-duration star formation results in inefficient mixing, and then a large variation is imprinted in the stellar europium abundances, which is inconsistent with the observations of Reticulum II and Tucana III.
keywords:
galaxies: dwarf – stars: abundances – stars: neutron – galaxies: ISM1 Introduction
Elements heavier than iron are mainly synthesised by neutron-capture processes that occur in neutron-rich environments. The processes are divided into ‘r-process’ and ‘s-process’ by the neutron density of the production site. The s-process is thought to take place in stars in their asymptotic giant branch phases, whereas the major astrophysical r-process site is still under debate (Cowan et al., 2019). Neutron-star mergers (NSMs) are the most promising r-process sites, as have been suggested by recent observations of gravitational waves from GW170817 and its electromagnetic counterpart (Abbott et al., 2017; Coulter et al., 2017). The observed electromagnetic spectrum suggests that the NSM produces a significant amount of r-process elements (Watson et al., 2019).
There have been a number of theoretical studies that consider explosive events such as NSMs and supernovae as astrophysical factories of r-process elements. Numerical relativity simulations show that NSMs can synthesise a large amount of r-process elements (e.g., Hotokezaka et al. (2013)). Interestingly, however, Galactic chemical evolution models do not favour NSMs as dominant sources (van de Voort et al., 2019; Safarzadeh et al., 2019b). Normal core-collapse supernovae (CCSNe) were thought to be another production site, but detailed calculations show that a large flux of neutrinos produced during core collapse effectively converts neutrons to protons, rendering r-processes inefficient overall. Only a particular type of supernovae may produce a significant amount of r-process elements (Woosley, 1993; Siegel et al., 2019; Nishimura et al., 2015). Since there are likely multiple r-process enrichment channels, it is important to study the chemical signatures of r-process elements in galaxies from the early through to the present epoch.
Ultrafaint dwarf (UFD) galaxies are small satellite galaxies in the Local Group. The typical total luminosity is less than , and the mass is dominated by dark matter. UFDs are ideal systems to study chemical evolution as they are thought to preserve the information on elements produced early in their formation histories (Simon, 2019). Recent observations show that two UFDs contain stellar populations with peculiar elemental abundances. Some stars in Reticulum II (Ret II) and Tucana III (Tuc III) show high europium (Eu) abundances, suggesting early r-process enrichment events (Ji et al., 2016; Hansen et al., 2017), but it remains unknown why only these two galaxies show clear r-process element signatures.
Safarzadeh & Scannapieco (2017) consider NSMs as a dominant r-process source, and study the effect of different explosion energies and delay times of NSMs using cosmological hydrodynamics simulations. They find that neither explosion energy nor delay time significantly affects the overall distribution of Eu within small galaxies, but the environment of the explosion site is important. Safarzadeh et al. (2019a) further explore the relation between binary population synthesis models and the fraction of r-process enriched UFDs. They compare two binary population synthesis models with different initial binary separation distributions. To reproduce the observed r-process enriched fraction of UFDs of per cent, the short-separation models are preferred. The merger time is a crucial factor to determine the enriched fraction because the kick velocity is typically higher than the escape velocities of the UFD progenitors. It is found that NSMs contributes to r-process enrichment if the final merger occurs within about 10 per cent of the virial radius of the galaxy. Overall, understanding the differences in the elemental abundances of UFDs help us with identifying the physical conditions of r-process enrichment.
In the present paper, we consider NSMs as the major source of r-process enrichment in UFDs. We run a set of cosmological simulations of early galaxy formation, and model the r-process enrichment and mixing in galaxies that have different star formation histories. We study the dependence of the Eu abundances on star-formation histories by comparing our simulations with recent observations. We examine how neutron-star binary kicks and gas mixing efficiency affect the elemental abundance patterns. The rest of the paper is organized as follows. In Section 2, we describe our simulations and physical models. In Section 3, we present the main results of our simulations. In Section 4, we discuss the implication for the astrophysical production site of r-process elements. Finally in Section 5, we summarise our results.
2 Method
2.1 Cosmological simulations
We run cosmological hydrodynamics simulations of galaxy formation using the moving mesh code arepo (Springel, 2010; Pakmor et al., 2016; Weinberger et al., 2019). The simulations adopt the Planck 2018 cosmological parameters (Planck Collaboration et al., 2018): . The basic code settings and physical parameters are the same as those in Auriga simulation (Grand et al., 2017). Details of the physical models are presented there.
We use the MUlti-Scale Initial Condition generator music (Hahn & Abel, 2011) to generate the cosmological initial conditions. The box size is 1 comoving Mpc on a side. First, we run a low-resolution simulation to locate target haloes (UFD hosts) for zoom-in simulations with higher resolution. In the parent low-resolution simulation, the dark matter particle mass is , and the typical gas cell mass is . We select haloes with at redshift as UFD progenitors (see, e.g., Safarzadeh et al., 2018). We then re-simulate three UFD candidates with a higher mass resolution. The zoom-in region is an ellipsoidal region enclosing all particles within of a target halo at the final redshift (). The mass of each dark-matter (DM) particle is , and the typical gas cell mass is . The simulations are evolved to when reionisation proceeds and effectively quenches star formation in UFD progenitors.
We focus on the three haloes (galaxies) that have notably different star formation histories. In Fig. 1, we show the iron abundance and star formation histories of the three galaxies. The average iron abundance of stars is [Fe/H] = -2.35, -2.49, and -2.64 for Halo 1, Halo 2, Halo 3, respectively, which are close to that of Ret II (-2.65: Simon et al. (2015)) and Tuc III (-2.42: Simon et al. (2017)).
2.2 R-process element production by NSM
For a UFD progenitor, the NSM explosion site affects the overall enrichment level and the spatial distribution of r-process enriched stars, whereas the star formation history critically sets the mixing efficiency of the dispersed elements. We consider Eu as a major, representative r-process element. We assume that an NSM produces of Eu. This corresponds to the case where each NSM produces of r-process elements (Cowperthwaite et al., 2017) if the abundance pattern is the same as the solar r-process abundance at mass number greater than A90 (Arnould et al., 2007).
It is important to examine the effects of kicks and merger delay times of NS binaries. An NS binary can have a large velocity, comparable to or greater than the escape velocity of the host UFD and the progenitors (e.g. Fryer & Kalogera, 1997; Safarzadeh & Côté, 2017). It can travel over a long distance, and the final merger can happen outside the star-forming region or even outside the galaxy. Instead of following the orbits of individual NS binaries, we model merger events as point explosions at designated locations inside and outside the virial radius of the halo. In this way, we can examine how the abundances of r-process elements in metal-poor stars in the UFDs differ in cases with explosions at various locations in a galaxy. In practice, we trigger one NSM at the galactic centre and others at points on the concentric spheres with eight different radii . With polar coordinates, 26 points can be expressed as: with runs every from 0 to . We flag and trace the ejecta from different explosions independently, and thus are able to examine different cases in a single simulation run. Mixing of the NSM ejecta including r-process elements is driven by star-formation and the associated feedback effects by supernovae and stellar winds. Thus the relative timing of the onset of star formation and NSMs, and the duration of the subsequent star formation are important. We study three galaxies with different star formation histories (Table 1 and Fig. 1). The explosion time is chosen so that (i) a substantial amount of stars have already been formed, and (ii) the galaxy still produces stars after the NSM. The first condition is necessary to produce the binary neutron-stars, and the second condition is imposed to see the mixing of the r-process ejecta. For the galaxies we study here, the total gas mass decreases towards the final output redshift, . This is owing to photo-heating and evaporation caused by hydrogen reionisation, and also to outflows driven by stellar feedback. Low-mass haloes like UFD progenitors have shallow gravitational potential wells and thus cannot retain the photo-heated gas after reionisation. Star formation is quenched at this point.
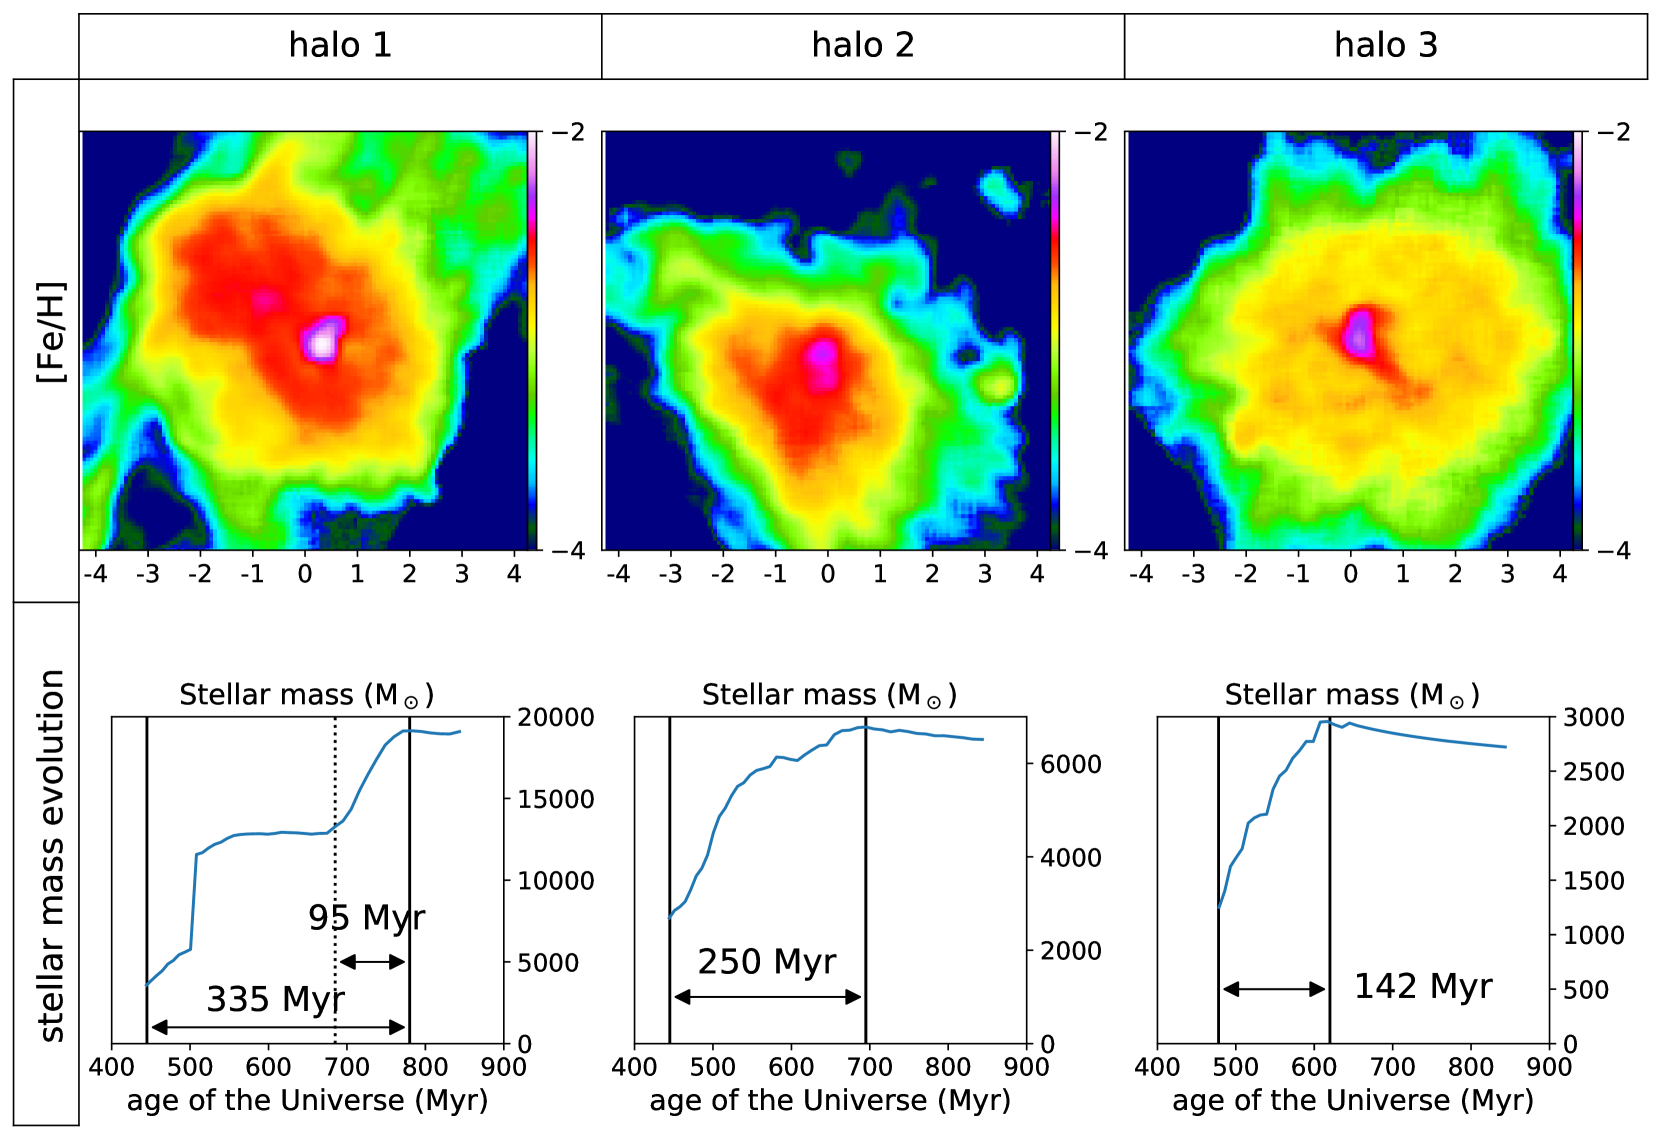
The solid vertical lines in bottom panels show the beginning (dispersal of the r-process elements) and the end of the simulation. The dashed vertical line in the bottom left panel shows the moment of r-process element dispersal in our ‘late’ model.
| stellar mass after NSM( ) | SF duration(Myr) | |
|---|---|---|
| Halo 1 | 15000 | 335 |
| Halo 2 | 4000 | 250 |
| Halo 3 | 1500 | 142 |
| Halo 1, late | 5000 | 95 |
| Ret II | 2600 | - |
We model the NSM bubble evolution by following analytically a point explosion in the self-similar through to snow-plough phases (Mo et al., 2010). We calculate the radius and velocity in the self-similar phase as a function of assuming the explosion energy of erg. The end point of the self-similar phase is assumed to the time when a quarter of the explosion energy is radiated away. By then, the blast-wave reaches
| (1) |
with the velocity of
| (2) |
where is the number density of hydrogen atoms in unit of . Afterwards, the shocked shell expands while conserving momentum with the velocity scaling as . We assume that the snowplough phase ends when the shell velocity decreases to the value comparable to the turbulent velocity of the surrounding gas (. The final radius is calculated as
| (3) |
In each simulation, we define the ‘NSM bubble’ with the radius . For the gas cells inside , we distribute r-process elements with weighting by the cell volume. Effectively, we assume that the ejecta is well mixed within the shell, but also approximately model that the dense (small volume) cells are less susceptible to enrichment.
We have also run simulations with different explosion energies of and erg, to obtain qualitatively similar results. We find that the main physical process of ejecta dilution is large-scale turbulence driven by star formation and galaxy assembly111We note that the rapid increase at Myr of the stellar mass of Halo 1 shown in Figure 1 is caused by mergers of progenitor galaxies., and the exact bubble size at the snowplow phase does not significantly affects the dilution efficiency.
3 Results
We compare the stellar Eu abundances in our simulated galaxies with those of the two UFDs, Tuc III and Ret II. We then identify models that reproduce the observed features.
3.1 NS merger explosion site
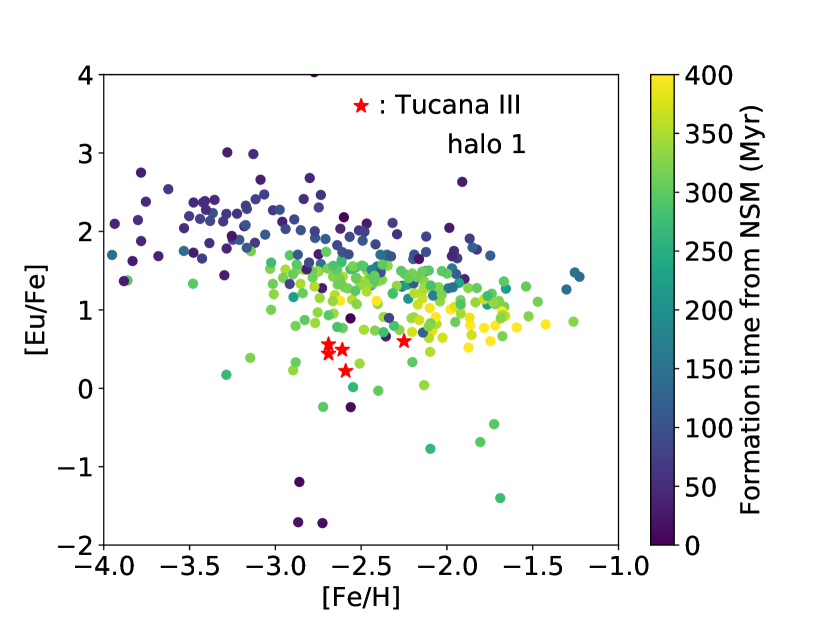
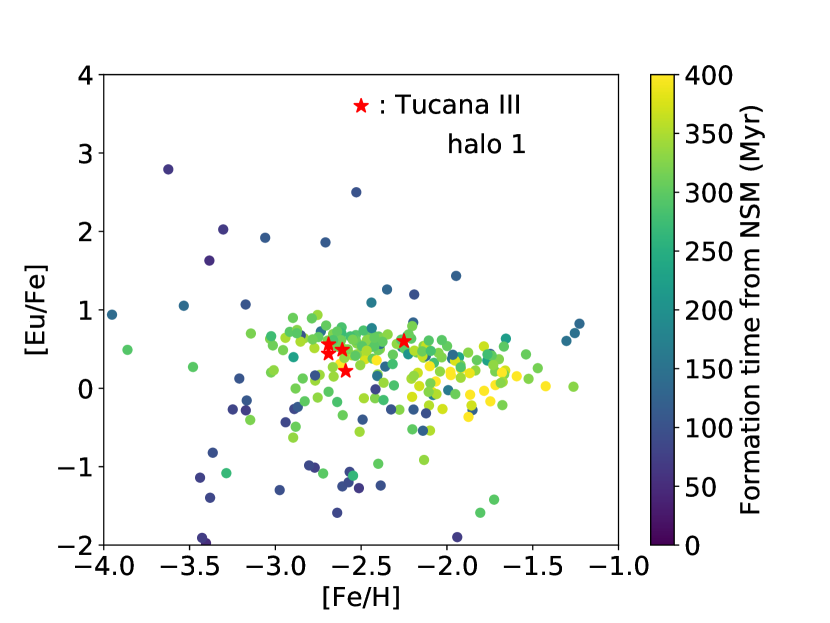
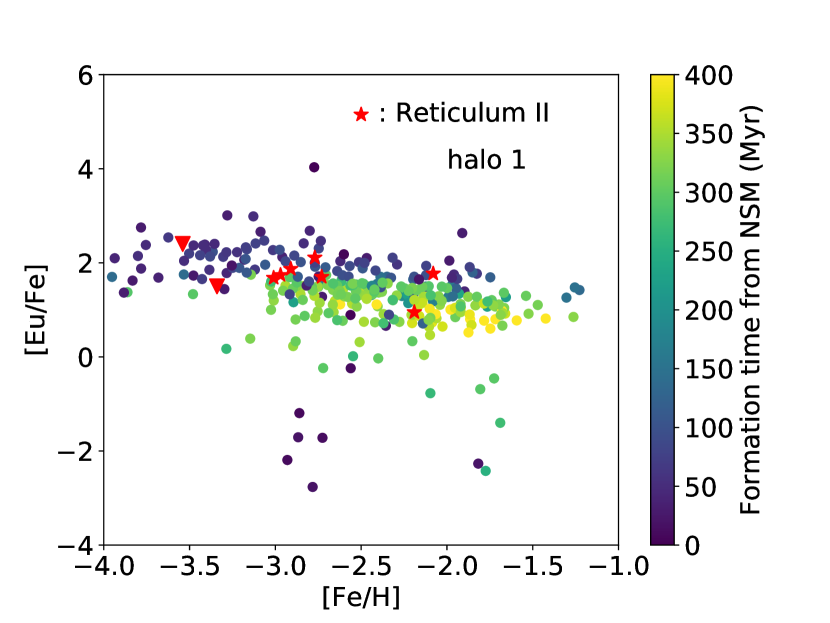
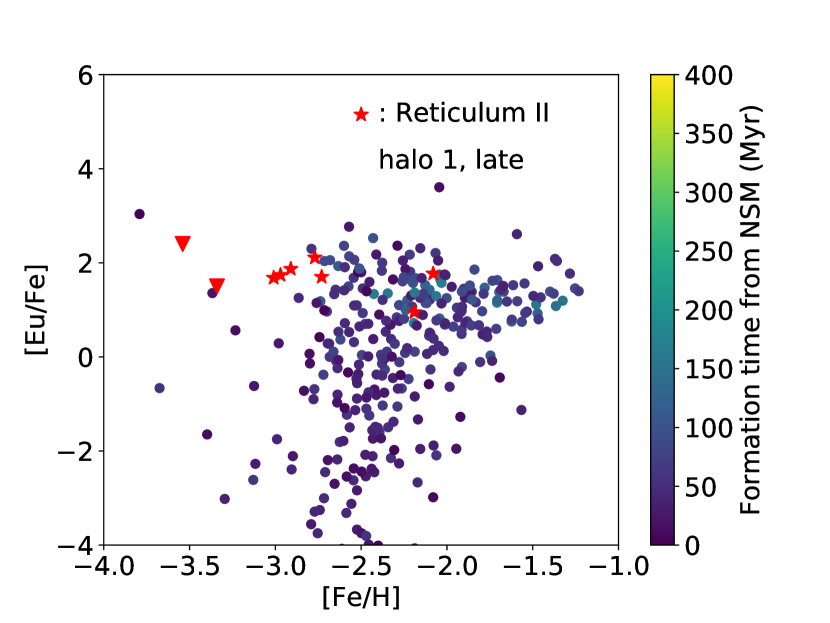
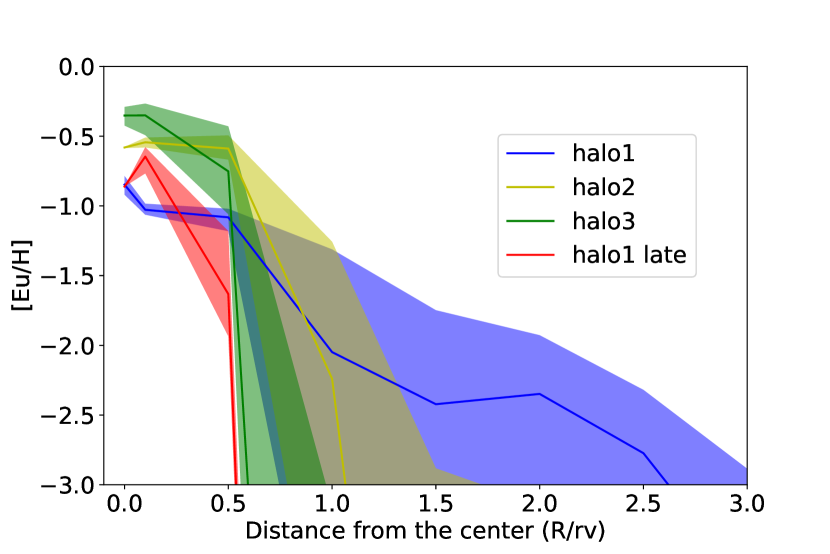
Fig. 2 shows the mean Eu abundances as a function of the location (distance) of explosion site from the centre. As is expected, the mean Eu abundances are progressively lower in the cases where a NSM occurs in the outer region at . Interestingly, we see relatively small differences in [Eu/Fe] if a merger occurs inside the virial radius; all the three haloes show . Note that the [Eu/H] is as large as the mean abundance of Ret II (-0.82 if we exclude the stars with non-detection, and -0.93 if we include them). Since we consider stochastic r-process enrichment, essentially by a single event, [] is not correlated with the stellar mass of the galaxy, but is more correlated with the available gas mass to be mixed.
Tuc III has a low value of (Marshall et al., 2018), which may suggest either (i) NSM explosion(s) took place outside the virial radius, or (ii) the gas mass was very large. In the former case, the distance from the galactic centre should not be too large (Fig. 2), whereas in the latter, mixing with a large amount of gas naturally reduces []. To reconcile the value of Tuc III, we need 10 times more gas. Since the baryon mass fraction in the simulated galaxies are consistent to cosmic mean within a factor of two (for other references, see e.g. Fig.4 of Wise et al. (2012)), the progenitor halo mass should also be larger by a factor of ten, to be . This is too large for star formation in the UFD progenitor to be quenched by cosmic reionisation (Safarzadeh et al., 2018). We thus argue that the outer explosion (above case [i]) is favoured over the large mixing mass.
We note that the small scatter in [Eu/Fe] in Tuc III is not reproduced in Halo 2 and Halo 3 although the mean [Eu/Fe] can be close to that of Tuc III. Halo 2 and Halo 3 show significantly large scatters as a result of inefficient mixing of r-process elements due to the short star formation duration. We discuss this point further in the next section.
3.2 Star formation history
An interesting feature of the two UFDs is that the stellar [Eu/Fe] is roughly constant, with little or only weak dependence on [Fe/H] for Ret II. Also the overall scatter in [] is small (Ji et al., 2016), and the same is true for Tuc III (Marshall et al., 2018). A successful enrichment model should therefore reproduce or explain such a trend.
Fig. 4 compares the r-process element abundances of stars in Halo 1 with different explosion timing. Halo 1 experiences a prolonged star formation over 335 Myr, and the r-process elements dispersed by a NSM at en early epoch are well mixed within the inter-stellar medium. Consequently, the scatter in [Eu/Fe] becomes fairly small. The [Eu/Fe] - [Fe/H] distribution is remarkably similar to Ret II. Contrastingly, if the star formation lasts only 95 Myr after the NSM, the stellar [Eu/Fe] shows a large scatter. Clearly, efficient mixing of the gas and the dispersed heavy elements is preferred or even necessary in order to reproduce the observed small scatter of []. This implies that Ret II once had a prolonged star formation activity over a few hundred million years before the star formation ceased completely.
Fig. 4 also shows the formation time of stars measured from the moment of NSM explosion (colour-coded as in the indicator on the right of each panel). Both in Figs. 3 and 4, we see "evolution" in [Fe/H] as time elapses, with slight downwards tilts. The trend reflects the fact that the r-process production event happens once, and [Eu/H] varies little, but the metallicity (iron abundance) increases as the galaxy chemically evolves over time.
We have shown that mixing of r-process elements critically affects the stellar elemental abundances. In our simulations, supernova-driven galactic winds stir the ISM in the galaxy, providing a major mixing mechanism. Technically, the stellar feedback effect within a star-forming gas cell is modeled by ejecting a wind particle in a random direction (Springel & Hernquist, 2003). The wind particle carries 40 per cent of the heavy elements that have been synthesised and expelled by the SNe, and the other 60 per cent is immediately distributed to nearby gas cells (Vogelsberger et al., 2013). The wind particle travels until the designated maximum travel time, or until reaching a low-density gas cell with . The wind particle finally deposits its mass, metal content, momentum, and energy into the gas cell in which it is located at the final moment.
In the centres of the galaxies, galactic winds efficiently stir the ISM, whereas in the outskirt, full-scale mixing can be achieved only through the halo growth via mergers and accretion. We evaluate the typical mixing timescale is 100 Myr for all three halos, which is a few times shorter than in the outskirt explosion cases presented in the previous section. The sufficient mixing of elements makes the [Eu/Fe]-[Fe/H] distribution in the central explosion model to be consistent with Ret II.
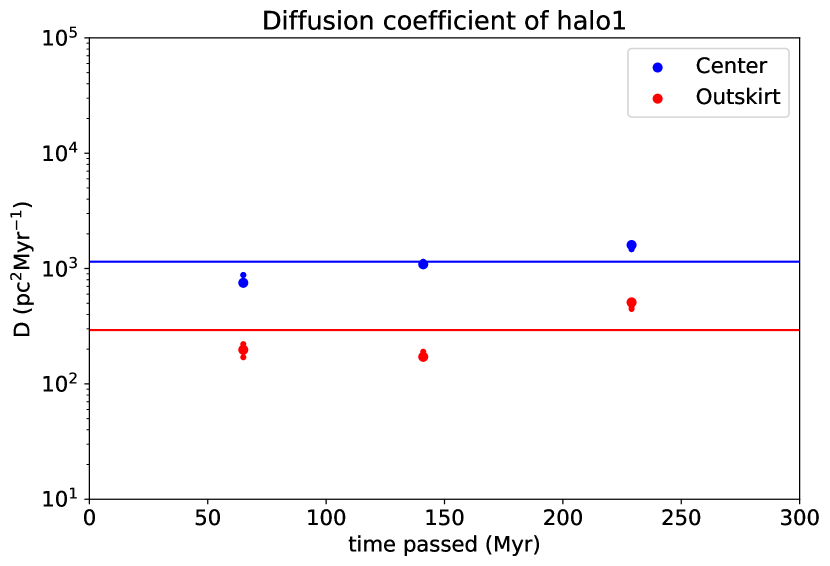
In Fig. 5, we show the diffusion coefficients of Halo 1, obtained by three-dimensional Gaussian fittings of the r-process element distribution. The diffusion coefficient can be calculated by inverting , where we derive Gaussian standard deviation by the fitting. We estimate the diffusion coefficients inside the UFD progenitors to be , and the one at the outskirt of the galaxy to be . As a convergence test, we have performed the same analysis to two additional simulations with eight times lower and higher mass resolutions. We have confirmed that the star formation histories are nearly identical and also that the diffusion coefficients are consistent with the main results shown in Fig. 5 within 20 percent. Within 250 Myrs, the r-process elements distributed around the centre are well mixed to a half of the virial radius, which encloses star-forming regions. The value is consistent with but a little smaller than that derived by Karlsson (2005) who suggests the diffusion coefficient of using a stochastic metal enrichment model, calibrated by the observed metallicity distribution function of low-mass stars in the MW. Hirai & Saitoh (2017) study the ‘mixing efficiency’ by comparing the stellar barium abundances of Milky-Way (MW) and dwarf galaxies to their simulated galaxies using a turbulent metal mixing model. They find that is required to make the barium abundance consistent. Ji et al. (2015) use as their canonical value for the effective diffusion coefficient of the galaxy with a similar mass and a redshift (note the difference in the definition: their effective corresponds to our ). All these values are consistent with our result from the high-resolution hydrodynamics simulations.
Emerick et al. (2019) follow metal mixing in a dwarf galaxy using Eulerian hydrodynamics simulations. They report that the mixing proceeds slower if rare elements are deposited in the outskirt of the galaxy than in the case with deposition near the centre. This trend is also observed in our simulations. They also show that the mixing time can be estimated by the transport timescale (Pan et al., 2013):
In our case, we estimate the typical size of the dwarf galaxies as , and the characteristic turbulent length and velocity , respectively. The former is roughly the size of a NSM bubble when it is in the snow-plough phase (Eq. [3]) and the latter is the turbulent velocity of the amibient gas. With these values, we obtain the mixing timescale of about 250 Myr, which is consistent with our simulations where it takes a few hundred Myr to chemically homogenise the galaxy.
4 Discussion
4.1 Star formation histories of the UFDs
Our results suggest an interesting possibility that the scatter of r-process elements among stars in UFDs can be used as a measure of mixing efficiency that is determined by the timing of the r-process enrichment and the star-formation duration in the galaxy. If we assume a continuous star formation model, it takes 300 Myrs or more after a NSM explosion for the ejecta including r-process elements to be mixed well with the ambient ISM. This is longer than the free-fall time . Such ‘sufficient’ mixing can be achieved if binary neutron-stars are formed in the very early epoch, and the binary merges quickly, and star formation lasts long.
These conditions make the single star-burst event scenario rather unlikely, and make us consider prolonged or multiple star-formation epochs. We need more UFD observations to make this argument statistically robust. It would be quite interesting to search for the first-generation stars or "earlier generation" stars that contain no r-process elements in Ret II and Tuc III, because it would then indicate the timing of NSM relative to the onset of major star formation in the galaxies.
4.2 Natal kick of neutron-star binaries
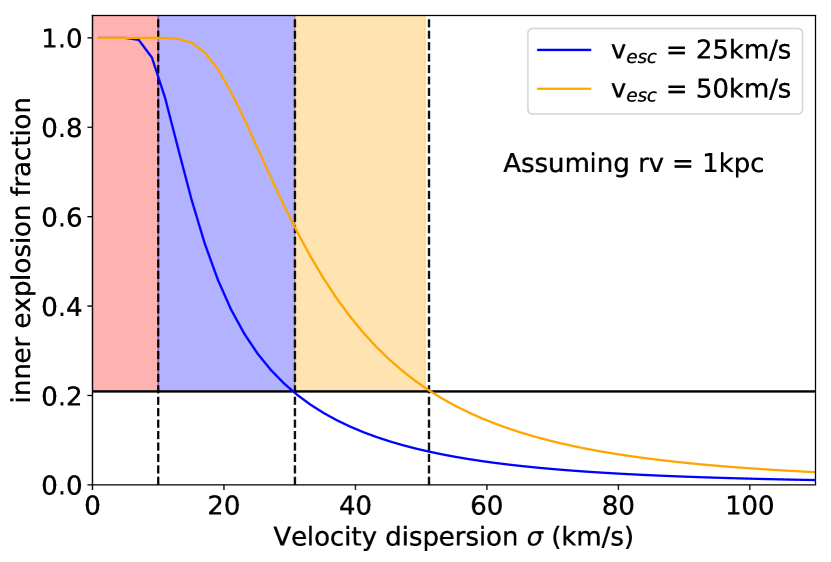
We have shown that the high Eu abundance in Ret II is reproduced if an NSM occurs at the centre. Such central explosion can occur if the binary neutron-stars receive very weak kick at the formation, or merge within a very short time. Contrastingly, the relatively low Eu abundance in Tuc III can be explained by NSM explosion in the outer halo beyond the virial radius, i.e., if the binary neutron-stars receive modest kick comparable to escape velocity of the galaxy, km/s depending on the place the binary was born. Intriguingly, it is known that there are two populations of binary neutron-stars; one is with low peculiar velocities and the other with high velocities (Beniamini et al., 2016). It is important to estimate how far a kicked neutron-star binary travels over a hundred million years. We calculate the fraction of neutron-star binaries that merge inside the virial radius, assumed to be 1 kpc. The initial velocity is drawn from the Maxwell-Boltzmann distribution with a certain velocity dispersion . We also assume that the delay time distribution is proportional to (Belczynski et al., 2018) with and . Fig. 6 shows the resulting fraction as a function of . For the assumed merger delay time distribution, the probability is generally low that NSMs occur within the virial radius of a UFD, unless the natal kick velocity is low. The fraction of UFDs that are enriched with r-process elements can be used to constrain the typical kick velocity. Note, however, that at least a few other factors need to be considered, such as the formation rate of neutron-star binaries and the stellar mass estimate of UFD progenitors. Our discussion here is based on simple assumptions as follows: (i) We assume that the initial mass function IMF in UFDs is Chabrier IMF (Chabrier, 2001). Since the stellar populations in UFDs are quite old, stars heavier than already disappeared or in the post-main-sequence phase. This reduces the surviving stellar mass to 36 per cent of the initial stellar mass. (ii) No tidal stripping takes place, so the initial stellar mass can be derived only from the dead stars correction in (i). (iii) The mass-to-light ratio is the same for all UFDs as that of Ret II (Bechtol et al., 2015). There are 14 UFDs whose stellar Eu abundances are measured (Simon, 2019). With these assumptions, we can estimate the initial stellar mass to be . If we adopt the typical fraction of merging neutron-star binaries to per in stars, we expect 2.3 UFDs experience r-process enrichment. This is consistent with the number of UFDs enriched (), and thus implies that the NSMs should dominantly takes place within the galaxy they were born in. The high initial velocity model is disfavoured.
High-velocity NS binaries may not have been able to escape if the UFD progenitor was more massive in the past. Interestingly, there are some signatures indicating that the Tuc III had experienced tidal stripping (Li et al., 2018). In order to make the model with viable, the UFD progenitors must lose its original mass more than 90 per cent on average.
R-process enrichment can be caused by an "external" neutron-star binary formed in another galaxy. Natal neutron-star kick makes it possible for a binary to travel over a long distance in a few to several hundred million years. We find, however, that such an "external enrichment" of UFDs is an unlikely event. In our parent cosmological simulation, the typical physical distance between two star-forming galaxies is kpc at , and the virial radius of the UFD progenitor is 1 kpc. Then the solid angle subtended by the neighbouring galaxy is , yielding the direction-wise success rate of . Furthermore, the NSM must occur at the right time during its passage through a (small) galaxy; the merger occurring inside a galaxy is roughly (2kpc)/(60kpc) = 1/30. The actual success rate should be even lower because a large fraction of binary neutron-stars explode before traveling over kpc. In conclusion, we can expect that the external NSM enrichment is extremely rare, and although not entirely impossible, we can ignore such an enrichment channel.
| Time lag < 100Myr | Time lag > 100 Myr | |||||
|---|---|---|---|---|---|---|
| R< |
|
|
||||
| R> |
|
|
4.3 NSMs or CCSNe?
We have assumed that NSMs are the only r-process element sources. There are also other suggested sources and mechanisms: magneto-rotational SNe and collapsars (Woosley, 1993; Siegel et al., 2019; Nishimura et al., 2015), which are rare types of CCSNe. NSMs are different from the SNe-origin mechanisms in that NS binaries need time to merge after formation and that they can travel over long distances before merging.
Interestingly, recent studies on Galactic chemical evolution studies emphasize the difference in delay time to conclude that rare SNe are favored as the r-process element source than the NSMs. van de Voort et al. (2019) argue that rare, special CCSNe with r-process yields comparable to the NSMs is favoured as the main r-process source over the NSMs. The key feature is the flat trend observed in []- [] plot in metal-poor regime. Models with NSMs with long delay times do not make stars to have low [], but rare, special CCSNe, can synthesise and mix r-process elements with the ambient gas quickly so that stars formed from the enriched gas have low [Fe/H]. This is a notable feature different from UFDs.
Tuc III is moderately enriched with r-process elements. In our simulations, the best-reproducing scenario is the one with explosion with the offset of a virial radius (see Fig. 3), and all central explosion scenarios overproduce r-process elements. The relatively low Eu abundance in Tuc III stars can have three different interpretations: (i) explosion happens at outside the galaxy, therefore only a small fraction of Eu is captured in the stars, (ii) mixing gas mass is quite large, therefore [] is small, or (iii) the r-process yields is small in the first place. We argue that the first scenario is the most likely. As for the second argument, we need of hydrogen gas to reproduce . This is too massive for UFD progenitors at , because the typical halo mass is , and the baryon fraction is only about 16 per cent of all matters. Such high mixing mass is unlikely for the UFD progenitors. This mixing mass estimate is degenerated with the Eu yield from an NSM. A smaller Eu yield makes it possible that Tuc III Eu abundance is explained by large mixing mass. In order to constrain this scenario further, we need UFD observations with lower [] abundances. As for the third argument, i-process in, e.g. magneto-rotational supernovae (MRSNe) (Nishimura et al., 2017), is suggested as the small-yield event. Such a weak r-process event has a relatively high electron fraction, and produces a large amount of first-peak elements compared to heavier elements such as lanthanides. However, Tuc III is known to be lanthanide-rich (Ji et al., 2019a), suggesting the progenitor r-process event had a quite low electron fraction. Since we do not know any such a neutron-rich and low r-process yield event, we argue that the low r-process yield scenario is unlikely, although it is not rejected.
Interestingly, the other UFDs do not contain Eu-enriched stars, but some of them contain very small amounts of Ba and Sr, which probably originate from the r-process (Ji et al., 2019b). As shown in Fig. 2, if a NSM occurs outside the virial radius, it is possible to enrich the ISM in star-forming regions to a very low level. The stars in UFDs except for Ret II and Tuc III typically have [Ba/H] (Ji et al., 2019b). Assuming that the “pure” r-process produces [Ba/Eu] (Burris et al., 2000), this corresponds to [Eu/H]. We have examined our models with halo1, and have found that the low abundance is realised if the NSM occurs very far from the center, about three times the virial radius of the simulated galaxy. We have shown that the low Eu abundance of Tuc III is explained by a NSM in the outskirt of the galaxy. If future observations discover UFDs with lower (but non-zero) [], NSMs with large initial kick velocities are strongly favored over other prompt enrichment processes.
4.4 Other implications
From the Eu and Fe abundances in a UFD, we can infer the explosion site and the time lag between the NSM and typical star formation in the galaxy. For example, if a large scatter is found in the abundances of r-process elements, it is likely that there was long star formation over a few hundred million years after the NSM. Table 2 summarises our findings.
Other properties such as the explosion energy of the NSM do not affect the Eu abundances dramatically. We naively expect that NSMs with higher explosion energy results in efficient mixing of the ejecta. However, since the dominant mixing mechanism is the turbulent motions in the galaxy, the NSM explosion energy causes a relatively minor effect. The Eu abundance scatter is determined by the time lag between NSM and star formation quenching, we do not expect that the merger delay time is important for the [Eu/Fe] - [Fe/H] plot. Safarzadeh & Scannapieco (2017) examine the cases with three different explosion energies, three different delay times, and two different merger sites. They conclude that the merger site is most important in determining the [] - [] plot. Our result is consistent with this notion. We have also seen that we cannot distinguish explosions at the galactic centre and at 0.1kpc distant from the centre (Figure 2).
It has been suggested that the r-process enhanced halo stars in Milky Way originate from disrupted UFD-like galaxies. Naiman et al. (2018) reproduce the overall [Eu/Fe]-[Fe/H] trend in the stars of Milky Way by post-processing sub-grid mixing of r-process elements. They find that the [Eu/Fe] distribution of in-situ and ex-situ stars are similar to each other, suggesting that the UFD-disruption scenario may not be favoured. Note, however, that they also report paucity of highly r-process enhanced ([Eu/Fe] ) stars. Safarzadeh et al. (2019b) study the origin of r-process elements in Milky Way by comparing in detail the distribution and abundances of r-process enhanced metal-poor stars. Their simulations resolve small progenitor galaxies (), and the effective mixing timescale in their model is consistent with what we find in the present paper.
It appears necessary to resolve small () progenitor galaxies to form highly r-process enhanced stars. Such stars are also reproduced in our simulated UFDs, which may constitute, after tidal disruption, a part of the Milky Way halo.
Finally, we discuss possible implications of our results for r-process enrichment in globular clusters (GCs). It is known that at least half of GCs have stars that contain r-process elements (Roederer, 2011). The origin is not identified, and theoretical work is ongoing. Zevin et al. (2019) models the r-process enrichment of the GCs. They conclude that NSM can enrich the GCs if the GC contain star-forming gas Myr after the initial star formation. There is also a curious fact that the stars in GCs have very small abundance scatters (Bekki & Tsujimoto, 2017). Although the UFDs we have considered are more massive and physically extended systems than GCs, our model may offer an interesting scenario that sufficient mixing of r-process elements through prolonged star formation causes nearly uniform r-process abundance. If a fraction of GCs had small galaxies as their progenitors, and if stochastic events like NSMs dispersed r-process elements within their progenitors, it may be possible to reproduce the observed abundance patterns in GCs.
5 Conclusions
We have performed cosmological simulations to study the physical processes that shape the stellar Eu abundance distribution of UFDs. We have focused on the explosion sites in the galaxy and star formation histories.
Our results suggest that
-
1.
For both Ret II and Tuc III, the r-process element abundances can be explained by the NSM model.
-
2.
If a NSM occurs inside the virial radius of a UFD progenitor before reionisation, it can enrich the galaxy with r-process elements up to [], depending on the explosion site and the gas mass in the galaxy. This conclusion also holds for other, similar enrichment processes such as a particular type of CCSNe with the explosion energy of erg and 0.01 of r-process materials.
-
3.
The Eu abundance pattern of Ret II is reproduced if a NSM occurs inside virial radius and star formation in the galaxy lasts over a few hundred million years afterwards. The abundance pattern of Tuc III can be explained by the NSM at around virial radius, and if star formation lasts for a similarly long time.
-
4.
With [] and [], we can estimate the time gap between explosion events and typical star-formation in the galaxy.
UFDs are thought to have born early in the history of the Universe. The origin of r-process elements and how the elements were dispersed in such early galaxies have been largely unknown, but NSMs are emerging as a promising candidate especially after the multi-wavelength observations of GW170817 and its electromagnetic counterpart. In the future, a concerted study on stellar populations in galaxies, physical properties of NS binaries, and the occurrence rate of gravitational waves by NSMs will reveal how r-process elements were produced in UFDs and also in our Galaxy.
Acknowledgements
We thank Volker Springel for kindly providing the simulation code arepo. We thank Yutaka Hirai, Kenta Hotokezaka for fruitful discussions. This study was supported by World Premier International Research Center Initiative (WPI), MEXT, Japan and by SPPEXA through JST CREST JPMHCR1414. The numerical computations presented in this paper were carried out on Cray XC50 at Center for Computational Astrophysics, National Astronomical Observatory of Japan. SI receives the funding from KAKENHI Grant-in-Aid for Young Scientists (B), No. 17K17677.
References
- Abbott et al. (2017) Abbott B. P., et al., 2017, Phys. Rev. Lett., 119, 161101
- Arnould et al. (2007) Arnould M., Goriely S., Takahashi K., 2007, Phys. Rep., 450, 97
- Bechtol et al. (2015) Bechtol K., et al., 2015, ApJ, 807, 50
- Bekki & Tsujimoto (2017) Bekki K., Tsujimoto T., 2017, ApJ, 844, 34
- Belczynski et al. (2018) Belczynski K., et al., 2018, arXiv e-prints, p. arXiv:1812.10065
- Beniamini et al. (2016) Beniamini P., Hotokezaka K., Piran T., 2016, ApJ, 829, L13
- Burris et al. (2000) Burris D. L., Pilachowski C. A., Armand roff T. E., Sneden C., Cowan J. J., Roe H., 2000, ApJ, 544, 302
- Chabrier (2001) Chabrier G., 2001, ApJ, 554, 1274
- Coulter et al. (2017) Coulter D. A., et al., 2017, Science, 358, 1556
- Cowan et al. (2019) Cowan J. J., Sneden C., Lawler J. E., Aprahamian A., Wiescher M., Langanke K., Martínez-Pinedo G., Thielemann F.-K., 2019, arXiv e-prints, p. arXiv:1901.01410
- Cowperthwaite et al. (2017) Cowperthwaite P. S., et al., 2017, ApJ, 848, L17
- Emerick et al. (2019) Emerick A., Bryan G. L., Mac Low M.-M., 2019, arXiv e-prints, p. arXiv:1909.04695
- Fryer & Kalogera (1997) Fryer C., Kalogera V., 1997, ApJ, 489, 244
- Grand et al. (2017) Grand R. J. J., et al., 2017, MNRAS, 467, 179
- Hahn & Abel (2011) Hahn O., Abel T., 2011, MNRAS, 415, 2101
- Hansen et al. (2017) Hansen T. T., et al., 2017, ApJ, 838, 44
- Hirai & Saitoh (2017) Hirai Y., Saitoh T. R., 2017, ApJ, 838, L23
- Hotokezaka et al. (2013) Hotokezaka K., Kiuchi K., Kyutoku K., Okawa H., Sekiguchi Y.-i., Shibata M., Taniguchi K., 2013, Phys. Rev. D, 87, 024001
- Ji et al. (2015) Ji A. P., Frebel A., Bromm V., 2015, MNRAS, 454, 659
- Ji et al. (2016) Ji A. P., Frebel A., Chiti A., Simon J. D., 2016, Nature, 531, 610
- Ji et al. (2019a) Ji A. P., Drout M. R., Hansen T. T., 2019a, arXiv e-prints, p. arXiv:1905.01814
- Ji et al. (2019b) Ji A. P., Simon J. D., Frebel A., Venn K. A., Hansen T. T., 2019b, ApJ, 870, 83
- Karlsson (2005) Karlsson T., 2005, A&A, 439, 93
- Li et al. (2018) Li T. S., et al., 2018, ApJ, 866, 22
- Marshall et al. (2018) Marshall J., et al., 2018, arXiv e-prints, p. arXiv:1812.01022
- Mo et al. (2010) Mo H., van den Bosch F. C., White S., 2010, Galaxy Formation and Evolution
- Naiman et al. (2018) Naiman J. P., et al., 2018, MNRAS, 477, 1206
- Nishimura et al. (2015) Nishimura N., Takiwaki T., Thielemann F.-K., 2015, ApJ, 810, 109
- Nishimura et al. (2017) Nishimura N., Sawai H., Takiwaki T., Yamada S., Thielemann F. K., 2017, ApJ, 836, L21
- Pakmor et al. (2016) Pakmor R., Springel V., Bauer A., Mocz P., Munoz D. J., Ohlmann S. T., Schaal K., Zhu C., 2016, MNRAS, 455, 1134
- Pan et al. (2013) Pan L., Scannapieco E., Scalo J., 2013, ApJ, 775, 111
- Planck Collaboration et al. (2018) Planck Collaboration et al., 2018, arXiv e-prints, p. arXiv:1807.06209
- Roederer (2011) Roederer I. U., 2011, ApJ, 732, L17
- Safarzadeh & Côté (2017) Safarzadeh M., Côté B., 2017, MNRAS, 471, 4488
- Safarzadeh & Scannapieco (2017) Safarzadeh M., Scannapieco E., 2017, MNRAS, 471, 2088
- Safarzadeh et al. (2018) Safarzadeh M., Ji A. P., Dooley G. A., Frebel A., Scannapieco E., Gómez F. A., O’Shea B. W., 2018, MNRAS, 476, 5006
- Safarzadeh et al. (2019a) Safarzadeh M., Ramirez-Ruiz E., Andrews J. J., Macias P., Fragos T., Scannapieco E., 2019a, ApJ, 872, 105
- Safarzadeh et al. (2019b) Safarzadeh M., Sarmento R., Scannapieco E., 2019b, ApJ, 876, 28
- Siegel et al. (2019) Siegel D. M., Barnes J., Metzger B. D., 2019, Nature, 569, 241
- Simon (2019) Simon J. D., 2019, arXiv e-prints, p. arXiv:1901.05465
- Simon et al. (2015) Simon J. D., et al., 2015, ApJ, 808, 95
- Simon et al. (2017) Simon J. D., et al., 2017, ApJ, 838, 11
- Springel (2010) Springel V., 2010, MNRAS, 401, 791
- Springel & Hernquist (2003) Springel V., Hernquist L., 2003, MNRAS, 339, 289
- Vogelsberger et al. (2013) Vogelsberger M., Genel S., Sijacki D., Torrey P., Springel V., Hernquist L., 2013, MNRAS, 436, 3031
- Watson et al. (2019) Watson D., et al., 2019, Nature, 574, 497
- Weinberger et al. (2019) Weinberger R., Springel V., Pakmor R., 2019, arXiv e-prints, p. arXiv:1909.04667
- Wise et al. (2012) Wise J. H., Turk M. J., Norman M. L., Abel T., 2012, ApJ, 745, 50
- Woosley (1993) Woosley S. E., 1993, ApJ, 405, 273
- Zevin et al. (2019) Zevin M., Kremer K., Siegel D. M., Coughlin S., Tsang B. T. H., Berry C. P. L., Kalogera V., 2019, ApJ, 886, 4
- van de Voort et al. (2019) van de Voort F., Pakmor R., Grand R. J. J., Springel V., Gómez F. A., Marinacci F., 2019, arXiv e-prints, p. arXiv:1907.01557