11email: jacqueline.den.hartogh@csfk.mta.hu 22institutetext: Astrophysics group, Lennard-Jones Laboratories, Keele University, ST5 5BG, UK 33institutetext: NuGrid Collaboration, http://www.NuGridstars.org 44institutetext: Observatoire de Genève, Université de Genève, 51 Ch. des Maillettes, 1290 Sauverny, Suisse 55institutetext: IRAP, Université de Toulouse, CNRS, CNES, UPS, Toulouse, France
Asteroseismology of evolved stars to constrain the internal transport of angular momentum.
Abstract
Context. The internal characteristics of stars, such as their core rotation rates, are obtained via asteroseismic observations. A comparison of core rotation rates found in this way with core rotation rates as predicted by stellar evolution models demonstrate a large discrepancy. This means that there must be a process of angular momentum transport missing in the current theory of stellar evolution. A new formalism was recently proposed to fill in for this missing process, which has the Tayler instability as its starting point (by Fuller et al., 2019, hereafter referred to as ‘Fuller-formalism’).
Aims. We investigate the effect of the Fuller-formalism on the internal rotation of stellar models with an initial mass of 2.5 M⊙.
Methods. Stellar evolution models, including the Fuller-formalism, of intermediate-mass stars were calculated to make a comparison between asteroseismically obtained core rotation rates in the core He burning phase and in the white dwarf phase.
Results. Our main results show that models including the Fuller-formalism can match the core rotation rates obtained for the core He burning phases. However, these models are unable to match the rotation rates obtained for white dwarfs. When we exclude the Fuller-formalism at the end of the core He burning phase, the white dwarf rotation rates of the models match the observed rates.
Conclusions. We conclude that in the present form, the Fuller-formalism cannot be the sole solution for the missing process of angular momentum transport in intermediate-mass stars.
Key Words.:
stars: evolution – stars: rotation – stars: oscillations – stars: interiors1 Introduction
Recent developments in asteroseismology have led to a wealth of information on the internal properties of mainly low- and intermediate-mass stars (recently reviewed in Aerts et al., 2019). In particular, the analysis of mixed modes have been used to infer core rotation rates in post-main sequence stars (Beck et al., 2012; Deheuvels et al., 2012; Mosser et al., 2012; Deheuvels et al., 2014, 2015; Di Mauro et al., 2016; Deheuvels et al., 2017; Gehan et al., 2018; Di Mauro et al., 2018; Tayar et al., 2019). A large discrepancy exists between the predicted values of stellar evolution models and observed values (Eggenberger et al., 2012; Ceillier et al., 2013; Marques et al., 2013; Cantiello et al., 2014), which confirms the findings of earlier works (Pinsonneault et al., 1989; Chaboyer et al., 1995; Eggenberger et al., 2005; Suijs et al., 2008; Denissenkov et al., 2010).
This discrepancy between predicted and observed core rotation rates shows that an additional, dominant process that transports angular momentum (AM) from the core to the outer layers is active in stars, but missing from stellar evolution codes. There is still no consensus on the physics behind this discrepancy. Several physical processes are currently being investigated. One is presented in the work by Kissin & Thompson (2015), who argues that magnetic torques leads to solid-body rotation in radiative regions, and differential rotation in convective regions. Another physical process being investigated is transport of AM by internal gravity waves; see Rogers et al. (2013), and an extensive overview in Aerts et al. (2019). Magnetised winds have been tested by Tayar & Pinsonneault (2018); Tayar et al. (2019). Recently, a re-investigation of the Tayler instability was published by Fuller et al. (2019) (hereafter referred to as the ‘Fuller-formalism’). There is no consensus on which of these options, or whether any of them at all, are actually present in stars and acts as a dominant process in terms of AM transport.
In this study, we focus on testing the Fuller-formalism on a small grid of intermediate-mass stars. Previous tests of this formalism highlighted that it indeed transports AM and is dominant over the meridional and shear instabilities Eggenberger et al. (2019b, c). These tests, which have only concerned low-mass stars, show that the Fuller-formalism in its current form is not the full solution to the missing process of AM transport. In particular, Eggenberger et al. (2019c) shows that the Fuller-formalism has trouble reproducing the core rotation rates of subgiant stars and argues that different values of free parameter are needed to match consecutive stellar evolutionary phases.
In this study, we focus on the comparison of the Fuller-formalism with the asteroseismic observations of intermediate-mass stars (Deheuvels et al., 2015). The seven core He burning stars in that study all show weak radial differential rotation and slow core rotation rates. Recently, these findings were confirmed to be a general characteristic of core He burning stars with a mass between 2 to 3 M⊙ and not merely an observational bias, by Tayar et al. 2019. This particular initial mass range is important as it is known to be the site for the main component of the slow neutron capture process and, thus, responsible for about 50% of all elements heavier than iron (Herwig, 2005; Käppeler et al., 2011; Karakas & Lattanzio, 2014). Finally, many of the known white dwarfs whose rotational periods have been measured (Kawaler, 2015; Hermes et al., 2017) are believed to have progenitors in the same mass range of 2 to 3 M⊙. In the following section we introduce the physics of our stellar evolution models and our results are shown in Section 3. Our conclusions are summarised in Section 4.
2 Stellar evolution models
The stellar evolution models are generated with MESA revision 8845 Paxton et al. (2011, 2013, 2015). The initial settings are the same as in den Hartogh et al. (2019a, b), as is the method we used to get through the convergence issues that can occur at the end of the AGB phase. The implementation of the Fuller-formalism is the same as in Fuller et al. (2019), so that only the formalism’s effect on the transport of angular momentum is included in the stellar evolution models and not its effect on the mixing of chemical elements. No other processes linked to rotation are included in the calculations in our approach, which is also in agreement with Fuller et al. (2019).
In Spruit (2002), the magnetic torque directly follows from the physics of the Tayler instability itself as it interacts with differential rotation. In Fuller et al. (2019), the torque follows from a turbulence formalism that focusses on energy dissipation. The resulting energy dissipation in the Fuller-formalism is then lower than in the TS-dynamo, leading to stronger magnetic fields and Maxwell stresses. As a result, the Fuller-formalism is more efficient in transporting AM than the TS-dynamo. The equations for the transport of AM in the Fuller-formalism are:
| (1) | |||
| (2) | |||
| (3) |
with being a dimensionless factor (discussed below), and the magnetic and thermal diffusivities, the effective Brunt-Väisälä frequency, and the new minimum threshold for shear (q=-). The Fuller-formalism is only active and transporting AM when the shear is larger than .
| (4) |
where is the angular velocity, the specific angular momentum, and the total diffusion coefficient for AM transport is . Following Fuller et al. (2019), 1) the only process included in the AM transport is the Fuller-formalism and, thus, = ; and 2) there is no mixing of chemical elements due to rotation included in the models presented here.
The small set of models calculated for this work have an initial mass of 2.5 M⊙, an initial metallicity of Z=0.01, and an initial rotation rate of 50 km/s; this follows a direct continuation of den Hartogh et al. (2019a). The Fuller-formalism has only one free parameter111There are a few more free parameters, but those only concern the smoothing of . Their values are the same as in Fuller et al. 2019.: , which we vary in order to match the core rotation rates of the seven stars analysed in Deheuvels et al. (2015).
These seven core He burning stars were chosen because both the core and surface rotation rate were known, which allows for an improved constraining of the initial parameters. The small size of this sample made it difficult to determine whether it was sufficiently representative of intermediate-mass core He burning stars, especially as their core rotation rates are used to place them among the slowest rotating core He burning stars, see Fig. 4 in Aerts et al. 2019. Recently, 99 new core rotation rates for core He burning stars were published by Tayar et al. (2019), in which most stars have a mass of 2-3 solar masses. The core rotation rates of the seven stars of Deheuvels et al. (2015) fit well in the new data set and they are, thus, representative values. We include all the known white dwarfs rotation rates, as presented in Kawaler (2015) and Hermes et al. (2017).
3 Results
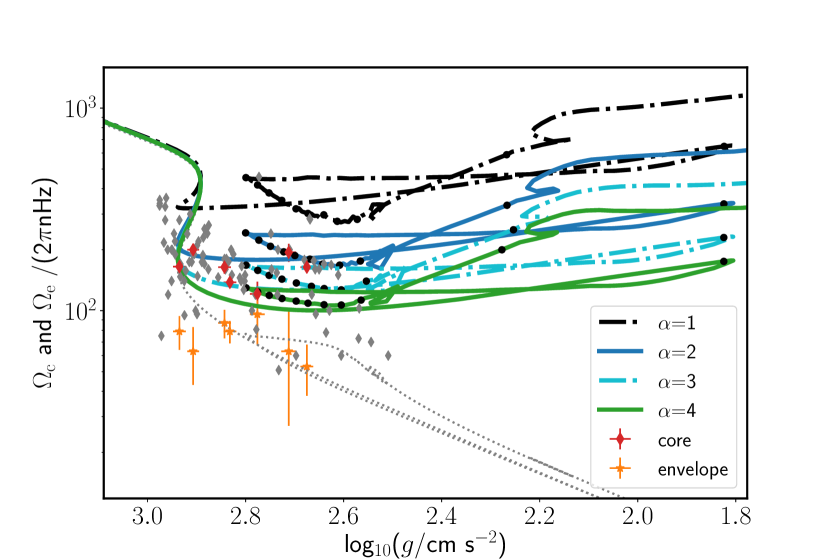
The evolution of the core rotation rates of the 2.5 M⊙ models, including the Fuller-formalism, is shown in the top panel of Fig. 1. The core rotation rates correspond to the mean value determined in the g-mode cavity (following Goupil et al., 2013) and are plotted against the surface gravity. Black dots are added to indicate the core He burning phase, where interval between dots accounts for 10% of the total duration of the core He burning phase. The first dot (located around log/cm s 1.8) indicates the start of the core He burning phase, while the final black dot (located around log/cm s2.3) indicates the end of the core He burning phase. These markers show that the stellar models spend the majority of the phase in the part of the parameter space of , where the observed rotation rates are located.
A slightly lower initial mass is needed in the stellar evolution models to reach all the corresponding log values.
In order to reach the values by Deheuvels et al. (2015), we had to include a value for of two to four.
This increase enhances the transport of angular momentum, leading to lower core rotation rates. The grey data points in the top panel are the core rotation rates of stars with a mass between 2 and 3 M⊙ of Mosser et al. (2012) and Tayar et al. (2019), which cover a similar space in the figure. This indicates that these values for are needed for all stars in this mass range, possibly even higher values for the data points just below 102 nHz.
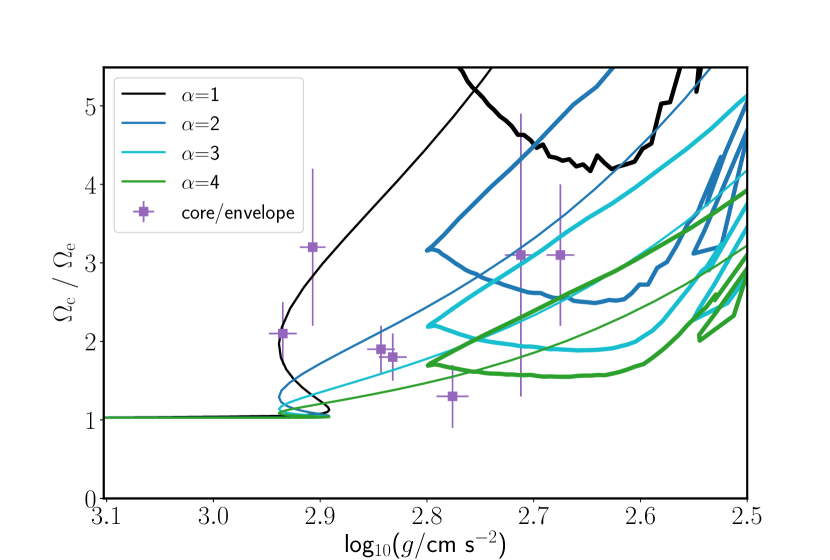
The increase of also results in a decrease of the differential rotation, which improves the match of the models to the ratio of core to surface rotation rate, as shown in the bottom panel of Fig. 1. The need for these higher values of is in contrast to Fuller et al. (2019), who suggests that should be around 1.
These results are different in several aspects from the ones obtained by den Hartogh et al. (2019a), using a constant additional, artificial viscosity to match the seven stars from Deheuvels et al. (2015). The models with the Fuller-formalism experience solid body rotation until a log/cm s 2.9 is reached, while the models in den Hartogh et al. (2019a) diverge from solid body rotation at the end of the main sequence, at log/cm s 4.0 (see their Fig. A.2 and A.3). The elongation of the solid body phase is also visible in Fig. 3 of Fuller et al. (2019). Another difference is, of course, that the viscosity due to the Fuller-formalism is not a constant.
When comparing our results to Fuller et al. (2019), and specifically their Fig. 4, some differences can be identified. In particular, in Fig. 4 of Fuller et al. (2019), the range of clump rotational periods is matched with of 0.5 to 2, while we need a larger range for to match all observed values. This can be explained by two points: the models presented here are calculated with a higher initial mass than in Fuller et al. 2019: namely, here it is 2.5 M⊙, there it is 1.5 M⊙. And, as shown in Fig. 6 of Fuller et al. 2019, their models (all using =1) with initial mass of 2.2 and 3.0 M⊙ range show lower periods during their clump phase when compared to their models with an initial mass of 1.2 and 2.0 M⊙ (respectively, 40 days and 100-200 days). These lower periods would not match the observed range as included in their Fig. 4, which is in agreement with our results.
The stellar evolution models are continued into the white dwarf phase by using the same mass loss parameters as in den Hartogh et al. (2019a, b). The comparison between all known white dwarf rotational periods (Kawaler, 2015; Hermes et al., 2017) and the rotational periods of the models when reaching the DAV temperature range are shown in Fig. 2. This histogram shows that most observed white dwarfs have rotational periods of two days or less, with the longest observed rotational period being 109.1 hours. We note that the observation method of Hermes et al. (2017) is sensitive to larger rotation periods up to 15 days, but the longest period they found was about 4.5 days.
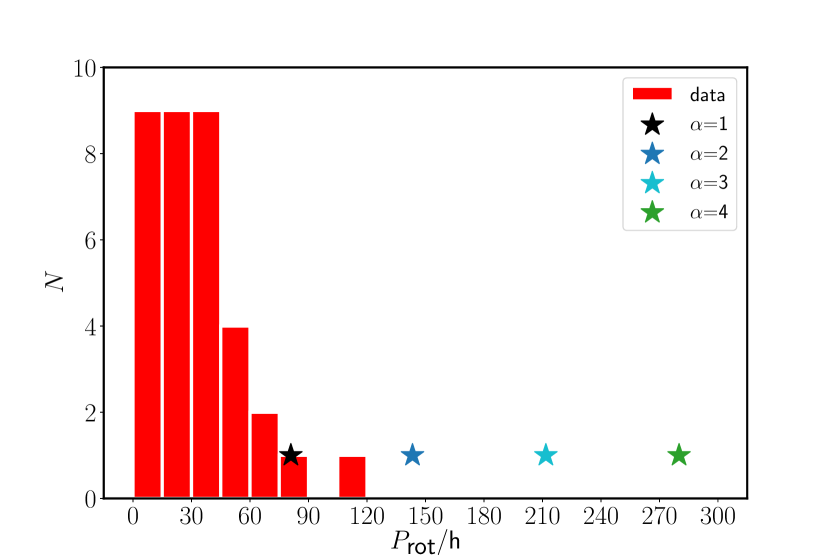
The white dwarf rotational periods of our models start at higher values. Specifically, the stellar models that match the rotation rates of Deheuvels et al. (2015), with =2-4, lead to white dwarf rotational periods that are all higher than the observed periods.
Similarly to the case with our results of the core He burning phase, we compare this result to the results presented in Fuller et al. 2019. In their Fig. 7, they compare their white dwarf rotational periods (all with =1) to the observed values. Our results agree that these models match the observations, however, as we explained before: the models with =1 do not match the low rotation rates of the clump stars analysed by Deheuvels et al. (2015), and other clump stars in the same initial mass range of 2-3 M⊙ by Mosser et al. (2012) and Tayar et al. (2019).
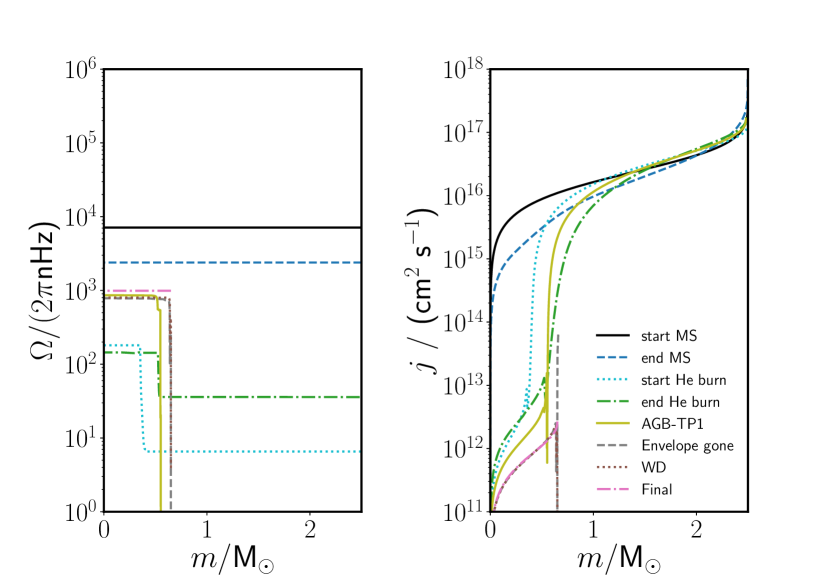
We further investigate the post-core He burning evolution of the core rotation rates by analysing the and specific angular momentum profiles throughout the stellar evolution. These profiles are shown in Fig. 3, from the start of the main sequence ‘start MS’ until the final model number in the calculation ’Final’, which is after the calculation has gone through the DAV temperature range. The transport of AM due to the Fuller-formalism leads to the decrease of a factor of 15 in the core rotation rate (left panel of Fig. 3) between the end of the main sequence and the start of core He burning. This decrease is also visible the profiles of . In contrast to the findings of Cantiello et al. (2014); den Hartogh et al. (2019a) however, there is also AM transport happening after the core He burning phase. This decrease of in the core of about one order of magnitude reduces the core rotation rate and, thus, increases the rotational periods we calculate for the white dwarfs. We therefore calculate stellar evolutionary models that include the Fuller-formalism until the end of the core He burning phase and exclude it going forward. The resulting white dwarf rotational periods for stellar evolution models with =1 and =4 are shown in Table 1 (as ‘1*’ and ‘4*’, respectively). These new periods are 35% and 25%. respectively, of the original period calculated with the inclusion of the Fuller-formalism throughout the evolution. This decrease is large enough for the new periods to fall within the observed range of white dwarf rotational periods.
| PDAV (hours) | |
| 1 | 81.0 |
| 2 | 143 |
| 3 | 212 |
| 4 | 280 |
| 1* | 28.4 |
| 4* | 70.0 |
4 Conclusions
In this letter, we test the Fuller-formalism in stellar evolutionary models with an initial mass of 2.5 M⊙. We investigate whether this formalism can lead to core rotation rates that match the observational range of rotation rates during the core He burning phase and the DAV temperature range. Our findings are:
- •
-
•
After continuing with these stellar models with =2-4 to the white dwarf phase, we found that the resulting white dwarf rotational periods are in the range of 81-280 hours;
-
•
The models that match the range of core He burning stars of Deheuvels et al. (2015) do not match the observed white dwarf rotation rates, and vice versa;
-
•
The range of observed white dwarf rotation rates is matched when the Fuller-formalism is only included from the start of the main-sequence to the end of core He burning.
Therefore, it is important to use caution when adopting the Fuller-formalism in stellar evolution models. The formalism, based on Eggenberger et al. 2019b, c and this work, is not likely to be the sole missing piece in the process of AM transport, but could still could be be part of the solution. It is possible that a physical reason behind the exclusion of the Fuller-formalism at the end of core He burning may be found, which would lead to a more favourable judgement of the formalism when included in stellar evolution models of intermediate-mass stars.
Acknowledgements.
We thank Henk Spruit for useful discussions. This work has been supported by the European Research Council (ERC-2016-CO Grant 724560), and the EU COST Action CA16117 (ChETEC). PE acknowledges support by the European Research Council (ERC grant agreement No 833925). SD acknowledges support from the project BEAMING ANR-18-CE31- 0001 of the French National Research Agency (ANR).References
- Aerts et al. (2019) Aerts, C., Mathis, S., & Rogers, T. M. 2019, ARA&A, 57, 35
- Beck et al. (2012) Beck, P. G., Montalban, J., Kallinger, T., et al. 2012, Nature, 481, 55
- Cantiello et al. (2014) Cantiello, M., Mankovich, C., Bildsten, L., Christensen-Dalsgaard, J., & Paxton, B. 2014, ApJ, 788, 93
- Ceillier et al. (2013) Ceillier, T., Eggenberger, P., García, R. A., & Mathis, S. 2013, A&A, 555, A54
- Chaboyer et al. (1995) Chaboyer, B., Demarque, P., & Pinsonneault, M. H. 1995, ApJ, 441, 865
- Deheuvels et al. (2015) Deheuvels, S., Ballot, J., Beck, P., & Mosser, B. 2015, A&A, 580
- Deheuvels et al. (2014) Deheuvels, S., Doğan, G., Goupil, M. J., et al. 2014, A&A, 564, A27
- Deheuvels et al. (2012) Deheuvels, S., García, R. A., Chaplin, W. J., et al. 2012, ApJ, 756, 19
- Deheuvels et al. (2017) Deheuvels, S., Ouazzani, R. M., & Basu, S. 2017, A&A, 605, A75
- den Hartogh et al. (2019a) den Hartogh, J. W., Eggenberger, P., & Hirschi, R. 2019a, A&A, 622, A187
- den Hartogh et al. (2019b) den Hartogh, J. W., Hirschi, R., Lugaro, M., et al. 2019b, A&A, 629, A123
- Denissenkov et al. (2010) Denissenkov, P. A., Pinsonneault, M., Terndrup, D. M., & Newsham, G. 2010, ApJ, 716, 1269
- Di Mauro et al. (2016) Di Mauro, M. P., Ventura, R., Cardini, D., et al. 2016, ApJ, 817, 65
- Di Mauro et al. (2018) Di Mauro, M. P., Ventura, R., Corsaro, E., & Lustosa De Moura, B. 2018, ApJ, 862, 9
- Eggenberger et al. (2019b) Eggenberger, P., Buldgen, G., & Salmon, S. J. A. J. 2019b, A&A, 626, L1
- Eggenberger et al. (2019c) Eggenberger, P., den Hartogh, J. W., Buldgen, G., et al. 2019c, A&A, 631, L6
- Eggenberger et al. (2005) Eggenberger, P., Maeder, A., & Meynet, G. 2005, A&A, 440, L9
- Eggenberger et al. (2012) Eggenberger, P., Montalbán, J., & Miglio, A. 2012, A&A, 544, L4
- Fuller et al. (2019) Fuller, J., Piro, A. L., & Jermyn, A. S. 2019, MNRAS, 485, 3661
- Gehan et al. (2018) Gehan, C., Mosser, B., Michel, E., Samadi, R., & Kallinger, T. 2018, A&A, 616, A24
- Goupil et al. (2013) Goupil, M. J., Mosser, B., Marques, J. P., et al. 2013, A&A, 549, A75
- Hermes et al. (2017) Hermes, J. J., Gänsicke, B. T., Kawaler, S. D., et al. 2017, ApJS, 232, 23
- Herwig (2005) Herwig, F. 2005, ARA&A, 43, 435
- Käppeler et al. (2011) Käppeler, F., Gallino, R., Bisterzo, S., & Aoki, W. 2011, Rev. Mod. Phys., 83, 157
- Karakas & Lattanzio (2014) Karakas, A. I. & Lattanzio, J. C. 2014, PASA, 31, e030
- Kawaler (2015) Kawaler, S. D. 2015, in Astronomical Society of the Pacific Conference Series, Vol. 493, 19th European Workshop on White Dwarfs, ed. P. Dufour, P. Bergeron, & G. Fontaine, 65
- Kissin & Thompson (2015) Kissin, Y. & Thompson, C. 2015, ApJ, 808, 35
- Marques et al. (2013) Marques, J. P., Goupil, M. J., Lebreton, Y., et al. 2013, A&A, 549, A74
- Mosser et al. (2012) Mosser, B., Goupil, M. J., Belkacem, K., et al. 2012, A&A, 548, A10
- Paxton et al. (2011) Paxton, B., Bildsten, L., Dotter, A., et al. 2011, ApJS, 192, 3
- Paxton et al. (2013) Paxton, B., Cantiello, M., Arras, P., et al. 2013, ApJS, 208, 4
- Paxton et al. (2015) Paxton, B., Marchant, P., Schwab, J., et al. 2015, ApJS, 220, 15
- Pinsonneault et al. (1989) Pinsonneault, M. H., Kawaler, S. D., Sofia, S., & Demarque, P. 1989, ApJ, 338, 424
- Rogers et al. (2013) Rogers, T. M., Lin, D. N. C., McElwaine, J. N., & Lau, H. H. B. 2013, ApJ, 772, 21
- Spruit (2002) Spruit, H. C. 2002, A&A, 381, 923
- Suijs et al. (2008) Suijs, M. P. L., Langer, N., Poelarends, A.-J., et al. 2008, A&A, 481, L87
- Tayar et al. (2019) Tayar, J., Beck, P. G., Pinsonneault, M. H., García, R. A., & Mathur, S. 2019, arXiv e-prints, arXiv:1911.01443
- Tayar & Pinsonneault (2018) Tayar, J. & Pinsonneault, M. H. 2018, ApJ, 868, 150