Discovery of a new supernova remnant G21.83.0
Abstract
Sensitive radio continuum surveys of the Galactic plane are ideal for discovering new supernova remnants (SNRs). From the Sino-German 6 cm polarisation survey of the Galactic plane, an extended shell-like structure has been found at , which has a size of about 1. New observations were made with the Effelsberg 100-m radio telescope at 11 cm to estimate the source spectrum together with the Urumqi 6 cm and the Effelsberg 21 cm data. The spectral index of G21.83.0 was found to be . Polarised emission was mostly detected in the eastern half of G21.83.0 at both 6 cm and 11 cm. These properties, together with the H filament along its northern periphery and the lack of infrared emission, indicate that the emission is non-thermal as is usual in shell-type SNRs.
keywords:
ISM: supernova remnants – ISM: individual objects: G21.83.0 – radio continuum: general – Methods: observational1 Introduction
Supernova explosions process the Galactic interstellar medium (ISM) and enhance dynamics in the Galaxy by e.g. accelerating particles, enriching chemical elements, and triggering the next generation of star formation (Padmanabhan, 2001). The remnants glow for more than hundreds of thousands years when interacting with the ISM. The total count of these Galactic supernova remnants (SNRs), as a basic parameter, is however still unclear. A large deficiency exists between the predicted (Li et al., 1991; Tammann et al., 1994) and the observed number (Ferrand & Safi-Harb, 2012; Green, 2019). To bridge this gap, extensive discoveries of new SNRs depend on deeper radio continuum surveys to unveil the faint cases, and sharper views to separate small structures, especially toward the inner Galaxy (e.g. Brogan et al., 2006). Recently, a big step was made by Anderson et al. (2017): through combining the radio continuum data from “The H i, OH, Recombination line survey of the Milky Way” (THOR, angular resolution 20), the VLA 1.4 GHz Galactic Plane Survey (VGPS, angular resolution 1, Stil et al., 2006), and the Effelsberg 21 cm survey (Reich et al., 1990, angular resolution 9), they identified 76 new SNR candidates in the area of and . A number of new SNRs have also been identified through very careful inspections in arcmin-resolution images of very sensitive large-scale radio surveys (e.g. Foster et al., 2013; Kothes et al., 2014; Gerbrandt et al., 2014; Kothes et al., 2017) and occasionally from deep H observations (e.g. Fesen & Milisavljevic, 2010; Fesen et al., 2015).
Using the data of the Sino-German 6 cm polarisation survey of the Galactic plane111Data available at http://www.mpifr-bonn.mpg.de/survey.html and http://zmtt.bao.ac.cn/6cm/surveydata.html (Sun et al., 2007; Gao et al., 2010; Sun et al., 2011; Xiao et al., 2011), we discovered three new SNRs: G25.12.3 and G178.24.2 by Gao et al. (2011) and G150.3+4.5 by Gao & Han (2014). Here we report the discovery of a new shell-like SNR, G21.83.0. We introduce the basic data in Sect. 2, and discuss the properties of G21.83.0 in Sect. 3. A summary is given in Sect. 4.
2 Basic data
2.1 Urumqi 6 cm data
The 6 cm total-intensity (Stokes ) and linear-polarisation (Stokes and ) data were extracted from the Sino-German 6 cm polarisation survey of the Galactic plane. The data were acquired by the Urumqi 25-m radio telescope of Xinjiang Astronomical Observatory, equipped with a single-channel receiver constructed by the Max-Planck-Institut für Radioastronomie, Germany. The angular resolution of the survey is 95. The sensitivity is about 1.0 mK for and 0.5 mK for / in the inner Galactic part of the survey. Details on the 6 cm receiving system, observation strategy, set-up and data reduction were described in Sun et al. (2006, 2007) and Gao et al. (2010). SNRs with surface brightness larger than [] (3 detection limit) could be detected in this survey (Gao et al., 2010).
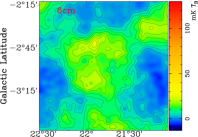
An extended shell-like source, G21.83.0 (see Fig. 1), with associated polarised emission was found at , which has a size of about 1.
2.2 Effelsberg 11 cm data
To reveal the properties of G21.83.0, new 11 cm total-intensity and linear-polarisation observations were made with the Effelsberg 100-m radio telescope in October, 2018. We decided not to use the standard 8-channel 80-MHz bandwidth backend centred at 2639.5 MHz, with which tests in December 2017 showed that strong radio interference (RFI) reduced the usable bandwidth to 40 MHz. Instead, the 2-GHz wide SPECPOL polarimeter with 1024 channels available at the Effelsberg telescope was successfully attached to the receiver to check the RFI situation outside the standard 80-MHz band. Although the spectrometer covered the band from 2300 MHz to 4300 MHz, the filter in the 11 cm frontend limits the accessible frequency range from 2599.5 MHz to 2679.5 MHz. The test was successful and showed that in total four frequency bands were usable. The remaining RFI could be removed either by software or by data editing. The four bands cover in total about 185 MHz, which improves on the bandwidth available so far. The four bands were centred at 2376.25 MHz, 2553.75 MHz, 2658.0 MHz, and 2696.25 MHz and have a usable bandwidth of 32.5 MHz, 117.5 MHz, 8 MHz, and 27.5 MHz, respectively. The NOD2-based data reduction of G21.83.0 followed the same routines as for the 6 cm data (Gao et al., 2010). The angular resolutions of the four sections are slightly different, from 42 to 47. After data reduction, we added them after convolving all the images to 48. The sensitivity of the combined data is about 5.0 mK and 4.5 mK for and /, respectively. We note, however, that the final noise does not fully reflect the increase in bandwidth when compared to earlier 11 cm observations. This indicates either the existence of low-level RFI in- or out-side the selected bands and requires further tests for optimisation in the future.
2.3 Effelsberg 21 cm data
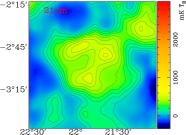
The 21 cm total-intensity data of G21.83.0 came from the Effelsberg survey (Reich et al., 1990). Polarisation data were not available. The central observing frequency of the survey was 1408 MHz. The bandwidth was often set to 20 MHz. The beam size is 94, nearly identical to that of the Urumqi 6 cm survey. Typical r.m.s. of the noise was about 40 mK . The high angular resolution Canadian Galactic Plane Survey (CGPS, Landecker et al., 2010) and VGPS (Stil et al., 2006), which surveyed the Galactic plane both in radio continuum and H i, do not cover this area.
2.4 Other data
Besides the radio continuum data, additional data were also used to study the properties of G21.83.0. The optical H data were taken from the Southern H Sky Survey Atlas (hereafter SHASSA, Gaustad et al., 2001). Two sets of infrared data around G21.83.0 were adopted for comparison with the radio continuum emission. The 60m data were from the Improved Reprocessing of the Infrared Astronomical Satellite Survey (IRIS, Miville-Deschênes & Lagache, 2005). The 12m and 22m WISE data (Wright et al., 2010) and the WISE H ii region catalogue222http://astro.phys.wvu.edu/wise/ (Anderson et al., 2014) were also consulted. In addition, the X-ray data from ROSAT all-sky survey (Voges et al., 1999) and Chandra Observatory333https://cda.harvard.edu/chaser/, -ray sources identified in the HESS and HAWC (Jardin-Blicq et al., 2019) have also been checked for a high-energy counterpart associated with G21.83.0. H i data from the Parkes Galactic all-sky survey (McClure-Griffiths et al., 2009; Kalberla et al., 2010) and the 12CO() data from Dame et al. (2001) were checked for a possible coincident structure to estimate the distance of G21.83.0.
|
|
|
| Source | |||
|---|---|---|---|
| (mJy) | (mJy) | (mJy) | |
| G22.083.19 | 37.7 | 35.5∗ | 33.3∗ |
| G21.932.72 | 115.6 | 77.7 | 64 |
| G21.662.79 | 102.0 | 83.6 | 67.9∗ |
Notes: values with ∗ are extrapolated.
3 Properties of G21.83.0
3.1 Radio structure, polarisation and spectral index


|
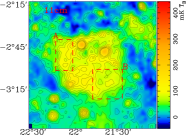
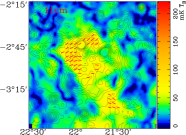
We show total-intensity () images of G21.83.0 from the Urumqi 6 cm survey, the new Effelsberg 11 cm observations (a combination of the four individual bands) and the archived Effelsberg 21 cm survey in the top panels of Fig. 1. With the higher angular resolution of 48, more details of G21.83.0 are visible at 11 cm. G21.83.0 has a nearly circular shape with a diameter of about 1. Enhanced total-intensity emission is seen in a partial shell structure extending from northeast to north and a small circular section in the southeast. Three point-like sources were identified: G21.932.72 with a spectral index of (Vollmer et al., 2010), the planetary nebula G22.083.19 (Frew et al., 2013), and G21.662.79 about which not much information is available in literature. We list their flux densities at 21 cm, 11 cm, and 6 cm in Table 1. All values are retrieved from the NVSS source catalogue (Condon et al., 1998). The values of G21.932.72 and G21.662.79 are derived from Gaussian fits to the newly observed Effelsberg 11 cm data and the value for G21.932.72 is taken from the PWN survey (Wright et al., 1994). Their contributions were subtracted so that the flux densities of the extended source G21.83.0 at these three bands can be estimated.
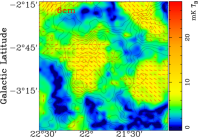
The (Polarised Intensity, ) images at 6 cm and 11 cm are shown in the middle panels of Fig. 1. The orientation of -field vectors of the polarised emission seems to be uniform, implying the presence of regular magnetic fields. Strong polarised emission is seen outside G21.83.0 at 6 cm without any corresponding total-intensity counterparts. These patches are either Faraday screens or caused by the turbulent magnetic fields as discussed in Sun et al. (2011). By comparing the polarisation angles (s, ) at these two bands, the rotation measure (, ) of the source can be estimated. For the region with prominent polarised emission, i.e. the eastern part of G21.83.0, we obtained an averaged of 80 rad m-2 with n ambiguity of 312 rad m-2 from the 6 cm data and the combined 11 cm data (the central frequency was taken as 2536.25 MHz) convolved to 95. This result was tested by the data at the high end (2696.25 MHz) and the low end (2376.25 MHz) of the new 11 cm observations at the angular resolution of 48. We got a consistent of 90 rad m-2. The n ambiguity is about 864 rad m-2, which seems very unlikely and implies that 80 – 90 rad m-2 of G21.83.0 is most likely convincing. No s of extra-Galactic sources behind G21.83.0 are available to diminish the ambiguity (Xu & Han, 2014).
The radio continuum spectral index is a key to distinguish the non-thermal synchrotron emission from SNRs and thermal bremsstrahlung radiation from H ii regions. Most shell-type SNRs have a spectral index around () (see Urošević, 2014; Dubner, 2017), which makes them distinct from the optically-thin emission of H ii regions with a much flatter spectrum of (see Wilson et al., 2013). To estimate the flux densities of G21.83.0 at each frequency, a twisted plane was fitted and subtracted in each map to remove the unrelated foreground/background emission before integration. We got = 1.70.2 Jy, = 2.80.4 Jy, and = 4.10.6 Jy for G21.83.0 after the point-like sources were subtracted. The radio continuum spectrum was fitted and is shown in the left panel of Fig. 2. The spectral index is , which clearly indicates the non-thermal nature of G21.83.0.
The TT (Temperature - Temperature) plot method introduced by Turtle et al. (1962) has been widely used to reveal the spectral index of an extended emission because it is insensitive to zero-level uncertainties of images. Taking the notion that , where is the temperature of the target source and is defined as the brightness temperature spectral index, the temperature map observed at frequency can be described as . Here, is the baselevel offset. By substituting , it is then straightforward to have , implying that the slope of linear regression in TT-plots can be used to derive source spectral index and the baselevel offsets included in the intercept do not have any influence on the slope. Considering the flux density for the radio image and , one can relate the flux density and brightness temperature spectral indices as . For G21.83.0, two areas were selected (marked as A and B in the top middle panel of Fig. 1) for TT-plots, which are free from point-like source contamination by inspecting the high angular resolution NVSS image. Region A is the shell-like structure in the northeastern part of G21.83.0, and Region B is an area which is relatively weak in emission. The TT-plots give the brightness temperature spectral indices as being and between the 6 cm and 21 cm data for Region A and B, respectively, very consistent with the result derived from the flux densities at the three bands.
Based on the flux density measured at 6 cm and the fitted spectral index of , we estimated the surface brightness of G21.83.0 at 1 GHz to be [], placing it at the fainter end of the known Galactic SNRs (see Fig. 1 in Green, 2014).
3.2 Properties at optical, infrared and high-energy bands
Some SNRs do show features at optical and infrared bands, and a few were even newly identified from optical observations, e.g. SNRs G159.6+7.3 and G70.021.5 discovered through deep H observations (Fesen & Milisavljevic, 2010; Fesen et al., 2015).
We extracted the continuum-corrected H emission from SHASSA (Gaustad et al., 2001) for the G21.83.0 field as shown in the bottom left panel of Fig. 1. The image was slightly smoothed to 4 from the original 32 resolution. For the planetary nebula G22.083.19, bright H emission is visible. Some diffuse H emission overlaps the lower part of G21.83.0, however, no solid correlation can be established. The most interesting feature seen in the H image is an elongated filament nicely running along the northern edge of G21.83.0. It is necessary to confirm with other optical lines, such as and (e.g. Fesen et al., 1985; Kopsacheili et al., 2019) whether it is a shock emission filament.
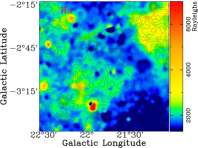
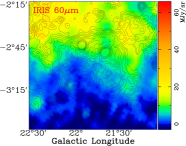
The IRIS 60m image of G21.83.0 is shown in the bottom middle panel of Fig. 1. The WISE images, which we did not present, resemble the structures in the IRIS map, but show more point sources due to their higher angular resolution. No catalogued WISE H ii regions (Anderson et al., 2014) are found in this region. SNRs have faint far-infrared emission compared to H ii regions (Fürst et al., 1987) and lack mid-infrared emission (Anderson et al., 2017). No clear morphological correlation is found between the infrared (IRIS and WISE) and radio images of G21.83.0. Based on the comparison between the 60m infrared and Effelsberg 11 cm data, Fürst et al. (1987) found that the infrared to radio continuum ratio is as high as 1000500 for H ii regions, and proposed that the 11 cm sources with < 250 could be SNR candidates. We found low values, i.e. 80 in the lower part and 240 in the upper part of G21.83.0, which support its SNR nature.
No X-ray counterpart was found for G21.83.0 from the ROSAT X-ray All-Sky Survey data in both low (0.1 – 0.4 keV) and high (0.4 – 2.4 keV) bands (Voges et al., 1999) and the archived data from the Chandra X-ray observatory. We also failed to find any discrete source that might be associated with G21.83.0 in the high-energy Galactic plane surveys from HESS and HAWC (Jardin-Blicq et al., 2019) and the Fermi 4FGL catalogue (The Fermi-LAT collaboration, 2019).
3.3 Possibly associated gas structure and the distance
Among the 294 known Galactic SNRs (Green, 2019), 70 of them have physical contact with the surrounding molecular clouds (MCs, e.g. Chen et al., 2014). The kinematic distance therefore can be estimated from the systematic velocity of the associated MCs (e.g. Foster et al., 2013). We explored the possible SNR-MC association i.e. morphological agreement or corresponding MC features (e.g. cavities, bubbles) with that of G21.83.0.

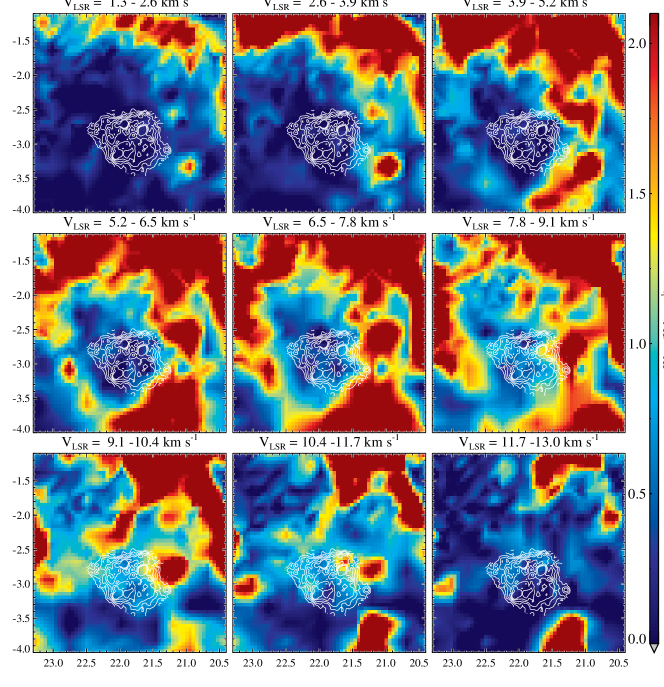
The 12CO() survey data from Dame et al. (2001), which have an angular resolution of 84 and a velocity resolution of 0.65 km s-1 (see Table 1 of Dame et al., 2001), are adopted in this work. As shown in Fig. 4, we averaged the CO spectra in the sky area surrounding G21.83.0 (see Fig. 3) and found two major emission features near km s-1 and 55 km s-1, respectively. By checking the channel maps around km s-1, the emission is very extended and originates from the Galactic plane, i.e. , which is 07 above the radio continuum emission, hence is not related to G21.83.0. For the emission component of km s-1, we show the 12CO() intensity maps integrated in the velocity range of 1.3 13.0 km s-1 in steps of 1.3 km s-1 in Fig. 3. A cavity-like CO feature is seen to encircle the radio-continuum emission of G21.83.0 in the velocity range of km s-1. The southwestern edge of G21.83.0 follows the wall of the cavity. The northeastern part of the cavity extends beyond the continuum emission, and is not coincident with any discrete sources in the Urumqi 6 cm image. In the velocity channels of km s-1 or 7.8 km s-1, the cavity becomes weak and disappears. The systematic velocity of this cavity-like CO emission peaks at km s-1, which is used to estimate the kinematic distance of G21.83.0 by adopting Galaxy rotation models.
Two methods were used. One is the revised kinematic distance calculator provided by Reid et al. (2014) with the parameters of kpc (distance from the Sun to the Galactic centre), km s-1 (circular rotation of the local standard of rest), and the revised Solar motions. The derived nearer kinematic distance is 0.42 kpc. The other method is a parallax-based distance estimator for Galactic sources (Reid et al., 2016): the estimated distance is 0.250.13 kpc, comparable to that of the nearest Galactic SNR Vela (Caraveo et al., 2001). These two results are consistent within their errors, locating G21.83.0 in the Local Arm (e.g. Xu et al., 2018). Based on Green (2019), there are less than 10 SNRs that have a measured distance within 1 kpc. The discovery of G21.83.0 would enhance the near-Earth SNR rate and it probably has made some impact on Earth as discussed in Firestone (2014).
In comparison with the northeastern shell of G21.83.0, the radio emission of the southwestern edge, visually contacting the CO clouds, is relatively weak and does not form a shell, which might imply that the progenitor star exploded in a pre-existing molecular cavity and the free-expansion shock just reached or interacted with the wall.
We checked the H i 21-cm survey data of the Parkes Galactic all-sky survey (McClure-Griffiths et al., 2009; Kalberla et al., 2010), which has an effective angular resolution of with a velocity resolution of 1.0 km s-1. The H i emission in this region is very diffuse and complex. No related structures can be firmly identified in the velocity range of 50 km s-1 – 200 km s-1.
3.4 Size, age and brightness
Taking the average kinematic distance of 330 pc derived from the CO data, the diameter of G21.83.0 is just about 6 pc. Such a small physical size is an indication of young SNRs. The spectral index of G21.83.0, , resembles that of some historical SNRs such as Cas A (), SN 1006 () and Tycho () (Green, 2019). However, unlike the radial magnetic fields present in these young SNRs (Reynoso et al., 2013; Reich, 2016), the current images for polarised emission of G21.83.0 seems to be patchy (see Fig. 1). Multi-frequency polarisation observations with better angular resolution are needed to clarify the detailed configuration of the magnetic fields in G21.83.0.
In the case that G21.83.0 is not young, the small physical size requires a low initial explosion energy and/or a high ambient density into which it expands (Sedov, 1959). However, as we failed to identify any related H i structures, it is difficult to estimate the initial ambient number density and further the age of G21.83.0 as done by Su et al. (2017) and Kothes et al. (2017). For the shell-type SNRs, distance and diameter can also be estimated from the empirical radio surface brightness – diameter (-D) relation. By collecting 65 shell-type SNRs with direct distance estimates as the calibration sample, Pavlović et al. (2014) found a new steeper slope for the -D relation. Based on this relation, we get a physical size of more than 40 pc for the case of G21.83.0, so that the distance of this SNR is larger than 2.3 kpc, much more distant than the value obtained from the CO cavity. Note that distances estimated from the -D relation have an uncertainty as large as 35% or more due to several facts, e.g. the intrinsic properties of SNRs, the environments where SNRs evolve, and the selection effects of the calibration sample (Green, 1984; Pavlović et al., 2013; Kostić et al., 2016). We therefore emphasise that the distance of G21.83.0 is still an open issue, which may be settled by new CO/H i data with higher angular resolution and sensitivity or future finding of 1720-MHz OH masers due to SNR-MC interactions, or even using red clump stars or dust extinction (e.g. Shan et al., 2018; Yu et al., 2019).
3.5 Associated pulsar?
We searched in the ATNF pulsar catalogue444http://www.atnf.csiro.au/research/pulsar/psrcat/ for associated pulsars, that may also hint the distance of G21.83.0. PSR J18431113 () with a distance of 1.26 kpc is outside G21.83.0 but not far away. In the case that it is a run-away pulsar from the centre, the proper motion should confirm this. We found that the measured velocity vector of PSR J18431113 (Desvignes et al., 2016) did not match the presumed path, i.e. tracing back to the centre of G21.83.0, therefore, seems not to be related. PSR J18401122 (, Hobbs et al., 2004) overlaps G21.83.0. The distance of the pulsar is about 8.21 kpc, on the Far 3-kpc Arm according to Hou & Han (2014). No proper motion information is available yet. If this SNR-pulsar association could be confirmed, the physical size of G21.83.0 would be 140 pc, which is exceptionally large. This is unlikely and the overlap may be just a coincidence.
No pulsars were identified as stated above implying the progenitor of G21.83.0 might not be a massive star. No flat-spectrum component was seen inside G21.83.0, indicating the non-existence of a pulsar wind nebula at the current detection sensitivity.
4 Summary
Sensitive large-scale radio continuum surveys are crucial for discovering Galactic SNRs with low surface brightness. By identifying radio sources in the Sino-German 6 cm polarisation survey of the Galactic plane, we serendipitously discovered the extended object G21.83.0, which has a circular shape with a diameter of about 1. To reveal the radio emission properties, new 11 cm observations were carried out with the Effelsberg 100-m radio telescope. Together with the Effelsberg 21 cm data, the radio continuum spectral index was derived to be , consistent with that of synchrotron emission from SNRs. Polarised emission from G21.83.0 was detected both at 6 cm and 11 cm. By comparing polarisation angles, the of G21.83.0 was estimated to be 80 – 90 rad m-2. An H filament is seen to run along the northern edge of G21.83.0. The weak infrared emission of the source exemplifies its SNR nature. A cavity-like CO feature was found in the direction of G21.83.0 at = 5.92 km s-1. If related to G21.83.0, its distance is about 330 pc, which means it is a local-arm object, however, the -D relation for shell-type SNRs results in a much farther distance.
Acknowledgements
We thank the anonymous referee for useful comments that improved this work, and Dr. James Wicker and Dr. David Champion for their kindness on language editing. We would like to thank Dr. Alex Kraus and Dr. Peter Müller for support with the observations and data reduction, and also the electronics group at Effelsberg for connecting the SPECPOL polarimeter with the 11 cm receiver. This research is based in part on observations with the Effelsberg 100-m telescope of the MPIfR, Bonn. The Chinese authors are supported by the National Natural Science Foundation of China (No. 11988101, U1831103, 11933011, 11833009), the National Key R&D Program of China (No. 2017YFA0402701), the Open Project Program of the Key Laboratory of FAST, NAOC, the Chinese Academy of Sciences, and the Partner group of the MPIfR at NAOC in the framework of the exchange programme between MPG and CAS for many bilateral visits. XYG acknowledges financial support from the CAS-NWO cooperation programme. LGH is grateful for the support by the Youth Innovation Promotion Association CAS.
References
- Anderson et al. (2014) Anderson L. D., Bania T. M., Balser D. S., Cunningham V., Wenger T. V., Johnstone B. M., Armentrout W. P., 2014, ApJS, 212, 1
- Anderson et al. (2017) Anderson L. D., et al., 2017, A&A, 605, A58
- Brogan et al. (2006) Brogan C. L., Gelfand J. D., Gaensler B. M., Kassim N. E., Lazio T. J. W., 2006, ApJ, 639, L25
- Caraveo et al. (2001) Caraveo P. A., De Luca A., Mignani R. P., Bignami G. F., 2001, ApJ, 561, 930
- Chen et al. (2014) Chen Y., Jiang B., Zhou P., Su Y., Zhou X., Li H., Zhang X., 2014, in Ray A., McCray R. A., eds, IAU Symposium Vol. 296, Supernova Environmental Impacts. pp 170–177 (arXiv:1304.5367), doi:10.1017/S1743921313009423
- Condon et al. (1998) Condon J. J., Cotton W. D., Greisen E. W., Yin Q. F., Perley R. A., Taylor G. B., Broderick J. J., 1998, AJ, 115, 1693
- Dame et al. (2001) Dame T. M., Hartmann D., Thaddeus P., 2001, ApJ, 547, 792
- Desvignes et al. (2016) Desvignes G., et al., 2016, MNRAS, 458, 3341
- Dubner (2017) Dubner G., 2017, Radio Emission from Supernova Remnants, Handbook of Supernovae Springer International Publishing AG, 2017. p. 2041, doi:10.1007/978-3-319-21846-5_91
- Ferrand & Safi-Harb (2012) Ferrand G., Safi-Harb S., 2012, Advances in Space Research, 49, 1313
- Fesen & Milisavljevic (2010) Fesen R. A., & Milisavljevic D., 2010, AJ, 140, 1163
- Fesen et al. (1985) Fesen R. A., Blair W. P., Kirshner R. P., 1985, ApJ, 292, 29
- Fesen et al. (2015) Fesen R. A., Neustadt J. M. M., Black C. S., Koeppel A. H. D., 2015, ApJ, 812, 37
- Firestone (2014) Firestone R. B., 2014, ApJ, 789, 29
- Foster et al. (2013) Foster T. J., Cooper B., Reich W., Kothes R., West J., 2013, A&A, 549, A107
- Frew et al. (2013) Frew D. J., Bojičić I. S., Parker Q. A., 2013, MNRAS, 431, 2
- Fürst et al. (1987) Fürst E., Reich W., Sofue Y., 1987, A&AS, 71, 63
- Gao & Han (2014) Gao X. Y., & Han J. L., 2014, A&A, 567, A59
- Gao et al. (2010) Gao X. Y., et al., 2010, A&A, 515, A64
- Gao et al. (2011) Gao X. Y., Sun X. H., Han J. L., Reich W., Reich P., Wielebinski R., 2011, A&A, 532, A144
- Gaustad et al. (2001) Gaustad J. E., Rosing W., McCullough P., Van Buren D., 2001, in B. Paczynski, W.-P. Chen, & C. Lemme ed., Astronomical Society of the Pacific Conference Series Vol. 246, IAU Colloq. 183: Small Telescope Astronomy on Global Scales. p. 75
- Gerbrandt et al. (2014) Gerbrandt S., Foster T. J., Kothes R., Geisbüsch J., Tung A., 2014, A&A, 566, A76
- Green (1984) Green D. A., 1984, MNRAS, 209, 449
- Green (2014) Green D. A., 2014, in Ray A., McCray R. A., eds, IAU Symposium Vol. 296, Supernova Environmental Impacts. pp 188–196 (arXiv:1309.3072), doi:10.1017/S1743921313009459
- Green (2019) Green D. A., 2019, Journal of Astrophysics and Astronomy, 40, 36
- Hobbs et al. (2004) Hobbs G., Lyne A. G., Kramer M., Martin C. E., Jordan C., 2004, MNRAS, 353, 1311
- Hou & Han (2014) Hou L. G., & Han J. L., 2014, A&A, 569, A125
- Jardin-Blicq et al. (2019) Jardin-Blicq A., Marandon V., Brun F., 2019, in 36th International Cosmic Ray Conference (ICRC2019). p. 706 (arXiv:1908.06658)
- Kalberla et al. (2010) Kalberla P. M. W., et al., 2010, A&A, 521, A17
- Kopsacheili et al. (2019) Kopsacheili M., Zezas A., Leonidaki I., 2019, arXiv e-prints, p. arXiv:1909.05879
- Kostić et al. (2016) Kostić P., Vukotić B., Urošević D., Arbutina B., Prodanović T., 2016, MNRAS, 461, 1421
- Kothes et al. (2014) Kothes R., Sun X. H., Reich W., Foster T. J., 2014, ApJ, 784, L26
- Kothes et al. (2017) Kothes R., Reich P., Foster T. J., Reich W., 2017, A&A, 597, A116
- Landecker et al. (2010) Landecker T. L., et al., 2010, A&A, 520, A80
- Li et al. (1991) Li Z., Wheeler J. C., Bash F. N., Jefferys W. H., 1991, ApJ, 378, 93
- McClure-Griffiths et al. (2009) McClure-Griffiths N. M., et al., 2009, ApJS, 181, 398
- Miville-Deschênes & Lagache (2005) Miville-Deschênes M., & Lagache G., 2005, ApJS, 157, 302
- Padmanabhan (2001) Padmanabhan T., 2001, Theoretical Astrophysics - Volume 2, Stars and Stellar Systems. Cambridge University Press, doi:10.2277/0521562414.
- Pavlović et al. (2013) Pavlović M. Z., Urošević D., Vukotić B., Arbutina B., Göker Ü. D., 2013, ApJS, 204, 4
- Pavlović et al. (2014) Pavlović M. Z., Dobardzic A., Vukotic B., Urosevic D., 2014, Serbian Astronomical Journal, 189, 25
- Reich (2016) Reich W., 2016, in Supernova Remnants: An Odyssey in Space after Stellar Death. p. 60
- Reich et al. (1990) Reich W., Reich P., Fürst E., 1990, A&AS, 83, 539
- Reid et al. (2014) Reid M. J., et al., 2014, ApJ, 783, 130
- Reid et al. (2016) Reid M. J., Dame T. M., Menten K. M., Brunthaler A., 2016, ApJ, 823, 77
- Reynoso et al. (2013) Reynoso E. M., Hughes J. P., Moffett D. A., 2013, AJ, 145, 104
- Sedov (1959) Sedov L. I., 1959, Similarity and Dimensional Methods in Mechanics, Academic Press, New York
- Shan et al. (2018) Shan S. S., Zhu H., Tian W. W., Zhang M. F., Zhang H. Y., Wu D., Yang A. Y., 2018, ApJS, 238, 35
- Stil et al. (2006) Stil J. M., et al., 2006, AJ, 132, 1158
- Su et al. (2017) Su Y., Zhou X., Yang J., Chen Y., Chen X., Gong Y., Zhang S., 2017, ApJ, 845, 48
- Sun et al. (2006) Sun X. H., Reich W., Han J. L., Reich P., Wielebinski R., 2006, A&A, 447, 937
- Sun et al. (2007) Sun X. H., Han J. L., Reich W., Reich P., Shi W. B., Wielebinski R., Fürst E., 2007, A&A, 463, 993
- Sun et al. (2011) Sun X. H., Reich W., Han J. L., Reich P., Wielebinski R., Wang C., Müller P., 2011, A&A, 527, A74
- Tammann et al. (1994) Tammann G. A., Loeffler W., Schroeder A., 1994, ApJS, 92, 487
- The Fermi-LAT collaboration (2019) The Fermi-LAT collaboration 2019, arXiv e-prints, p. arXiv:1902.10045
- Turtle et al. (1962) Turtle A. J., Pugh J. F., Kenderdine S., Pauliny-Toth I. I. K., 1962, MNRAS, 124, 297
- Urošević (2014) Urošević D., 2014, Ap&SS, 354, 541
- Voges et al. (1999) Voges W., et al., 1999, A&A, 349, 389
- Vollmer et al. (2010) Vollmer B., et al., 2010, A&A, 511, A53
- Wilson et al. (2013) Wilson T. L., Rohlfs K., Hüttemeister S., 2013, Tools of Radio Astronomy, 6th edn. Springe-Verlag, Berlin, doi:10.1007/978-3-642-39950-3.
- Wright et al. (1994) Wright A. E., Griffith M. R., Burke B. F., Ekers R. D., 1994, ApJS, 91, 111
- Wright et al. (2010) Wright E. L., et al., 2010, AJ, 140, 1868
- Xiao et al. (2011) Xiao L., Han J. L., Reich W., Sun X. H., Wielebinski R., Reich P., Shi H., Lochner O., 2011, A&A, 529, A15
- Xu & Han (2014) Xu J., & Han J. L., 2014, MNRAS, 442, 3329
- Xu et al. (2018) Xu Y., Hou L.-G., Wu Y.-W., 2018, Research in Astronomy and Astrophysics, 18, 146
- Yu et al. (2019) Yu B., Chen B. Q., Jiang B. W., Zijlstra A., 2019, MNRAS, 488, 3129