SoLid: A short baseline reactor neutrino experiment
Abstract
The SoLid experiment, short for Search for Oscillations with a Lithium-6 detector, is a new generation neutrino experiment which tries to address the key challenges for high precision reactor neutrino measurements at very short distances from a reactor core and with little or no overburden. The primary goal of the SoLid experiment is to perform a precise measurement of the electron antineutrino energy spectrum and flux and to search for very short distance neutrino oscillations as a probe of eV-scale sterile neutrinos. This paper describes the SoLid detection principle, the mechanical design and the construction of the detector. It then reports on the installation and commissioning on site near the BR2 reactor, Belgium, and finally highlights its performance in terms of detector response and calibration.
1 Introduction
Sterile neutrinos, originally introduced by Bruno Pontecorvo in 1967 [1], are well-motivated in many extensions of the Standard Model as they appear in most of the possible mechanisms to explain neutrino masses. Apart from these theoretical considerations, the first hints appeared from accelerator-based neutrino experiments, LSND then MiniBoone, which have observed persistent anomalies, in electron neutrino appearance and muon neutrino disappearance [2, 3]. The second hints arose from solar neutrino experiments, SAGE and GALLEX, which measured a significant deficit of the neutrino flux, when using high-activity sources during calibration runs [4, 5, 6]. The third indication came in 2011 from the re-evaluation of the reactor flux obtained with a state-of-the-art prediction model. It exhibits a 6% average deficit on the measured antineutrino flux [7, 8, 9]. This deficit, known as the Reactor Antineutrino Anomaly (RAA), is significant at the 2.5 level.
Though some tensions persist when combining both LSND and MiniBoone results with reactor measurements, no phenomenological models are known to better fit all the data than those adding sterile neutrinos at a mass scale of order 1 eV2 [10, 11]. The search for such a sterile neutrino provides a clear motivation to measure the neutrino fluxes and spectra with dedicated experiments at very short baselines near nuclear reactors [12]. Several experiments world-wide have taken, or are taking physics data [13, 14, 15, 16, 17]. Some of these experiments already published constraints on the RAA allowed parameter space, that exclude the RAA best-fit point [8] at more than 95% C.L. [18, 19]. However, global fit analysis and others published results favour sterile neutrino oscillations at the 3 level [20, 21, 10]. In addition to reactor experiments, an active search is also performed by using accelerator decay-in-flight neutrino beams. The US is currently running the Booster Neutrino Beam (BNB) which will enable the deployment of multiple detectors at different baselines: SBND, MicroBooNE and ICARUS [22].
Besides the eV-scale neutrino search, recent precision measurements are all indicating a deviation in the energy spectrum shape, between 5 and 6 MeV [23, 24, 25], also known as the ’5 MeV bump’.
It is likely related to nuclear and reactor physics and thus puts the flux prediction and its uncertainties estimation into question [26]. Nuclear models are scrutinized and many dependencies are currently investigated: fission yields and their dependencies with neutron energy spectrum, beta spectrum shape and weak magnetism correction [27, 28], time-dependent relative contribution of fissile isotopes (, ) [29] or the energy response linearity of detectors [30]. In this context, the neutrino energy spectrum distortion is currently being investigated by very short baseline experiments near HEU (Highly Enriched Uranium) research reactor [19, 31].
SoLid, or Search for oscillations with a Lithium 6 detector, is a very short baseline neutrino oscillation
experiment, located near the BR2 reactor of the SCK
CEN
in Belgium. Its main purpose is to perform a precise measurement of the electron antineutrino
energy spectrum and flux as a function of the distance travelled by antineutrinos between the reactor
core and their interaction in the detector. These measurements will be primarily used to search
for the existence of one or more sterile neutrinos corresponding to mass eigenstates of order
eV2. Secondarily, the shape of the energy spectrum will serve as a reference
measurement for electron antineutrinos originating from the fission of 235U. In order to
achieve these goals, the SoLid experiment aims to detect electron antineutrinos with a target efficiency
of at least 10%, reconstruct their energy with a resolution of 14%/, and
obtain an overall Signal to Background ratio (S/B) of order unity, given that it operates with a minimal overburden of only 8 m water equivalent.
Operating very close to the reactor core and at sea level, where large cosmic and reactor backgrounds are
produced, combined with small installation spaces, represents several challenges in terms of background
rejection capabilities. Compared to the contemporary very-short baseline neutrino experiments near
reactors [13, 14, 15, 16, 32],
the SoLid detector has some unique features, which are described extensively in [33]. It uses
a finely 3D segmented plastic scintillator to detect electromagnetic energy deposits, combined with scintillation screens that contain 6Li that provide distinct nuclear induced signals. The use of high segmentation and the dual scintillator, provides particle discrimination, and aims to identify and reduce backgrounds. Moreover, the materials used, the robustness and compactness are also attractive for future reactor monitoring applications.
After demonstrating the applicability of the composite scintillator technology, a full-scale prototype module, SM1, with a fiducial mass of 288 kg was operated near the BR2 reactor in 2015. Based on the performance of the prototype module [34], improvements were made to the original detector design before proceeding to the construction of a 1.6 ton detector in 2016-2017. The SoLid detector installation was completed in February 2018 and was successfully commissioned near the BR2 reactor in spring 2018. In this paper, we will first give a complete description of the SoLid detector: its detection principle, its mechanical design, the construction phase and the quality assurance process. We will then describe the dedicated front-end electronics and the data acquisition system. In the third part, we will present the BR2 reactor core near which the SoLid experiment operates. The BR2 reactor has very little neutron and gamma background, due to its moderate thermal power, adequate shielding, and absence of other experiments in the vicinity of our experiment. Its core size is also very compact. Finally, we will present the data taking operation and describe how the detector response is simulated and how the experiment is calibrated in-situ. The SoLid experiment has collected data up to june 2020. However, this paper describes the detector commissioning, calibration and measurement stability for the first two years of data taking, covering the period July 2018 - August 2019.
2 Detector layout and design
2.1 Detection principle
The SoLid detector is designed to be a highly 3D segmented detector (8000 voxels/m3) based on a dual
scintillation technology. Electron antineutrinos will interact primarily in the active detector volume via inverse beta
decay (IBD) on hydrogen nuclei, producing a positron and a neutron in the final state: . Experimental approaches use the coincidence technique, which consists of detecting both the positron and the neutron, within a short time window, typically up to hundreds of microseconds [35]. The neutron generally thermalizes via elastic collisions in the detector,
after which it can be captured by nuclei with a high neutron capture cross section. As such it typically induces a
scintillation signal that is delayed in time with respect to the scintillation light caused by the
positron and its corresponding annihilation gamma-ray photons. The time delay between the two signals can
be tuned by the choice of neutron capture elements and their concentration and distribution in
the detector. Neutrino oscillation experiments typically vary in their choice of scintillator, the neutron
capture element, and the way these are incorporated in the scintillator [36, 37, 38, 39, 40, 41, 42, 43].
SoLid opted for a combination of two scintillators. One is polyvinyl toluene (PVT), a relatively cheap plastic scintillator that is generally easy to machine in any desired shape or geometry, and the other is ZnS(Ag) used together with 6LiF to capture thermal neutrons via the reaction:
| (2.1) |
for which the decay products in turn induces scintillation in the ZnS(Ag) scintillator. The PVT-based scintillator is of
the type EJ-200 produced by ELJEN Technology. It is a general purpose plastic scintillator that emits on average
10 000 photons per MeV of energy deposited by electrons of 1 MeV in the blue-violet wavelength band with a
peak emission wavelength of 425 nm [44]. The choice of PVT is mainly motivated by its good light yield and its linear
energy response over a wide range of energies ranging from 100 keV to several MeV. It combines a long optical attenuation length of about 380 cm, with a scintillation pulse decay time of 2.1 ns. The 6LiF:ZnS(Ag) scintillator for neutron detection is produced by SCINTACOR, in the form of thin screens [45]. These so-called neutron detection screens, emit photons at a peak emission wavelength of 450 nm. The nature of the neutron capture reaction and the longer scintillation decay time of 10 microseconds for the 6LiF:ZnS(Ag) scintillator allows for a pulse shape discrimination between signals induced in the neutron detection screens via nuclear interaction, hereafter denoted as NS, and signals induced via electromagnetic processes in the PVT, denoted as ES.
The detection technology, the materials and the geometrical arrangement of the main components of the SoLid detector are the same as for the SM1 prototype and are outlined in an earlier paper [34]. Based on the performance of this full-scale prototype and on studies with a dedicated test bench, described in [46], several design improvements were made to optimize the uniformity of the detector response and to maximise the light collection efficiency. These improvements are outlined below.
2.2 Mechanical design
2.2.1 Detection cell
The basic detection cell consists of a 5x5x5 cm3 PVT cube, of which two faces are covered with neutron detection screens. Positrons with an energy of 10 MeV travel less than 48 mm in PVT, which implies that the majority of the IBD positrons will be stopped in the same cell as in which they are produced. In order to extract the scintillation photons produced in the PVT or in the neutron detection screens, 4 grooves with a 55 mm2 square cross section are machined in four different faces of each cube. Each groove accommodates an optical fibre with a square cross section of 33 mm2 that guides the light to an optical sensor at the edge of the detector. All detection cells are optically isolated via a DuPont Tyvek wrapping of type 1082D [47], whose thickness has been increased from 205 to 270 µm to reduce the optical transparency.
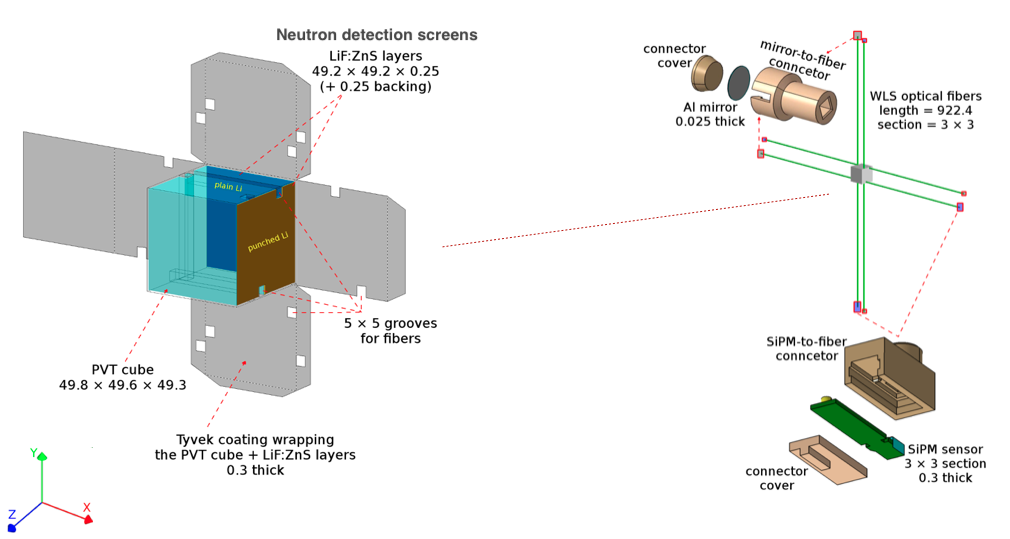
The neutron detection screens are cut into squares of 55 cm2 and positioned, using no glues or optical gels, on two adjacent faces of the PVT cube. The two cube faces that are covered with neutron detection screens are the one that faces the reactor core, perpendicular to the Z-axis, and the one that is perpendicular to the X-axis,
facing the electronic readout boxes that are mounted on one detector side. A schematic view of a detection cell together with the coordinate system and the position of the neutron detection screens is shown in Fig. 1. The scintillation light produced in the neutron detection screens is optically coupled to the PVT cube via the air trapped in between the two surfaces. The bulk of the neutron detection screens have a 225 µm thick MELINEX-339 reflective backing. The addition of this backing on the neutron detection screens with respect to the prototype module, combined with the overall improved light detection in the cells increases the amplitude
of the NS signals and improves the NS-ES waveform discrimination. By doubling the amount
of neutron detection screens per cell, and due to the asymmetric placement around each cube, the capture efficiency for thermal neutrons in the SoLid detector was optimized and increased by 30%, compared to the SM1 prototype [34]. The capture time is also reduced from 102 to 65 microseconds, which decreases the background from random coincidences in the offline analyses.
The LiF component of the neutron detection screens is the dominant component in terms of radiopurity. Bulk amounts of this material were measured in the underground low background radiation facilities of Modane and Boulby. The most accurate measurement on the activity of the LiF yielded an activity of 6935 mBq/kg of pure LiF. The second largest contamination is ZnS, for which the upper limit on the rate is at least 5 times smaller. Our detector has a total of 8.9 kg of LiF, which yields a rate of 614 311 mBq, which is also consistent with the measured intrinsic background rate by a dedicated analysis.
2.2.2 Light collection
The scintillation photons produced in each detection cell are extracted and guided by 92 cm long double clad wavelength shifting fibres (494 nm), of type BCF-91A, produced by St.Gobain [48]. One end of each optical fibre is covered by a Mylar foil with a reflective aluminium coating, and the other end is coupled to a Hamamatsu type S12572-050P multi-pixel photon counter (MPPC), containing 3600 pixels, arranged in a 33 mm2 matrix [49]. For our current settings, the photon detection efficiency is 32%. The position of the MPPC and mirror alternates between the parallel fibres to mitigate the attenuation of light in the fibres and to ensure a more uniform light response throughout the detector (see Fig. 1). The detection cells are arranged into a detection plane of 1616 cells, where each row and column of cells is read out by the same set of two optical fibres, accounting for a total of 64 optical fibres, and an equal number of readout channels, per detector plane, as shown in Fig. 2.
2.2.3 Plane & module design
The detection planes, with a cross sectional surface of 0.80.8 m2, are surrounded
by a lining of white high-density polyethylene (HDPE) with a thickness of 46.0 and 46.8 mm,
respectively in the vertical and horizontal directions (see Fig. 2). The
HDPE bars act as reflectors for neutrons that would otherwise escape the detector. Each plane
is structurally supported by a hollow frame of extruded aluminium that has been chrome coated
to act as a Faraday cage for the MPPCs and their wirings. Each fibre protrudes through the HDPE
lining and the frame where it is capped off on each end with two different plastic 3D printed caps.
One cap holds an MPPC sensor, while the other end holds the aluminized Mylar mirror (see Fig. 1). Optical contact with both the mirror and the MPPC is ensured with a drop of optical gel. The MPPC
bias voltage and signal is carried on twisted pair ribbon cables that are routed through the hollow frame and
are terminated on one of the frame sides in four insulation displacement connectors (IDCs) each grouping 16 MPPC
channels. The front-end electronics, which is described in section 3, is self-contained in an
aluminium encasing mounted on one side of each detection plane. Each detection plane is finally
covered with two square Tyvek sheets on each of its light sensitive faces to further ensure optical isolation
from its neighbouring planes.
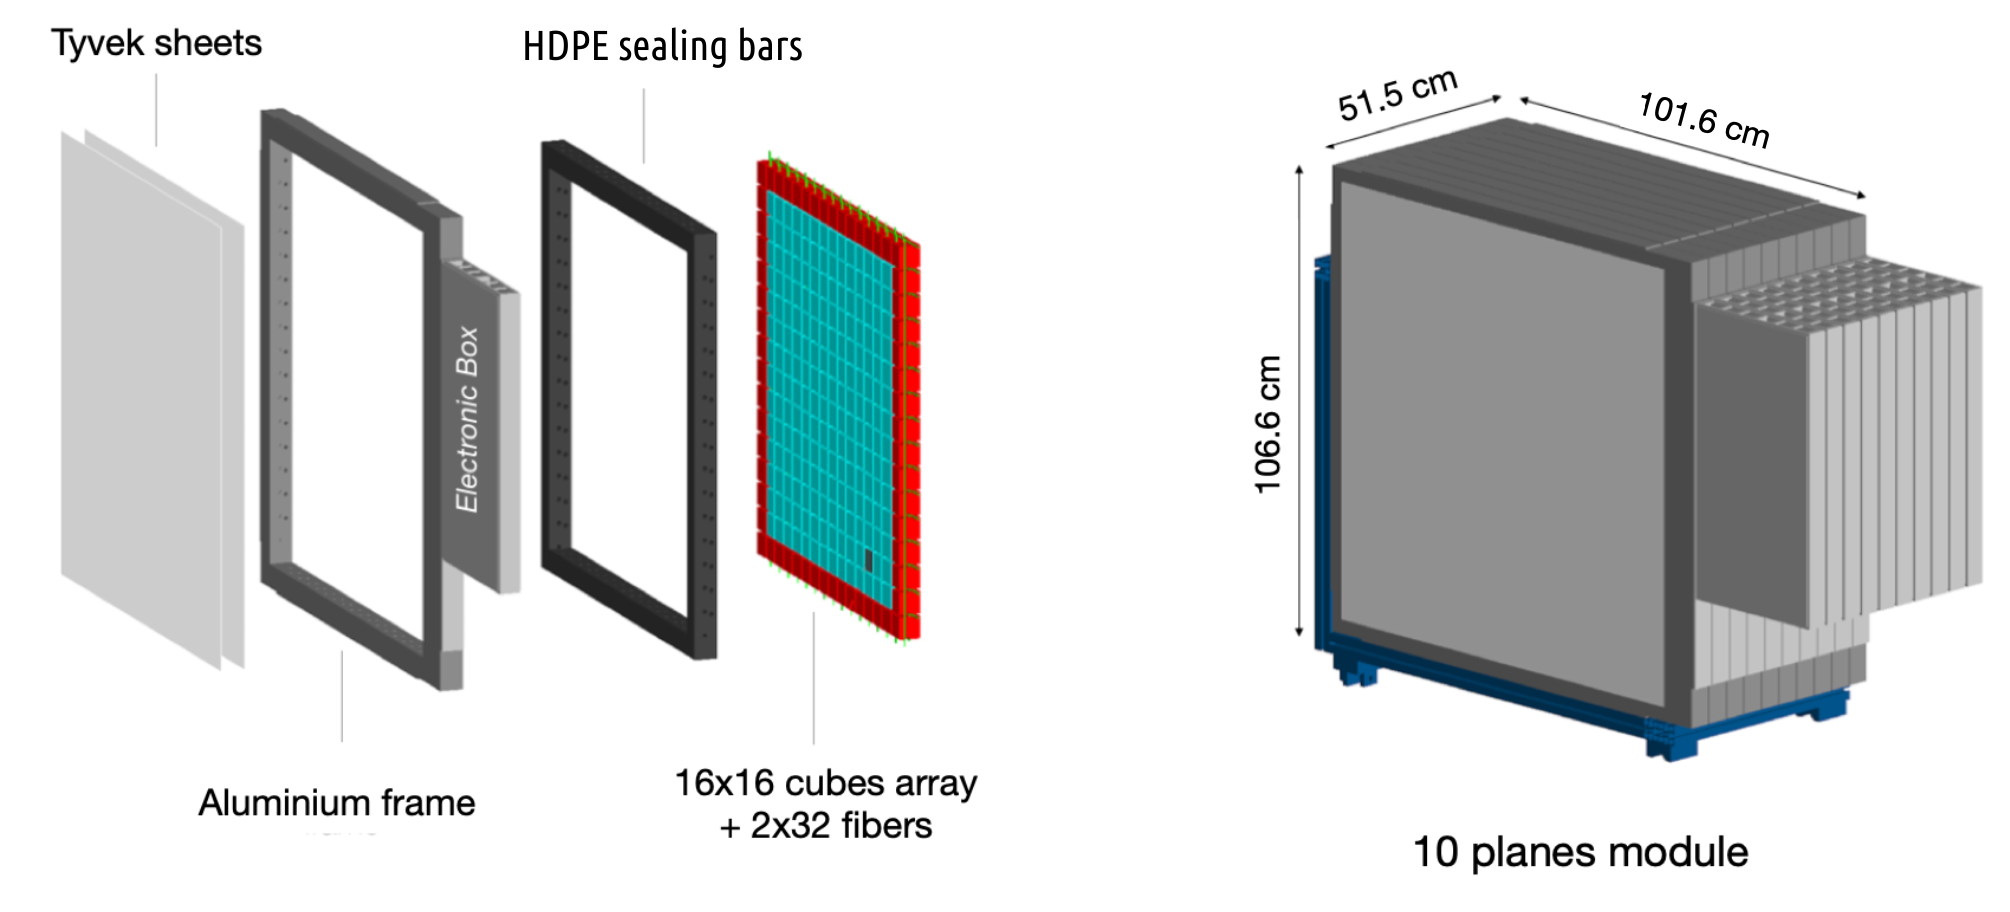
Frames and their attached readout electronics are grouped together by 10 units to form a detector module, mounted on a trolley (see Fig. 2). Each module can be operated as a standalone detector and has its own power supply and trigger electronics mounted on an overhead rail (see section 3). The SoLid detector currently includes a total of 5 detector modules, accounting for a total of 50 detector planes and corresponding to a fiducial mass of 1.6 ton. The front and back planes of the detector are capped with a HDPE reflective shielding with a thickness of 9 cm. Under normal detector operations all modules are closely grouped together with an average spacing of 0.5 mm between two modules.
2.3 Detector construction
2.3.1 Cell production and assembly
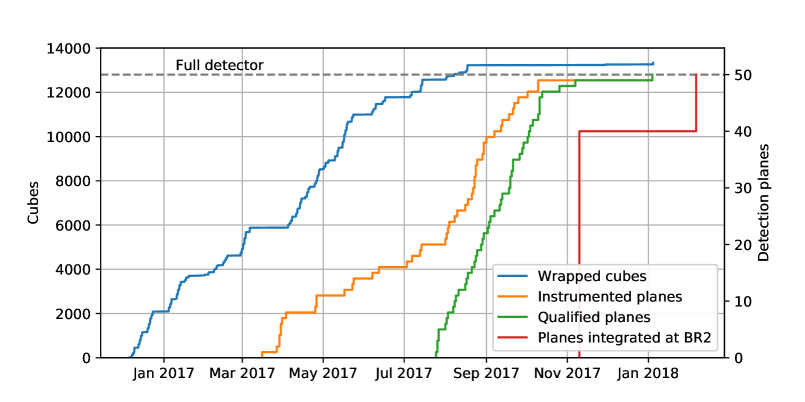
The construction of the SoLid detector started in December 2016 and took roughly 14 months.
The progress of the detection cells (wrapped cubes) production and plane assembly is shown in Fig. 3. The PVT cubes were extracted from 104526.3 cm3 PVT slabs and individually machined by an industrial partner in Flanders using CNC milling machines, with 0.2 mm tolerance on the cube and groove dimensions. After milling, all cubes were visually inspected for mechanical damage before being transported
to the integration site at Universiteit Gent. There all cubes were washed with a light soap detergent to remove
lubricant from the milling process and dried overnight. During frame production, two types of neutron detection screens were used. The cells contained in the bulk of the detector are all equipped with neutron detection screens that have a backing with a thickness of 225 µm, while all cells located at the outer edge of each frame received neutron detection screens without reflective backing material, that were left over from the construction of the SM1 prototype.
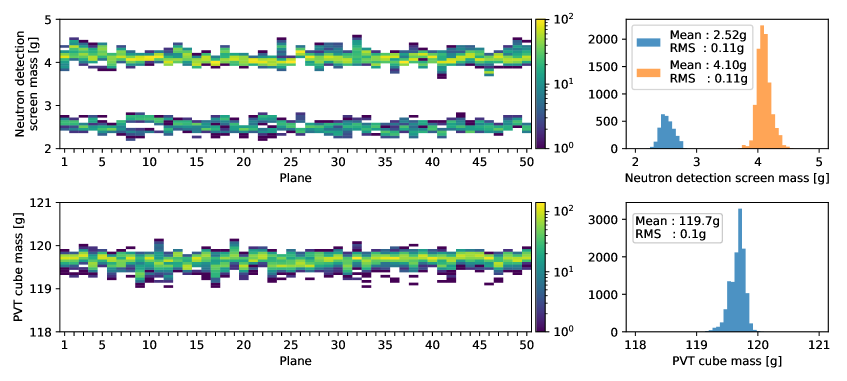
Each cube was weighed with a digital scale with a precision of 1 mg, before and after being equipped with neutron detection screens and wrapped with Tyvek. The two neutron detection screens for each detection cell were also individually weighted. Each detection cell was marked with a bar code sticker that allows for tracking of the production history in a dedicated SQL database. This database includes the bare and wrapped weights of each cell. During a period of 8 months a total of 13228 cubes were washed, inspected, wrapped and catalogued. Only 3% of all produced PVT cubes were rejected due to quality issues. The accuracy of the weights, combined with the tracking of the production batches revealed a small shift in cell mass during the production process, which falls well within the tolerances used in the cell quality control. The mass distributions of the PVT and neutron detection screens of the 50 detection planes are shown in Fig. 4. The mean weight of all PVT cubes equals 119.7 g with an RMS of 0.1 g, which allows to control at per mille level the proton content. The difference in mass between the neutron detection screens with and without reflective backing can be observed in Fig. 4. Each of the 50 detection planes was assembled and equipped by hand in its aluminium frame. The position of each MPPC in the detector is stored in the construction database, together with its breakdown voltage.
2.4 Quality assurance
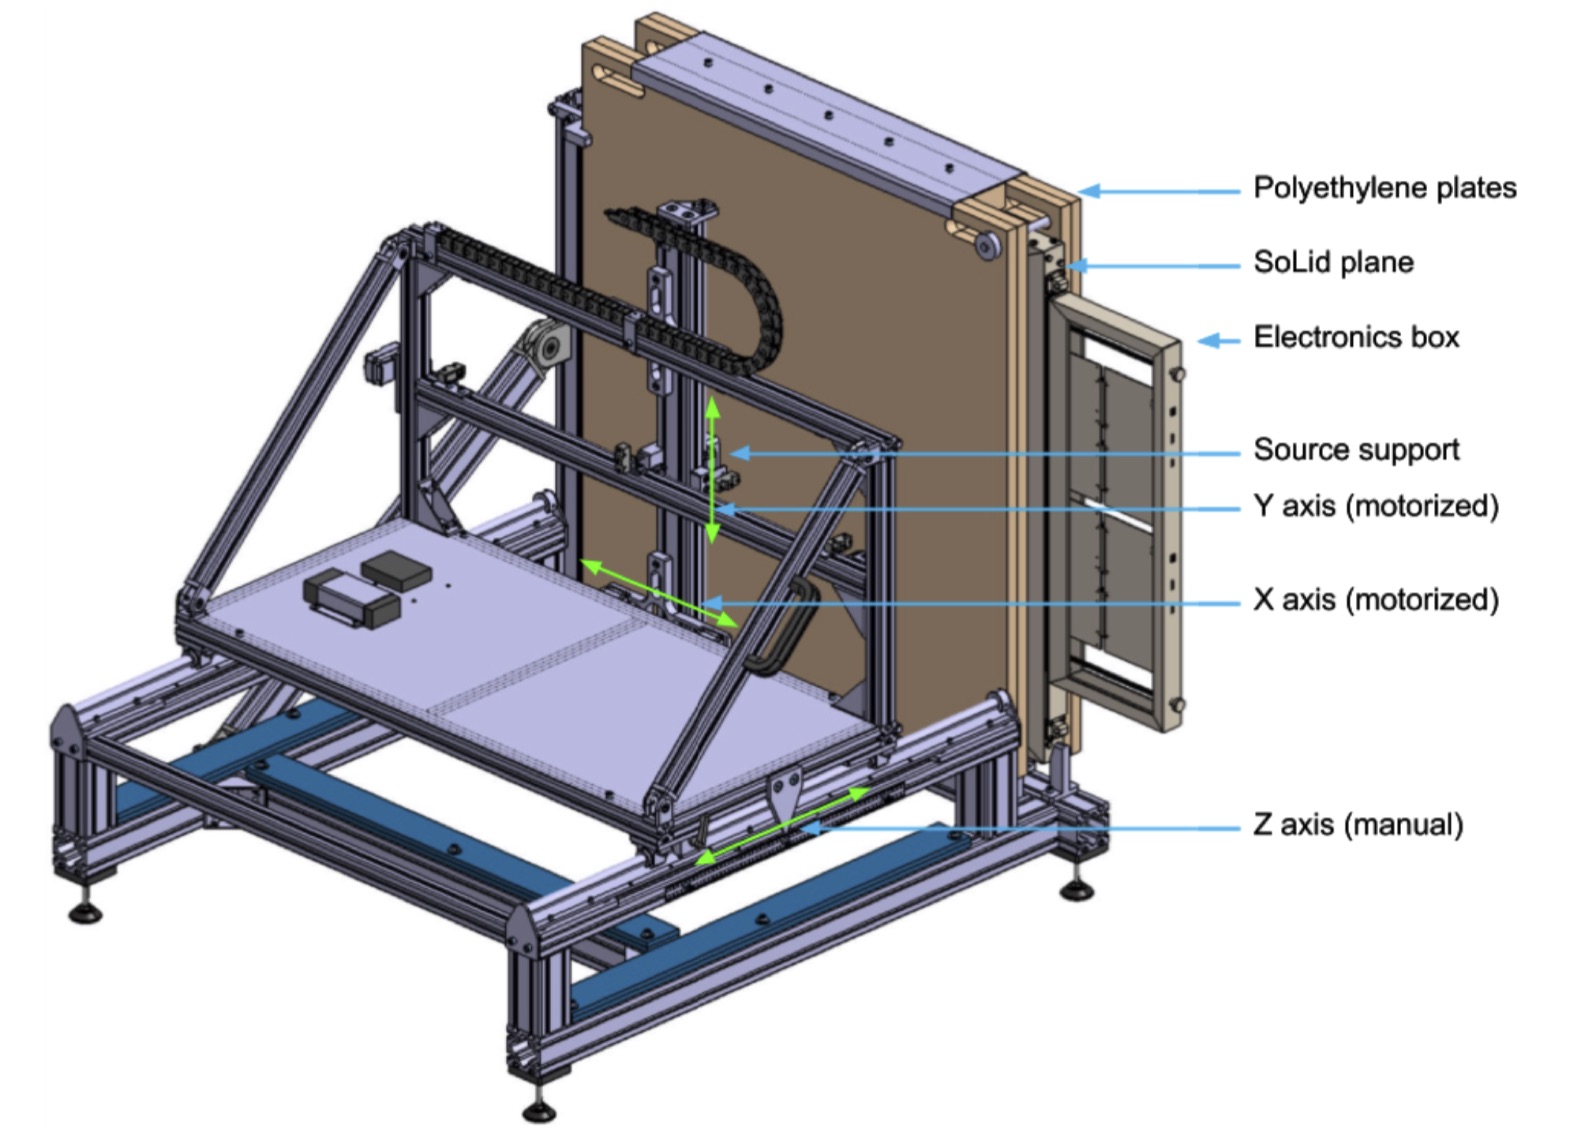
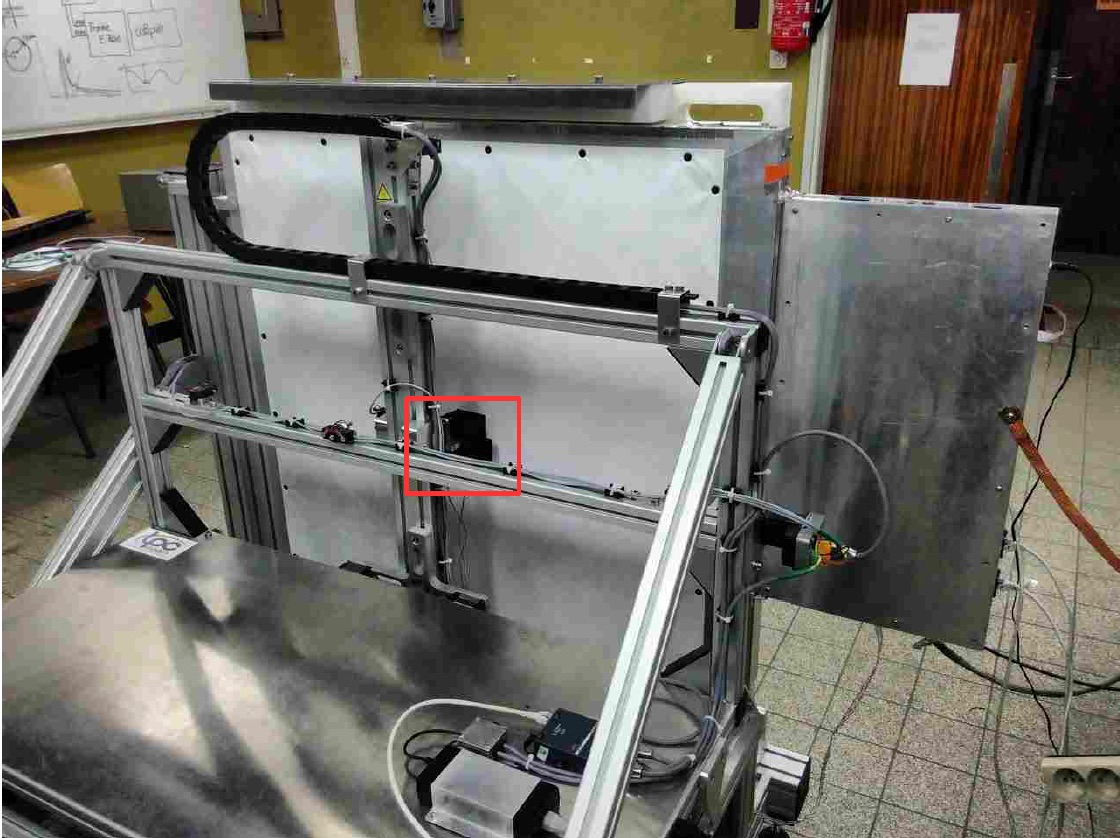
Before being integrated in a detection module, each detection plane was tested on the so-called Calipso test bench, shown in Fig. 5 and described in detail in [50]. This test bench consists of a robot that can position a calibration source in front of a SoLid plane with millimetre accuracy. A polyethylene (PE) neutron collimator is added when performing neutron calibrations, in order to increase the neutron capture rate. In addition, a dedicated 22Na self-triggering calibration head was designed for the calibration of the energy response of the PVT. The Calipso test bench served primarily as an automated quality control system. As such it provided an early detection of typical construction quality issues such as missing neutron detection screens, bad fibre connections, malfunctioning MPPCs and wrong cabling which were all resolved before integration in a detector module. It also allowed to perform an initial test of the electronics and DAQ system before mass production. As a result, for a nominal bias of 1.5 V above each MPPC breakdown voltage, an average gain of about 22 Analogue-to-Digital Conversion units (ADC) per pixel avalanche (PA) was determined with an RMS of 3%. This was further refined with in-situ equalizations during detector commissioning at the reactor site to achieve a gain equalized to 1.4% across the whole detector (see section 5).
The quality assurance campaign with Calipso allowed to have a preliminary calibration of all the detection cells. Calipso measured the light yield by using a 22Na gamma source in coincidence with an external trigger to remove background. The measured Compton edges caused by the interaction of the 1270 keV gamma rays are used to extract the light yield using two consistent methods based on an analytical fit and a template method described in [50]. The average light yield was observed to be larger than 70 PA/MeV/cell corresponding to a stochastic energy resolution of 12% which is consistent with the SoLid physics requirements [46]. Detailed in-situ calibrations are described in section 7, and result in a higher and more accurate light yield determination. The response of the detector to neutrons was also evaluated using a 252Cf source emitting neutrons with a mean energy of 2 MeV in order to determine the relative difference in neutron response across the detector and to validate the neutron trigger settings as described in [51]. Because of the dependence on moderation and detector geometry, the absolute neutron capture and reconstruction efficiency is determined in-situ, as will be detailed in the section 7. Combining the capture and reconstruction efficiency, the total relative dispersion of this efficiency across the detection cells is 5%.
2.5 Container integration
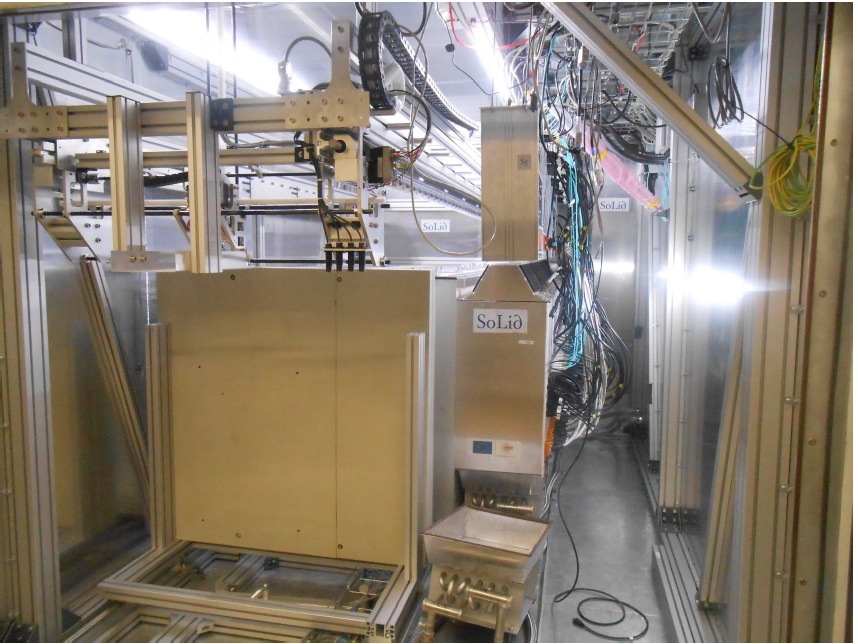
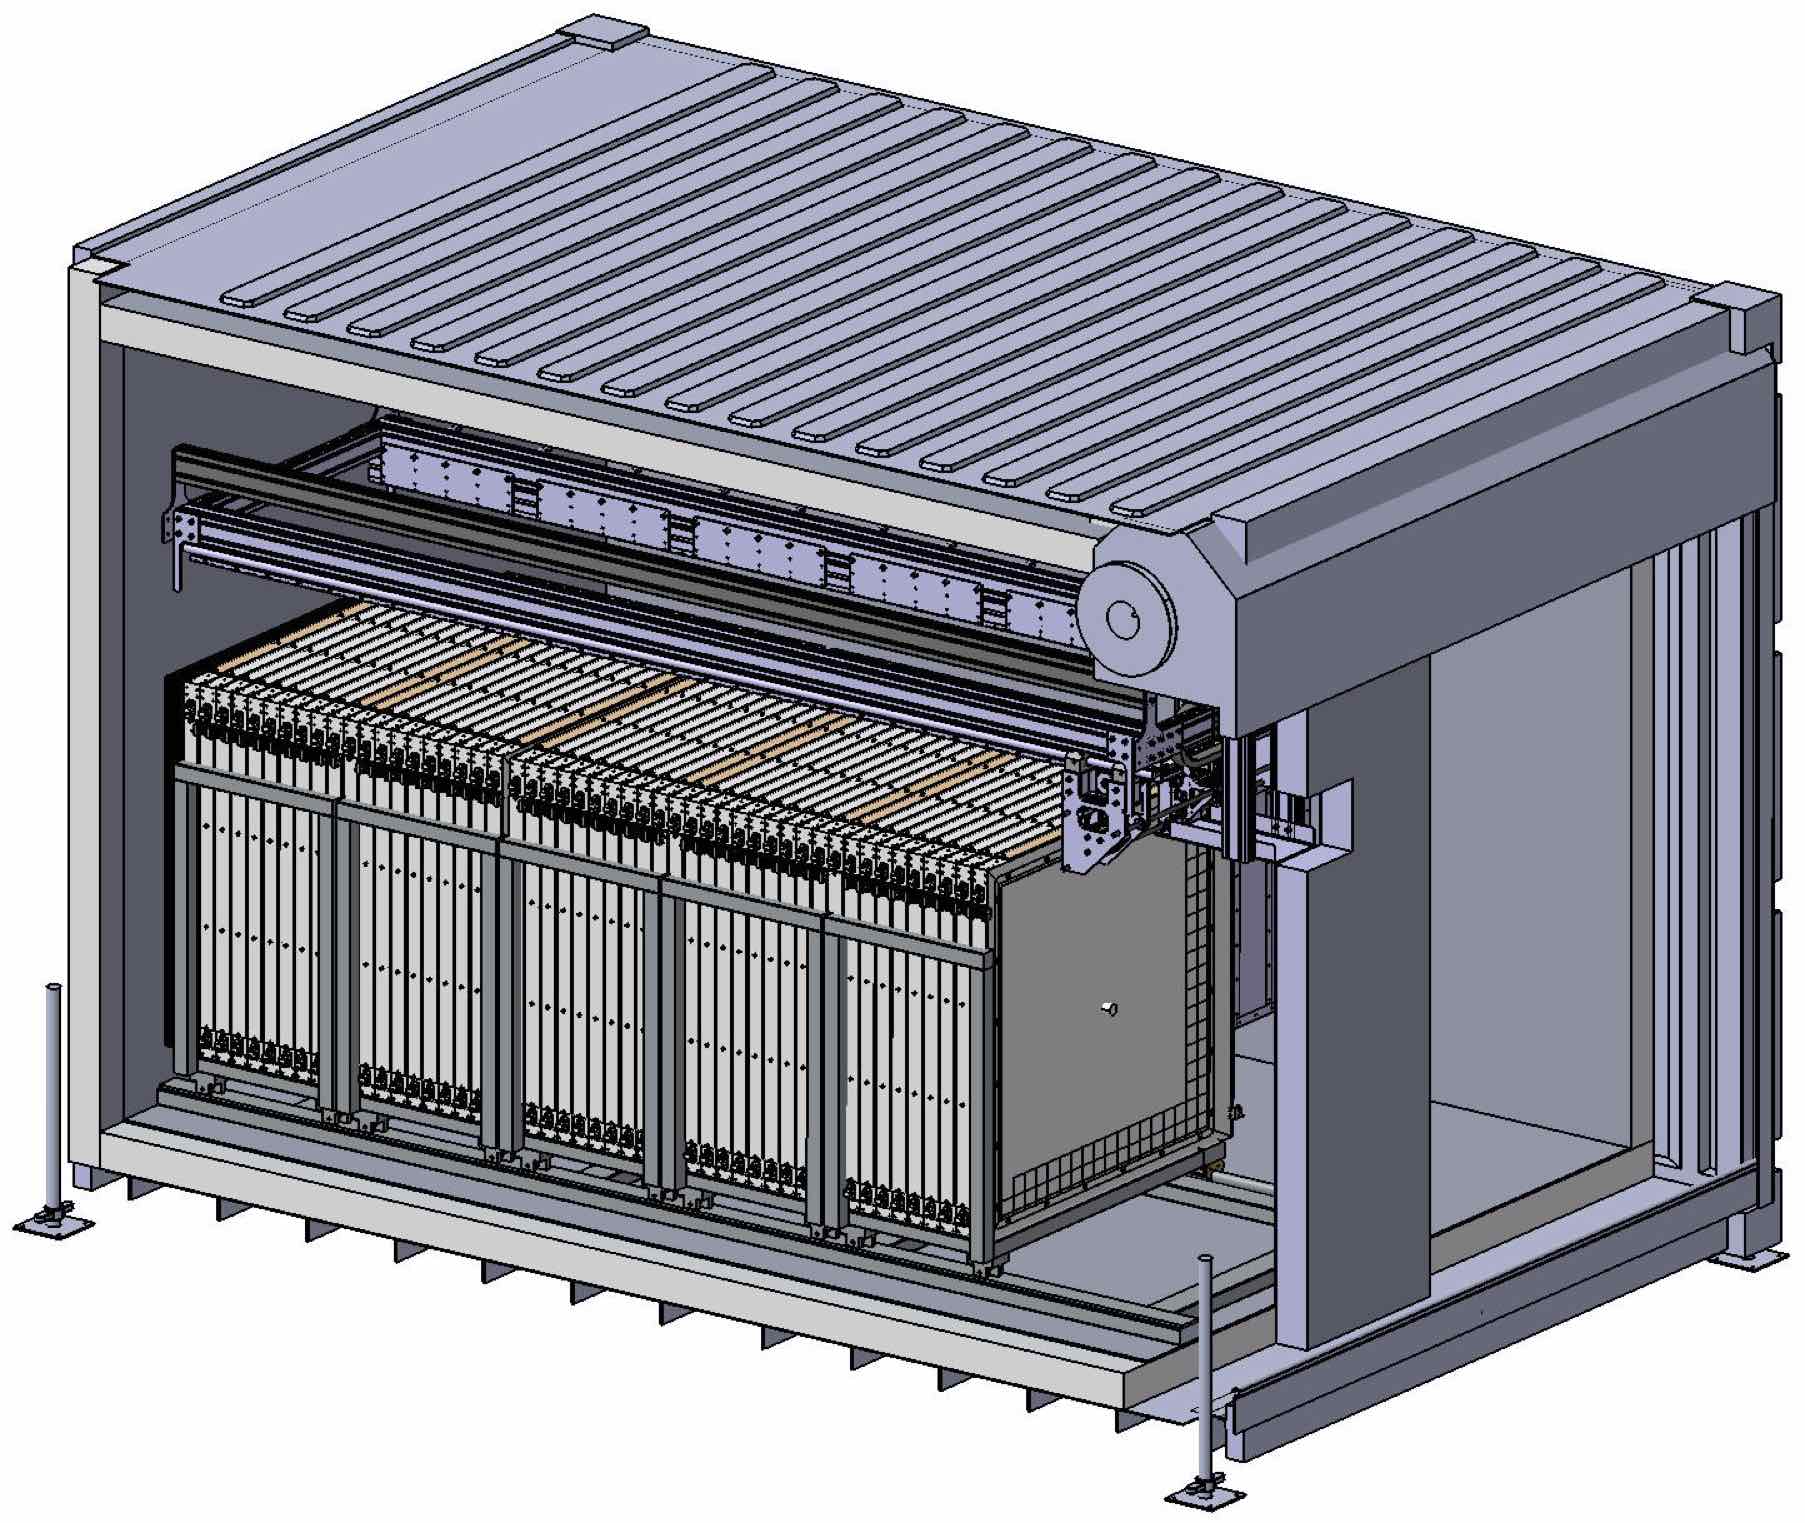
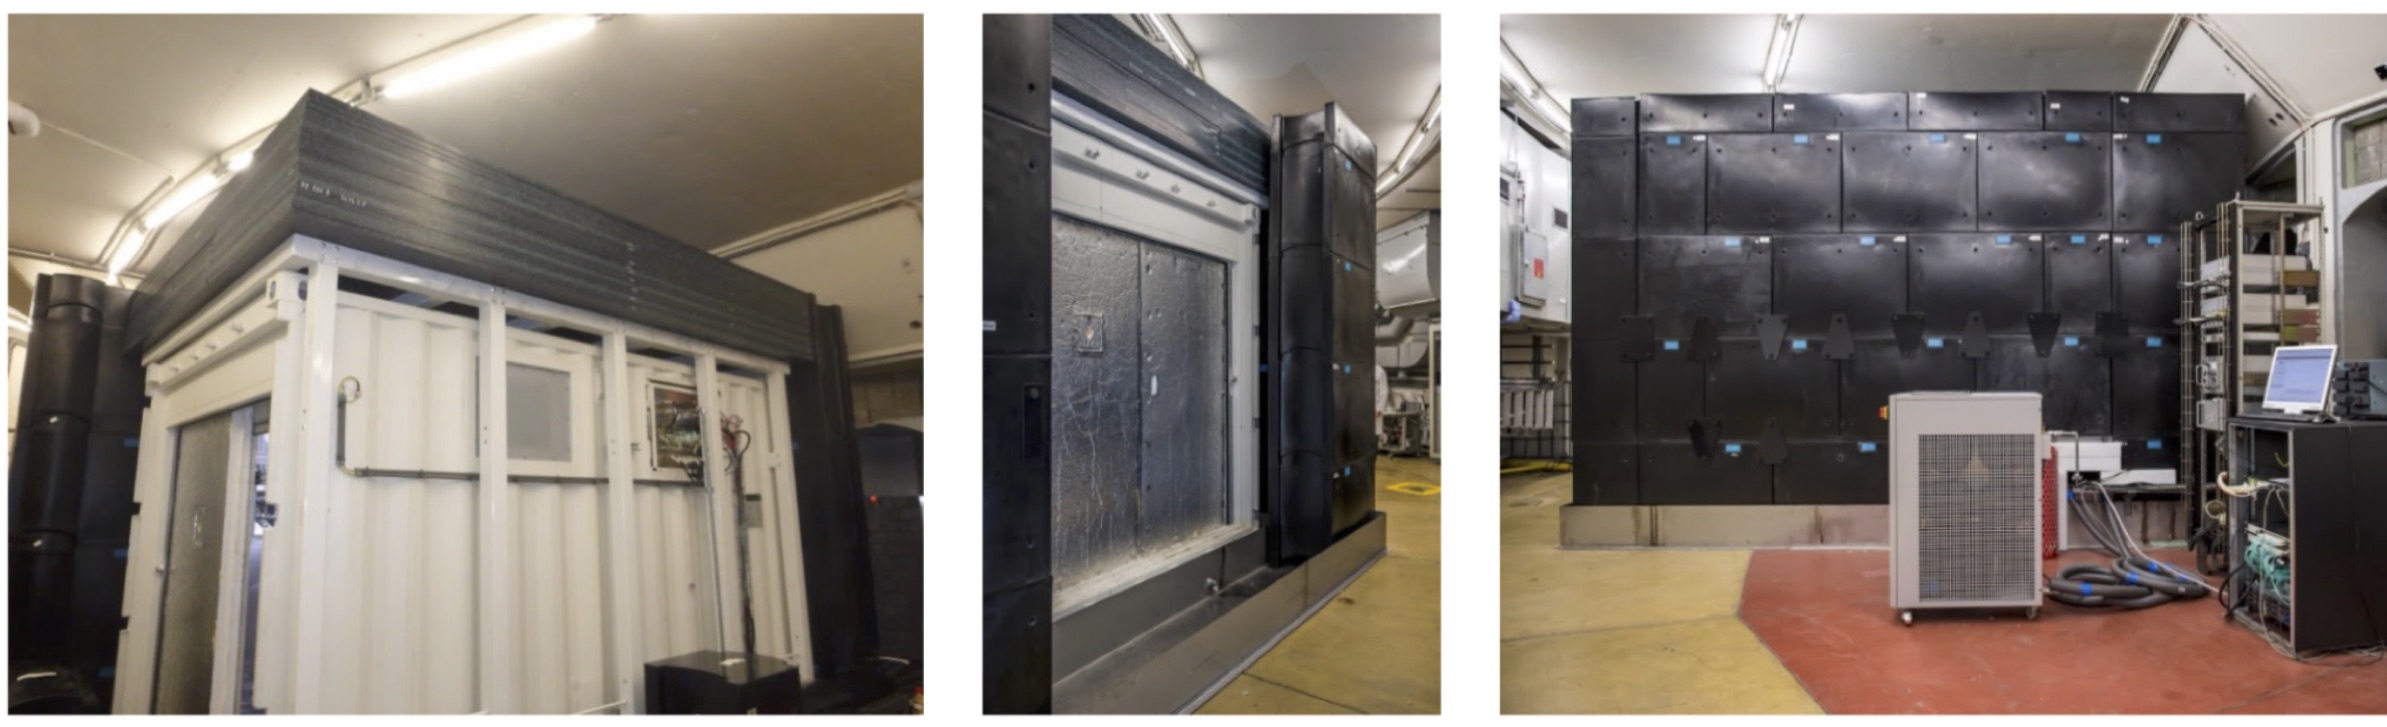
The detector and its electronics are installed in a cooled cargo container with dimensions of 2.42.63.8 m3 as shown in Fig. 6 and 7. The container is further customized for thermal insulation and feed through of cooling lines. A dedicated patch panel, located on the side of the container, bundles all the connectors needed for the electronics (power supply, readout), the container instrumentation and the ethernet communication. The 5 detector modules are positioned off-center in the container in order to allow for access and service space (see Fig. 6, 7 and 12). They are mounted on a rail system, that allows for an accurate and robust positioning and alignment (see CROSS calibration system in section 2.6). The electronics are cooled by a chiller system which is described later in section 3.1. Due to the dimensioning of the chiller system and its radiators it is possible to cool down and control the ambient air temperature in the container to a precision of 0.2 degrees Celsius. Under normal data taking circumstances, the ambient temperature of the SoLid detector is kept at a fixed value of 11 degrees Celsius. In order to keep the relative humidity of the air inside the detector at acceptable levels the container is permanently flushed with dry air that enters the container at a low flow rate of 5 m3/hour. This flushing also helps to remove possible traces of Rn gas inside the detector. Environmental parameters such as pressure, temperature and humidity in the container are constantly monitored by means of a custom sensor network that is controlled and read out by a Raspberry-Pi device. This specific readout is interfaced with the data acquisition of the experiment. During nominal data taking, the gamma background is monitored by a standard PMT coupled NaI scintillator, located inside the container. The airborne radon concentration is monitored by a radon detector, placed next to the NaI detector inside the container. The Rn measurement is performed by sampling the air with a small pump and sending it to a pin-diode semiconductor detector based on the RADONLITE and RADONPIX technology [52], developed at CERN.
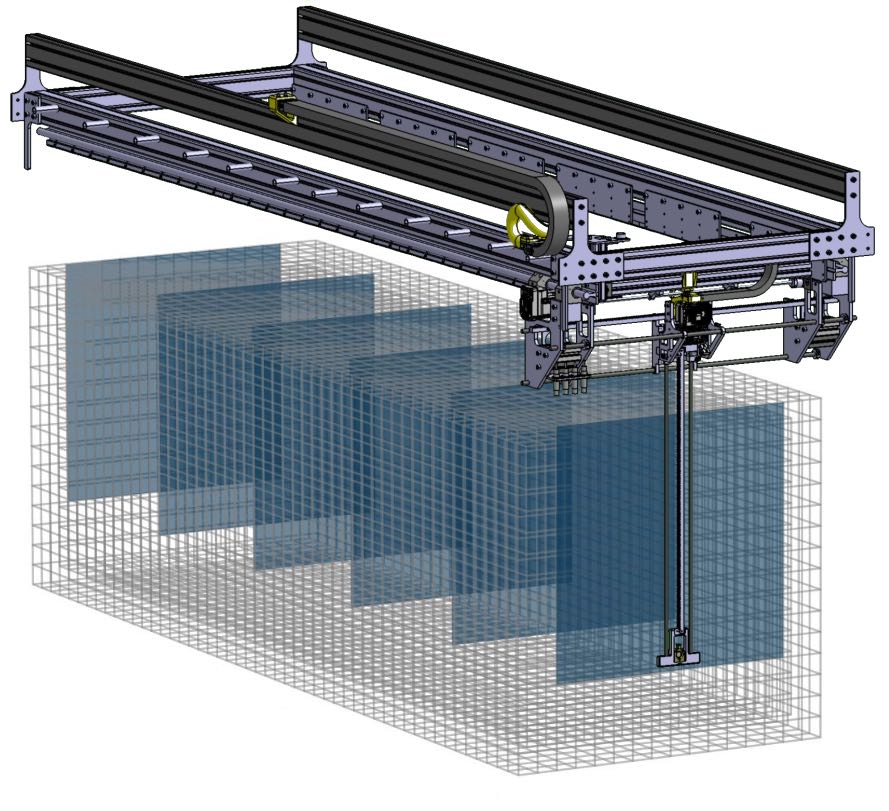
2.6 CROSS calibration system
In order to perform in-situ calibrations of the electromagnetic energy response and of the neutron
capture efficiency, a calibration robot, CROSS, is mounted on top of the SoLid detector inside the
container, as shown in Fig. 7. First, each of the modules is mounted on a trolley, which is itself
mechanically connected by a pivot link to a linear actuator (SKF - CAHB10 [53]). This actuator allows to
move the module carriage on the rails by a few centimeters, which is needed to insert small radioactive
sources between modules during calibration. These displacements are monitored to an accuracy
of better than 5 mm by mechanical position sensors mounted on the ground rail of the detector. As
such a total of six calibration air gaps of 30 5 mm can be created sequentially on both sides
of each module.
The calibration robot that straddles the whole detector along its longitudinal axis is equipped with a holder for radioactive calibration sources as well as four capacitive sensors BCS (M18BBH1-PSC15H-EP02 [54]). Each module contains aluminium reference pins and stainless steel screws located on its top. Three capacitive sensors allow to monitor the longitudinal position of the robot by detecting the module reference pins. The fourth capacitive sensor ensures that the air gap is sufficiently large by measuring the distance between the stainless steel screws. Once the calibration robot is positioned between two modules, the source holder can further be moved along the X- and Y-axes. As such it can scan an area of 6 cells on the left and right sides of the plane center and 6 and 4 cells respectively above and below the plane center, covering nearly half of the detection plane’s surface (see Fig. 7). The radioactive source (see Tables. 4 and 5) are installed manually on the calibration arm from the outside of the container and the shielding, and are removed from the detector during normal data taking.
3 Data Acquisition system
3.1 Readout system design
The readout system is custom-made and based on a combination of analogue/digital front-end electronics and Field-Programmable Gate Array chips (FPGA).
It brings together compactness, low power consumption (< 1 kW), flexibility and high reliability for unattended operation on restricted access. All MPPC signals are equalized, synchronized (< 1 ns) and continuously
digitized at 40 Msample/s. The use of zero suppression techniques (ZS), combined with pulse shape
trigger algorithms, results in a data reduction factor of around 10 k, down to 20 Mb/s, with negligible dead time
(see Tab. 1).
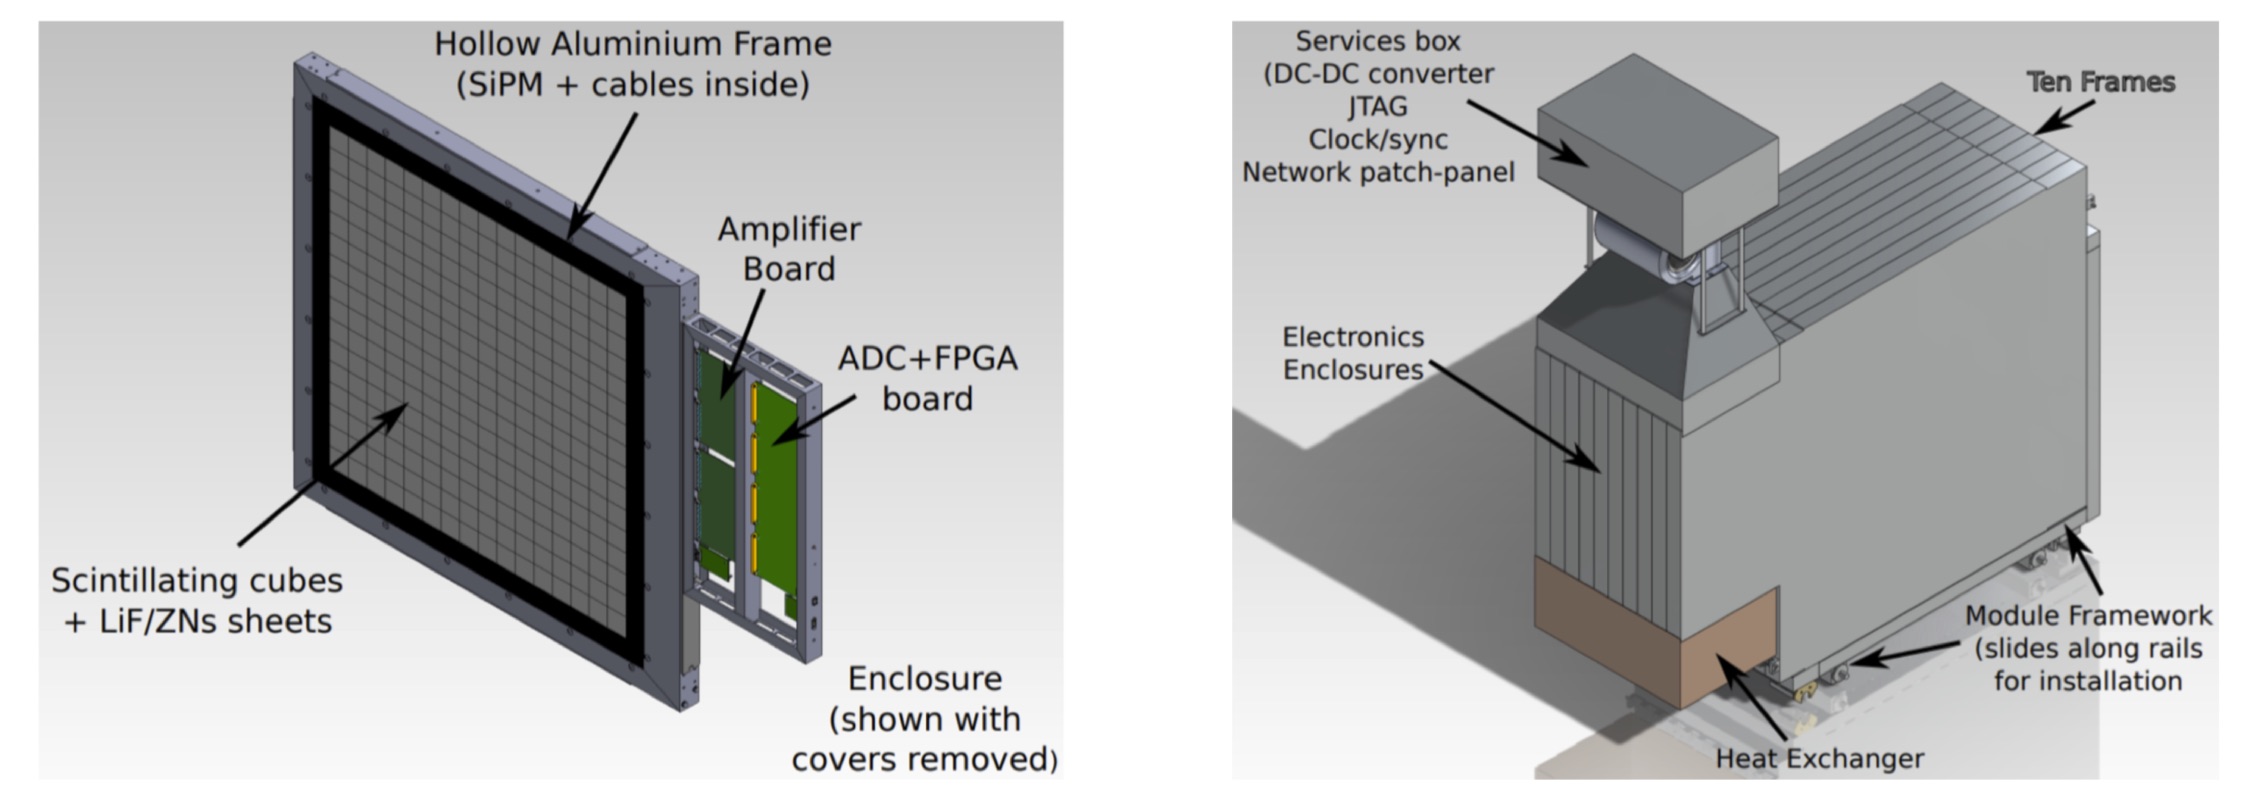
The readout system operates on three levels: plane, module
and full detector. Each of the 50 single detection planes has its own readout system, mounted
directly on its side within a dedicated aluminium enclosure (see Fig. 8).
It contains all the front-end electronics to run in autonomous mode, as described below. Each detector module is equipped with a heat exchanger and a services box that contains a DC-DC voltage converter to power the module, clock and synchronization distribution board, network patch panel and Minnow JTAG programming system. The module clock board (master/slave mode) provides a common clock fan-out to synchronise the ten associated
digital boards. A master clock-board allows to run the five detector modules synchronously.
The front-end electronics of a single detection plane consists of two 32-channel analogue boards,
a 64-channel digital board, together with a power distribution system and an Inter-Integrated Circuit module
that reads out four environmental sensors mounted inside the hollow frame. These environmental sensors monitor
temperature and humidity levels throughout the detector. The two analogue boards are connected
to the cathodes of the 64 MPPCs of the plane. They provide a common 70 V power supply, as well as individual
trim bias voltages (0-4 V) used to equalize the amplitude response of each MPPC individually (see section 5.1).
Before being sent to the digital boards and in order to perform more accurate time stamp and amplitude measurements,
the fast MPPC pulses (a few ns) are read out in differential AC coupled mode, amplified, band-pass filtered and shaped by
a charge integrating operational amplifier to stretch the signal over several digital samples of 25 ns each.
The two analogue boards are connected to a 64-channel digital board for digitisation and trigger.
Each digital board has eight 8-channel ADCs, operating at a rate of 40 MHz
with 14 bit resolution. Digital boards are controlled and read out over a 1 Gbit/s optical Ethernet connection.
A Phase-Locked Loop is included, which allows the digital boards to operate in standalone mode
using an internally generated clock, or run synchronised to an external clock signal.
Triggers and readout logic are implemented in a Xilinx Artix-7 (XC7A200)
based FPGA device [55]. JTAG connectors are included for remote firmware programming. Trigger signals
from each digital board are propagated to all other detector planes by using two duplex 2.5 Gbit links
(copper cables). A complete description of the detector electronics is given in [51].
The entire readout electronics is coupled very close to the detector, within aluminium enclosures, inside the chilled container. Both act as a Faraday cage, providing shielding from outside electronics noise. The top and bottom sides of these enclosures have openings to allow air flow cooling. The electronics are cooled by six fans mounted between the services box and the plane electronics enclosures, pushing air downwards towards a heat exchanger which is capable of removing the 200 W of heat generated by each module (see Fig. 8). The radiator unit is based on circulating water containing 18% propylene glycol, connected to a chiller that operates nominally at a temperature of 5 degrees Celsius. It also acts as an overall cooling source to lower the ambient temperature inside the insulated detector container. As the environment temperature inside the container is maintained to 11 degrees Celsius, MPPC responses are stabilized at 1.4% level and the MPPC dark count rate is reduced by a factor of three compared to operation at room temperature.
3.2 Online triggers and data reduction
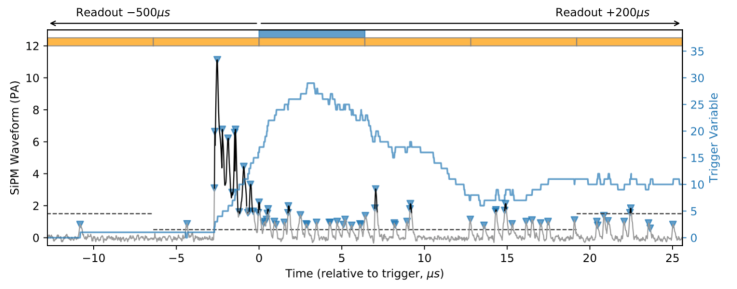
Multiple triggers and data reduction techniques have been implemented at the FPGA level [56]. The trigger strategy for neutrinos relies solely on triggering
on a scintillation signal generated in the neutron detection screens, further denotes as NS. As the NS scintillation process is characterized
by a set of sporadic pulses emitted over several microseconds (see section 2),
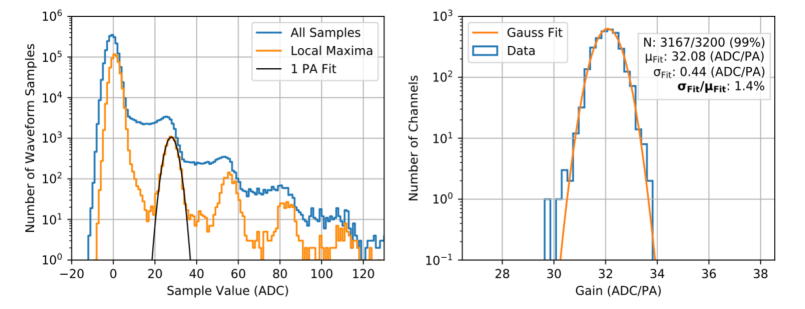
the NS trigger algorithm involves tracking the time density of peaks in the waveform [51]. All algorithm parameters have been optimized during deployment: the
amplitude threshold on waveform local maxima to be counted as a peak is set to 0.5 PA, the
size of the rolling time window is fixed at 256 waveform samples (6.4 µs) and the number
of peaks, required in the window, is set to 17 (see Fig. 9). These default
values correspond to a trigger efficiency of 75% and a purity of 20% during nominal reactor ON periods.
The efficiency is defined by the ratio of triggered neutrons and the total number of captured neutrons, as determined from the calibrated activity of our calibration source source and a capture efficiency obtained from simulation.
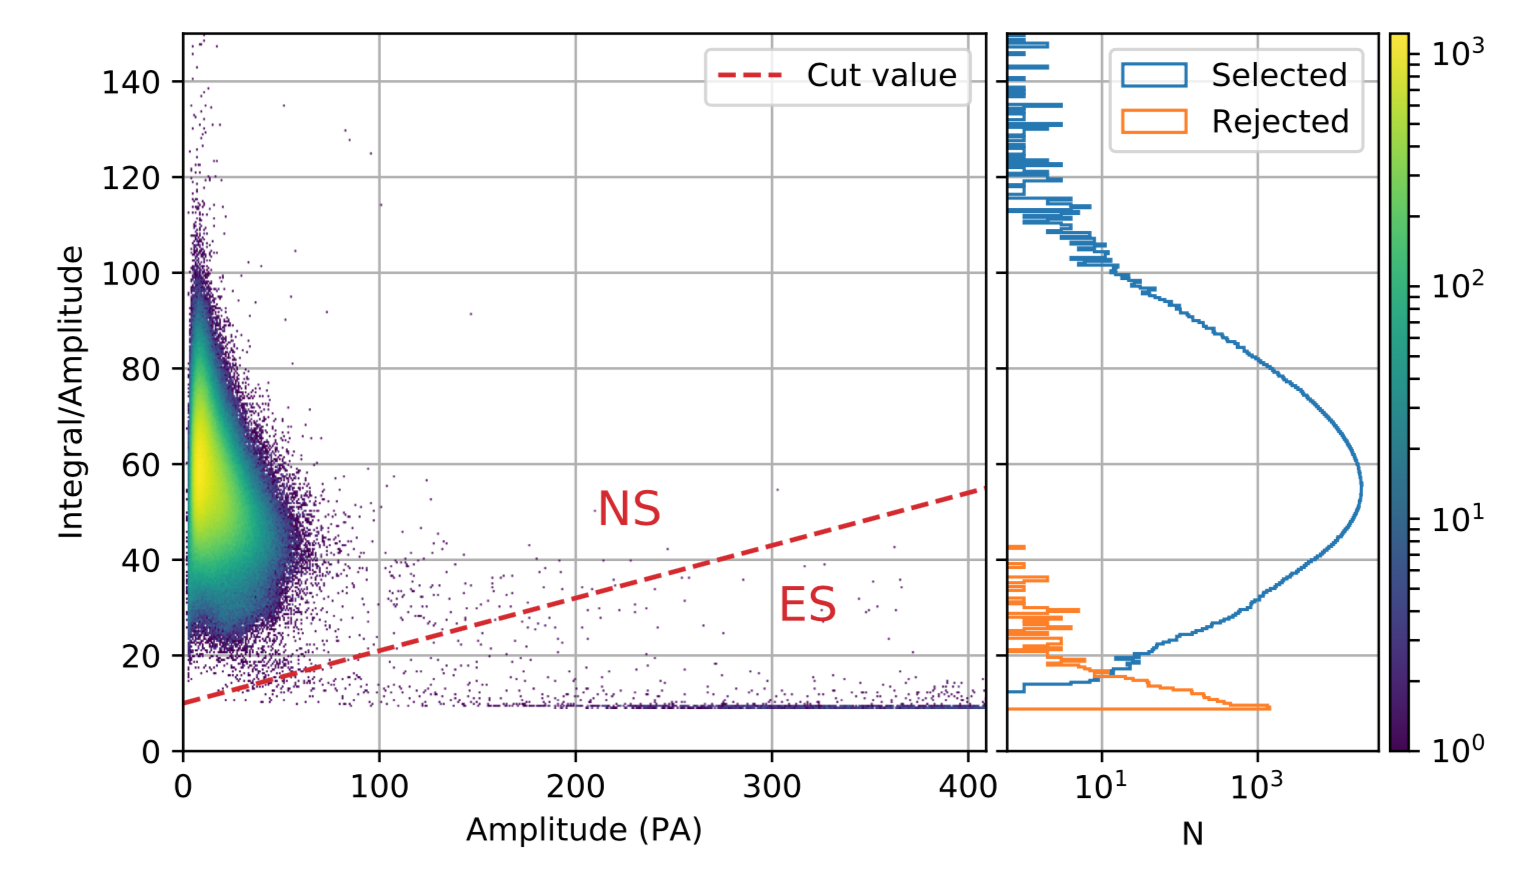
The purity is defined as the number of triggers passing an offline neutron identification and the total number of triggers. The offline neutron selection is demonstrated in Fig 24, and it has a purity of 99%. The 80% non-neutron triggers are mostly muon signals, which can be distinguished using an offline identification (see section 5.2 and 7). For each NS trigger, a large space-time region is read out in order to encapsulate all signals from the IBD interaction. Three planes are read out on either side of the triggered plane, with a large time window of 500 µs before the trigger and 200 µs after the trigger. The NS trigger rate, which does not change significantly depending on reactor operation, fluctuates around 80 Hz corresponding to a data-rate of 15 MB/s (see Tab. 1).
Two additional triggers are also implemented to measure background and to survey the detector stability. A threshold trigger has been implemented to record high amplitude ES signals, such as muons. The default physics mode threshold is 2 MeV with a X-Y coincidence imposed. This gives a trigger rate of about 2.1 kHz and data-rate of 2 MB/s during nominal reactor ON periods. It decreases by around 10% during reactor OFF periods (see Tab.1 and Fig. 18). A periodic trigger has also been implemented in order to monitor continuously the stability of the MPPCs, as well as any noise contributions. The entire detector is read out for a time window of 512 samples without zero suppression, with a default trigger rate of 1.2 Hz, giving a data rate of 3.9 MB/s (see Tab. 1). The three triggers include storing MPPC waveforms for offline analysis. A zero suppression value at 1.5 PA, respectively 0.5 PA in NS mode, allows to remove the pedestal contribution, whilst retaining all MPPC signals. It results in a waveform compression factor of around 50 (resp. 500) [51]. Table 1 summarizes the different trigger parameters and their associated data rates.
| Trigger | ZS | Condition | Readout Region | Trigger rate | Data rate | |
| Type | Threshold | Space | Time (s) | (Hz) | (MB/s) | |
| Periodic | Disabled | Random 1.2 Hz | Whole detector | 12.8 | 1.2 | 3.9 (19%) |
| Threshold | 1.5 PA | Waveform sample > 50 PA | Triggered plane | 6.4 | 2100 | 2 (10%) |
| NS | 0.5 PA | Npeak 17 peaks | Triggered plane | [-500,+200] | 80 | 15 (71%) |
| ( Width = 6.4 µs , Tpeak = 0.5 PA ) | 3 planes | |||||
The readout software runs on a disk server, located very close to the detector. It provides 50 TB of local storage, that is split into two data partitions, which are periodically swapped and cleared. All the data are first transferred to the Brussels HEP Tier 2 data centre, then subsequently backed up at CC-IN2P3 in France [57] and at Imperial College in the UK using GRID tools, which are used for offline processing and simulation production.
4 The BR2 reactor at SCKCEN
4.1 The BR2 reactor
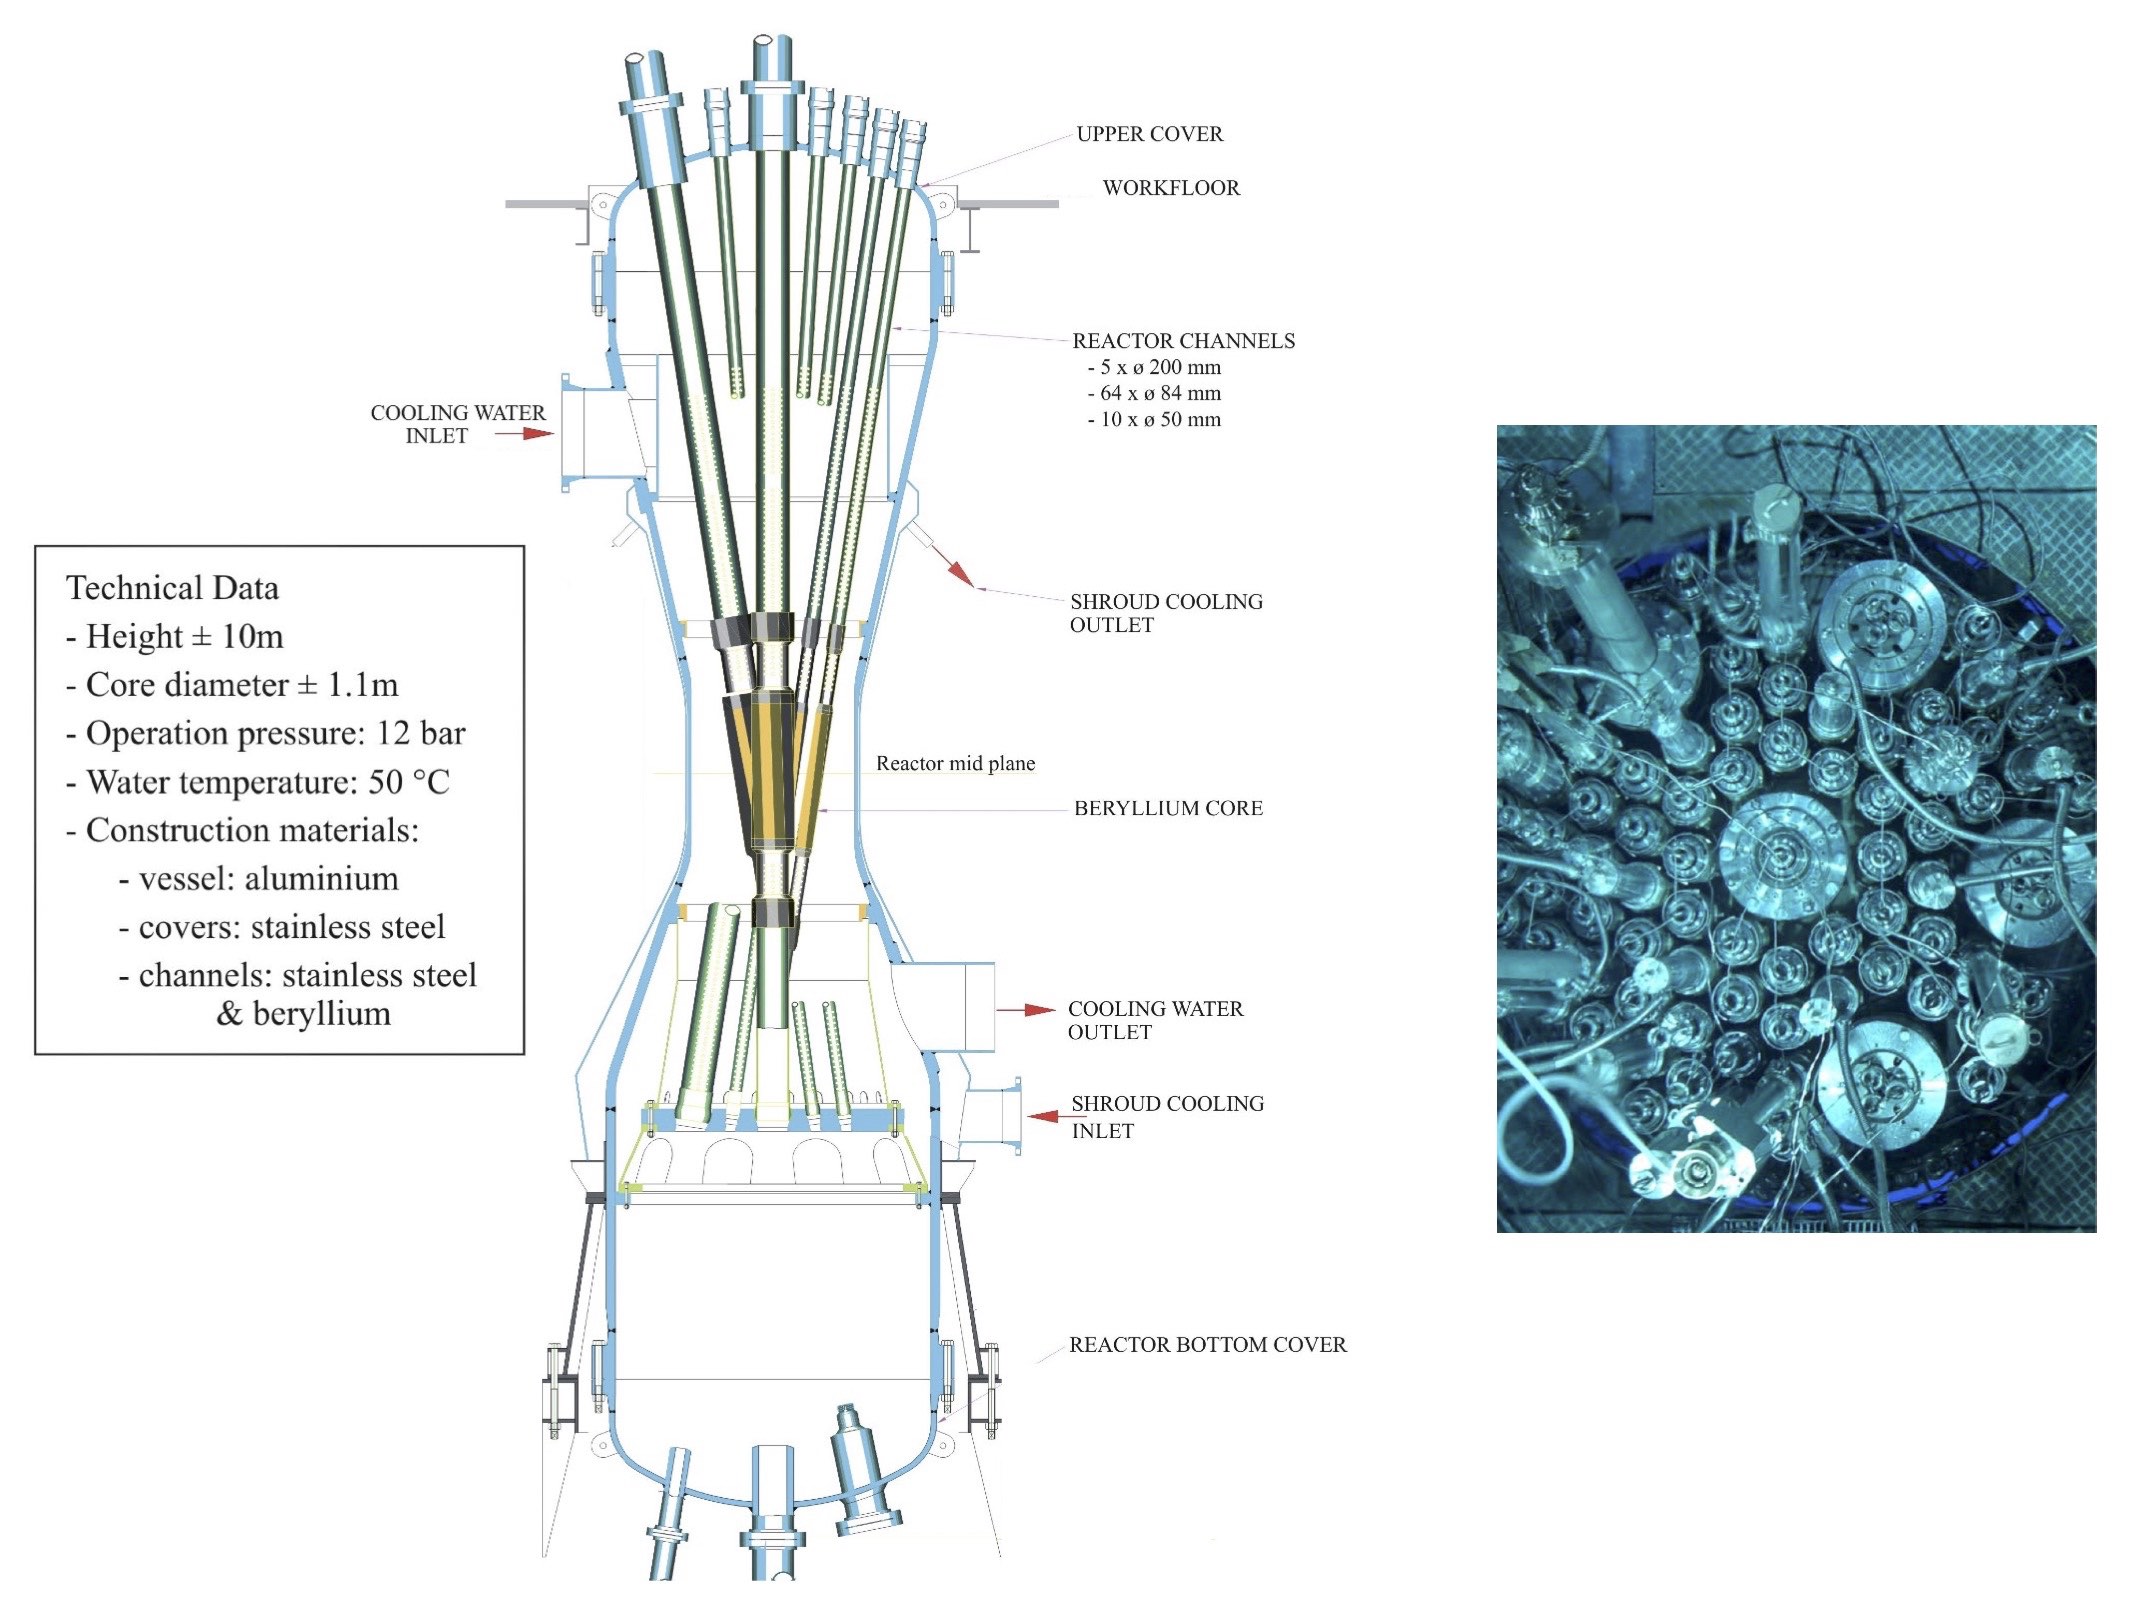
The BR2 reactor (Belgian Reactor 2) is a materials testing reactor operated by the nuclear research center SCK
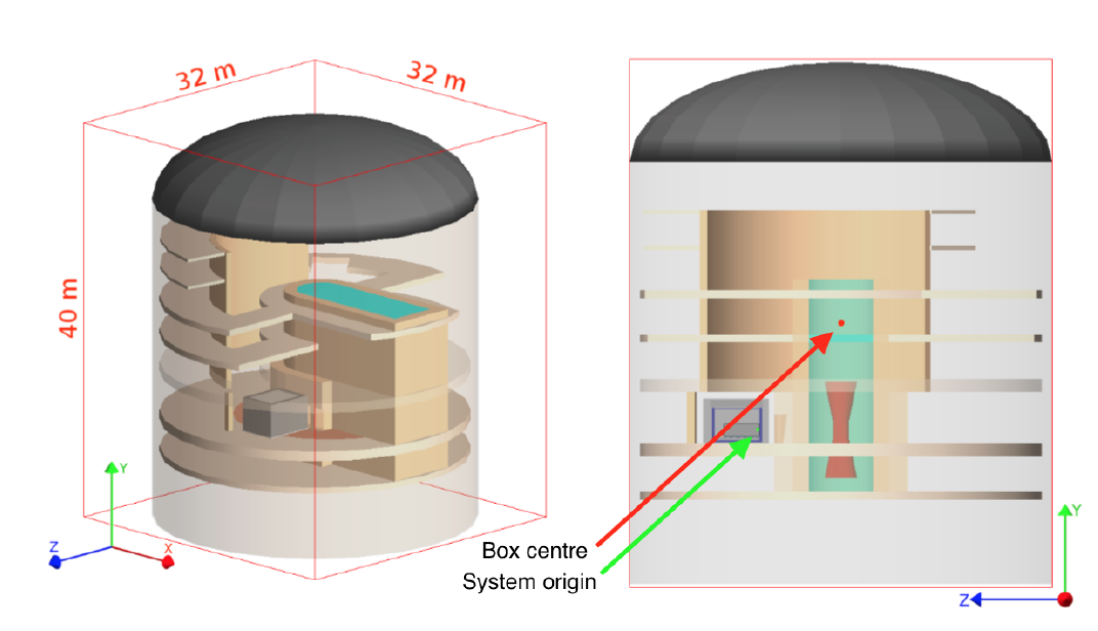
CEN in Mol (Belgium). Since its start-up in 1963, it is one of the most powerful research reactors in the world and thus plays an important role in nuclear material and fuel R&D. It is also widely used for production of medical isotopes and neutron transmutation doped silicon [58]. The BR2 reactor is a pressurized "tank-in-pool" type reactor, cooled with water and moderated by its beryllium structure and water (see Fig. 10). It has a unique twisted design with inclined channels to obtain a compact core. The BR2 reactor uses highly enriched uranium fuel (HEU: 93.5% 235U) at powers varying between 40 and 100 MWth. It thus produces a very high neutron flux, up to 1015 n/cm2/s, and provides an intense source of antineutrinos up to about 21019 s.
At the end of the SM1 prototype physics run, the BR2 reactor was shut down for a period of one year and a half, and has undergone a thorough overhaul. The BR2 operation was restarted in July 2016. In practice, the reactor operates at a nominal power of about 65 MWth, for 160 to 210 days per year, during cycles of about three to four weeks (ON period). There are on average 6 cycles of reactor ON periods per year, that alternate with interim maintenance periods of the same duration (OFF period). The Solid experiment takes advantage of the OFF periods to perform calibration campaigns and background measurements (see section 7)..
4.2 Detector integration on site
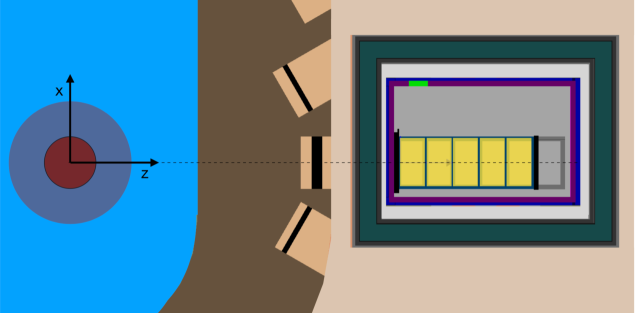
The SoLid detector is located at level 3 of the BR2 containment building in direct line-of-sight of the nominal reactor core center. This is the third detector installed at this location by the collaboration, after the two prototypes, NEMENIX [33] and SM1[34]. The 50 detector planes are oriented perpendicularly to the detector-reactor axis, and as close as possible to the reactor core. As such, the sensitive volume of the SoLid detector covers a baseline of away from the nominal center of the BR2 reactor core (see Fig. 11 and Fig. 12). As the aluminium reactor vessel is totally immersed in water, its radiation is properly shielded. Moreover, at this floor of the containment building, no other experiments surround the detector and all neighbouring beam ports have been shielded with 20 cm thickness of lead. It thus ensures stable and low reactor induced background conditions.
The overburden above the detector is composed of 3 concrete floors and the steel roof of the containment building (see Fig. 11). It corresponds to 8 meters-water-equivalent. In order to mitigate the atmospheric and cosmic backgrounds, which were determined experimentally with SM1 and compared with a full-chain Geant4-based Monte-Carlo simulation [59], a passive shielding surrounds the detector (see Fig. 12 and Fig. 13). It is maximized for cost, avalaible space and floor load versus attenuation of cosmic neutrons. The top of the detector is shielded with a 50 cm PE layer made of 2.5 cm thick PE slabs that are staggered to avoid gaps. The PE slabs are supported by a steel scaffolding straddling the container and surrounded by a 50 cm thick water wall on the four sides of the container. The cosmic neutron flux in the energy range [1-20 MeV] is thus reduced by a factor of 10 and about 5% are converted to slow neutrons (En<10 eV) that penetrate the wall. In order to capture these slow neutrons, thin cadmium sheets with a thickness of 2 mm are sandwiched between the passive shielding and the container housing of the detector. The capture efficiency of these cadmium sheets for slow neutron is about 88%. The cadmium sheets, cover the entire back side of the experiment container and most of its top and bottom surface, amounting to roughly 45% coverage of the experiment.
The environment of the BR2 containment building is continuously monitored and registered by the
BR2 Integrated Data Acquisition System for Survey and Experiments (BIDASSE).
During SoLid operation, environmental parameters, such as temperature, humidity and pressure,
outside and inside the containment building, are constantly monitored. Also the background radiation
is monitored using gamma and beta detectors placed in the vicinity of the SoLid container. So far,
these variables are used as a cross check of the data
coming from the container instrumentation, i.e. environmental sensors, NaI scintillator and airborne
radon detector mentioned in section 2.5.
The thermal power is determined by measuring the flow rates and temperatures at the entrance and inlet of the primary cooling circuit and the reactor pool circuit. The flow of the cooling water is measured using Dall tubes and the temperature is measured using resistor thermometers. The main uncertainty in this measurement originates from the calibration of the Dall tubes.
The difference between the Dall flow measurement and the measurements performed by the I.A.E.A. using ultrasonic equipment at another location in the primary circuit is equal to 4.8%. The signal processing chain introduces some possible systematic offsets as well, which results in a conservative uncertainty estimate of 5% on the thermal power determination.
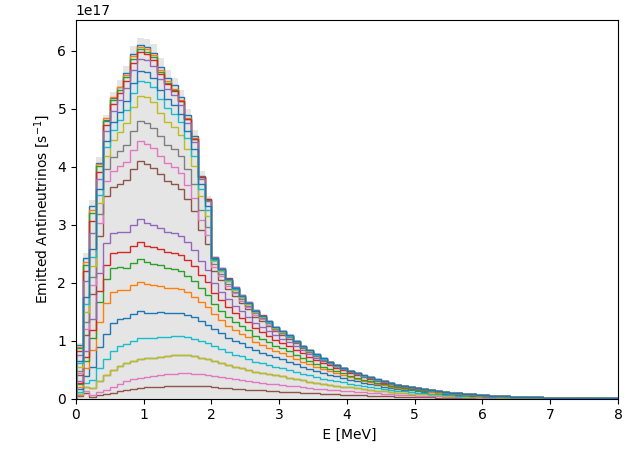
4.3 Neutrino flux modeling
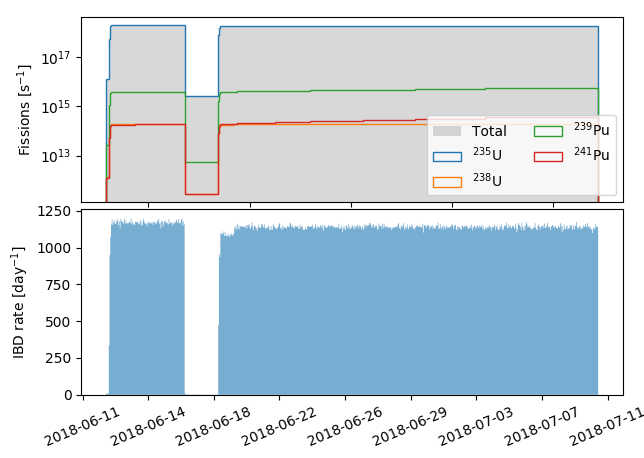
For each cycle, i.e. for a given fuel loading map and operation history, detailed simulations of the BR2 reactor core are performed to calculate the emitted antineutrino spectrum. In addition, the computation of the spatial fission distribution, combined with a dedicated tracking algorithm, allows to obtain the detector acceptance, defined as the fraction of emitted antineutrinos that pass through the detector. The RMS of the neutrino emission point distribution within the reactor core are about 50 cm in diameter and 80 cm in height. The geometrical detector acceptance is about 0.11%. It depends slightly on the fuel loading map. The emitted antineutrino spectrum is computed using the conversion [7, 8] and summation methods [60]. The conversion method is based on the prediction of the fission rates as a function of time using a MCNPX [61] (or MCNP6[62]) 3D model of the reactor core interfaced with the evolution code MCNPX/CINDER90 [61] and combined with the converted spectra, measured at ILL reactor in Grenoble, France (see Fig. 14). However, since ON/OFF reactor transitions are frequent and reactor ON cycles are relatively short, we have to take into account off-equilibrium effects. To do so, the MURE code [63] allows to adapt the converted spectra to the irradiation time of the antineutrino experiment. The summation method uses the same MCNPX/CINDER90 software combined with the amount of in-core emitters and consists in summing all the individual beta branches composing the total spectrum weighted by the beta decay activities [64] (see Fig. 14). Systematic effects coming from the thermal power uncertainty, modeling uncertainty as well as nuclear data, will also be estimated. The current calculations indicate that at typical power settings of BR2, the SoLid experiment is subjected to IBD interaction rates between 11.5 and 14.5 mHz (1000-1250 detectable events per day).
4.4 Backgrounds
The SoLid detector is also subjected to various background processes that contaminate the IBD samples for final analysis. Because the primary physics trigger is set to detect thermal neutrons interacting in the neutron detection screens, most backgrounds are related to either the production of neutrons via processes other than IBD interactions, or processes that excite the ZnS(Ag) scintillator embedded in the neutron detection screens. Some background processes exhibit a clear time structure between the triggered NS time and preceding ES signals and are called correlated. Others have a random time structure and are called accidental. Reactor independent backgrounds dominate our data sample and can be extracted from data collected during reactor OFF periods. We quantify our understanding of these background components by comparing background simulations with data in specific control regions that are enriched in one specific background component. Reactor dependent backgrounds are very scarce and are monitored using a dedicated NaI gamma ray detector and with dedicated control samples that are depleted of IBD events. It is mostly composed of gammas, and thus only populate accidental events, i.e. a random coincidence of a NS and ES signal within the IBD trigger window.
In all cases we try to validate the background composition and the influence of selection criteria by using dedicated Monte Carlo simulations, wherever they are available. A detailed description and treatment of these models falls beyond the scope of this paper and will be described at length in a following physics analysis paper. Here we summarize the main background processes and their origin.
A first source of neutrons to which the detector is constantly exposed is of atmospheric origin. These neutrons are produced by cosmic ray spallation when high energy primaries collide with atmospheric nuclei. Neutrons can penetrate much further into our atmosphere than the electromagnetic component and are shown to produce a complex energy spectrum [65] ranging from sub-eV to multi-GeV. The flux of atmospheric neutrons is simulated using the Gordon model as described in [65], scaled to the BR2 reactor site elevation and latitude, and cross-checked with the more general purpose CRY generator [66]. The flux contains slow and fast neutrons that induce a different response in the SoLid detector.
Slow neutrons that enter our detector can, in combination with an accidental coincidence of an ES signal such as those induced by gamma rays, produce signals similar to IBD events. The detector timing and spatial segmentation with corresponding topological selections can largely suppress this background. The passive water shield of 50 cm surrounding the experiment, combined with the Cd sheets placed on the outer walls of the container help to thermalize and capture some of the epithermal neutrons.
The fast neutron component is able to penetrate the detector and can induce highly energetic proton recoils resulting in ES signals. If the neutron further thermalizes inside the detector it can be captured and induce a NS trigger. As such it introduces a time correlated background that dominates the selected IBD events samples for ES signals with energy above 5 MeV. This background is mainly suppressed by timing and ES signal multiplicity requirements.
Cosmic ray muons are also known to induce spallation reactions in materials near or inside the SoLid detector that produce neutrons or radioisotopes. The rate of neutron production increases with muon energy and with material density. The rate and spectrum is modelled using the CRY generator [66] by simulating cosmic ray showers on a surface that lies 30 m above the BR2 building and by tracking all shower components through the building and detector geometry. Roughly one third of the spallation neutrons are produced inside the detector, while the rest is created in surrounding structures. The techniques to mitigate the corresponding accidental and time correlated background are similar to those to reduce the atmospheric neutron background. Cosmic muons themselves are used as a calibration tool, as they generally leave a reconstructed track in the detector. In some cases, however, muons can clip the detector edges, leaving an isolated energy deposit that can contribute to the accidental backgrounds in the detector. Muons can also decay in the detector, resulting in the detection of the Michel electron or positron with a characteristic delay corresponding to the muon life time. The rate and spectrum of cosmic ray muons are modelled using CRY, but are cross-checked by other models by Guan [67] and Reyna [68].
Intrinsic radioactivity of detector materials or airborne isotopes are another source of backgrounds. The
airborne isotope of 222Rn can produce several alpha and beta particles along its decay chain.
Its presence inside the detector container is therefore monitored by a dedicated Rn detector, as described in section 2.5. Another source
of intrinsic radioactivity are trace fractions of Bi isotopes contained in detector materials, in particular the
neutron detection screens. The 214Bi isotope is the most troublesome and is part of the long 238U
decay chain. It decays to 214Po via emission with a half-life of roughly 20 minutes and a Qβ value of 3 MeV. The resulting Po isotope has a half life of 164 µs and emits an energetic alpha
particle that can cause a scintillation of the ZnS(Ag) scintillator of the neutron detection screens. The half life of 214Po
is very similar to the thermalization and capture time of fast neutrons in the SoLid detector. This background,
referred to as BiPo, dominates at prompt energies below 3 MeV and is difficult to mitigate. This BiPo
background is modelled by generating random decay vertices in the neutron detection screens throughout
the detector, followed by the subsequent decays with corresponding half lifes and energies.
The use of cube and fibre topology information allows to localize the spatial origin of the alpha particle,
while timing and energy can be used to tag the ES signal. In addition, also the integrated energy of the
NS signal can be used to discriminate neutrons and alphas from the 214Po decay.
Other backgrounds can be broadly categorized as accidentals and consist of random coincidences of ES signals that are typically induced by gamma rays and thermal neutrons in the surroundings of the detector. The accidental distribution can vary with reactor power, but can be easily extracted from data itself, using negative time differences between the ES and the NS signals. Accidentals contribute only marginally to the selected IBD events sample.
5 Detector operation and data monitoring
5.1 Channel characterization and equalization
During nominal operations, the average gain of the MPPCs is set to 32.1 ADC counts per PA, which corresponds to a mean
over-voltage of 1.8 V above the avalanche breakdown value of each sensor. This over-voltage setting
was optimized for neutron efficiency during the commissioning of the detector at BR2. It is a compromise
between photon detection efficiency, pixel cross talk and thermal dark count rate. The amplitude response
of the sensors is equalized by an automatic procedure that first consist of finding the individual
break down voltage of each MPPC, which is spread with a standard deviation of around 2 V over all the sensors.
For a given channel, the linear relationship between gain and voltage is determined by performing a voltage
scan. This procedure allows to equalize the gain of all the channels with a spread around 1.4%, where the
dominant uncertainty is the precision of the gain-finder itself (see Fig. 15).
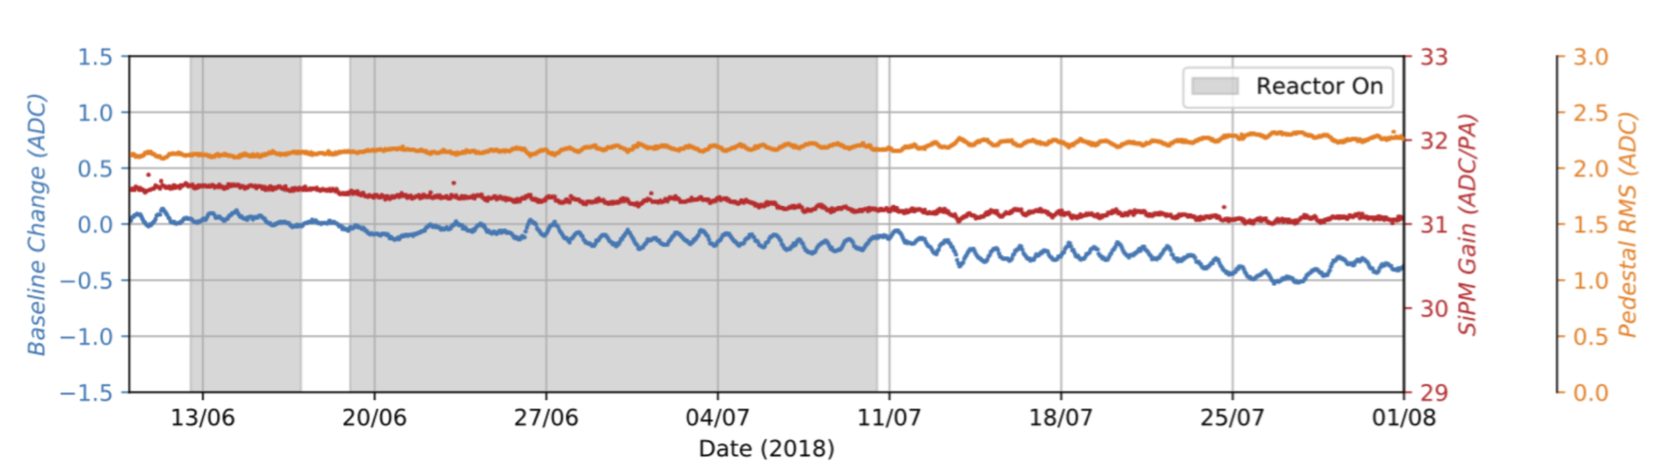
MPPC sensors typically have a high dark count rate, which is the main reason why the detector is cooled inside an insulated container. The rate also strongly depends on the over-voltages applied. Under nominal running conditions, i.e. at a mean over-voltage of 1.8 V and at a temperature of 11∘C, the mean dark count rate is 110 kHz per channel, which is uniform across the detector. The MPPC pixel cross talk, which corresponds to the probability that a pixel avalanche triggers an avalanche in a neighbouring pixel, also depends on the bias voltage and amounts to 20% for an over-voltage of 1.8 V [51]. Long term trends of the MPPC demonstrate a stable operation, as shown on Fig. 16.
5.2 Detector operation and data quality monitoring
Run operations are controlled via a dedicated Python-driven web application,
the "SoLid Data Quality Monitor" (SDQM). It automatically processes a small fraction of each run (first GB)
using the SoLid reconstruction and analysis software. Output measurements
and distributions of the detector as well as in-situ environmental sensors are read out periodically,
as show in Fig. 17 and stored in an online database and is continuously inspected via a web application.
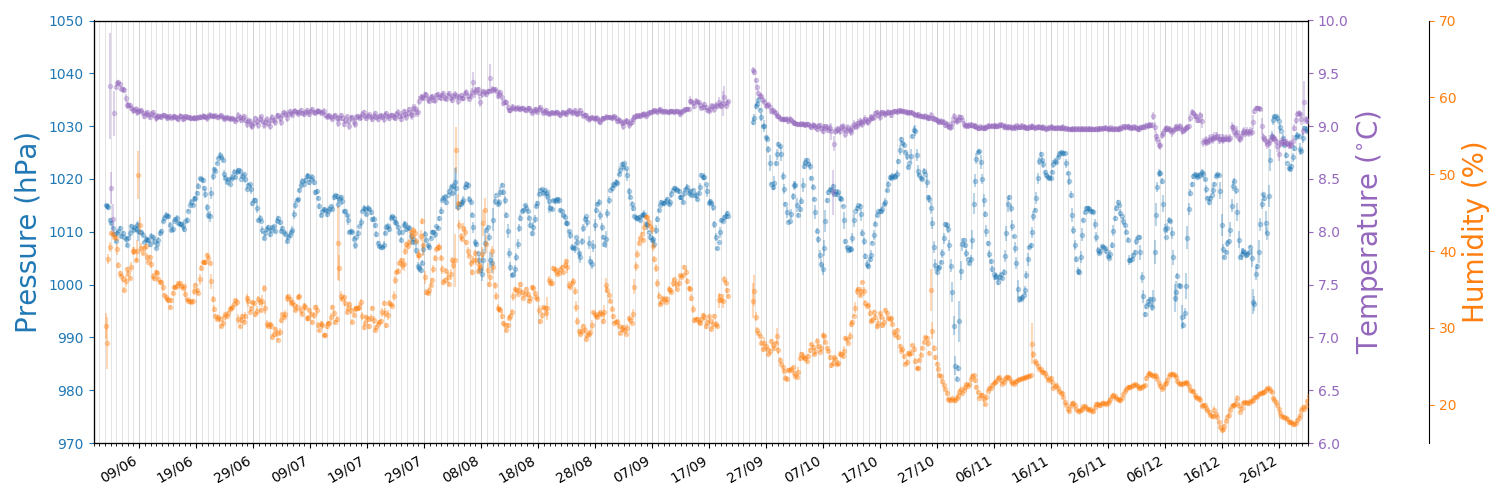
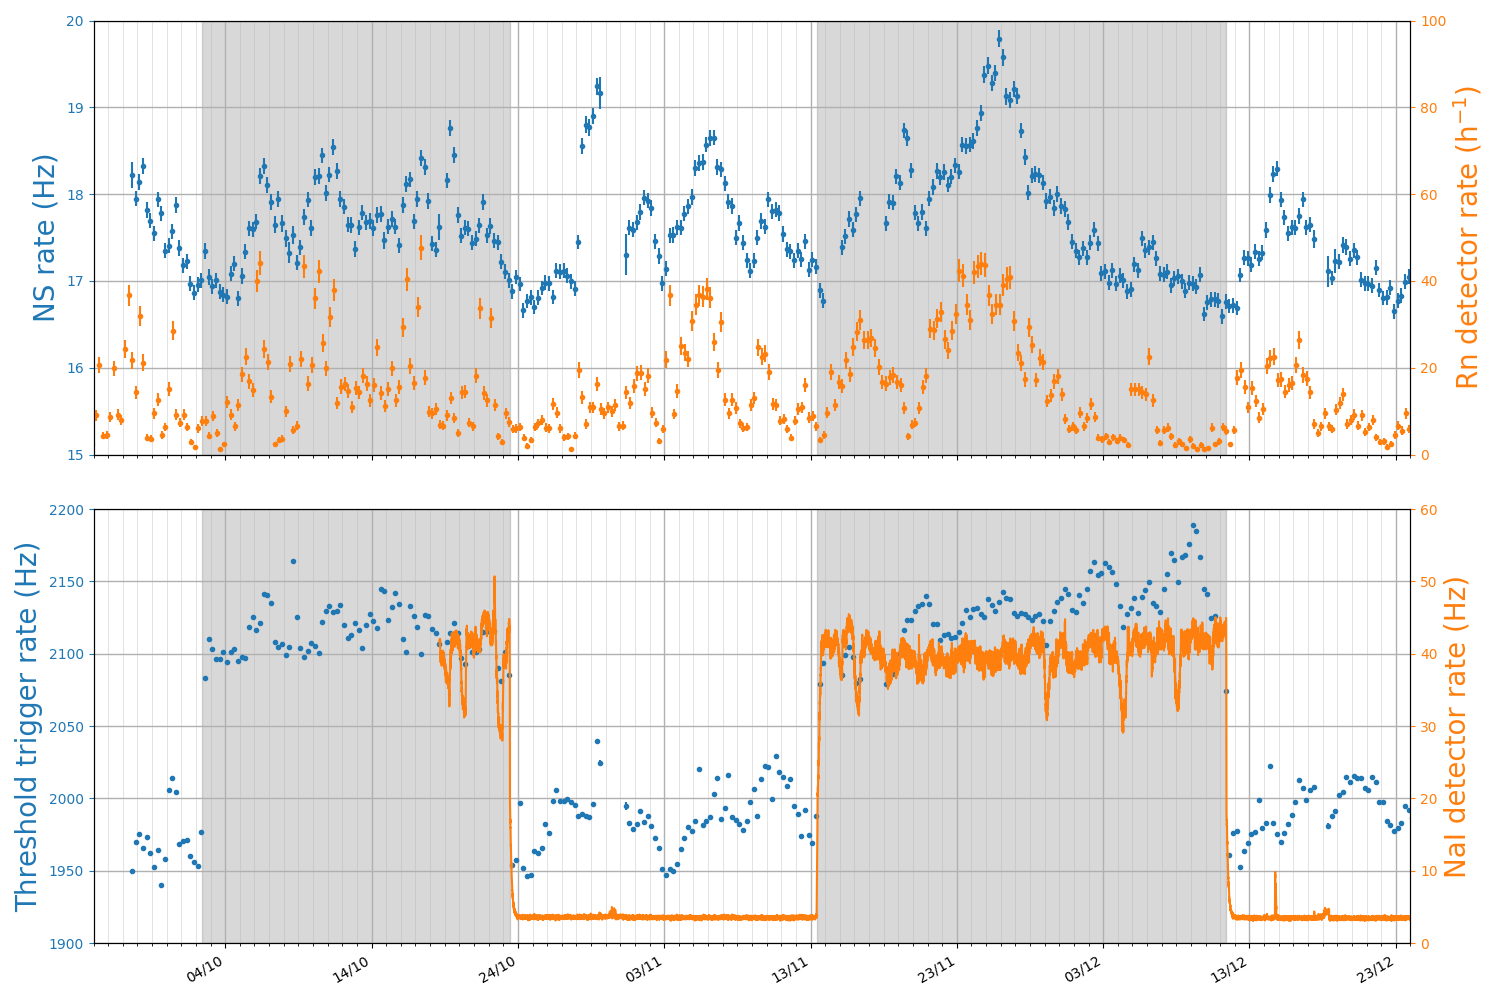
The rates obtained from the monitoring database are shown in Fig. 18.
The NS trigger rate stays stable irrespective to the reactor operation. Once the muon contamination
has been removed, the NS rate is around 18 Hz and is strongly correlated to the airborne radon
concentration which is monitored by a Rn detector (see section 2.5).
The transition between the reactor ON and OFF periods can only be seen by the relatively small change in the threshold trigger rate, which is strongly correlated to the gamma rate measured by the NaI detector placed inside the container next to the detector.
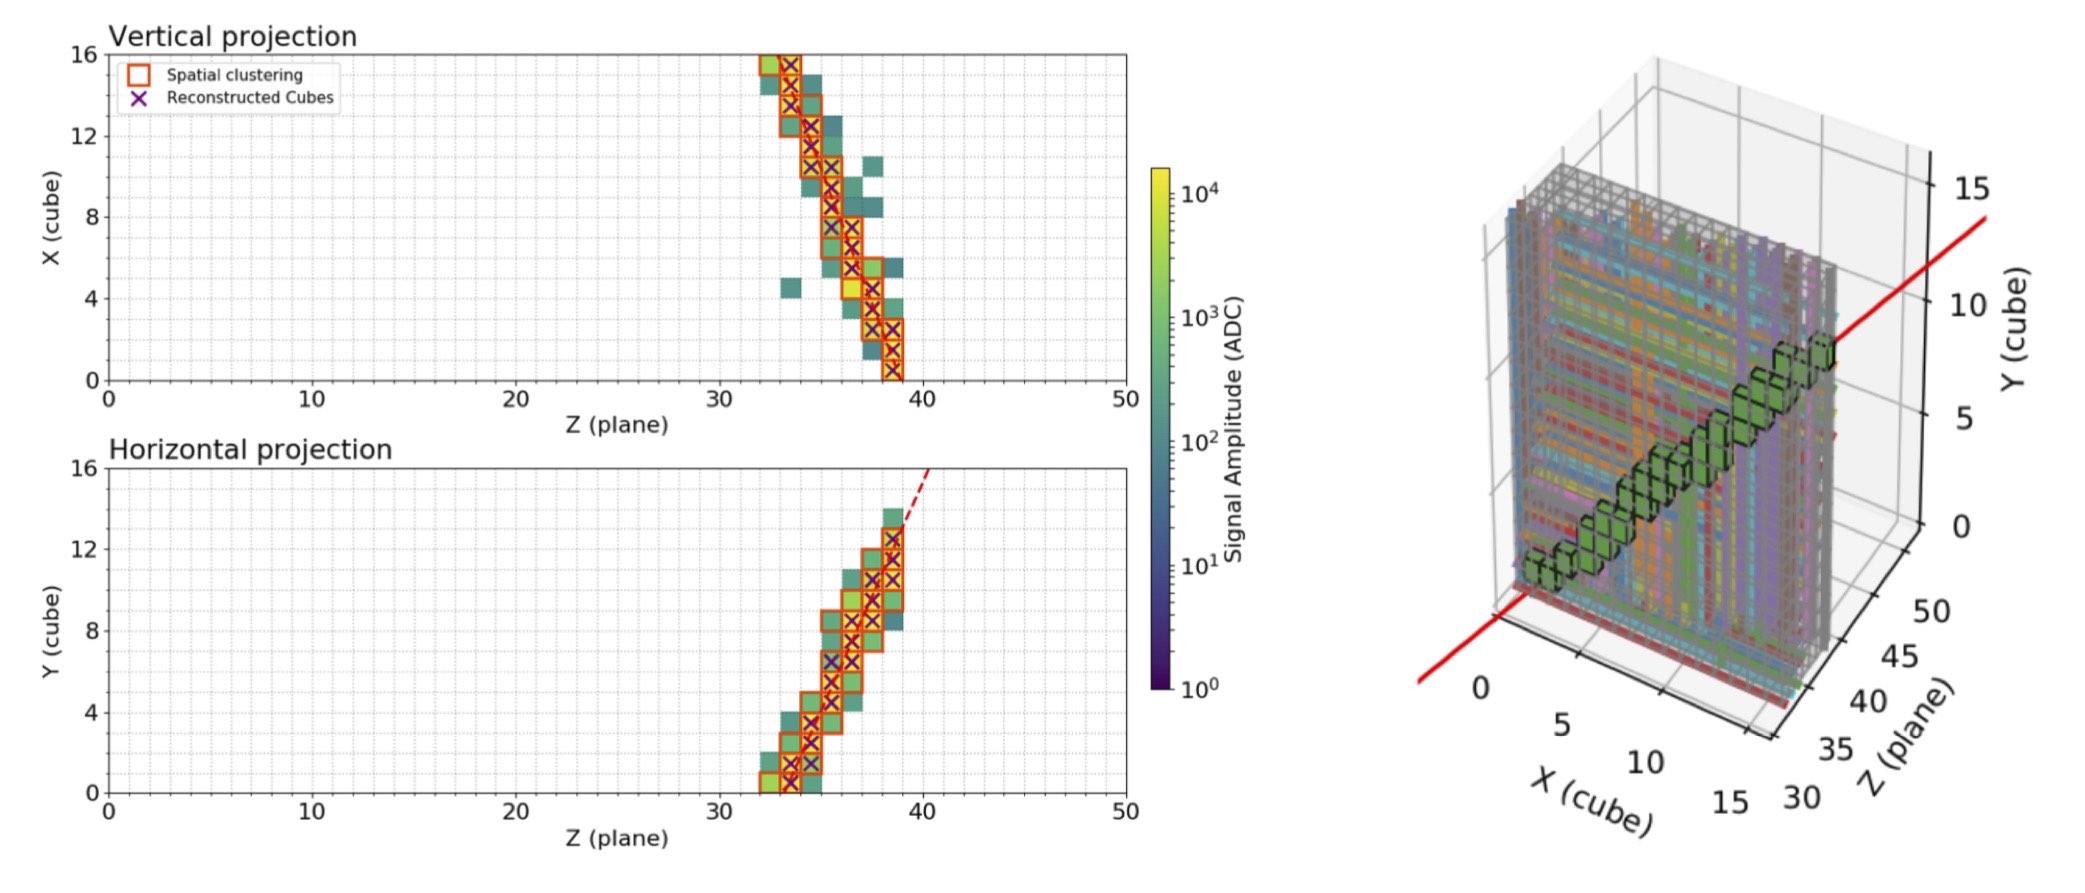
The SoLid detector segmentation provides a powerful tool for identifying cosmic muons crossing
the detector. Muons deposit their energy in a large number of cells along their path.
Their offline reconstruction thus relies on a spatial clustering that groups all signals from neighbouring
fibres, an energy requirement to reject low energetic secondary signals, and finally, a requirement on the fibre
multiplicity. An example of a reconstructed muon track inside the detector is displayed in Fig. 19.
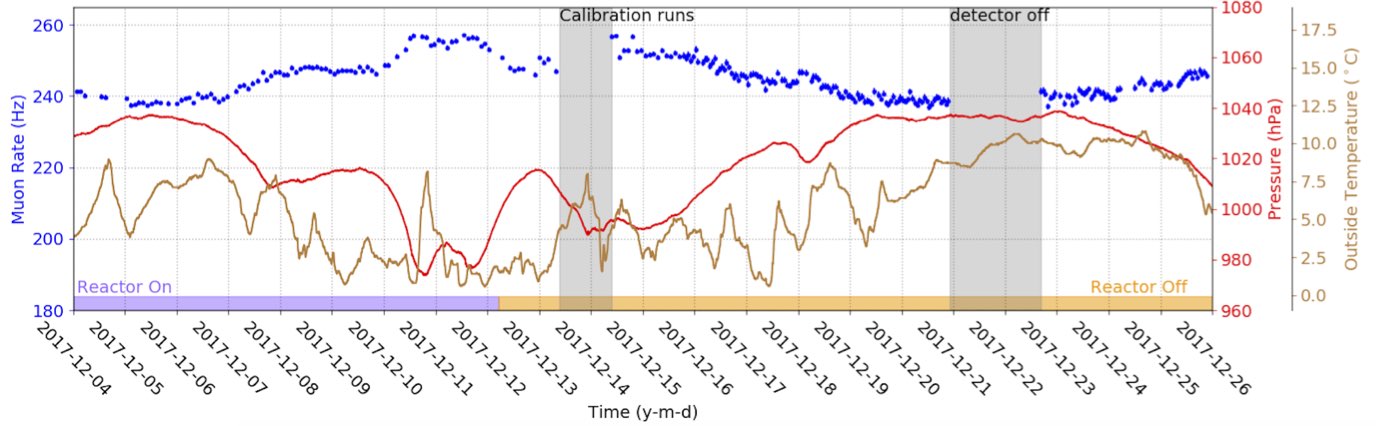
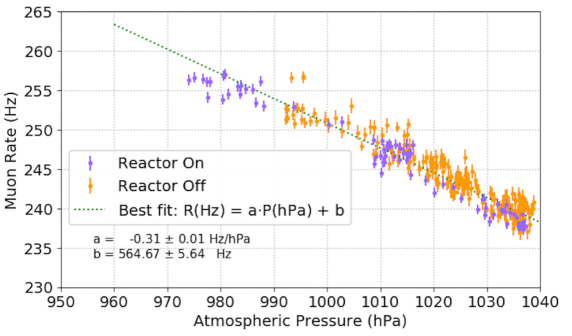
The reconstructed muon track rate, which is about 250 Hz, can be used as a standard observable, providing uniformity maps of the detector response and an effective tool to control the stability over time. As expected, we observe a linear relationship between the muon rate and the atmospheric pressure (see Fig. 20). The muon tracking also allows to verify the time synchronisation of the detector channels.
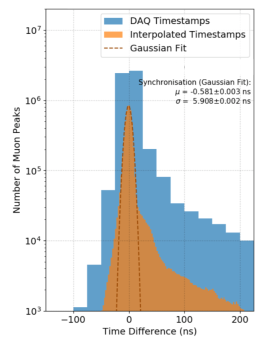
The time in which a muon crosses the detector is negligible compared to the DAQ sampling time and
the deposited energy in each cell has to be detected simultaneously. As shown on Fig. 20, the detection planes are synchronized within 6ns. The origin of the double structure in the positive tail of the time difference distribution is mainly caused by afterpulsing effects when vertical muons deposit a lot of energy, in a single cube. The first shoulder is due to the decay time of a high amplitude pulse back to the pedestal. During this time period, any spurious signal (noise pixel avalanche or afterpulse, is superimposed on a nonzero baseline and can again be reconstructed as an independent energy deposit.
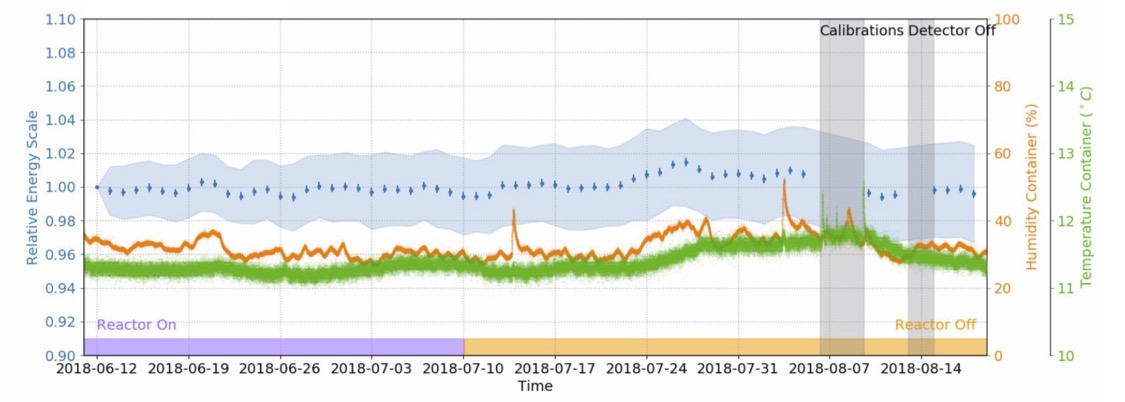
The tracking algorithm also computes the muon path length in each cell by fitting the distributions. It is then possible to continuously monitor the stability of the detector response during physics mode. As shown in Fig. 21, the variation of the energy scale is below 2% over a data taking period of two months. The uncertainties on the energy scale measurements using muon tracks are dominated by the uncertainties on the track fit and the determination of the corresponding path length in each cell. The small drift in energy scale is likely correlated with changes in temperature and humidity of the detector.
6 Simulation
The simulation of the SoLid detector is divided in two parts: one part models the energy loss and scattering of particles, including neutrons, in the SoLid detector and the reactor hall, while the second stage models the optical system of the detector, including the scintillator response, the optical transport, the photon collection by the MPPCs and the electronics response.
6.1 Geant4 model
The first part, SoLidSim, is implemented using the Geant4 simulation library [69]. In order to accurately model the scattering of fast neutrons, the propagation of cosmic showers through the detector and the creation of spallation products in high-Z materials surrounding the detector, a detailed geometry model of the detector surroundings is made. This model, as graphically shown in Fig. 11, is based extensively on detailed blueprints of the reactor building and survey measurements performed prior to detector installation and includes as main features the majority of the concrete and steel structures of the BR2 containment building, including the cylindrical containment building inner and outer walls and dome cap, the concrete floors of level 3, where the detector is located, level 2 below the detector and levels 4 to 7 situated above the detector. Specific features such as staircases, elevator shafts, crane passways, and access holes are included as well. Special care is taken to model in detail the reactor fuel tank, the water pool and its concrete walls with beam ports including concrete and steel plugs, the 20 cm thick lead shielding wall in between the SoLid detector and the radial beam port facing the reactor core. The inclusion of these structures can be switched off in the tracking of particles through the detector to save time and computing power for simulations of IBD events or background processes occurring inside the detector. The geometry of the detector includes besides the sensitive volume of the detector, all HDPE neutron reflectors, all metal structures surrounding the sensitive volume, including the electronics housing, the CROSS system, all mounting rails, the container insulation and steel walls, the passive water and PE shielding surrounding the detector and its support scaffolding.
6.2 Readout simulation
After modelling the energy deposits or the creation of secondary particles in the detector
and its surroundings with SoLidSim, the energies deposited in the sensitive volume of the
detector are translated in detected pixel avalanches in the MPPCs connected to fibres
surrounding the energy deposit. This is modelled in a standalone readout software library,
ROSim, which is specific to SoLid, and supported by dedicated lab bench measurements of various parts of the optical system, as described in [46]. For the optical part, it includes the modelling of the
scintillation photon production in the PVT and in the ZnS scintillator of the neutron detection screens,
in particular the non-linearity corrections to the energy response using Birks’ law, the loss of
scintillation photons due to scattering and absorption in the PVT cubes, the neutron detection screens
and the wrapping material, the attenuation of the wavelength shifted photons in the optical fibres,
the reflectivity and absorption losses in the mirrored fibre ends. The Birks constant values for
PVT and ZnS are based on the literature values for these materials and are respectively
0.15 mm/MeV and 0.001 mm/MeV. The reflectivity of the mirrors on the fibre ends is taken
to be 80%. The attenuation
lengths of each fibre have been accurately measured during in-situ calibration
campaigns with CROSS and vary between 90 cm and 115 cm. The current simulation model
includes the in-situ measured attenuation length of each fibre. The final number of photons
is fluctuated according to Poisson statistics and distributed exponentially in time with time
constants corresponding to the PVT and ZnS scintillator decay constants.
The number of photons arriving at the MPPCs are tuned, via the relevant parameters in ROSim, to the values measured with
calibration campaigns using gamma sources. The readout simulation also takes into account the
measured dark-count rate, which is generated uniformly across the detector at a rate of
110 kHz per channel. The probability of cross-talk in a neighbouring pixel, of about 20%,
is also considered. After an avalanche is triggered in an MPPC, the pixel is insensitive for
incoming photons for a short time period. This pixel recovery is modelled by an exponential
recovery of the pixel bias voltage with a time constant of 24 ns.
The last stage of the simulation takes into account the shaping and amplification of the MPPC signals, and adds a small amount of white noise. This noise is modelled by a Gaussian smearing of the ADC sample amplitudes around the nominal baseline. The RMS of the noise corresponds to the values measured in data and equals 2 ADC, compared to the amplitude of a single pixel avalanche which is 32 ADC for an MPPC bias of 1.8 V above its breakdown voltage. The pulses are finally sampled with the same frequency and resolution as the SoLid ADCs and the data is stored in the same format as real data for processing by the reconstruction software. An example of an IBD event generated with the SoLidSim software and processed by the readout simulation is shown in Fig. 22 and compared to an observed IBD candidate. Since the IBD trigger operates on themalised neutrons, a proper modeling of the neutron waveforms is essential. We assume that neutrons, once thermalised, are indistinguishable with respect to the process they were produced by. As such, thermalised neutrons from the IBD process, or from a neutron calibration source, should behave identical. Consequently, a trigger bias on a neutron waveform from IBD events should behave the same as one on a neutron waveform from a calibration source. We therefore tune the NS waveforms in the simulation to neutron induced waveforms from data using our neutron calibration sources with a high neutron flux (1000-3800 n/sec), collected by the NS trigger. The true trigger efficiency, as obtained from dedicated neutron calibration campaigns, is applied later in any IBD analysis as an overall scale factor.
7 Data taking and calibration
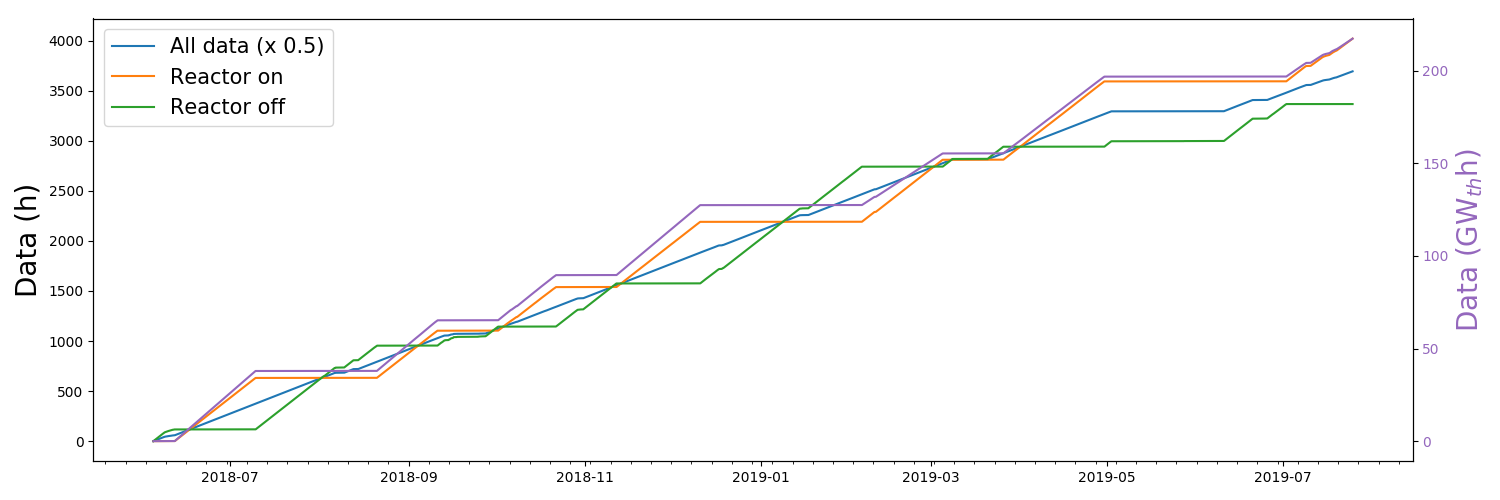
The SoLid detector was commissioned between February and June in 2018, after which it entered stable physics operations. Since then the experiment has been in continuous operation during all subsequent BR2 reactor cycles and refuelling periods (see section 4.1). We thus collect approximately as much reactor ON data as reactor OFF data. The data taking is guaranteed to last until the end of 2021, but can possibly still be extended if needed, in order to accumulate enough statistics and achieve a relative measurement almost solely limited by the systematics of the detector.. On a regular basis, in between reactor ON cycles, two to five days are reserved for in-situ detector calibrations using the CROSS system, described in section 2, with several neutron and gamma sources, as described below. The periods during which the SoLid detector collected physics quality data during reactor ON periods is summarized in Tab. 2, and the periods during which calibration data were taken are shown in Tab. 3. The integrated amount of data taking time under various conditions, together with the integrated BR2 reactor power at which the SoLid detector collected physics data, is shown in Fig. 23 over the course of one year of operation.
| Period | days | Thermal Power (MWth) |
|---|---|---|
| 12/06/18 – 10/07/18 | 28 | 60 |
| 21/08/18 – 11/09/18 | 21 | 58 |
| 02/10/18 – 22/10/18 | 20 | 56 |
| 12/11/18 – 11/12/18 | 29 | 58 |
| 05/02/19 – 05/03/19 | 28 | 45 |
| 26/03/19 – 30/04/19 | 35 | 53 |
| 02/07/19 – 06/08/19 | 35 | 48 |
| Total | 196 | 54 |
| Year | month | Source | LY (PA/MeV) | rms LY (PA/MeV) |
|---|---|---|---|---|
| 2018 | August | 22Na, AmBe | 92.2 | 6.7 |
| 2018 | September | 22Na, 207Bi, AmBe, 252Cf | 96.7 | 7.5 |
| 2018 | October | 22Na, AmBe | 96.2 | 7.4 |
| 2018 | December | 22Na | 97.0 | 7.4 |
| 2019 | January | 22Na | 96.0 | 7.5 |
| 2019 | May | 22Na, AmBe, 252Cf | 94.5 | 7.3 |
7.1 Neutron calibration
The neutron detection efficiency drives directly the IBD detection efficiency. In SoLid, we aim to perform an absolute flux measurement as well as an oscillation analysis based on the relative flux distortion across the detector. To this end, we aim to determine the neutron detection efficiency per module with an accuracy of around 5% in absolute and at the % level in relative. Due to the fact that the coverage of the neutron sources are not uniform within the detector, the calibration is done individually for each of the 12800 detection cells before being averaged.
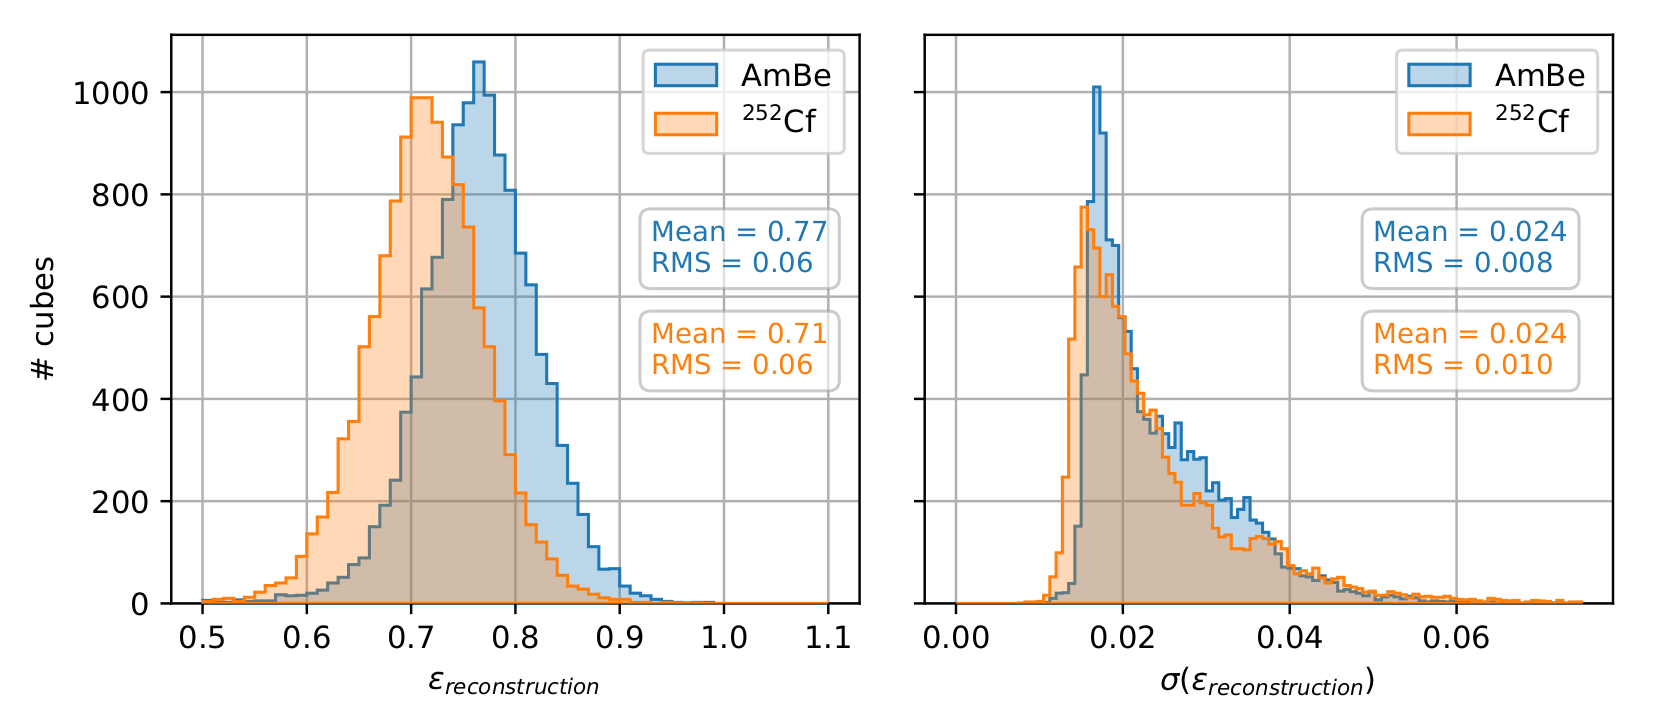
The neutron detection efficiency, hereafter denoted as , can be expressed as the product . In the first place, the probability that the neutron gets captured on the neutron detection screens, denoted , depends on the position and initial energy of the neutron, as well as its transport in the experimental set-up. These neutron capture efficiency is determined at the detection cell level for each neutron source and at each source positions, by using dedicated Geant4 Monte-Carlo simulations. Secondly, the reconstruction efficiency, denoted, , is the convolution of the probability that the neutron signal trigger the DAQ with the probability that the associated NS trigger event pass the offline analysis cuts. It does not depend on the neutron origin and is determined by comparing calibration measurements with the dedicated Geant4 Monte-Carlo simulations.
The NS trigger was optimized during the detector commissioning to ensure the largest possible neutron trigger efficiency, while keeping the data rate sustainable (see section 3). However, this come with a relatively low NS event purity of about 20%. The first step consists in removing the muons contribution (see section 5.2). In order to reject remaining background, the second requirement is based on an offline pulse shape discrimination using the integral over amplitude ratio. The results are displayed in Fig. 24. For the standard data taking in physics mode at BR2, the NS signals, whose rate does not depend on the reactor operation, can be well separated from the tagged ES events, with a purity above 99% after the selection requirements are applied.
| Neutron Source | <> [MeV] | Initial Activity [n/s] | Multiplicity | Process |
|---|---|---|---|---|
| AmBe | 4.16 | 1794 (35) | 1 | |
| 2.13 | 3804 (34) | 3.764 (2) | spontaneous fission |
During calibration runs, two neutron sources are used, AmBe and 252Cf, for which activities have been calibrated at the 2% precision level at the National Physical Laboratory (UK). The use of two neutron sources, having different characteristics in terms of multiplicity and average neutron energy (see Tab. 4), allows to estimate the systematics uncertainties related to the Monte-Carlo neutron transport as well as the NS reconstruction analysis [70]. The two neutron calibration sources are positioned according to the 54 points predefined by CROSS (see section 2.6), with an exposure time of 50 minutes per point for the AmBe source, respectively 60 minutes for the 252Cf source. Thus, we obtain a cumulative statistic greater than reconstructed NS events with the AmBe source, respectively reconstructed NS events with the 252Cf source. It corresponds to a statistical uncertainty less than 0.2% at the level of the plane and of about 5% in the most unfavorable case at the level of the cell. In turn, the neutron reconstruction efficiency is evaluated cell per cell, with a mean total uncertainty (stat. + syst.) of about 2% (see Fig. 25).
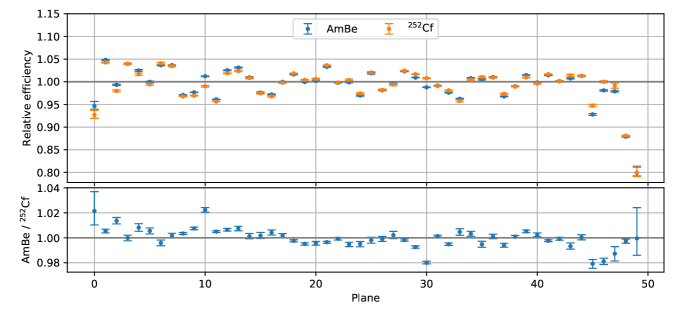
Systematic errors related to the detector dead-time and reconstruction inefficiency are corrected at the plane level. As shown on Fig. 26, when cell response are being averaged, the relative neutron reconstruction efficiency per plane is homogeneous at 5% level across the detector, except for the planes in front and in the back of the detector, due to the higher probability for neutrons to escape. The SoLid detector has an average neutron reconstruction efficiency of 73.9%. The absolute systematic uncertainties, which are below 5% at the module level, are estimated taking into account the difference in efficiency for the two neutron sources and the uncertainty in the activity of those sources. Since the probability of capture of neutrons coming from IBD is of the order of 72%, we obtain an absolute detection efficiency for IBD neutrons greater than 52%, with a relative uncertainty between detector modules below 2% [70].
7.2 Energy scale
To be sensitive to a oscillation, the ES energy reconstruction needs to be
measured accurately. To that end, the SoLid detector response is calibrated using sources at various energies (see Tabs. 5). The energy scale and its dependence upon the actual deposited energy is currenlty known at the 2% level.
| -ray Source | Energies [MeV] (Intensity [%]) | Initial Activity [kBq] |
| 22Na | 0.511 (181) ; 1.275 (99.9) | 37 |
| 207Bi | 0.570 (98) ; 1.064 (75) ; 1.770 (7) | 37 |
| AmBe | 4.43 | - |
During standard calibration runs, the energy scale in each detection cell is determined using a
37 kBq 22Na gamma source. This source is placed at nine different positions in
each of the 6 detector gaps, using the CROSS system. To reconstruct the total amount of
light produced in a given cell, the total number of detected photons originating from the 22Na decay spectrum per cell must be computed.
To perform this operation, coincidences are searched for between the two vertical and the two horizontal
sensors coupled to the four fibres going through each cell. Finally the four amplitudes are summed
taking into account the gain of each MPPC. Gammas from the 22Na source (511 keV and 1270 keV) interact in the
PVT mostly through Compton scattering. In addition, given the granularity of the detector planes,
only a fraction of the total gamma energy is deposited within each PVT cube. Consequently, a broad visible energy spectrum needs to be reconstructed and fitted for one or more Compton edges.
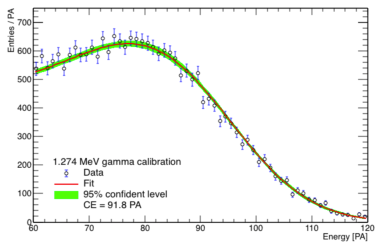
During the quality assurance process, two methods to tackle the latter issue were developed [50]. The first
method consists of fitting the Compton edge profile of the spectrum by an analytical function based
on the Klein-Nishina cross section and the result is compared to the predicted value (see Fig. 27).
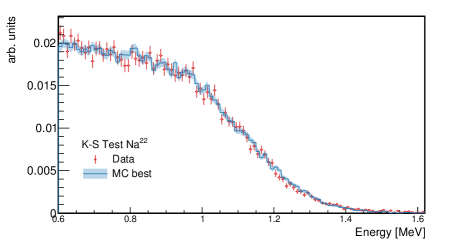
The second method employs a Kolmogorov-Smirnov test and compares the measured energy spectrum to a
Geant4 simulated sample varying the energy scale and energy resolution (see Fig. 27). Although the two methods rely on different assumptions and different event selections, the obtained results are consistent within 2% and meet the required energy scale precision [50]. For the standard data taking in physics mode at BR2, an average of 94 PA/MeV/cell was measured without MPPC cross-talk subtraction, which is estimated to be around
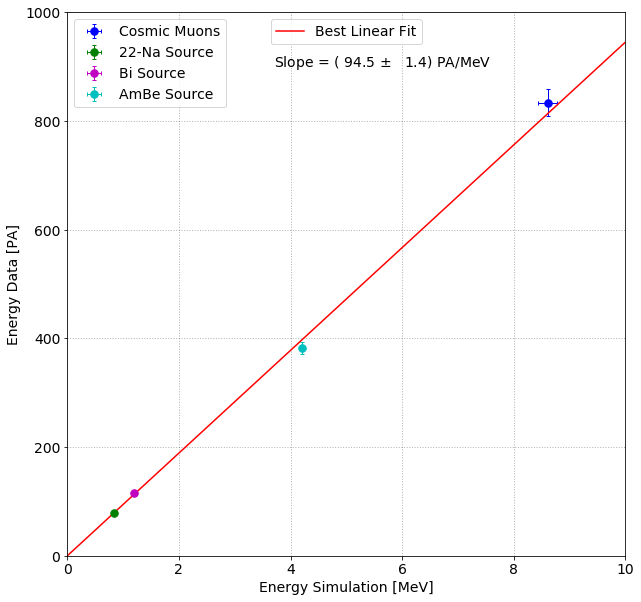
20%. The light yield is uniform across the whole detector, as in shown in Fig. 28, and is stable over time, as can be seen in Fig. 29. The variation of the mean value of the light yield and the RMS of its distribution are within 2% over a period of one year. For linearity studies, 207Bi and AmBe radioactive sources are also used in two detector gaps, in addition to the 22Na source. The light yield ratio measured with two difference sources is consistent with what is expected for linear behavior as can be seen in Fig. 29. Figure 30 shows the reconstructed energy as function of the fitted dE/dx for muons, or the Compton edge position for the gamma calibration sources. It illustrates the linear response of the PVT scintillator over our energy range.


8 Conclusion
The Solid collaboration constructed a 1.6 ton highly segmented neutrino detector based on an affordable dual scintillator technology in the years 2016-2017. The use of PVT for calorimetry is cost-effective and provides a linear energy response with an adequate energy resolution of 12% at 1 MeV, allowing for a very fine spatial segmentation of the fiducial volume. The 3D segmentation is an intrinsic feature of our detector with the potential to reduce intrinsic radioactivity backgrounds, accidentals and multiple recoils induced by fast neutrons. It will eventually also allow us to tag the annihilation gammas from positron interactions, which is a distinct feature of IBD events, provided that the energy reconstruction thresholds can address the low energy deposits per cell of 511 keV gammas. The detector is capable of operating at very close proximity to a compact research reactor with practically no overburden. Its design is simple and very modular and some of its parameters were improved after a measurement campaign with a single module prototype in 2015. As of the spring of 2018 the full size SoLid detector is in continuous operation at the BR2 research reactor of the SCK CEN in Belgium. The BR2 reactor is operated with highly enriched 235U fuel arranged in a very compact geometry, which reduces the uncertainties in the calculation of the incoming electron antineutrino flux and its energy spectrum. The detector has proven to run very stably over long periods of time and can be routinely calibrated with dedicated gamma and neutron sources with an in-situ system. The statistical energy resolution, the energy scale precision and the level of inter-channel response calibration all adhere to or surpass the initial SoLid design specifications. A detailed geometry description and detector response simulation have been developed, allowing for a future validation and understanding of the physical and instrumental backgrounds and an optimisation of the neutrino detection and oscillation measurements.
9 Acknowledgements
This work was supported by the following funding agencies: Agence Nationale de la Recherche grant ANR-, Institut Carnot Mines, CNRS/IN2P3 and Region Pays de Loire, France; FWO-Vlaanderen and the Vlaamse Herculesstichting, Belgium; The U.K. groups acknowledge the support of the Science & Technology Facilities Council (STFC), United Kingdom; We are grateful for the early support given by the sub-department of Particle Physics at Oxford and High Energy Physics at Imperial College London. We thank also our colleagues, the administrative and technical staffs of the SCK CEN for their invaluable support for this project. Individuals have received support from the FWO-Vlaanderen and the Belgian Federal Science Policy Office (BelSpo) under the IUAP network programme; The STFC Rutherford Fellowship program and the European Research Council under the European Union’s Horizon 2020 Programme (H2020-CoG)/ERC Grant Agreement n. 682474; Merton College Oxford.
References
- [1] B. Pontecorvo, Neutrino experiments and the problem of conservation of leptonic charge, J. Exptl. Theoret. Phys. 53 (1967) 1717–1725.
- [2] LSND collaboration, A. Aguilar et al., Evidence for neutrino oscillations from the observation of appearance in a beam, Phys. Rev. D 64 (Nov, 2001) 112007.
- [3] MiniBooNE collaboration, A. Aguilar-Arevalo et al., Improved Search for Oscillations in the MiniBooNE Experiment, Phys. Rev. Lett. 110 (2013) 161801, [1303.2588].
- [4] M. Acero et al., Limits on and disappearance from gallium and reactor experiments, Physical Review D 78 (10, 2008) .
- [5] C. Giunti and M. Laveder, Statistical significance of the gallium anomaly, Physical Review C 83 (06, 2010) .
- [6] J. Kostensalo et al., The gallium anomaly revisited, Physics Letters B 795 (2019) 542 – 547.
- [7] T. A. Mueller et al., Improved predictions of reactor antineutrino spectra, Phys. Rev. C 83 (May, 2011) 054615.
- [8] G. Mention et al., Reactor antineutrino anomaly, Physical Review D 83 (Apr, 2011) .
- [9] P. Huber, Determination of antineutrino spectra from nuclear reactors, Phys. Rev. C 84 (Aug, 2011) 024617.
- [10] M. Dentler et al., Updated global analysis of neutrino oscillations in the presence of ev-scale sterile neutrinos, Journal of High Energy Physics 2018 (Aug, 2018) .
- [11] J. M. Berryman et al., Sterile Neutrinos and the Global Reactor Antineutrino Dataset, arXiv:2005.01756.
- [12] K. N. Abazajian, M. A. Acero, S. K. Agarwalla, A. A. Aguilar-Arevalo, C. H. Albright, S. Antusch et al., Light sterile neutrinos: A white paper, 2012.
- [13] NEOS collaboration, Y. Ko et al., Sterile Neutrino Search at the NEOS Experiment, Phys. Rev. Lett. 118 (2017) 121802, [1610.05134].
- [14] DANSS collaboration, M. Danilov, Sensitivity of the DANSS detector to short range neutrino oscillations, PoS EPS-HEP2013 (2013) 493, [1311.2777].
- [15] A. P. Serebrov et al., Sterile Neutrino Search in the Neutrino-4 Experiment at the SM-3 Reactor, Phys. Part. Nucl. 49 (2018) 701–708.
- [16] STEREO collaboration, N. Allemandou et al., The STEREO Experiment, JINST 13 (2018) P07009, [1804.09052].
- [17] PROSPECT collaboration, J. Ashenfelter et al., The prospect reactor antineutrino experiment, Nuclear Instruments and Methods in Physics Research Section A: Accelerators, Spectrometers, Detectors and Associated Equipment 922 (Apr, 2019) 287–309.
- [18] STEREO collaboration, H. Almazán et al., Improved sterile neutrino constraints from the stereo experiment with 179 days of reactor-on data, Phys. Rev. D 102 (Sep, 2020) 052002.
- [19] PROSPECT collaboration, M. Andriamirado et al., Improved short-baseline neutrino oscillation search and energy spectrum measurement with the prospect experiment at hfir, 2006.11210.
- [20] A. P. Serebrov and R. M. Samoilov, The analysis of the results of the neutrino-4 experiment on search for sterile neutrino and comparison with results of other experiments, 2003.03199.
- [21] S. Gariazzo et al., Model-independent short-baseline oscillations from reactor spectral ratios, Physics Letters B 782 (2018) 13 – 21.
- [22] R. Acciarri et al., A Proposal for a Three Detector Short-Baseline Neutrino Oscillation Program in the Fermilab Booster Neutrino Beam, 1503.01520.
- [23] Double Chooz collaboration, Y. Abe et al., Improved measurements of the neutrino mixing angle with the Double Chooz detector, JHEP 10 (2014) 086, [1406.7763].
- [24] Daya Bay collaboration, F. P. An et al., Measurement of the reactor antineutrino flux and spectrum at daya bay, Phys. Rev. Lett. 116 (Feb, 2016) 061801.
- [25] RENO collaboration, J. Choi et al., Observation of Energy and Baseline Dependent Reactor Antineutrino Disappearance in the RENO Experiment, Phys. Rev. Lett. 116 (2016) 211801, [1511.05849].
- [26] A. A. Sonzogni et al., Dissecting reactor antineutrino flux calculations, Phys. Rev. Lett. 119 (Sep, 2017) 112501.
- [27] X. B. Wang and A. C. Hayes, Weak magnetism correction to allowed decay for reactor antineutrino spectra, Phys. Rev. C 95 (Jun, 2017) 064313.
- [28] L. Hayen et al., First-forbidden transitions in the reactor anomaly, Phys. Rev. C 100 (Nov, 2019) 054323.
- [29] A. C. Hayes et al., Analysis of the daya bay reactor antineutrino flux changes with fuel burnup, Phys. Rev. Lett. 120 (Jan, 2018) 022503.
- [30] G. Mention et al., Reactor antineutrino shoulder explained by energy scale nonlinearities?, Physics Letters B 773 (2017) 307 – 312.
- [31] STEREO collaboration, H. Almazán et al., Accurate measurement of the electron antineutrino yield of u-235 fissions from the stereo experiment with 119 days of reactor-on data, 2020.
- [32] PROSPECT collaboration, J. Ashenfelter et al., Performance of a segmented 6Li-loaded liquid scintillator detector for the PROSPECT experiment, JINST 13 (2018) P06023, [1805.09245].
- [33] SoLid collaboration, Y. Abreu et al., A novel segmented-scintillator antineutrino detector, JINST 12 (2017) P04024, [1703.01683].
- [34] SoLid collaboration, Y. Abreu et al., Performance of a full scale prototype detector at the BR2 reactor for the SoLid experiment, JINST 13 (2018) P05005, [1802.02884].
- [35] C. L. Cowan et al., Detection of the Free Neutrino: A Confirmation, Science 124 (1956) .
- [36] M. Abbes et al., The bugey 3 neutrino detector, Nuclear Instruments and Methods in Physics Research Section A: Accelerators, Spectrometers, Detectors and Associated Equipment 374 (1996) 164 – 187.
- [37] T. Adam et al., The JUNO Conceptual Design Report, 1508.07166.
- [38] Borexino collaboration, G. Alimonti et al., The Borexino detector at the Laboratori Nazionali del Gran Sasso, Nucl. Instrum. Meth. A 600 (2009) 568–593, [0806.2400].
- [39] KamLAND collaboration, S. Abe et al., Production of radioactive isotopes through cosmic muon spallation in kamland, Phys. Rev. C 81 (Feb, 2010) 025807.
- [40] Daya Bay collaboration, F. An et al., The Detector System of The Daya Bay Reactor Neutrino Experiment, Nucl. Instrum. Meth. A 811 (2016) 133–161, [1508.03943].
- [41] M. Goodman et al., Double Chooz, a search for the neutrino mixing angle theta-13, hep-ex/0606025.
- [42] RENO collaboration, J. K. Ahn et al., RENO: An experiment for neutrino oscillation parameter using reactor neutrinos at yonggwang, 1003.1391.
- [43] H. Lima Jr. et al., Neutrinos angra experiment: commissioning and first operational measurements, Journal of Instrumentation 14 (jun, 2019) P06010–P06010.
- [44] ELJEN general purpose plastic scintillator: online datasheet. https://eljentechnology.com/images/products/data_sheets/EJ-200_EJ-204_EJ-208_EJ-212.pdf.
- [45] SCINTACOR neutron screens: online datasheet. https://scintacor.com/wp-content/uploads/2015/09/Datasheet-Neutron-Screens-High-Res.pdf.
- [46] SoLid collaboration, Y. Abreu et al., Optimisation of the scintillation light collection and uniformity for the SoLid experiment, JINST 13 (2018) P09005, [1806.02461].
- [47] DuPont Tyvek 1082D: online datasheet. https://www.dupont.cn/content/dam/dupont/amer/us/en/microsites/tyvek-design/images/documents/2019-C&I_Tyvek_1082D_Datasheet.pdf.
- [48] Saint-Gobain plastic scintillating fibers: online datasheet. https://www.crystals.saint-gobain.com/sites/imdf.crystals.com/files/documents/fiber-product-sheet.pdf.
- [49] Hamamatsu multi-pixel photon counter: online datasheet. https://www.hamamatsu.com/resources/pdf/ssd/s12572-010_etc_kapd1045e.pdf.
- [50] SoLid collaboration, Y. Abreu et al., Development of a Quality Assurance Process for the SoLid Experiment, JINST 14 (2019) P02014, [1811.05244].
- [51] SoLid collaboration, Y. Abreu et al., Commissioning and Operation of the Readout System for the SoLid Neutrino Detector, JINST 14 (2019) P11003, [1812.05425].
- [52] M. Caresana et al., Real-time measurements of radon activity with the timepix-based RADONLITE and RADONPIX detectors, JINST 9 (nov, 2014) P11023–P11023.
- [53] EWELLIX Linear actuators CAHB series: online datasheet. https://www.ewellix.com/en/global/products/linear-actuators/cahb-series/cahb-10.
- [54] BALLUF capacitive level sensors: online datasheet. https://publications.balluff.com/pdfengine/pdf?type=pdb&id=186561&con=en&ws=appoval.
- [55] XILINX,7 Series FPGAs: online datasheet. https://www.xilinx.com/support/documentation/data_sheets/ds180_7Series_Overview.pdf.
- [56] SoLid collaboration, L. Arnold et al., The SoLid anti-neutrino detector’s readout system, JINST 12 (2017) C02012, [1701.02278].
- [57] CC-IN2P3 website. https://cc.in2p3.fr.
- [58] SCK-CEN BR2 Website. https://www.sckcen.be/en/Research/Infrastructure/BR2.
- [59] SoLid collaboration, I. Pinera-Hernandez, Identification of background components with the SoLid anti-neutrino detector, in Proceedings, 2016 IEEE Nuclear Science Symposium and Medical Imaging Conference: NSS/MIC 2016: Strasbourg, France, p. 8069849, 2016. DOI.
- [60] S. Kalcheva, G. Van den Branden, V. Kuzminov, E. Koonen, L. Giot and M. Fallot, Reactor Core Simulations for Determination of the Antineutrino Spectrum for the SoLid Experiment at BR2 Reactor, Proceedings M&C 2017 (Jeju, South Korea) April 16–20, 2017.
- [61] MCNPX, Version 2.7.0, LANL, LA-UR-11-02295, April 2011.
- [62] MCNP6, Version 6.1.1beta, LANL, LA-CP-14-00745, June 2014.
- [63] MURE, MCNP utility for reactor evolution (2009), O. Meplan. Tech. Rep. LPSC 0912 and IPNO-09-01 (2009). http://www.nea.fr/tools/abstract/detail/nea-1845.
- [64] M. Fallot et al., New Antineutrino Energy Spectra Predictions from the Summation of Beta Decay Branches of the Fission Products, Phys. Rev. Lett. 109 (2012) 202504, [1208.3877].
- [65] Gordon M.S. et al., Measurement of the flux and energy spectrum of cosmic-ray induced neutrons on the ground, IEEE Transactions on Nuclear Science 51 (2004) .
- [66] Cosmic-ray shower library (cry), tech. rep., Lawrence Livermore National Laboratory, 2012. UCRL-TM-229453 (2012) .
- [67] M. Guan et al., A parametrization of the cosmic-ray muon flux at sea-level, 1509.06176.
- [68] D. Reyna, A simple parameterization of the cosmic-ray muon momentum spectra at the surface as a function of zenith angle, hep-ph/0604145.
- [69] GEANT4 collaboration, S. Agostinelli et al., GEANT4: A Simulation toolkit, Nucl. Instrum. Meth. A506 (2003) 250.
- [70] V. Pestel, “PhD thesis, détection de neutrinos auprès du réacteur BR2: analyse des premières données de l’expérience SoLid.” https://hal.archives-ouvertes.fr/tel-02469046.