Development of the magnetism in the solid solution of the candidate Weyl semimetals Ce1-xPrxAlGe
Abstract
We investigate the macroscopic and microscopic physical properties of the solid solution of Ce1-xPrxAlGe. The series tunes from CeAlGe with its multi- structure and a major moment in the ab-plane, to PrAlGe with an easy-c-axis ferromagnetic ground state co-existing with a low density of nanoscale textured magnetic domain walls. Using AC-, DC-susceptiblity, resistivity, specific heat, muon spin relaxation/rotation and neutron scattering we analyze the magnetic ground state of the series. We provide further evidence supporting our previous claim for spin-glass like properties in pure PrAlGe. With introduction of Pr to CeAlGe the finite magnetic field required to stabilize the topological multi- magnetic phase for becomes suppressed. The crossover between the two end-member ground states occurs in the vicinity of , a region where we further anticipate the field-induced topological magnetic phase for to become the zero field ground state.
I Introduction
Weyl semimetals are a new class of topological conductors where in the bulk, conduction and valence bands cross at discrete singular points known as Weyl points Weyl (1929). After the first experimental evidence for such a state in TaAs in 2015 Xu et al. (2015a, b) many new candidates have been explored. Magnetic Weyl semimetal yield the possibility of controlling the Weyl node pattern with an external magnetic field. For this class of materials recent theoretical calculations predicted that the polar magnet family AlGe ( = Ce, Pr) Chang et al. (2018) offers remarkable tunability where type- I, type-II inversion-breaking, and time-reversal-breaking types of ferromagnetic Weyl semimetal states are all available. These magnetic non-centrosymmetric semimetals offer rich possibilities for Weyl fermions since both spatial and time-reversal symmetries are broken for which the microscopic states can be tuned via chemical substitution.
While ternary LaPtSi-type (I41md) AlGe alloys were already discovered in 1992 Dhar et al. (1992) the interest of these systems in the context of topological states has only been realized in 2018 Chang et al. (2018). Until recently only structural, specific heat and magnetization data were published on CeAlGe polycrystalline samples Dhar et al. (1992); Flandorfer et al. (1998); Dhar and Pattalwar (1996) while for PrAlGe only the crystal structure had been studied previously Gladyshevskii et al. (2000). Since the theoretical proposal of a Weyl state in these materials however, the interest in the two candidates has been recently ignited Puphal et al. (2019); Hodovanets et al. (2018); Suzuki et al. (2019); Meng et al. (2019). We were able to grow stoichiometric single crystals of both CeAlGe ( K) and PrAlGe ( K) Puphal et al. (2019) by floating zone growth and probe their magnetic structures using small-angle neutron scattering (SANS) and neutron powder diffraction (NPD). Other reported experimental studies were done on Al-self flux grown crystals which often present an Al enrichment and lead to different physics Puphal et al. (2019); Hodovanets et al. (2018); Suzuki et al. (2019). While PrAlGe presents the expected easy-c-axis ferromagnetic ground state Destraz et al. (2020), for CeAlGe we discovered a surprisingly complex multi- structure with a field induced topological magnetic state Puphal et al. (2020).
Here we present the magnetic ground state evolution tuned by chemical substitution in polycrystalline materials of the Ce1-xPrxAlGe solid solution. We performed a detailed magnetic characterization, analyzing AC-, DC-susceptiblity, specific heat, transport, muon spin resonant relaxation/rotation (μSR) spectroscopy as well as neutron scattering results. As our main result, we find a crossover in the nature of the magnetic groundstate at , where moreover the magnetic field-stablized topological phase for slightly above 0.3 likely becomes the zero field ground state for a small region of .
II Experimental Details
The polycrystalline samples were prepared by arc melting with a Compact Arc Melter MAM-1, the three starting elements Ce/Pr, Al and Ge of a minimum purity of 99.99% for homogeneity. X-ray fluorescence (XRF) spectra were recorded using the Orbis microXRF analyzer from EDAX. AC- and DC- magnetic susceptibility were carried out in a range of 1.8 - 400 K, 0 - 7 T and 0.02 - 1480 Hz, using a Quantum Design Magnetic Property Measurements System (MPMS). Additionally AC- and DC- magnetic susceptibility measurements, resistivity and specific heat measurements were carried out in the range of 1.8 - 300 K and 0 - 9 T, 10-10000 Hz on a Physical Property Measurement System (PPMS). Neutron diffraction experiments were done at beamlines at Institute Laue-Langevin (ILL): D11 small-angle neutron scattering (SANS) beamline in the range of 1.5 - 20 K with a wavelength of using polycrystalline ingots of Ce1-xPrxAlGe each of around 300 mg glued on an aluminium plate with GEvarnish, D1B at K, 7 K and 15 K with a wavelength of , as well as D2B K using both on powderized polycrystalline samples of 2 g each loaded into indium sealed vanadium cans in a helium glovebox. Pressed pellets of powderized polycrystalline ingots of PrAlGe, CeAlGe and Ce0.7Pr0.3AlGe of 5 mm diameter were measured on the GPS instrument at the Swiss muon source at PSI, in zero magnetic field (ZF) and temperatures down to 1.6 K
III Elemental Analysis (EDS)
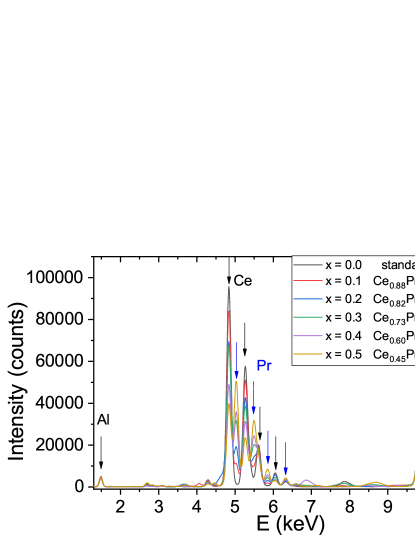
A detailed XRF study was performed to analyze carefully the compositions of all polycrystalline materials. This characterization is crucial, since both the structure-type and physical property transition temperatures can vary according to small compositional variations of AlxGe2-x Dhar and Pattalwar (1996); Hodovanets et al. (2018), which has a tremendous impact on the physical properties Puphal et al. (2019). For the XRF study, we used a CeAlGe polycrystalline sample characterized in detail by XRF, energy dispersive spectroscopy (EDS) and neutron diffraction Puphal et al. (2020) as a standard.
In case of the polycrystalline materials the issues faced for self-flux growth do not exist and all samples are perfectly homogenous stoichiometric ingots as determined from the XRF data (see Figure 1). The shown data are single point measurements with a 30 μm wide beam counted for an hour in vacuum. No averaging was performed, as we saw no variation between the samples within uncertainty (checked by detailed mapping of a large polished area). The off-stoichiometry of the determined compositions and listed in the legend of Figure 1 is maximally 0.05, and is below the 2 at% standard error of any elemental analysis. Furthermore this XRF analysis was cross-checked with an EDS analysis in a scanning electron microscope (SEM) which confirms perfect sample stoichiometries within uncertainty.
IV Crystal structure
| T [K] | 300 | 15 | ||||
|---|---|---|---|---|---|---|
| x | 0.2 | 0.4 | 0.6 | 0.2 | 0.4 | 0.6 |
| a | 4.27884(1) | 4.27449(1) | 4.26957(2) | 4.26003(9) | 4.26290(7) | 4.25638(9) |
| c | 14.69229(9) | 14.68619(8) | 14.68354(10) | 14.65517 (39) | 14.66125(32) | 14.64836(38) |
| 0.59270(20) | 0.59401(18) | 0.59504(19) | 0.59483(38) | 0.59140(29) | 0.59308(35) | |
| 0.17626(17) | 0.17795(16) | 0.17896(17) | 0.17432(36) | 0.17127(27) | 0.17738(32) | |
| 0.01001(17) | 0.01131(16) | 0.01240(18) | 0.01319(36) | 0.00642(28) | 0.01246(33) | |
| R-factor | 3.37 | 3.26 | 3.09 | 4.46 | 3.52 | 3.47 |
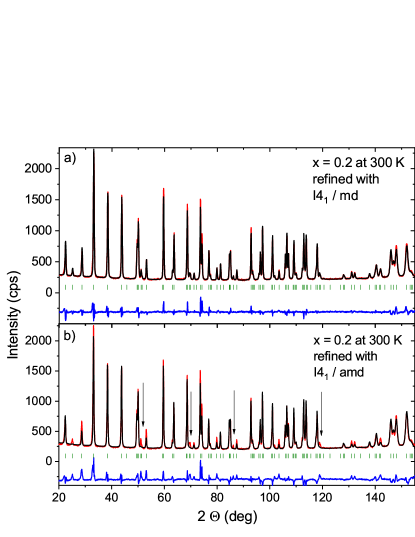
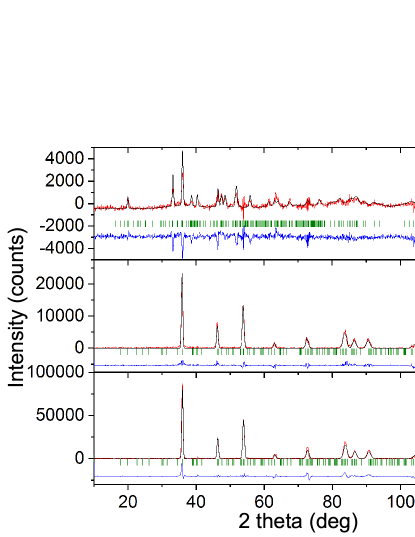
RAlGe was first reported to crystallize in the ThSi2 structure-type with space group 41/amd (No. 141) (Dhar et al., 1992), with later studies instead proposing the LaPtSi structure-type (Dhar and Pattalwar, 1996; Gladyshevskii et al., 2000) with a body-centered polar tetragonal space-group 41md (No. 109). The structures are shown in the right part of Figure 2. As apparent from Rietveld refinement results displayed in Figure 2 both structures result in different intensity distributions in neutron diffraction, where the main difference for the 41/amd is highlighted by arrows. From these Rietveld refinements of neutron diffraction data, we find the Ce1-xPrxAlGe series forms a solid solution with a stable I41md (No. 109) structure realized for all . The structure is stable down to low temperatures, and a linear increase of the lattice constant with substitution following Vegard’s law (see Table 1 ). Thus we can confirm that for the whole series of Ce1-xPrxAlGe with a stoichiometric Al-Ge ratio the LaPtSi-type structure is realized, since powder neutron diffraction allows us to differentiate conclusively between the two candidate structure types.
V Magnetic Properties
After having proven stoichiometric composition of the samples, we next turn to the detailed characterization of the magnetic properties of Ce1-xPrxAlGe in the temperature range from 1.5 to 400 K. As published recently Puphal et al. (2020), magnetic Ce ions in CeAlGe order incommensurately below 4.5 K with a unique multi- ground state; i.e. spin texture that is characterized by a periodic array of regions for which the magnetic topological winding number is either +1/2 or -1/2, and cancels when averaged over the entire sample. PrAlGe on the other hand orders predomantly ferromagnetically along the c-axis, and presents a small fraction of a co-existing nanoscale-sized domain walls involving moments tilted away from axis best seen in SANS at low -values.
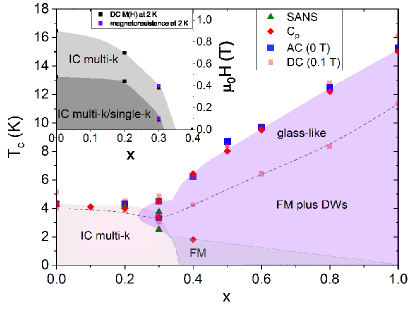
Figure 3 shows the phase diagram for the solid solution series constructed from data presented in this paper. We find a slow change between the end component ground states with a continuous shift of resulting in an overlap at a substitution level of . With the introduction of Pr to CeAlGe we first find no strong influence on the ground state, but already a linearly increasing size of the bulk moment (see section V.B). A second transition emerges from Pr spins due to glass-like behavior co-existing with the incommensurately ordered Ce moments, which is suppressed for as seen in the decrease. With further increase of the Pr content () all moments, including those due to Ce, align ferromagnetically with the Pr ions with the typical domained deviation Destraz et al. (2020). From then on the ferromagnetic ordering temperature and moment increase in a linear fashion with . In addition to these ground states we found in SANS for the mixed system in a suppression of the low scattering below 3 K, indicating a fully aligned ground state, which is discussed in detail in section VI. We find evidences of this transition in drawn from the specific heat as a second maximum in all samples, which decreases in temperature with increasing (see section V.C). Further evidence for this transition is given in The field dependence of the multi- ground state is scetched in the inset of Figure 3, which predicts a possible stoichiometry, where the magnetic field-induced phase that generates a topological Hall effect signal Puphal et al. (2020) is stable without an external field.
V.1 AC-susceptibility
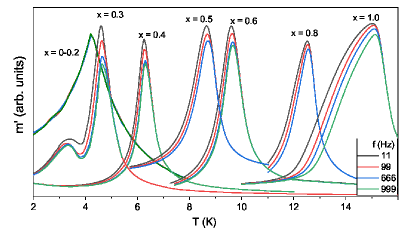
The continuous tuning of the magnetic ground state with is best seen in the AC-susceptibility data of the full series of the Ce1-xPrxAlGe solid solution shown in Figure 4. Following the maximum of , we see the decrease of the multi- ground state, just when additionally the ferromagnetic groundstate is realized at , while the increase of the latter one is apparent starting from . While only a subtle frequency dependence is seen in the maximum of , we observe a stronger shift of the left tail (visible in described below). This likely reflects an external frequency-dependent response of the domain dynamics. The dependence is not apparent for , but starts in the vicinity of both ground states for the sample. As previously reported also for PrAlGe Puphal et al. (2019) we find for the ferromagnetic ground state a really tiny shift in contrast to the results of Ref. Meng et al. (2019).
The classification of the underlying ground states is obvious from a difference in the signal strength in and in a differing behaviour in external field displayed in Figure 5. The antiferromagnetically coupled incommensurate ground state for shifts down in temperature with increasing field, while the ferromagnetic ordering transition increases in temperature with increasing field. In addition larger fields are necessary to suppress the susceptibility due to the incommensurately ordered phases compared to the ferromagnetic one as shown in Figure 5.
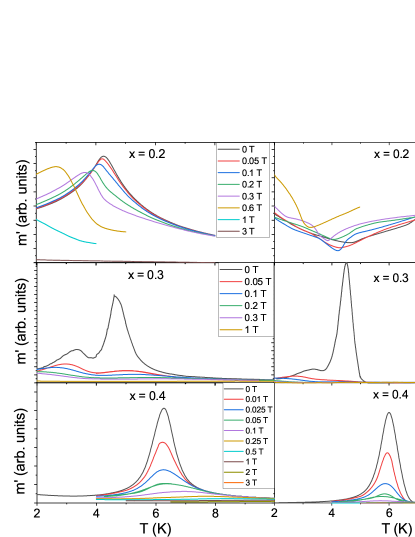
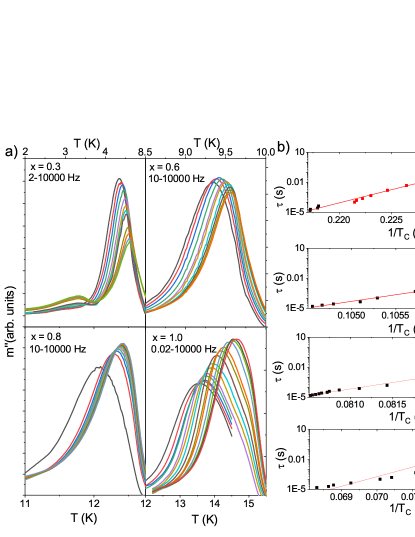
For the magnetic ground state that is predominantly ferromagnetic with the low density of nanoscale domain walls, the AC-susceptibility shows an aforementioned measurable frequency dependence, which is hardly visible in , shows up clearly as a shift of the maximum in the imaginary part . We analyzed the the response of from the viewpoint of domain dynamics applying an Arrhenius law to fit the extracted relaxation times plotted versus the inverse maxima of shown in Figure 6 b) with the linear fit results: s, s, s and s shown in Figure 6 b. The resulting energy barriers for , 0.6, 0.8 and 1.0 are 606 K, 3033 K, 2986 K and 2211 K with extremely quick relaxation 1.010-62 s, 1.410-143 s, 6.510-110 s, and 1.110-71 s. In the case of we find a reduced value indicating an interaction of the two ground states. A clear tendency is apparent once a solely ferromagnetic ground state is realized starting from , where we find a decrease of the barrier with increasing ferromagnetic contribution of Pr moments.
V.2 DC-Susceptibility
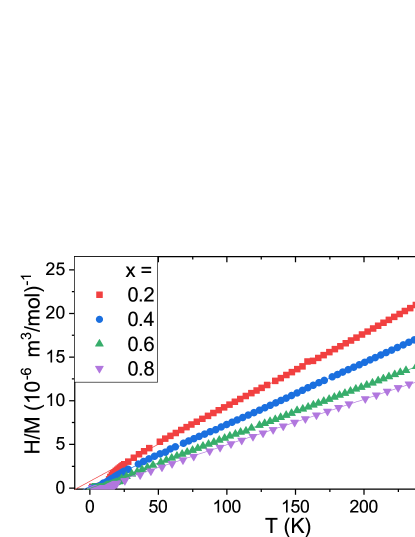
With the clear image of the transition temperatures drawn from AC-susceptibility we move to the pecularities of the magnetism found in the substitution series analyzed by DC-susceptibility. As both CeAlGe and PrAlGe have a ferromagnetic -coupling and an antiferromagnetic -coupling of comparable size seen in the Curie-Weiss fits of data obtained on single crystals Puphal et al. (2019), for polycrystalline samples one finds a Curie-Weiss temperature close to 0. For CeAlGe with 10 K and -42 K Puphal et al. (2019) ovarious results for polycrystalline materials are reported depending on the orientation and stoichiometry , -3.5 K Dhar and Pattalwar (1996); Flandorfer et al. (1998); Hodovanets et al. (2018). For PrAlGe we found 36 K and -30 K compared with values reported elsewhere of 30 K and -18 K Meng et al. (2019), possibly enhanced by Al-Ge ratio variations. For the polycrystalline samples of the solid solution series we find a reasonable evolution of the Curie-Weiss temperature as one would expect for the slow increase of ferromagnetic contributions along the -direction. From fits to the data seen in the Figure 7, we obtain -9.1 K, K, 0.55 K and 4.699 K. With theoretical values for the moment size of Ce of 2.54 going to 3.58 the effective magnetic moments extracted from fitting high temperature portion of the dc magnetic susceptibility should vary from 2.75, 2.96, 3.16 to 3.37 for , 0.4, 0.6 and 0.8, respectively. Indeed, the effective moment obtained from the Curie-Weiss fits yield: , , and .
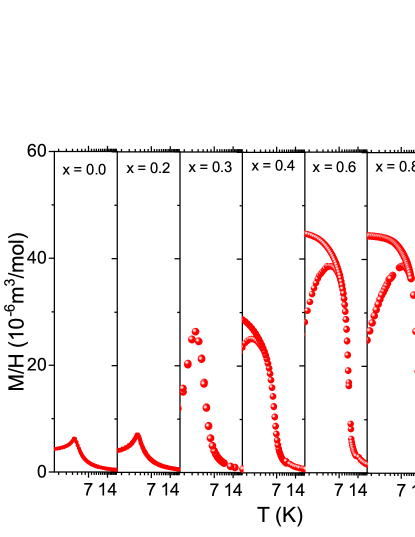
As seen in Figure 8, the low temperature DC-susceptibility shows the expected trend of increasing magnetization and ordering temperature while adding more Pr. Again the behavior can be divided into two kinds: while shows a downturn in field cooling (FC), we find, as expected for a ferromagnetic ground state, a saturation to a finite magnetization starting from . For all , the zero field-cooled (ZFC) measurement shows an increase of the magnetization with temperature up to the ordering temperature. While pure CeAlGe and low concentrations and the low substitution of Pr presents a tiny hysteresis at 2 K Puphal et al. (2019), for the polycrystalline sample we find no gap between FC and ZFC measurements, despite the significant frequency-dependence of the ac susceptibility indicating domain dynamics as shown in the previous subchapter.
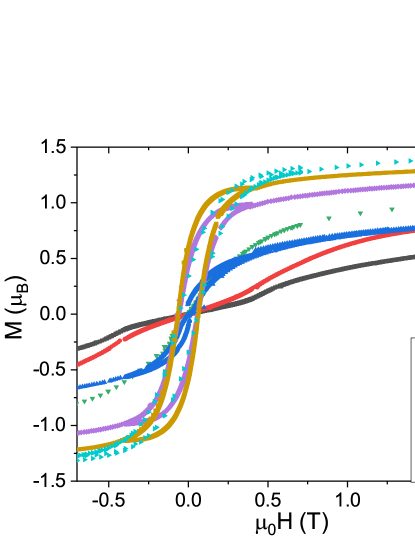
Before analyzing the transitions in more detail we look into the hysteretic behavior seen in field-dependent DC-susceptibility. In Fig. 9 the magnetization measured at 2 K for field sweeps is shown in between -0.7 and 2 T. We find as expected an increase in the saturation magnetization at high fields that scales with the Pr amount. In the curve the underlying ground state is easily extracted by the fact that once the FM with DWs is realized a hysteresis is observed. In agreement with the AC data we find a sudden change in the magnetization behavior with a substitution amount from , as starting from the hysteresis emerges with a similiar coercive field for of roughly 0.064 T.
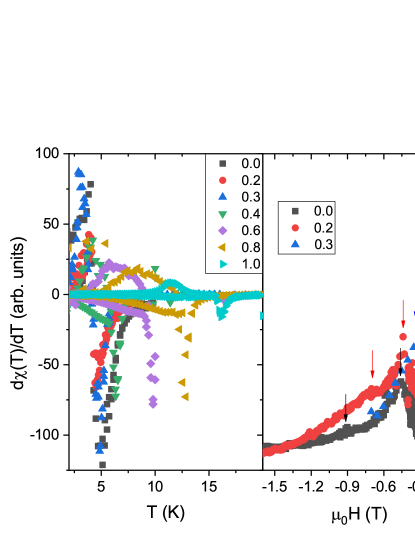
Derivatives of the DC-susceptibility data as shown in Figure 10 enables both a visualization and determination of the critical transitions for the temperature, as well as the fields which are added to the phase diagram in Figure 3. In the temperature derivative we always find a positive and a negative maximum, which for can be accounted to a spin glass like transition and a subsequent spin reorientation as shown in Ref. Puphal et al. (2019). This reorientation transition is only visible in small fields (here 50 Oe) and can be tracked for all substitution amounts even in pure CeAlGe. These data amount to the dashed line in the phase diagram (see Figure 3). From the extrapolation of the critical magentic fields shown in Figure 10 b) we anticipate a stable magnetic topological state at zero external magnetic field for a substitution of around 33% Pr.
V.3 Specific heat
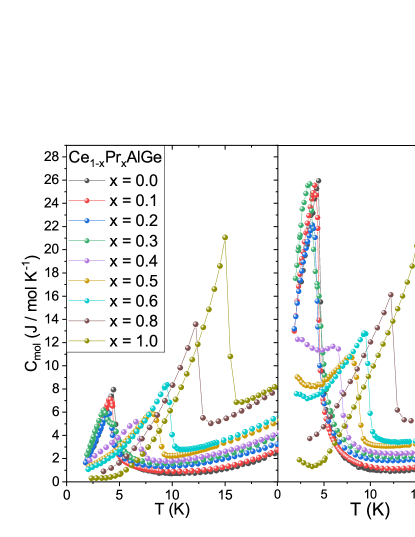
From specific heat studies of the polycrystalline series we can identify two transitions. The spin reorientation seen in the derivative of the DC-susceptibility is not observed in specific heat, as was already reported for PrAlGe Meng et al. (2019). However an additional signal at low temperatures is found from the vanishing of the nanoscale domain wall texture that we describe in the next section. The entropy released at the transition is for all cases around ln2, when extrapolating the low temperature part of the specific heat for low concentrations. However the entropy distribution varies with as for PrAlGe the transition is less sharp. CeAlGe is a system thus a transition of ln2 describes a full order. The observation of a full order in CeAlGe is in no contrast to the reduced moment observed in magnetic measurements, as we could prove with XPS that for CeAlGe we find a mixed valence of roughly 50% Ce4+, which is nonmagnetic (see supplemental information of Ref. Puphal et al. (2020)). For PrAlGe with an entropy of ln2 accounts only to 63%. The missing entropy is in god agreement with the obtained lowered moment (see chapter VI neutron diffraction) supporting our idea of a glassy transition. The reduced moment of 2.29(3) compared to a full Pr3+ moment of 3.58 resides to 64%. However part of the missing entropy might lie in the second maximum at lowest temperatures, which is already apparent by the upturn at lowest temperatures shown in the right panel of Figure 11. The temperature of the second maximum of exactly matches the temperature of the disappearance of low q scattering seen in SANS (see section VI) and indicates a possible spin reorientation to a fully aligned case without domain walls, shown as a grey area in the phase diagram (see Figure 3).
VI Neutron diffraction
In Fig. 12, we show the magnetic contribution, i.e. the difference pattern of the neutron powder diffraction data measured below (1.5 K) and above (15 K) with a wavelength of , of three compositions of , 0.4, 0.6. Similarly as for results obtained from bulk measurements, we find a sharp change of the ground state above x > 0.3, where the Ce moments presumably become aligned with the ferromagnetically ordered Pr ones. In contrast, for a low Pr substitution amount the incommensurate order of pure CeAlGe prevails. To determine the IC magnetic structure in Ce0.2Pr0.8AlGe we used the Fullprof suite Rodríguez-Carvajal (1993) to perform a detailed Rietveld refinement of the neutron powder diffraction (NPD) difference pattern against several symmetry-allowed models. The symmetry analysis shows that the magnetic structure model of highest symmetry is based on the full propagation star of which consists of four arms and . This corresponds to a multi- model described by the maximal symmetry superspace group I41md1’(a00)000s(0a0)0s0s Puphal et al. (2020), and has just four refinable magnetic mode amplitude parameters. Via lebail fitting we find for a slightly larger vector of compared to in the case . For we find magnetic scattering only at scattering angles commensurate with the tetragonal point symmetry of the RAlGe lattice, which can be described by a propagation vector . As for PrAlGe Destraz et al. (2020) for the three symmetry-allowed magnetic structure models for , we find the standard irreducible representation Γ1, that describes a ferromagnetic (FM) order with moments aligned with the c-axis, to solve our magnetic pattern for both = 0.4 and = 0.6. The size of the ferromagnetic moment refined from the data increases as expected with the larger Pr content 1.17( 1) ( = 0.4) and 1.770(1) ( = 0.6) compared to 2.29(3) for Destraz et al. (2020).
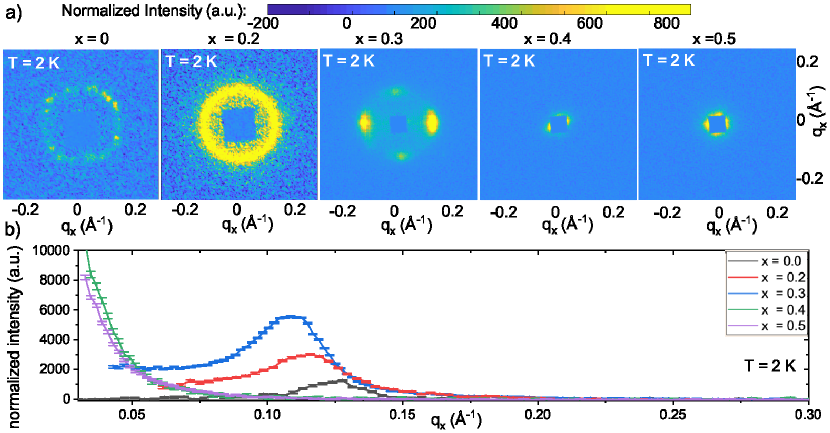
To track the change of the microsopic magnetism with in more detail we performed SANS measurements on polycrystalline ingots of the Ce1-xPrxAlGe series. The SANS images of reciprocal space clearly reveal a sharp change in the general form of low magnetic scattering above . For , scattering is observed at finite wavevector in analogy with that seen for pure CeAlGe Puphal et al. (2020), and in the present polycrystallines samples displays either a ring- or Bragg spot-like distribution. This scattering at finite wavevector disappears for x ¿ 0.3, and instead we observe significant magnetic SANS to emerge at lowest for similar as for PrAlGe following the phase diagram depicted in Figure 3. This observation suggests that in addition to dominant easy-c-axis ferromagnetic correlations, a co-existing nanoscale magnetic texture also exists in the samples of Ce1-xPrxAlGe for analogously as for and discussed in detail in Ref. Destraz et al. (2020). In this case the intensity is distributed uniformly in azimuth around the origin, and falls monotonically over an extended range of ||.
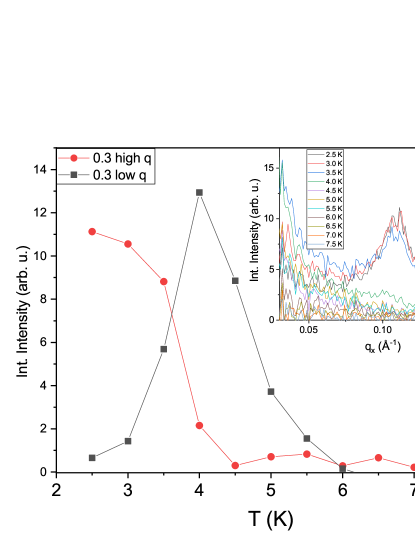
In addition we find a low scattering from the slightly misaligned domains already for and 0.3 meaning that with the introduction of Pr to the structure, the ferromagnetic coupling part creates a separation in domains (see Figure 13 b). From a proper normalization of the scattered intensity, we can generally track the increase of scattering contribution due to moment increase from Pr introduction, though we note that may be compensated by the different intensity distributions observed for ,0.2 (ring-like) that differ markedly from the almost Bragg-spot like distribution observed from the sample. By plotting the same integrated intensity versus temperature shown in Figure 14, we find that the low scattering vanishes below a certain temperature meaning that the Ce moments finally align with the Pr ones.
VII Muon spin relaxation/rotation spectroscopy
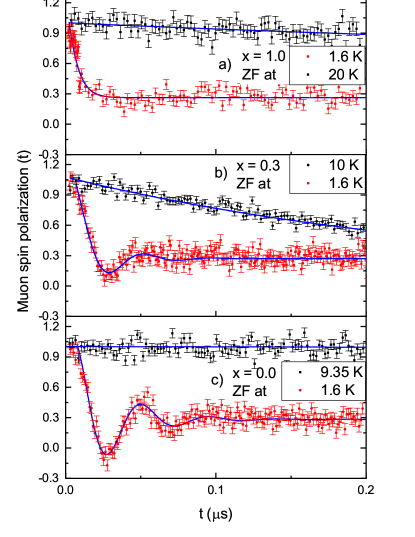
To further explore the low-temperature magnetic properties of the Ce1-xPrxAlGe series, we conducted zero field (ZF) μSR experiment down to 1.6 K. Almost 100% spin polarized surface muons carrying positive charges are implanted into the sample where they preferentially stop at the most electronegative location near Ge at time zero. The implanted muons relax via coupling with the local magnetic field at the muon site. The temporal evolution of the muon spin polarization is thereafter measured by the asymmetry of the decayed positrons which are emitted preferentially along the muon spin direction Blundell (1999). The muon time spectra of the sample measured at 1.6 K shown in Figure 15 a) reveals two distinct relaxation signals. A fast decaying component at lowest temperatures showing no oscillatory signal suggests an incoherent magnetic structure developed in the sample, and indicates a freezing of an inhomogeneous distribution of internal fields that supports the existence of a glassy magnetic regime at 1.6 K Puphal et al. (2019); Destraz et al. (2020). The time-spectrum can be well described by a stretched exponential
| (1) |
where we obtain a at 1.6 K. The second long term relaxation can equally well be described by a stretched exponential revealing a maximal beta around the 15 K transition and a decrease for lower temperatures with at 14.7 K reducing down to 0.048(5) at 1.6 K. In case of CeAlGe () (see Figure 15 c), the asymmetry plot shows a clear damped signal oscillating around 1/3 of the initial spin polarization. The data suggests the muon ensemble detects a coherent internal field induced by the ordered magnetic structure, which is present in the entire volume of the sample. Incommensurate magnetic orders such as spin density waves are best fit by a zeroth order Bessel function Sugiyama et al. (2006). On the other hand, the polarization in the present case of a multi- incommensurate magnetic structure can be described equally well by an exponentially decaying cosine:
| (2) |
The maximum frequency is centered at 22.3(3) MHz, while the one for PrAlGe is centered at 0 typical for a SG system. For the crossover stoichiometry of Ce0.7Pr0.3AlGe (see Figure 15 b) we still observe oscillations, which are more strongly damped than for CeAlGe due to the additional PrAlGe character. The maximum frequency is 22(1) MHz and hence nearly unchanged compared to the = 0 case. This suggests that incommensurate multi-k structures observed for x=0 and x=0.3 can be considered to be broadly similar, which is in agreement with data obtained from neutron scattering. From the muon data, we find generally large values of the relaxation rate for AlGe. Due to the fast relaxation from the glassiness induced by Pr we find an increasing relaxation rate λ with increasing amount of Pr, which is a hallmark of the broadening of the distribution of the local magnetic fields. In the ordered phase at 1.6 K we find λ values of the fast decaying part for increasing of: 37(1) μs-1, 61(3) μs-1 and finally 160(20) μs-1 for = 0.0, 0.3, 1.0.
VIII Crossover region around
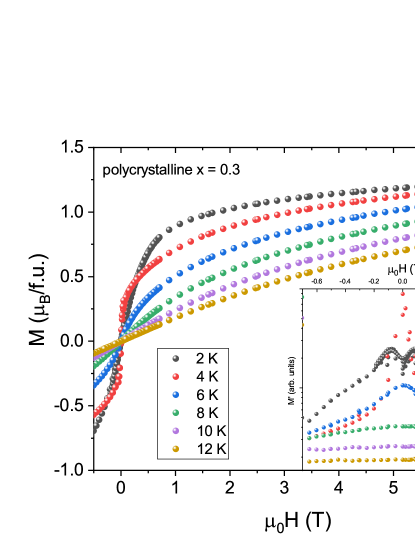
Around Ce0.7Pr0.3AlGe we find the most complex part in the phase diagram, as we find an overlap of low scattering arising from ferromagnetic domains and the multi scattering around 0.11 between 3 and 4 K as well as seperated parts of each as shown in Fig. 14 e). Indicating seperate regions of the two ground states. We focus now on the details of this compositional area by analyzing the field dependent magnetization and resistivity. As one might deduce from the indication of frequency-dependent domain dynamics by AC-susceptibility at 4 K, where we are in the low scattering maximum seen in Figure 14, we find a tiny hysteresis for = 0.3 seen in the red curve of Figure 16. This hysteretic behaviour however vanishes when the sample is cooled down to 2 K, and for which the low scattering disappears and we only realize the multi- ground state.

For the AlGe samples a relatively low residual resistivity ratio (RRR) of 1-2 is reported, considering it is a semimetal Puphal et al. (2019); Hodovanets et al. (2018); Meng et al. (2019). So, unsurprisingly we find a decrease of the resistivity with decreasing temperature of the polycrystalline Ce0.7Pr0.3AlGe sample with a RRR value of 1.88 shown in Figure 17. Similar to the end-compounds we see the magnetic transition displayed on the inset, which in this case even indicates a double peak with maxima both at 2.8 and 5 K in good agreement with anomalies observed in AC-susceptibility and SANS measurements (see Figure 14). Similar to CeAlGe we find a negative magnetoresistance, the metamagnetic transition is seen in two kinks highlighted by arrows at 0.1 T and 0.4 T. In pure CeAlGe, these two metamagnetic transitions occur at higher fields of 0.5 and 0.8 T respectively (see Figure 3 inset), and over this range of magnetic field a topological magnetic phase that generates a topological Hall signal is stabilized Puphal et al. (2020). The present study shows that the two metamagnetic transition fields become suppressed with increasing . We thus anticipate that for a further small increase of beyond 0.3, the field-induced topological phase for can be stabilized as a zero-field ground state.
IX Summary
The solid solution Ce1-xPrxAlGe preserves the two ground states of the parent compounds up to the overlapping region around Ce0.7Pr0.3AlGe, which represents the general crossover composition between the end member ground states. While for the multi- ground state of CeAlGe remains nearly unchanged in its magnetic ordering temperature the metamagnetic transition fields shift leading to the possibility to stabilize the field-induced topological phase as a zero-field ground state when is just above 0.3. The predominantly ferromagnetic ground state of PrAlGe decreases in with increasing amount of Ce, so does the moment size, while the energy barrier of the domain formation increases, which enables a fully FM aligned - point solution at lowest temperatures for the mixed system. With Ce0.7Pr0.3AlGe we find an interesting compound where the interplay between these ground states can be studied, as the critical temperatures overlap only in a limited range and the possiblity of a zero field topological phase is at hand. It provides a candidate Weyl semimetal that enables a tuning of the bands via a purely multi- order below 3 K and a solely ferromagnetic ground state from 4 to 5 K.
Acknowledgements.
The authors thank Hubertus Luetkens and Vladimir Pomjakushin for fruitful discussions. This work is partly based on experiments performed at the Institut Laue-Langevin (ILL), Grenoble, France. Neutron data collection (https://doi.org/10.5291/ILL-DATA.5-31-2660) using D11 and D1B at ILL took place with support from proposal 5-31-2660. This work is based on experiments performed at the Swiss Muon Source SμS, Paul Scherrer Institute, Villigen, Switzerland. Part of the magnetic measurements were carried out on the PPMS/MPMS devices of the Laboratory for Multiscale Materials Experiments, Paul Scherrer Institute, Villigen, Switzerland, as well as the PPMS device of the Kristall- und Materiallabor, Goethe University Frankfurt am Main, Germany. V.U. and J.S.W. acknowledge financial support from the SNF Sinergia CRSII5_171003 NanoSkyrmionics and SNF 200021_188707.References
- Weyl (1929) H. Weyl, Zeitschrift für Physik 56, 330 (1929).
- Xu et al. (2015a) S.-Y. Xu, I. Belopolski, N. Alidoust, M. Neupane, G. Bian, C. Zhang, R. Sankar, G. Chang, Z. Yuan, C.-C. Lee, S.-M. Huang, H. Zheng, J. Ma, D. S. Sanchez, B. Wang, A. Bansil, F. Chou, P. P. Shibayev, H. Lin, S. Jia, and M. Z. Hasan, Science 349, 613 (2015a).
- Xu et al. (2015b) S.-Y. Xu, N. Alidoust, I. Belopolski, Z. Yuan, G. Bian, T.-R. Chang, H. Zheng, V. N. Strocov, D. S. Sanchez, G. Chang, C. Zhang, D. Mou, Y. Wu, L. Huang, C.-C. Lee, S.-M. Huang, B. Wang, A. Bansil, H.-T. Jeng, T. Neupert, A. Kaminski, H. Lin, S. Jia, and M. Z. Hasan, Nature Physics 11, 748 (2015b).
- Chang et al. (2018) G. Chang, B. Singh, S.-Y. Xu, G. Bian, S.-M. Huang, C.-H. Hsu, I. Belopolski, N. Alidoust, D. S. Sanchez, H. Zheng, H. Lu, X. Zhang, Y. Bian, T.-R. Chang, H.-T. Jeng, A. Bansil, H. Hsu, S. Jia, T. Neupert, H. Lin, and M. Z. Hasan, Physical Review B 97 (2018), 10.1103/physrevb.97.041104.
- Dhar et al. (1992) S. Dhar, S. Pattalwar, and R. Vijayaraghavan, Journal of Magnetism and Magnetic Materials 104-107, 1303 (1992).
- Flandorfer et al. (1998) H. Flandorfer, D. Kaczorowski, J. Gröbner, P. Rogl, R. Wouters, C. Godart, and A. Kostikas, Journal of Solid State Chemistry 137, 191 (1998).
- Dhar and Pattalwar (1996) S. Dhar and S. Pattalwar, Journal of Magnetism and Magnetic Materials 152, 22 (1996).
- Gladyshevskii et al. (2000) E. Gladyshevskii, N. Nakonechna, K. Cenzual, R. Gladyshevskii, and J.-L. Jorda, Journal of Alloys and Compounds 296, 265 (2000).
- Puphal et al. (2019) P. Puphal, C. Mielke, N. Kumar, Y. Soh, T. Shang, M. Medarde, J. S. White, and E. Pomjakushina, Physical Review Materials 3 (2019), 10.1103/physrevmaterials.3.024204.
- Hodovanets et al. (2018) H. Hodovanets, C. J. Eckberg, P. Y. Zavalij, H. Kim, W.-C. Lin, M. Zic, D. J. Campbell, J. S. Higgins, and J. Paglione, Physical Review B 98 (2018), 10.1103/physrevb.98.245132.
- Suzuki et al. (2019) T. Suzuki, L. Savary, J.-P. Liu, J. W. Lynn, L. Balents, and J. G. Checkelsky, Science , eaat0348 (2019).
- Meng et al. (2019) B. Meng, H. Wu, Y. Qiu, C. Wang, Y. Liu, Z. Xia, S. Yuan, H. Chang, and Z. Tian, APL Materials 7, 051110 (2019).
- Destraz et al. (2020) D. Destraz, L. Das, S. S. Tsirkin, Y. Xu, T. Neupert, J. Chang, A. Schilling, A. G. Grushin, J. Kohlbrecher, L. Keller, P. Puphal, E. Pomjakushina, and J. S. White, npj Quantum Materials 5 (2020), 10.1038/s41535-019-0207-7.
- Puphal et al. (2020) P. Puphal, V. Pomjakushin, N. Kanazawa, V. Ukleev, D. J. Gawryluk, J. Ma, M. Naamneh, N. C. Plumb, L. Keller, R. Cubitt, E. Pomjakushina, and J. S. White, Physical Review Letters 124 (2020), 10.1103/physrevlett.124.017202.
- Rodríguez-Carvajal (1993) J. Rodríguez-Carvajal, Physica B: Condensed Matter 192, 55 (1993).
- Blundell (1999) S. J. Blundell, Contemporary Physics 40, 175 (1999).
- Sugiyama et al. (2006) J. Sugiyama, Y. Ikedo, K. Mukai, J. H. Brewer, E. J. Ansaldo, G. D. Morris, K. H. Chow, H. Yoshida, and Z. Hiroi, Physical Review B 73 (2006), 10.1103/physrevb.73.224437.
- Wan et al. (2011) X. Wan, A. M. Turner, A. Vishwanath, and S. Y. Savrasov, Physical Review B 83 (2011), 10.1103/physrevb.83.205101.
- Tokura et al. (2017) Y. Tokura, M. Kawasaki, and N. Nagaosa, Nature Physics 13, 1056 (2017).
- Suzuki et al. (2016) T. Suzuki, R. Chisnell, A. Devarakonda, Y.-T. Liu, W. Feng, D. Xiao, J. W. Lynn, and J. G. Checkelsky, Nature Physics 12, 1119 (2016).
- Lu et al. (2015) L. Lu, Z. Wang, D. Ye, L. Ran, L. Fu, J. D. Joannopoulos, and M. S. i, Science 349, 622 (2015).
- Liu et al. (2018) E. Liu, Y. Sun, N. Kumar, L. Muechler, A. Sun, L. Jiao, S.-Y. Yang, D. Liu, A. Liang, Q. Xu, J. Kroder, V. SÃŒß, H. Borrmann, C. Shekhar, Z. Wang, C. Xi, W. Wang, W. Schnelle, S. Wirth, Y. Chen, S. T. B. Goennenwein, and C. Felser, Nature Physics (2018), 10.1038/s41567-018-0234-5.
- Kim et al. (2018) K. Kim, J. Seo, E. Lee, K.-T. Ko, B. S. Kim, B. G. Jang, J. M. Ok, J. Lee, Y. J. Jo, W. Kang, J. H. Shim, C. Kim, H. W. Yeom, B. I. Min, B.-J. Yang, and J. S. Kim, Nature Materials 17, 794 (2018).
- Huang et al. (2015) X. Huang, L. Zhao, Y. Long, P. Wang, D. Chen, Z. Yang, H. Liang, M. Xue, H. Weng, Z. Fang, X. Dai, and G. Chen, Physical Review X 5 (2015), 10.1103/physrevx.5.031023.
- Hermes et al. (2007) W. Hermes, U. C. Rodewald, B. Chevalier, and R. Pötgena, Zeitschrift fÃŒr Naturforschung B 62, 613 (2007).
- Hasan et al. (2015) M. Z. Hasan, S.-Y. Xu, and G. Bian, Physica Scripta T164, 014001 (2015).
- Hasan et al. (2017) M. Z. Hasan, S.-Y. Xu, I. Belopolski, and S.-M. Huang, Annual Review of Condensed Matter Physics 8, 289 (2017).
- Bobev et al. (2005) S. Bobev, P. H. Tobash, V. Fritsch, J. D. Thompson, M. F. Hundley, J. L. Sarrao, and Z. Fisk, Journal of Solid State Chemistry 178, 2091 (2005).
- Lv et al. (2015) B. Lv, H. Weng, B. Fu, X. Wang, H. Miao, J. Ma, P. Richard, X. Huang, L. Zhao, G. Chen, Z. Fang, X. Dai, T. Qian, and H. Ding, Physical Review X 5 (2015), 10.1103/physrevx.5.031013.
- Chen et al. (2018) B. Chen, X. Duan, H. Wang, J. Du, Y. Zhou, C. Xu, Y. Zhang, L. Zhang, M. Wei, Z. Xia, C. Cao, J. Dai, M. Fang, and J. Yang, npj Quantum Materials 3 (2018), 10.1038/s41535-018-0114-3.
- Mydosh (2015) J. A. Mydosh, Reports on Progress in Physics 78, 052501 (2015).
- Rajamathi et al. (2017) C. R. Rajamathi, U. Gupta, N. Kumar, H. Yang, Y. Sun, V. SÃŒß, C. Shekhar, M. Schmidt, H. Blumtritt, P. Werner, B. Yan, S. Parkin, C. Felser, and C. N. R. Rao, Advanced Materials 29, 1606202 (2017).
- Politano et al. (2018) A. Politano, G. Chiarello, Z. Li, V. Fabio, L. Wang, L. Guo, X. Chen, and D. W. Boukhvalov, Advanced Functional Materials 28, 1800511 (2018).
- Chan et al. (2017) C.-K. Chan, N. H. Lindner, G. Refael, and P. A. Lee, Physical Review B 95 (2017), 10.1103/physrevb.95.041104.
- Sie et al. (2019) E. J. Sie, C. M. Nyby, C. D. Pemmaraju, S. J. Park, X. Shen, J. Yang, M. C. Hoffmann, B. K. Ofori-Okai, R. Li, A. H. Reid, S. Weathersby, E. Mannebach, N. Finney, D. Rhodes, D. Chenet, A. Antony, L. Balicas, J. Hone, T. P. Devereaux, T. F. Heinz, X. Wang, and A. M. Lindenberg, Nature 565, 61 (2019).
- Zhao and Parthé (1990) J. T. Zhao and E. Parthé, Acta Crystallographica Section C Crystal Structure Communications 46, 2276 (1990).
- 200 (2002) Handbook on the Physics and Chemistry of Rare Earths (Volume 32) (North Holland, 2002).