Understanding Radiative Transitions and Relaxation Pathways in Plexcitons
Abstract
Molecular aggregates on plasmonic nanoparticles have emerged as attractive systems for the studies of polaritonic light-matter states, called plexcitons. Such systems are tunable, scalable, easy to synthesize and offer sub-wavelength confinement, all while giving access to the ultrastrong light-matter coupling regime, promising a plethora of applications. However, the complexity of these materials prevented the understanding of their excitation and relaxation phenomena. Here, we follow the relaxation pathways in plexcitons and conclude that while the metal destroys the optical coherence, the molecular aggregate coupled to surface processes significantly contributes to the energy dissipation. We use two-dimensional electronic spectroscopy with theoretical modeling to assign the different relaxation processes to either molecules or metal nanoparticle. We show that the dynamics beyond a few femtoseconds has to be considered in the language of hot electron distributions instead of the accepted lower and upper polariton branches and establish the framework for further understanding.
I Introduction
Cavity quantum electrodynamics (cQED) has been a very successful testbed for the quantum mechanics of light-matter interaction Walther et al. (2006); Mabuchi and Doherty (2002); Haroche and Kleppner (1989); Raimond et al. (2001), and exhibits phenomena of both fundamental and practical interest Kasprzak et al. (2006); Martínez-Martínez et al. (2018); Yuen-Zhou et al. (2016); Zhong et al. (2016); Feist and Garcia-Vidal (2015); Schachenmayer et al. (2015); Herrera and Spano (2016); Galego et al. (2015); Hutchison et al. (2013, 2012); Thomas et al. (2016); Wang et al. (2014). Dressing matter with the electromagnetic modes of a cavity results in hybrid light-matter states (polaritons) with properties that are only recently beginning to be exploited for chemistry applications, such as photocatalysis Mandal and Huo (2019); Manuel et al. (2019), remote energy transfer Coles et al. (2014); Sáez-Blázquez et al. (2018); Xiang et al. (2020); Du et al. (2018); Zhong et al. (2017); Krainova et al. (2020); Herrera and Spano (2016) and polaritonic chemistry Du et al. (2019); Fregoni et al. (2020); F. Ribeiro et al. (2018); Feist et al. (2018). As the light-matter coupling strength increases, new and interesting effects arise tied to non-zero ground state occupation of the cavity, so that finding systems that can push the coupling into stronger regimes are desirable to explore new photophysics and photochemistry Torma and Barnes (2015); Johannes et al. (2018); Ebbesen (2016). Condensed-matter cQED realizations are particularly attractive as they reach the ultrastrong coupling regime at room temperature with Rabi splittings in excess of 30% as compared to the emitter frequency Walther et al. (2006); Chen et al. (2017); Wersäll et al. (2017); Roller et al. (2016); Antosiewicz et al. (2014); Sugawara et al. (2006); Bellessa et al. (2004); Balci et al. (2016); Santhosh et al. (2016); Hertzog et al. (2019); Hutchison et al. (2012). This regime can be reached both by molecules placed in a microcavity Hutchison et al. (2012); Ebbesen (2016), or in systems where the field has been confined by a plasmonic resonance to sub-wavelength dimensions, as is the case for plexcitons (plasmon+exciton) Johannes et al. (2018); Balci et al. (2016). Confining the light mode in a plasmonic nanoparticle, as opposed to a microcavity or a plasmonic array, provides a notable advantage: the systems can be synthesized in large numbers using synthetic chemistry methods, and exist as colloidal suspensions in solution. Thus, they provide polaritonic states in a beaker.
There is an increasing complexity of the dissipative environment in polaritonic systems as we move from atoms in cavities, to molecules in microcavities, and finally to molecules coupled to plasmonic nanoparticles. The wealth of dissipative processes when replacing a cavity with a plasmon – for example Landau damping, electron-electron (e-e) scattering and electron-phonon (e-ph) scattering – modulate the dynamics in non-trivial ways that cannot be ignored Voisin et al. (2001). A stronger coupling to a dissipative environment, however, needs not be necessarily detrimental, and there are several examples where harnessing it increases device efficiency, and therefore dissipation should be understood and explored Lin et al. (2013); Scully et al. (2011).
Ultrafast pump-probe studies have reported the relaxation times of the excitation Fofang et al. (2011); Balci et al. (2014); Hranisavljevic et al. (2002); Vasa et al. (2013); Wiederrecht et al. (2008); Hoang et al. (2016) as well as the Rabi oscillations in the case of molecules coupled to gold nanoslit arrays Vasa et al. (2013). Unfortunately, currently there is no consensus on the plexciton lifetimes and dephasing processes, likely stemming from system to system differences, and non-trivial excitation wavelength dependence. For example, Hranisavljevic et al. found an exceptionally stabilized excited state with a 300 ps decay constant Hranisavljevic et al. (2002), while Balci et al. measured decay constants close to 10 ps, which are pump wavelength dependent Balci et al. (2014), on similar systems consisting of cyanine dyes adsorbed on Ag plasmonic nanoparticles. More importantly, an understanding of the dissipation in terms of the physical mechanisms in the molecular aggregates or the plasmonic nanoparticles is lacking, so that rational and systematic improvements of these materials are hindered. The studies of microcavity polaritons in the infrared region (where molecular vibrations are dressed by the cavity modes) are more mature, and can provide useful guidelines as to what differences we might expect between molecular and atomic systems Xiang et al. (2018). Notably, previous studies underscore the importance of dark states Xiang et al. (2018); Zhang et al. (2019), although extrapolating the same physics to plasmonic-based hybrids in the visible regime should be done with care. Recent transient absorption studies at visible wavelengths find that two-particle polaritonic states play an important role DelPo et al. (2020), while a two-dimensional electronic spectroscopy (2DES) investigation has measured a relaxation pathway from upper to lower branch without the involvment of the molecular dark states Mewes et al. (2020).
In this work, we explore in detail the ultrafast dynamics of plexcitons and corresponding dissipation mechanisms. We start from a description of the plexciton linear absorption by extending the response function formalism to non-Hermitian Hamiltonians. This forms the basis to interpret 2DES experiments and to propose a physical origin of each relaxation component observed in the plexciton, either to processes inside the J-aggregates or inside the metal nanoparticle.
II Results
J-aggregates (TDBC, 5,5,6,6-tetrachloro-di(4-sulfobutyl) benzimidazolocarbocyanine), Ag nanoprisms and plexcitons (TDBC-Ag nanoprism) were prepared as reported previously (see Methods section, Balci (2013); Balci et al. (2016).). The samples were prepared in solution and the reported measurements were done in transmission mode.
II.1 Linear response
The absorption spectrum can be used to infer the homogeneous linewidth
(when it is much larger than the heterogeneous broadening) and the
energy structure of the first excited state manifold (Figure 1.a),
a prerequisite to interpret correctly the third order response signals
presented below. The absorption spectrum of the plexciton clearly shows the
upper and lower polaritonic branches (Figure 1.b).
The minimum of the dip in the spectrum is nearly coincident with the
J-aggregate absorption at 16,950 cm-1(590 nm).
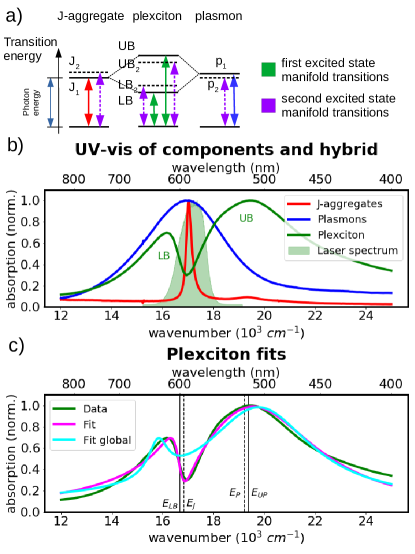
In the following, through fitting of the lineshape we obtain the energy and dephasing time of the first excited states manifold and motivate the structure of the higher excited states manifold based on previous measurements and theoretical models (Figure 1.a and Agranovich and Mal’Shukov (1974); Minoshima et al. (1994)). An ideal J-aggregate consisting of monomers with individual transition dipole moments features a single bright exciton state carrying all of the transition dipole moment strength , and dark states. Although this is strictly true only in the absence of disorder, its predictions are in agreement with the absorption spectrum of the J-aggregate consisting of a very strong and narrow absorption line. It is well-fit by a Lorentzian with center frequency cm-1and full-width at half maximum (FWHM) of cm-1, corresponding to a dephasing time of 44 fs (Supplemental Figure S1). The double exciton states manifold consists of a band whose transition from the first exciton manifold () is almost isoenergetic with the first transition () Milota et al. (2013), and its detuning can be calculated from the linear Frenkel exciton model Minoshima et al. (1994). While both first and second excited states form bands, we will refer to them as single states under the viewpoint that most of the transition dipole moment strength is carried by one state. Analogously to the J-aggregate transition, we model the lineshape of the plasmon absorption in the Ag nanoparticles as a Lorentzian with center wavenumber cm-1and a width of cm-1corresponding to a dephasing time of 3 fs (Supplemental Figure S2).
Given the electronic structure of the individual components, and the expected coupling between them, we arrive at the energy level structure shown in Figure 1.a. We summarize the state energies and couplings in the following Hamiltonian, which is analogous to that proposed by others Delga et al. (2014); Shah et al. (2013); Zelinskyy et al. (2012); Varguet et al. (2019); Piryatinski et al. (2020) (see Figure 1.a). The Hamiltonian in the {, , } basis (that we call here site basis) reads:
| (1) |
where is a complex frequency that accounts for the transition frequency and its associated dephasing rate , are the transition dipole moments from to , is the field strength and is the dipolar coupling between the J-aggregate and the plasmon’s -th excited state. is the shared ground state, and and are the -th excited state of the plasmon and J-aggregate, respectively (the measured spectra are displayed in wavenumbers where is the angular frequency and is the speed of light). The second excitations of the individual components are also labeled in Figure 1.a.
In order to use the same theoretical approach for the linear and third order response, we simulate the absorption spectrum using the response function formalism Mukamel (1995) with two different limits of the Markovian bath Hofer et al. (2017). In the polariton basis - obtained by diagonalizing at zero-field () and without including the dephasing (that is setting ), we can express the linear absorption as a sum over polariton state contributions Cho (2009); Malý and Mančal (2018):
| (2) |
where , and are the transition dipole moment from level to the polaritonic upper or lower branch , the transition frequency between and and the dephasing rate, respectively. The or (used below) superscript refer to the global and local approach taken to obtain the polariton branches. In the global approach, the transition frequencies and transition dipole moments are obtained from the diagonalization of the Hamiltonian without dephasing, with the dephasing rate of each branch introduced phenomenologically in the expression for the absorption (Eq. (2)). This model fits the spectrum poorly (cyan, Figure 1.c). The global approach model is equivalent to fitting the absorption spectrum to a sum of Lorentzians (here two) that in this case do not correspond to the lineshape measured. We instead diagonalize the non-Hermitian operator including the dephasing rates (as the imaginary part of the transition frequencies) to obtain the new (complex) polariton branch energies and their respective transition dipole moments . We modify the expression for the linear response accordingly to:
| (3) |
| a. Separate components in solution | ||
|---|---|---|
| cm-1 | fs | |
| J-aggregate | ||
| 17.04 | ||
| 44 | ||
| Plasmon | ||
| 16.92 | ||
| 3 | ||
| b. Hybrid system in solution | ||||
|---|---|---|---|---|
| Local | Global | |||
| \pbox20cm cm-1 | \pbox20cm fs | \pbox20cm cm-1 | fs | |
| \pbox20cmsite basis | ||||
| 16.83 | 16.08 | |||
| 34 | ||||
| 19.22 | 19.52 | |||
| 1.6 | ||||
| 0.98 | 0.98 | |||
| \pbox20cmplexcitonic | ||||
| basis | ||||
| 16.67 | 16.42 | |||
| 15 | 11 | |||
| 19.38 | 19.59 | |||
| 1.7 | 2.1 | |||
so that the dephasing rates are included in the complex energies of the polaritonic states. As we see from Figure 1.c in the local approach fit (magenta line) the agreement with the model is excellent, with deviations attributable to the simplifying assumption of representing the plasmon lineshape by a Lorentzian far away from the resonance (Supplemental Figure S2). The name of the models (local vs. global) refer to the approximations implemented to reach the underlying Markovian master equation Hofer et al. (2017), and a more detailed discussion of their physical meaning can be found in Supplemental Note S1.
The parameters of the fits are reported in Table II.1., assuming that the principal contribution to the resonance width is homogeneous broadening. The plasmon dephasing time is extremely fast (1.6 fs), in agreement with previous measurements Wright (1994); Weick et al. (2005). This fast dephasing rate is inherited to the plexcitonic branches (1.7 and 15 fs for upper and lower branch respectively). The difference in dephasing rates can be attributed to the upper branch having more of a plasmonic character than the lower branch. This is clear from detuning between the plasmon (19.22 cm-1) and the J-aggregate transition (16.83 cm-1). The frequencies of the radiative transition of the individual components, that is of the J-aggregates in solution, and that of the plasmonic nanoparticles in solution, differ from the frequencies obtained from the fits for the J-aggregate and plasmon transitions in the hybrid system. When bound to plasmonic nanoparticles, the J-aggregates exhibit a redshift of 210 cm-1, attributable to structural perturbations of J-aggregates when binding to a metal nanoparticle. The plasmon resonance in the hybrid system was substantially blue shifted with respect to the bare nanoparticles due to small structural differences arising from the surface stabilization properties afforded by the different molecular covering (citrate and polyvinylpyrrolidone for Ag nanoprisms and TDBC for plexcitons). We observe that the frequency of the plasmon in the plexciton system blue-shifts over the course of several weeks. It occurs on a timescale much longer than a single experiment and we expect this to have a small effect on the dynamics observed Voisin et al. (2001). From the absorption fits we can see that the plasmon carries most of the transition dipole moment amplitude (), justifying the approximation of Delga et al. (2014) of considering that only the plasmonic transition couples to the external radiation field. The dephasing times of the plasmon and J-aggregate in the hybrid system are larger than for the individual components in solution (1.6 vs. 3 fs for plasmon, 34 vs 44 fs for J-aggregates) hinting at a contribution from interfacial processes. The Rabi splitting value extracted from the measured plexciton spectrum is % of the molecular transition frequency, placing the system in the ultrastrong coupling regime with respect to the transition frequencies, but not the dephasing rates. Thus we do not expect Rabi oscillations in the spectra altough the splitting is apparent.
With this understanding of the energy states and their lineshapes we turn to the excitation dynamics picture provided by 2DES.
II.2 Time-resolved signals
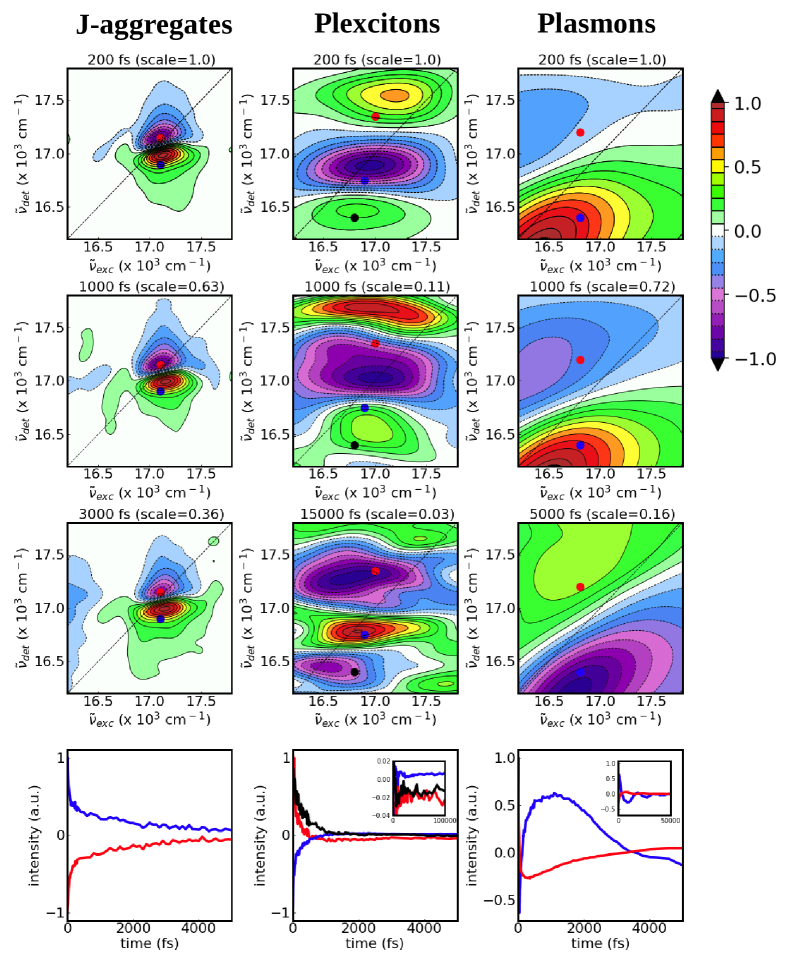
We measure the 2D spectra of the three systems at different population times (referred here as Jonas (2003)) to obtain the excited-state dynamics of J-aggregates and plasmons, as well as plexcitons in order to disentangle the contributions to dissipation from the metalic and molecular components in the hybrid system (Figure 2).
J-aggregates. The 2D spectra of J-aggregates
shows a broad excited-state absorption contribution (ESA, negative,
blue) almost coincident with a ground-state bleach (GSB, positive,
red) and stimulated emission signal (SE, positive, red), indicating
a near isoenergetic gap between the ground state and first excited
state band, and between the first and second excited state bands (see
Figure 2, Supplemental Note S2 and Supplemental Figure S3). This is in
accordance to the previous measurements Lee et al. (2001); Sundström et al. (1988); Minoshima et al. (1994)
and justifies the energy level scheme of Figure 1.a.
The population of the excited state decays with very little spectral
shift and can be fitted with three lifetimes of fs (43%),
ps (47%) and a very long time, corresponding to excited state lifetime ( ps, 10%).
Those agree with the time constants obtained from previous transient absorption
experiments, that have assigned the first component to relaxation
into dark exciton states, the second component – to exciton-exciton annihilation
(few ps, which depends on the excitation density) and the long-lived
component – to relaxation back to the ground state Lee et al. (2001); Sundström et al. (1988); Minoshima et al. (1994). The amplitude of the fastest component (close to half of the total signal) is consistent with the loss of the stimulated emission pathway during the waiting time due to the transition to dark states. In J-aggregates the dark states lie above the bright
transition so that only the levels within a thermal energy are accessible.
Plasmons. The 2D spectra of Ag nanoparticles show a single nodal line delimiting negative and positive spectral regions (Figure 2). The dynamics are characterized by spectral shifts and sign reversals across this nodal line, and can be separated into the early time dynamics ( ps), dominated by electron-electron (e-e) and electron-phonon (e-ph) scattering and late time dynamics ( ps) corresponding to hot lattice ground state relaxation Hu et al. (2003); Hartland (2011); Brown et al. (2017); Voisin et al. (2001); Lietard et al. (2018). We can think of the early time dynamics as corresponding to the processes that transfer the energy from the initial electronic excitation to
the lattice, and the late time dynamics – as the response of the lattice to the excess energy, notably lattice expansion due to the increase in temperature and the excitation of acoustic phonon modes Voisin et al. (2001). We start the analysis of the plasmon data at fs after the spatial modulation of the index of refraction imposed by the exciting pulses has disappeared Lietard et al. (2018). The evolution of the signal can be very well fit by a phenomenological equation analogous to the two-temperature model (see Sun et al. (1994); Link et al. (1999) and Supplemental Note S3, Supplemental Figures S5-S9):
| (4) |
where fs, ps are the inferred e-e and e-ph scattering times, rad/ps-1 is the angular frequency of the phonon (breathing mode), – its phase, and ps – its dephasing time. The thermalization time of the silver nanoparticle with the environment on the timescale of the phonon-phonon scattering time is longer than the measured population time range ( 1 ns). The asymptotic phase of the breathing mode carries information on the excitation mechanism of the acoustic phonon mode. The extracted phase is in a reasonable agreement with the thermal expansion mechanism (predicted at ) and constitutes a signature that energy is dissipated inside the metal nanoparticle, as opposed to evidence of a strong excited electron pressure (see Supplemental Note S3.3) Voisin et al. (2000).
Plexcitons. The early time 2D spectra of the plexcitons consists of two positive regions identifiable with the upper and lower branches, flanking a negative feature (Figure 2). The time evolution of the signal can be well fit by the sum of four exponential decays with time constants of fs, fs and ps and 1 ns, where the last signal appears as a constant background at long times in our measurements. The shortest time constant carries the largest amplitude ( 50 %) and corresponds to a pure decay without any appreciable spectral diffusion (see Supplemental Note S4 and Supplemental Figures S10-13). The second and third time constants correspond to pronounced spectral shifts and the 2D spectra show little evolution after this. The time traces (Figure 2, last row) also exhibit fast oscillations on top of the exponential decays, with dominant wavenumbers of 675 cm-1and 1200 cm-1. These correspond to the Raman modes observed in the Surface-Enhanced Raman Spectroscopy measurements of the same plexciton system (see Supplemental Figure S14, Balci (2013)). We leave a detailed discussion of the mechanisms behind each time constant for after an analysis of the simulations of the 2DES experiments.
Simulations of the plexciton 2D spectra. We simulate the third-order response for very early times and very late times (Figure 3, Supplemental Note S5 and Supplemental Figures S15-20 for details of the simulations). For very early times (i.e. at times much shorter than the e-e scattering time), we consider that the optical response contribution from the non-equilibrium electrons inside the metal is negligible. At very late times when all excitations have decayed back to the electronic ground state, all the excitations of the system happen from the equilibrium Fermi distribution. The intermediate times are not simulated here, and require an involved model based on Boltzmann equations, which is beyond the scope of the current study.
At early times, we follow work on infrared cavities F. Ribeiro et al. (2018) and model the nonlinearity of the plexcitons as a Rabi contraction of the excited state, where the probe pulse exciting a system with a fraction of the total number of molecules per nanoparticle already excited and a smaller ground state Rabi splitting . We find that we need to account as well for excitation induced dephasing (EID) and excitation induced shifts (EIS). We neglect the contributions of Feynman diagrams that evolve in the excited state during as the polariton branches decay into intraband metal excitations or molecular dark states shortly after excitation, and these do not have radiative transitions. The late-time simulations assume that the probe pulse examines an electronic ground state with a hot lattice and a consequent redshifted plasmon transition, as has been reported for bare metals Voisin et al. (2001). We find that while this model reproduces the positive and negative nodes of the spectrum, lower values of the plasmon transition need to be used (Details of the simulations are found in the Supplemental Note S5.)
We first notice that the absence of the upper and lower branch structure along the excitation dimension, both at early and late times, is well explained by the finite bandwidth of the pulses. There is a large parameter space that can explain the experiments both in the local and global approaches, so that experiments with broadband pulses will be needed in the future studies in order to extract unambiguous values of the parameters. Nonetheless, simulations support our assignment of the upper and lower polariton branches as the two positive signals at early times.
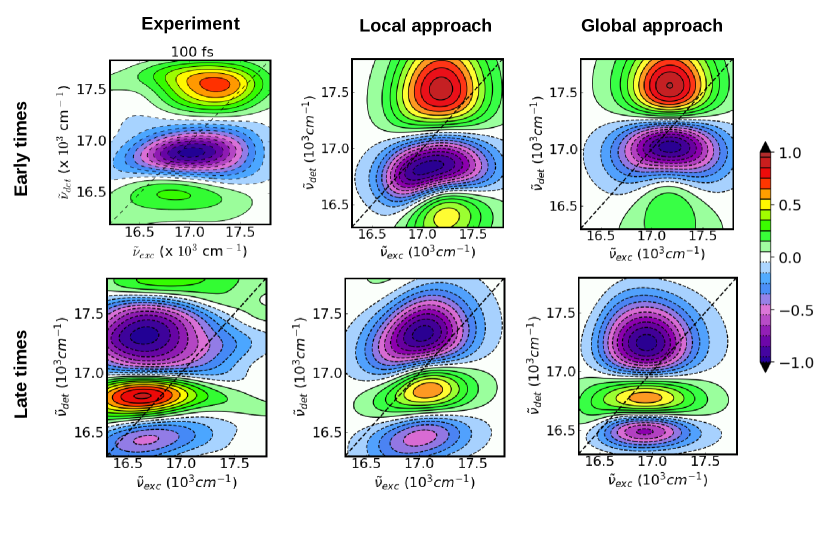
Similar to modeling of linear absorption, sharper features can be seen with the local approach along the excitation dimension, as is apparent in the broadband simulations (see Supplemental Figures S17 and S18). At late times, our simulations suggest the presence of a hot ground state. In this case, only the local approach reproduces the positive and negative features observed in the experiment (2 positive, 2 negative) while the global approach can only explain some (2 negative, 1 positive, see Supplemental Figures S19 and S20).
III Discussion
We now analyze each of the four components of the plexciton decay dynamics (labeled d, ee, eph, and ph-ph) and justify their assignment (see Figure 4). Our analysis is based on the relaxation time constants, the 2D spectral signatures and the overall cohesiveness of the proposed dissipation mechanisms. We notice that the dephasing rate of the optical coherence is not measured directly, but inferred from the absorption lineshape, as discussed in the first section of the manuscript.
The signature of the first time constant fs is that of pure decay without any spectral shift and appears mainly in the upper polariton branch region (see Supplemental Figure S11). The J-aggregate has an ultrafast component fs that does not cause any spectral shift either (corresponding to transfer to dark states) and both simulations as well as experiments in microcavities have noted that this very fast transfer to dark states occurs mostly from the upper branch, as we also observe Agranovich et al. (2003); Virgili et al. (2011); Groenhof et al. (2019). However, the amplitude of this fast component in plexcitons exceeds 50% of the total signal so that it cannot be explained exclusively by transfer to dark states which would entail a suppression of the SE pathway, but likely includes some relaxation of electrons to the ground state. In plasmons, a spatial long range order imposed by the laser sequence produces a strong distortion and variation of the signal at very early times Lietard et al. (2018). In our plasmonic nanoparticles the first 100 fs are dominated by this spatial order, however the spectral distortion of
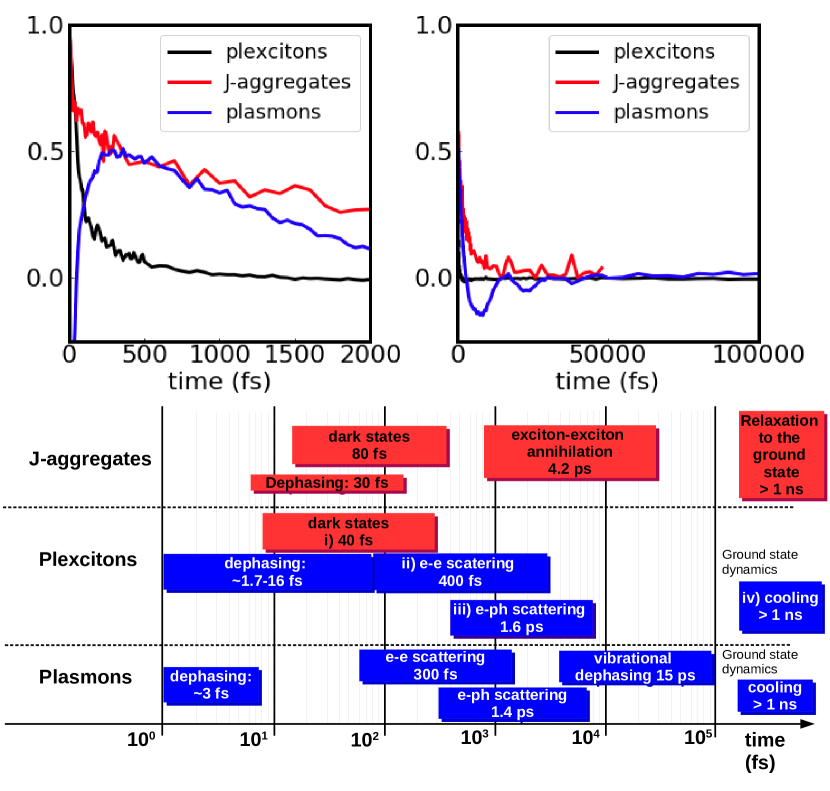
this process are absent in plexcitons so that it is doubtful whether the same process occurs in the decorated nanoparticles. A third possibility is that of radiation damping of the plasmon transition that leads to recombination to the ground state. This mechanism is likely to be unchanged in bare or TDBC-decorated Ag nanoparticles and cannot account for the loss of the acoustic mode vibration (explained below). We thus propose that this fast decay component corresponds to a combination of radiation damping and transfer to J-aggregate dark states, predominantly from the upper branch. During the second component (400 fs) we see a pronounced spectral shift. The fact that J-aggregates have no processes that induce a spectral shift, while plasmons do, and with a similar time constant (300 fs), suggests that this process corresponds to the e-e scattering inside the metal nanoparticle. Unlike EIS, mentioned previously and which occurs almost instantaneously, the shift discussed here develops on the timescale of electron electron scattering. The constant background at very long times is assigned to a hot lattice plexciton signal (see Figure 3, Supplemental Note S5 and Suppemental Figures S13, S19 and S20), so that the process that extends beyond the time range of the instrument ( ns) is likely thermalization of the solvent via phonon-phonon scattering with the time . Previous measurements set this process in the hundreds of ps Del Fatti et al. (2000). The third component (1.6 ps) induces a small spectral shift. The time constant for this process is close to the time constant for e-ph scattering measured in the Ag nanoprisms (1.4 ps) and suggests the same underlying process. This tentative assignment is bolstered by the presence of a hot lattice after this process is over. Alternate assignments of this third time constant would require an alternate mechanism for warming the lattice, however warming via the adsorbed molecules is not likely as this process is governed by and would also require several hundreds of ps. It is also striking that the replenishing of the lower polariton by the dark state reservoir is absent (contrary to microcavities Virgili et al. (2011)) and that the long lived dark modes do not survive after a few ps. In fact, the lower polariton dynamics seem to be determined by and , and we attribute this to the direct coupling between molecules and the metallic surface which likely connects the relaxation of TDBC dark states with that of the non-equilibrium electron distribution inside the lattice. Lastly, we mention that a signature of exciton-exciton annihilation – corresponding to a pure decay of the signal – is not observed, although we cannot rule out that it is a process that contributes to the third time constant.
Our measurements suggest that enough energy is dissipated outside of the metal nanoparticle so that the acoustic phonon cannot be excited to a detectable intensity. It is most likely dissipated in the J-aggregate with possible contributions from the surface, given the fast transfer rate to dark states, which can compete with e-e and e-ph scattering. While the coherence of the plexciton is limited by processes inside the metal, the energy dissipation would thus be strongly influenced by ultrafast processes inside the J-aggregate. This indicates that to increase the lifetime of the excitation we should first modify the molecular component, for example by going towards the single molecule limit where the number of dark states is significantly reduced, and isolating the molecules from the metal so that recombination via surface processes is suppressed.
Furthermore, the observation that e-e scattering events exist in plexcitons reveals a crucial point in plasmon-based polariton systems: that one can no longer speak exclusively in terms of upper or lower branches once dephasing processes have turned the initial coherent excitation into a non-equilibrium distribution of electrons and holes. A framework beyond Rabi type Hamiltonians, including the continuum states of the metallic band is needed in order to describe anything other than the early or late times. Our findings are different from microcavity dynamics as much of the signal arises from the non-equilibrium distribution of electronic excitations inside the metal. Whereas the direct interaction between molecules and silver surface excitations of microcavities is virtually inexistent (because the mirrors are usually coated by an insulating polymer layer and the cavity mode antinode lies inside the cavity), there is strong coupling between molecules and the silver surface in our samples that is beyond the dipolar coupling of the bright molecular and plasmon transitions as evidenced by the short lifetimes of the TDBC dark states. Thus metallic excitations can directly exchange energy and charge with adsorbed molecules. The possibilities afforded by this interaction in terms of hot electron chemistry set apart plasmon- from microcavity-based polariton states.
Many possible applications of atomic cQED systems have been explored throughout the years, from basic tests of quantum mechanics and quantum information processing to studies of strong light-matter coupling, its usefulness has been proven many times over. In contrast, the field of molecular cQED systems – and more so when the cavity is substituted by a plasmonic mode – is relatively recent. We are still learning what these systems are capable of and in what ways they differ from the more traditional cQED versions. There are many interesting phenomena: delocalization, collective behavior, chemical reactivity and remote energy transfer Kasprzak et al. (2006); Martínez-Martínez et al. (2018); Yuen-Zhou et al. (2016); Zhong et al. (2016); Feist and Garcia-Vidal (2015); Schachenmayer et al. (2015); Herrera and Spano (2016); Galego et al. (2015); Hutchison et al. (2013, 2012); Thomas et al. (2016); Wang et al. (2014); Coles et al. (2014); Sáez-Blázquez et al. (2018); Xiang et al. (2020); Du et al. (2018); Zhong et al. (2017); Krainova et al. (2020); Du et al. (2019); Fregoni et al. (2020); F. Ribeiro et al. (2018); Feist et al. (2018). In our work, we show that we need to understand the basic excitation dynamics occurring in metals when these are strongly coupled to molecules. The stronger coupling of plasmons to their baths than to the J-aggregates means that the site states are dressed by the dissipative modes. The resulting spectrum and underlying phenomenon is more akin to an interference-type process than a Rabi splitting Finkelstein-Shapiro et al. (2020). This type of physics has been recognized before in scattering settings Faucheaux et al. (2014); Pelton et al. (2019), however, it has not been connected to the local vs. global approach to Markovian master equations. As we show in this work, taking the local approach requires an extension to non-Hermitian Hamiltonians in the response function formalism. Thus our study provides both the motivation and groundwork to study the nonlinear response of Markovian systems in the limit of large dissipation that dominates plasmonic materials. We believe that given the short coherence times in colloidal suspensions of localized surface plasmon materials, a very interesting application of plexcitons arises in the manipulation of optical transitions to favor charge-transfer to an acceptor, or to promote catalysis, as opposed to performing coherent operations with these states.
IV Conclusion
We have presented a systematic study of plexciton dynamics using linear and third-order optical response. We are able to explain the lineshapes using a non-Hermitian Hamiltonian extension of response function formalism, which are rooted in the local approach to Markovian master equations. We have tracked the excitation evolution and identified one dephasing and four relaxation timescales which we have attributed to either molecular-like or metallic-like processes. Remarkably, we find that a significant part of the energy is dissipated outside of the metal lattice. Our work suggests that when considering the relaxation of plexcitons a more nuanced version of the dynamics in terms of hot electron distributions is needed.
Realizations of polaritonic systems continue to bring new insights into basic quantum physics concepts and emergent behavior of hybrid systems. Because the plasmon-based polaritons exists at the intersection of strong-light matter coupling and important condensed matter and chemical processes, such as interfacial charge transfer and photocatalysis, they are uniquely fit to bring desirable features of the former into the societally relevant applications of the latter.
V Methods
Synthesis. We synthesized plasmonic and plexcitonic nanoparticles as reported in our earlier studies Balci (2013); Balci et al. (2016). Briefly, the Ag nanoprisms with varying edge lengths were wet-chemically synthesized by using a seed-mediated protocol. Initially, isotropic seed Ag nanoparticles were synthesized, which was then followed by a slower growth of anisotropic Ag nanoprisms. By controlling the number of seed nanoparticles in the growth solution, the size of the nanoprism can be easily tuned. Concurrently, the localized surface plasmon polariton frequency of the nanoparticles vary from 400 nm to 1100 nm. Plexcitonic nanoparticles used in this study were synthesized by self-assembly of a J-aggregate dye (TDBC, 5,5,6,6-tetrachloro-di(4-sulfobutyl) benzimidazolocarbocyanine, FEW Chemicals) on Ag nanoprism surfaces. It should be noted that the excess dye molecules were removed by centrifugation.
Two-dimensional electronic spectroscopy. The 2DES spectrometer is described in detail in Augulis and Zigmantas (2011). Briefly, femtosecond broadband pulses were generated by feeding the 1,030 nm output of a Pharos laser (Light Conversion Ltd) to a commercial NOPA (Light Conversion Ltd) to generate a pulse at 590 nm. The narrow-band spectrum (see Supplemental Figure S15, simulations) where generated by compressing the pulse using chirped mirrors and a prism compressor, and subsequently limiting the spectrum using a blade edge to obtain a 40 nm FWHM pulse of less than 25 fs duration (used for J-aggregates and plexcitons measurements). To obtain the broadband pulse we used a home-built pulse shaper arranged in a folded 4f-geometry. The setup is based on a dual liquid crystal spatial light modulator (SLM-S640d, Jenoptik) enabling simultaneous shaping of phase and amplitude Wittenbecher and Zigmantas (2019). Second order dispersion from material in the beam path is for the most part compensated for by a pair of chirped mirrors in combination with a prism compressor consisting of two fused silica prisms at a separation of 310 mm. Higher order phase distortions are compensated for by the pulse shaper. With this arrangement broadband pulses with a duration of 11 fs were obtained (used for the Ag nanoparticles measurement). All four beams are focused at the sample to the spot size of 160 . The pulses were attenuated to pulse energies in the range of 0.1 to 1.25 nJ/pulse. Polarizations of pulses 1 and 2 were set to magic angle with respect to pulse 3 and the local oscillator. Several measurement series were carried out across population times. The coherence time was scanned from -71.6 to 151.2 fs in 1.4 fs steps for J-aggregates, from -42 to 63 fs for plasmons and from -50.4 to 50.4 fs for plexcitons. The resolution of the measurement was 60 cm-1at the detection frequency and 290 cm-1at the excitation frequency.
VI Acknowledgments
Funding is acknowledged from the European Union through the Marie Sklodowska-Curie Grant Agreement No.702694, from Nanolund and from V.R. grants 2017-05150, 2017-04344 and 2018-05090. We also acknowledge stimulating discussions with Patrick Potts.
VII Author contributions
D.F.S. and D.Z. conceived the idea. D.F.S., L.W., I.M. and D.Z. designed and performed the experiments. D.F.S., P.A.M. and T.P. discussed the theory and D.F.S. carried out the simulations. S.S. and S.B. synthesized the samples. D.F.S. and P.A.M analyzed the data and D.F.S. wrote the manuscript, edited by P.A.M., T.P. and D.Z., with input from all the other authors.
VIII Declaration of Interests
The authors declare no competing interests.
References
- Walther et al. (2006) H. Walther, B. T. Varcoe, B.-G. Englert, and T. Becker, Reports on Progress in Physics 69, 1325 (2006).
- Mabuchi and Doherty (2002) H. Mabuchi and A. C. Doherty, Science 298, 1372 (2002).
- Haroche and Kleppner (1989) S. Haroche and D. Kleppner, Phys. Today 42, 24 (1989).
- Raimond et al. (2001) J. M. Raimond, M. Brune, and S. Haroche, Rev. Mod. Phys. 73, 565 (2001).
- Kasprzak et al. (2006) J. Kasprzak, M. Richard, S. Kundermann, A. Baas, P. Jeambrun, J. M. J. Keeling, F. M. Marchetti, M. H. Szymanska, R. Andre, J. L. Staehli, et al., Nature (London, U. K.) 443, 409 (2006).
- Martínez-Martínez et al. (2018) L. A. Martínez-Martínez, M. Du, R. F. Ribeiro, S. Kéna-Cohen, and J. Yuen-Zhou, The Journal of Physical Chemistry Letters 9, 1951 (2018).
- Yuen-Zhou et al. (2016) J. Yuen-Zhou, S. K. Saikin, T. Zhu, M. C. Onbasli, C. A. Ross, V. Bulovic, and M. A. Baldo, Nature Communications 7, 11783 (2016).
- Zhong et al. (2016) X. Zhong, T. Chervy, S. Wang, J. George, A. Thomas, J. A. Hutchison, E. Devaux, C. Genet, and T. W. Ebbesen, Angew. Chem., Int. Ed. 55, 6202 (2016).
- Feist and Garcia-Vidal (2015) J. Feist and F. J. Garcia-Vidal, Phys. Rev. Lett. 114, 196402 (2015).
- Schachenmayer et al. (2015) J. Schachenmayer, C. Genes, E. Tignone, and G. Pupillo, Phys. Rev. Lett. 114, 196403 (2015).
- Herrera and Spano (2016) F. Herrera and F. C. Spano, Phys. Rev. Lett. 116, 238301 (2016).
- Galego et al. (2015) J. Galego, F. J. Garcia-Vidal, and J. Feist, Phys. Rev. X 5, 041022 (2015).
- Hutchison et al. (2013) J. A. Hutchison, A. Liscio, T. Schwartz, A. Canaguier-Durand, C. Genet, V. Palermo, P. Samori, and T. W. Ebbesen, Adv. Mater. 25, 2481 (2013).
- Hutchison et al. (2012) J. A. Hutchison, T. Schwartz, C. Genet, E. Devaux, and T. W. Ebbesen, Angewandte Chemie International Edition 51, 1592 (2012).
- Thomas et al. (2016) A. Thomas, J. George, A. Shalabney, M. Dryzhakov, S. J. Varma, J. Moran, T. Chervy, X. Zhong, E. Devaux, C. Genet, et al., Angew. Chem., Int. Ed. 55, 11462 (2016).
- Wang et al. (2014) S. Wang, A. Mika, J. A. Hutchison, C. Genet, A. Jouaiti, M. W. Hosseini, and T. W. Ebbesen, Nanoscale 6, 7243 (2014).
- Mandal and Huo (2019) A. Mandal and P. Huo, J. Phys. Chem. Lett. 10, 5519 (2019).
- Manuel et al. (2019) A. P. Manuel, A. Kirkey, N. Mahdi, and K. Shankar, J. Mater. Chem. C 7, 1821 (2019).
- Coles et al. (2014) D. M. Coles, N. Somaschi, P. Michetti, C. Clark, P. G. Lagoudakis, P. G. Savvidis, and D. G. Lidzey, Nat. Mater. 13, 712 (2014).
- Sáez-Blázquez et al. (2018) R. Sáez-Blázquez, J. Feist, A. I. Fernández-Dománguez, and F. J. García-Vidal, Phys. Rev. B 97, 241407 (2018).
- Xiang et al. (2020) B. Xiang, R. F. Ribeiro, M. Du, L. Chen, Z. Yang, J. Wang, J. Yuen-Zhou, and W. Xiong, Science 368, 665 (2020), ISSN 0036-8075.
- Du et al. (2018) M. Du, L. A. Martínez-Martínez, R. F. Ribeiro, Z. Hu, V. M. Menon, and J. Yuen-Zhou, Chem. Sci. 9, 6659 (2018).
- Zhong et al. (2017) X. Zhong, T. Chervy, L. Zhang, A. Thomas, J. George, C. Genet, J. A. Hutchison, and T. W. Ebbesen, Angewandte Chemie International Edition 56, 9034 (2017).
- Krainova et al. (2020) N. Krainova, A. J. Grede, D. Tsokkou, N. Banerji, and N. C. Giebink, Phys. Rev. Lett. 124, 177401 (2020).
- Du et al. (2019) M. Du, R. F. Ribeiro, and J. Yuen-Zhou, Chem 5, 1167 (2019), ISSN 2451-9294.
- Fregoni et al. (2020) J. Fregoni, G. Granucci, M. Persico, and S. Corni, Chem 6, 250 (2020), ISSN 2451-9294.
- F. Ribeiro et al. (2018) R. F. Ribeiro, A. D. Dunkelberger, B. Xiang, W. Xiong, B. S. Simpkins, J. C. Owrutsky, and J. Yuen-Zhou, J. Phys. Chem. Lett. 9, 3766 (2018).
- Feist et al. (2018) J. Feist, J. Galego, and F. J. García-Vidal, ACS Photonics 5, 205 (2018).
- Torma and Barnes (2015) P. Torma and W. L. Barnes, Rep Prog Phys 78, 013901 (2015).
- Johannes et al. (2018) F. Johannes, R. Nicholas, and N. Prineha, Nanophotonics 7, 1479 (2018).
- Ebbesen (2016) T. W. Ebbesen, Accounts of Chemical Research 49, 2403 (2016).
- Chen et al. (2017) X. Chen, Y.-H. Chen, J. Qin, D. Zhao, B. Ding, R. J. Blaikie, and M. Qiu, Nano Letters 17, 3246 (2017).
- Wersäll et al. (2017) M. Wersäll, J. Cuadra, T. J. Antosiewicz, S. Balci, and T. Shegai, Nano Letters 17, 551 (2017).
- Roller et al. (2016) E.-M. Roller, C. Argyropoulos, A. Högele, T. Liedl, and M. Pilo-Pais, Nano Letters 16, 5962 (2016).
- Antosiewicz et al. (2014) T. J. Antosiewicz, S. P. Apell, and T. Shegai, ACS Photonics 1, 454 (2014).
- Sugawara et al. (2006) Y. Sugawara, T. A. Kelf, J. J. Baumberg, M. E. Abdelsalam, and P. N. Bartlett, Phys. Rev. Lett. 97, 266808 (2006).
- Bellessa et al. (2004) J. Bellessa, C. Bonnand, J. C. Plenet, and J. Mugnier, Phys. Rev. Lett. 93, 036404 (2004).
- Balci et al. (2016) S. Balci, B. Kucukoz, O. Balci, A. Karatay, C. Kocabas, and G. Yaglioglu, ACS Photonics 3, 2010 (2016).
- Santhosh et al. (2016) K. Santhosh, O. Bitton, L. Chuntonov, and G. Haran, Nature Communications 7, 11823 (2016).
- Hertzog et al. (2019) M. Hertzog, M. Wang, J. Mony, and K. Börjesson, Chem. Soc. Rev. 48, 937 (2019).
- Voisin et al. (2001) C. Voisin, N. Del Fatti, D. Christofilos, and F. Vallée, The Journal of Physical Chemistry B 105, 2264 (2001).
- Lin et al. (2013) Y. Lin, J. P. Gaebler, F. Reiter, T. R. Tan, R. Bowler, A. S. Sørensen, D. Leibfried, and D. J. Wineland, Nature 504, 415 (2013).
- Scully et al. (2011) M. O. Scully, K. R. Chapin, K. E. Dorfman, M. B. Kim, and A. Svidzinsky, Proceedings of the National Academy of Sciences 108, 15097 (2011).
- Fofang et al. (2011) N. T. Fofang, N. K. Grady, Z. Fan, A. O. Govorov, and N. J. Halas, Nano Letters 11, 1556 (2011).
- Balci et al. (2014) S. Balci, C. Kocabas, B. Kucukoz, A. Karatay, E. Akhuseyin, H. G. Yaglioglu, , and A. Elmali, Applied Physics Letters 105, 051105 (2014).
- Hranisavljevic et al. (2002) J. Hranisavljevic, N. M. Dimitrijevic, G. A. Wurtz, and G. P. Wiederrecht, Journal of the American Chemical Society 124, 4536 (2002).
- Vasa et al. (2013) P. Vasa, W. Wang, R. Pomraenke, M. Lammers, M. Maiuri, C. Manzoni, G. Cerullo, and C. Lienau, Nature Photonics 7, 128 (2013).
- Wiederrecht et al. (2008) G. P. Wiederrecht, G. A. Wurtz, and A. Bouhelier, Chemical Physics Letters 461, 171 (2008).
- Hoang et al. (2016) T. B. Hoang, G. M. Akselrod, and M. H. Mikkelsen, Nano Letters 16, 270 (2016).
- Xiang et al. (2018) B. Xiang, R. F. Ribeiro, A. D. Dunkelberger, J. Wang, Y. Li, B. S. Simpkins, J. C. Owrutsky, J. Yuen-Zhou, and W. Xiong, Proceedings of the National Academy of Sciences 115, 4845 (2018).
- Zhang et al. (2019) Z. Zhang, K. Wang, Z. Yi, M. S. Zubairy, M. O. Scully, and S. Mukamel, J. Phys. Chem. Lett. 10, 4448 (2019).
- DelPo et al. (2020) C. A. DelPo, B. Kudisch, K. H. Park, S.-U.-Z. Khan, F. Fassioli, D. Fausti, B. P. Rand, and G. D. Scholes, J. Phys. Chem. Lett. 11, 2667 (2020).
- Mewes et al. (2020) L. Mewes, M. Wang, R. A. Ingle, K. Börjesson, and M. Chergui, Communications Physics 3, 157 (2020), ISSN 2399-3650.
- Balci (2013) S. Balci, Opt. Lett. 38, 4498 (2013).
- Agranovich and Mal’Shukov (1974) V. M. Agranovich and A. G. Mal’Shukov, Opt. Commun. 11, 169 (1974).
- Minoshima et al. (1994) K. Minoshima, M. Taiji, K. Misawa, and T. Kobayashi, Chem. Phys. Lett. 218, 67 (1994).
- Milota et al. (2013) F. Milota, V. I. Prokhorenko, T. Mancal, H. von Berlepsch, O. Bixner, H. F. Kauffmann, and J. Hauer, J. Phys. Chem. A 117, 6007 (2013).
- Delga et al. (2014) A. Delga, J. Feist, J. Bravo-Abad, and F. J. Garcia-Vidal, Journal of Optics 16, 114018 (2014).
- Shah et al. (2013) R. A. Shah, N. F. Scherer, M. Pelton, and S. K. Gray, Phys. Rev. B 88, 075411 (2013).
- Zelinskyy et al. (2012) Y. Zelinskyy, Y. Zhang, and V. May, J. Phys. Chem. A 116, 11330 (2012).
- Varguet et al. (2019) H. Varguet, B. Rousseaux, D. Dzsotjan, H. R. Jauslin, S. Guérin, and G. C. des Francs, Journal of Physics B: Atomic, Molecular and Optical Physics 52, 055404 (2019).
- Piryatinski et al. (2020) A. Piryatinski, O. Roslyak, H. Li, and E. R. Bittner, Phys. Rev. Research 2, 013141 (2020).
- Mukamel (1995) S. Mukamel, Principles of nonlinear optical spectroscopy (Oxford University Press, 1995).
- Hofer et al. (2017) P. P. Hofer, M. Perarnau-Llobet, L. D. M. Miranda, G. Haack, R. Silva, J. B. Brask, and N. Brunner, New Journal of Physics 19, 123037 (2017).
- Cho (2009) M. Cho, Two-dimensional optical spectroscopy (CRC press, 2009).
- Malý and Mančal (2018) P. Malý and T. Mančal, J. Phys. Chem. Lett. 9, 5654 (2018).
- Wright (1994) O. B. Wright, Phys. Rev. B 49, 9985 (1994).
- Weick et al. (2005) G. Weick, R. A. Molina, D. Weinmann, and R. A. Jalabert, Phys. Rev. B 72, 115410 (2005).
- Jonas (2003) D. M. Jonas, Annual Review of Physical Chemistry 54, 425 (2003).
- Lee et al. (2001) J.-H. Lee, C.-K. Min, and T. Joo, J. Chem. Phys. 114, 377 (2001).
- Sundström et al. (1988) V. Sundström, T. Gillbro, R. A. Gadonas, and A. Piskarskas, The Journal of Chemical Physics 89, 2754 (1988).
- Hu et al. (2003) M. Hu, X. Wang, G. V. Hartland, P. Mulvaney, J. P. Juste, and J. E. Sader, Journal of the American Chemical Society 125, 14925 (2003).
- Hartland (2011) G. V. Hartland, Chemical Reviews 111, 3858 (2011).
- Brown et al. (2017) A. M. Brown, R. Sundararaman, P. Narang, A. M. Schwartzberg, W. A. Goddard, and H. A. Atwater, Phys. Rev. Lett. 118, 087401 (2017).
- Lietard et al. (2018) A. Lietard, C.-S. Hsieh, H. Rhee, and M. Cho, Nature Communications 9, 891 (2018).
- Sun et al. (1994) C.-K. Sun, F. Vallée, L. H. Acioli, E. P. Ippen, and J. G. Fujimoto, Phys. Rev. B 50, 15337 (1994).
- Link et al. (1999) S. Link, C. Burda, Z. L. Wang, and M. A. El-Sayed, The Journal of Chemical Physics 111, 1255 (1999).
- Voisin et al. (2000) C. Voisin, N. D. Fatti, D. Christofilos, and F. Vallée, Applied Surface Science 164, 131 (2000).
- Agranovich et al. (2003) V. M. Agranovich, M. Litinskaia, and D. G. Lidzey, Phys. Rev. B 67, 085311 (2003).
- Virgili et al. (2011) T. Virgili, D. Coles, A. M. Adawi, C. Clark, P. Michetti, S. K. Rajendran, D. Brida, D. Polli, G. Cerullo, and D. G. Lidzey, Phys. Rev. B 83, 245309 (2011).
- Groenhof et al. (2019) G. Groenhof, C. Climent, J. Feist, D. Morozov, and J. J. Toppari, J. Phys. Chem. Lett. 10, 5476 (2019).
- Del Fatti et al. (2000) N. Del Fatti, C. Voisin, M. Achermann, S. Tzortzakis, D. Christofilos, and F. Vallée, Phys. Rev. B 61, 16956 (2000).
- Finkelstein-Shapiro et al. (2020) D. Finkelstein-Shapiro, D. Viennot, I. Saideh, T. Hansen, T. o. Pullerits, and A. Keller, Phys. Rev. A 101, 042102 (2020).
- Faucheaux et al. (2014) J. A. Faucheaux, J. Fu, and P. K. Jain, The Journal of Physical Chemistry C 118, 2710 (2014).
- Pelton et al. (2019) M. Pelton, S. D. Storm, and H. Leng, Nanoscale 11, 14540 (2019).
- Augulis and Zigmantas (2011) R. Augulis and D. Zigmantas, Opt. Express 19, 13126 (2011).
- Wittenbecher and Zigmantas (2019) L. Wittenbecher and D. Zigmantas, Opt. Express 27, 22970 (2019).