Biomolecular sensing at the interface between chiral metasurfaces and hyperbolic metamaterials
Abstract
In recent years significant efforts have been made to design and fabricate functional nanomaterials for biomedical applications based on the control of light matter interaction at the nanometer scale. Among many other artificial materials, hyperbolic dispersion metamaterials allow to access unprecedented physical effects and mechanisms due to the extreme anisotropy of their optical constants. The unbound isofrequency surface of hyperbolic metamaterials (HMMs) enable the possibility to support a virtually infinite density of states and ultra-high confinement of electromagnetic fields, allowing perfect absorption of light and extreme sensing properties. Optical sensor technology based on plasmonic metamaterials offers significant opportunities in the field of clinical diagnostics, particularly for the detection of low-molecular-weight biomolecules in highly diluted solutions. In this context, we present a computational effort to engineer a biosensing platform based on hyperbolic metamaterials, supporting highly confined bulk plasmon modes integrated with out-of-plane chiral metasurfaces. The role of the helicoidal chiral metasurface is manifold: i) as a diffractive element to increase the momentum of the incoming light to excite the plasmon sensing modes with linearly and circularly polarized light; ii) as out-of-plane extended sensing surface to capture target analytes away from the substrate thereby the diffusion limit; iii) as a plamonic chiral nanostructure with enhanced sensing performance over circularly polarized reflectance light.
CNR NANOTEC - Istituto di Nanotecnologia, UOS Cosenza, 87036, Rende (CS), Italy \alsoaffiliationCNR NANOTEC - Istituto di Nanotecnologia, UOS Cosenza, 87036, Rende (CS), Italy \alsoaffiliationCNR NANOTEC - Istituto di Nanotecnologia, UOS Cosenza, 87036, Rende (CS), Italy \alsoaffiliationCNR NANOTEC - Istituto di Nanotecnologia, UOS Cosenza, 87036, Rende (CS), Italy \alsoaffiliation[Second University] Department of Physics, Case Western Reserve University, 10600 Euclid Avenue, Cleveland, Ohio 44106, USA
1
In the fight against cancer it is essential to diagnose the disease at an early stage. To date, one of the most widely used methods for the diagnosis and staging of the disease is represented by the tissue biopsy. However, this clinical exam is invasive and it is performed when the site of the tumor has already been identified. In contrast, liquid biopsy has proved to be a valid alternative to detect and monitor cancer biomarkers. 1, 2, 3, 4, 5, 6 For this reason, researchers are focused to develop extremely sensitive platforms, able to determine specific nucleic acids and proteins in circulating tumor cells (CTCs), in body fluids as blood, urine, sweat and tears.
To the present, several investigation techniques have been developed to identify for example the presence of proteins in the blood by means of an electrochemical analysis,7 or in saliva by means of electrochemical immunoassay biosensors. 8
Optical sensor technology based on plasmonic metamaterials offers significant opportunities in the field of clinical diagnosis, particularly for the detection of low-molecular weight biomolecules in highly diluted solutions.9, 10, 11
Hyperbolic metamaterials (HMMs) represent a novel class of promising artificial plasmonic materials used in the field of bio-sensing, supporting highly confined bulk plasmon polaritons (BPPs) in addition to surface plasmon polaritons (SPPs).12, 13, 14, 15
It has been experimentally demonstrated that it is possible to excite both surface and bulk plasmon polaritons in HMM by means of a hypergrating, consisting of 1D and 2D metallic diffraction gratings, such as stripes, disk or holes gratings.16 However, further sensing properties could be reached by engineering the hypergrating features towards the realization of a high sensitivity and high accuracy biosensing platform.
Here, we report, for the first time, a numerical simulation of a new biosensing platform based on HMMs integrated with an out-of-plane 3D chiral metasurface hypergrating (CMH), where the fundamental building block is represented by a helical shaped nanostructure. In particular, the implementation of 3D metallic grating could enable the excitation of the high-k modes of the underlying HMM and reduce the diffusion limit by the detection of molecules that do not necessarily flows close to the surface. Moreover, the strong intrinsic chirality belonging to plasmonic nanohelices induces circular polarization dependent BPP mode excitation, resulting in a giant circular dichroism value (CD), boosting the sensing properties of the system.
We demonstrate that our advanced biosensing platform exhibits extremely high sensing properties since it takes advantages of the elevated sensitivity of the HMM bulk modes (high Q factor) and the significant accuracy of the circular dichroism (CD) signal of the CMH that exhibits more spectral features to track the environment changes.
Moreover, considering the increased out-of-plane surface of the 3D nanohelices, able to that interact with analyte targets, we have introduced the mass sensitivity as analytical figure of merit, that describes the surface coverage-refractive index variation relationship. We have calculated that the minimum quantity of binding analyte that can leads to an appreciable variation in terms of refractive index unit (RIU) results equal to 0.04 pg/mm2.
Similarly, we carried out a study of the analyte diffusion calculating the sensitivity changes as a function of the relative surface coverage, at different distance away from the HMM surface, noting that our system allows to detect analytes over the diffusion limit of planar hypergrating.
Finally, we quantified the sensitivity and Figure of merit (FOM) of the sensor tracking the spectral shift of the CD features as a function of the glycerol/water concentration ratio leading to a remarkable FOM value of about 20.0 RIU-1.
These results indicate that our innovative sensing platform offers unique advantages for high sensitivity detection of analytes in many biological applications.
2 Results and discussion
The sketch reported in Figure 1a shows the schematic diagram of a type II HMM configuration consisting of alternating dielectric and metallic thin films. In particular, to obtain a hyperbolic dispersion at optical frequencies (with dielectric permittivity tensor component and , above 418 nm), we designed a HMM composed by indium tin oxide (ITO - 20 nm) and silver (Ag - 20 nm) layers using Effective Medium Theory (EMT)17 (see Supporting Information).
Figure 1b shows the numerical reflectance and transmittance curves of the HMM, provided by COMSOL Multiphysics simulation.18 The reflectance and transmittance are calculated by considering a TM-wave (p-polarization) and an incident angle . The minimum value at about 358 nm in the reflectance curve (and the related maximum in the transmittance one) is referred to as the Ferrel-Berreman mode for silver nanometric layers.19
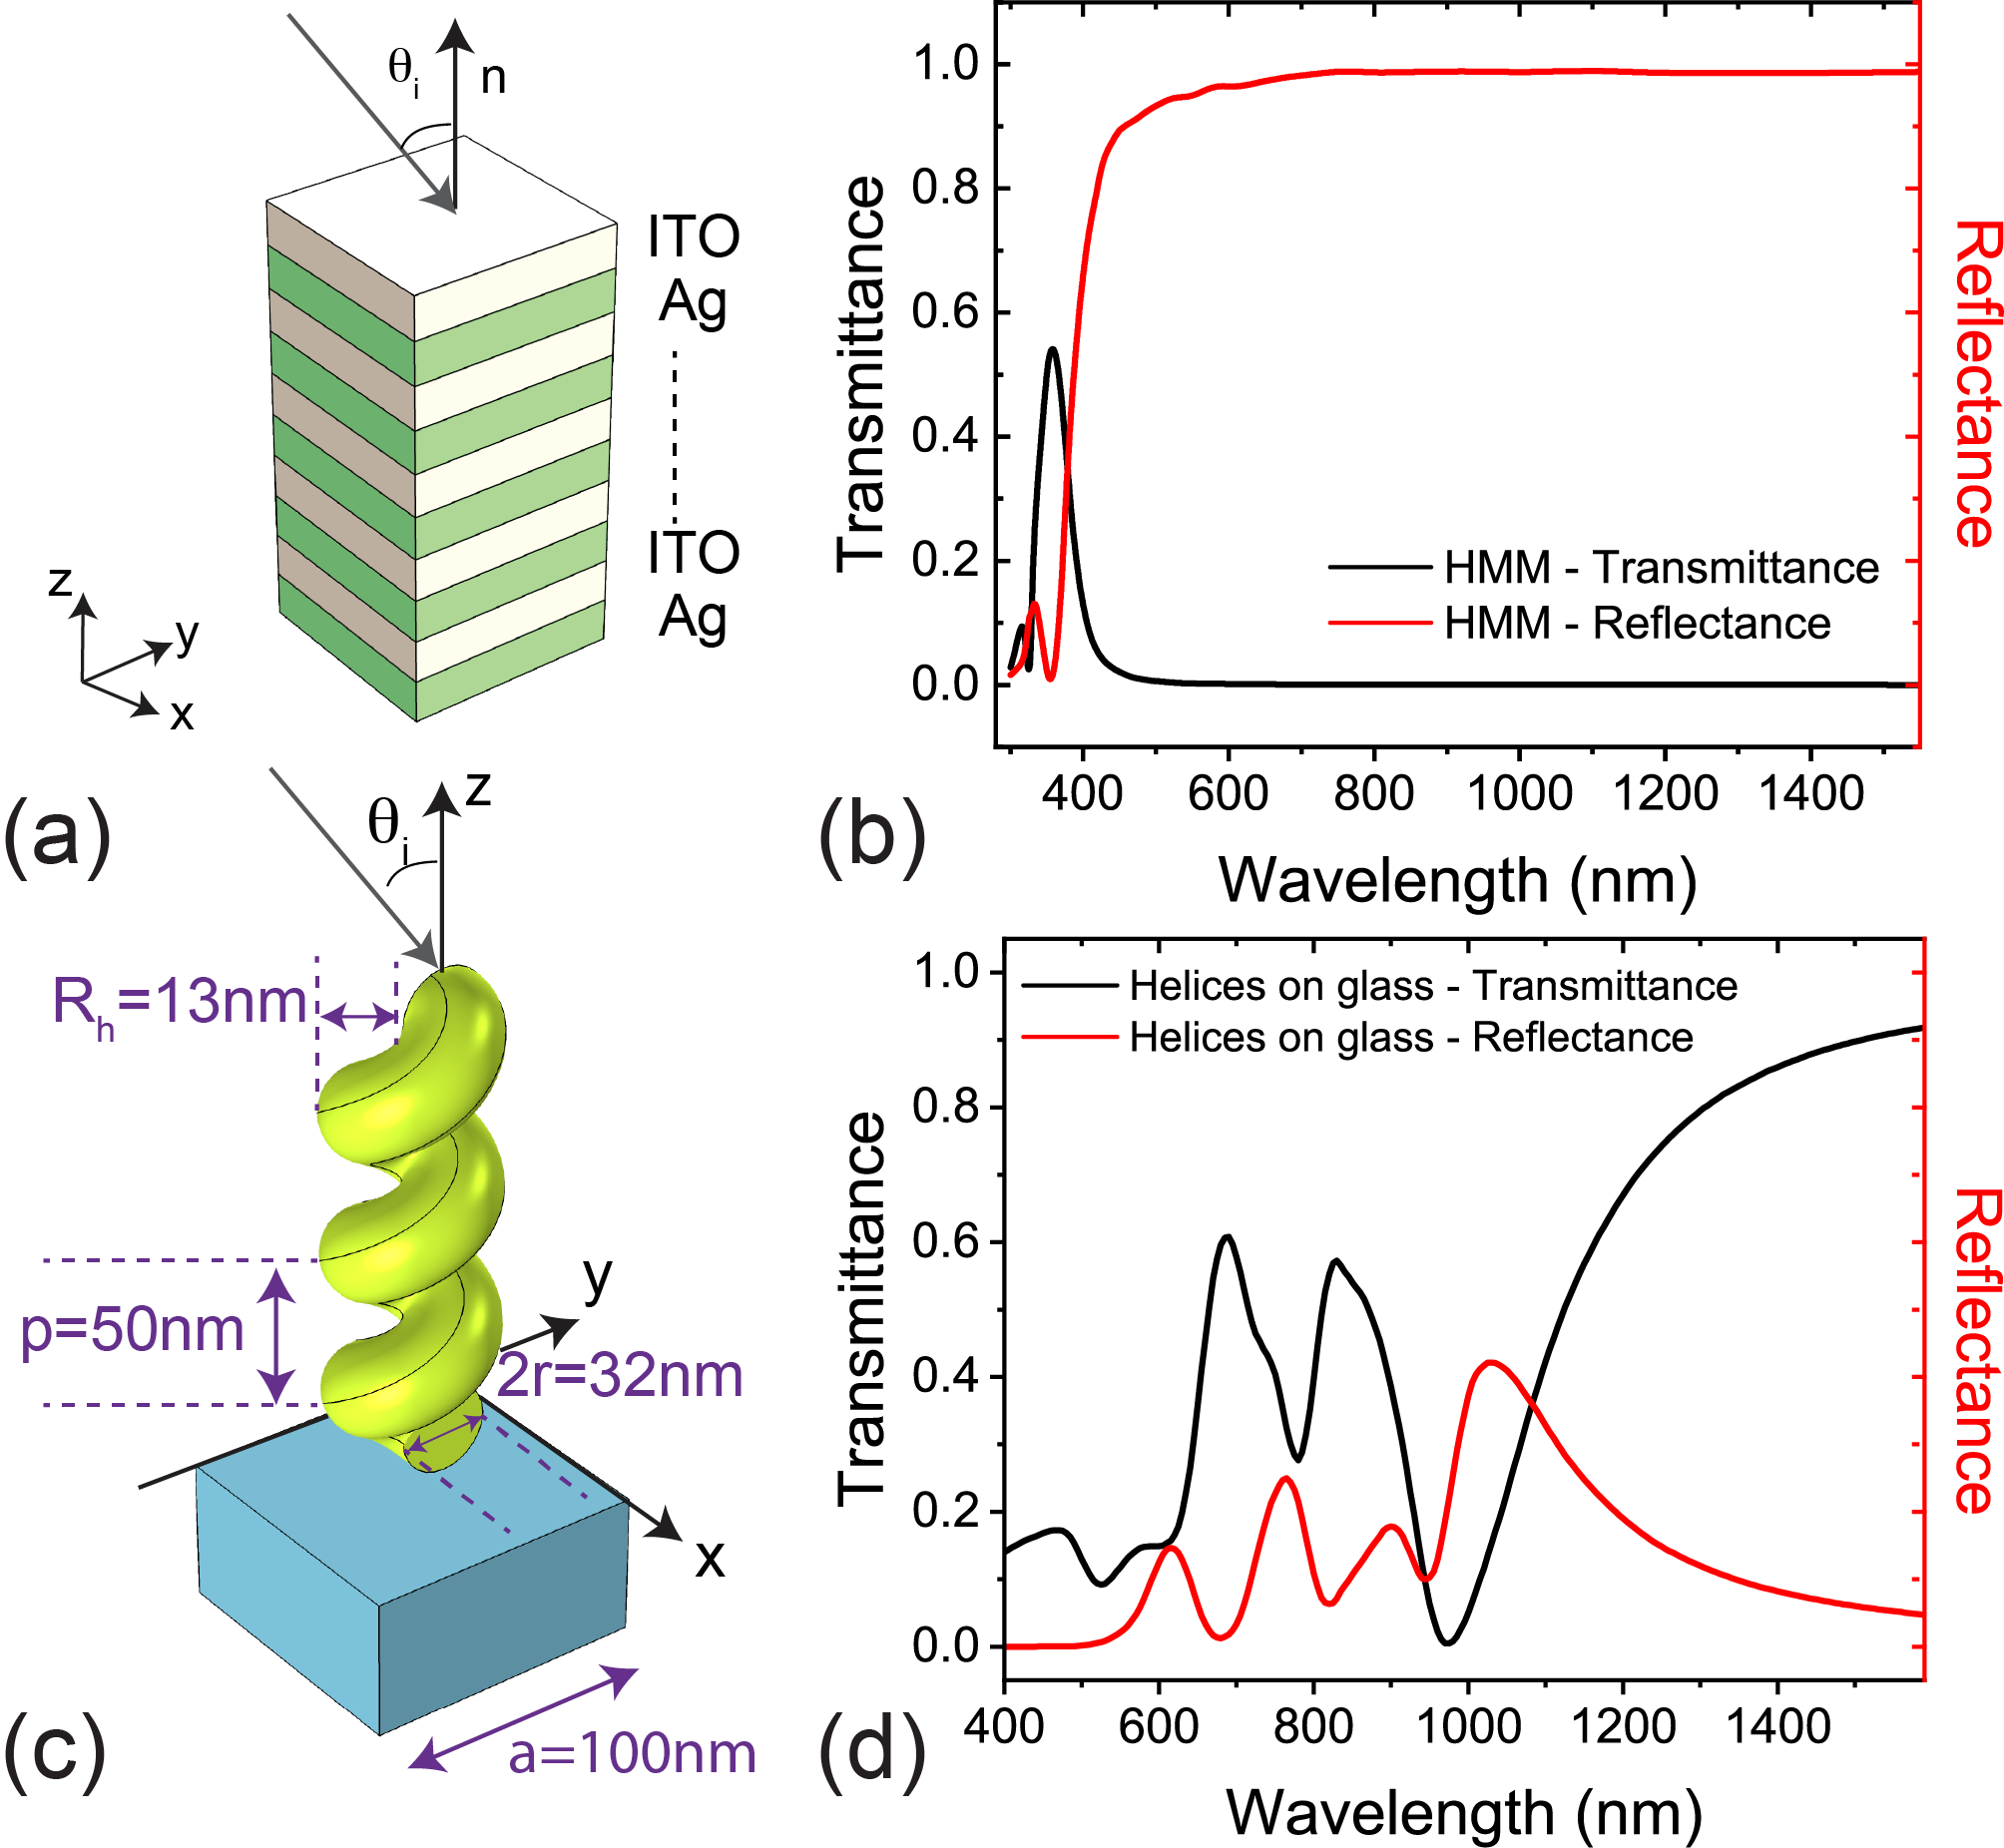
In order to excite both surface and bulk plasmon modes inside the HMM, we designed an out-of-plane CMH as shown in Figure 1c. The geometrical parameters of the helix array are wire radius (), helix radius (), pitch height or axial pitch (), the number of pitches () and the lattice constant ().20 Currently CMH with these geometrical features could be fabricated by focused ion beam induced deposition (FIBID),21 or by the shadow-growth or glancing-angle deposition techniques. 22, 23, 24, 25
The simulations were conducted considering an infinite array of helices both on a glass substrate and onto the HMM structures. This has been possible by simulating a single unit cell of the chiral metasurface composed of a right-handed Au helix arranged in a square lattice. In the first analysis distilled water (n = 1.3330) was considered as the surrounding medium for the chiral metasurface. The reflectance and transmittance curves are calculated for a TM wave and same angle of incidence () with respect to the helix axis. The resulting spectra, shown in Figure 1d, are determined by the interplay of internal resonances and their mutual coupling that strongly depends on the structure parameters of the CMH.
It is important to note that the calculated reflectance for the chiral metasurface on glass substrate, does not exceed the 40% in all the considered spectral range (400-1600 nm). In order to study the optical behavior in terms of reflectance and transmittance of the chiral metasurface on the HMM (CMH-HMM), we combined the two above mentioned structures into a single 3D geometry built in COMSOL. The obtained 3D system is composed by a parallelepiped 8 times higher than the lattice constant - Figure 2a. The choice of the box height is fundamental for the optimal propagation of the lightwave inside the system preventing any diffraction or boundary problems. The numerical geometry of the model is sketched in Figure 2a, with, starting from the top, the superstrate containing the Au helix (distilled water as surrounding medium), the multi-layer system (grey stack of ITO/Ag) and the substrate (glass).
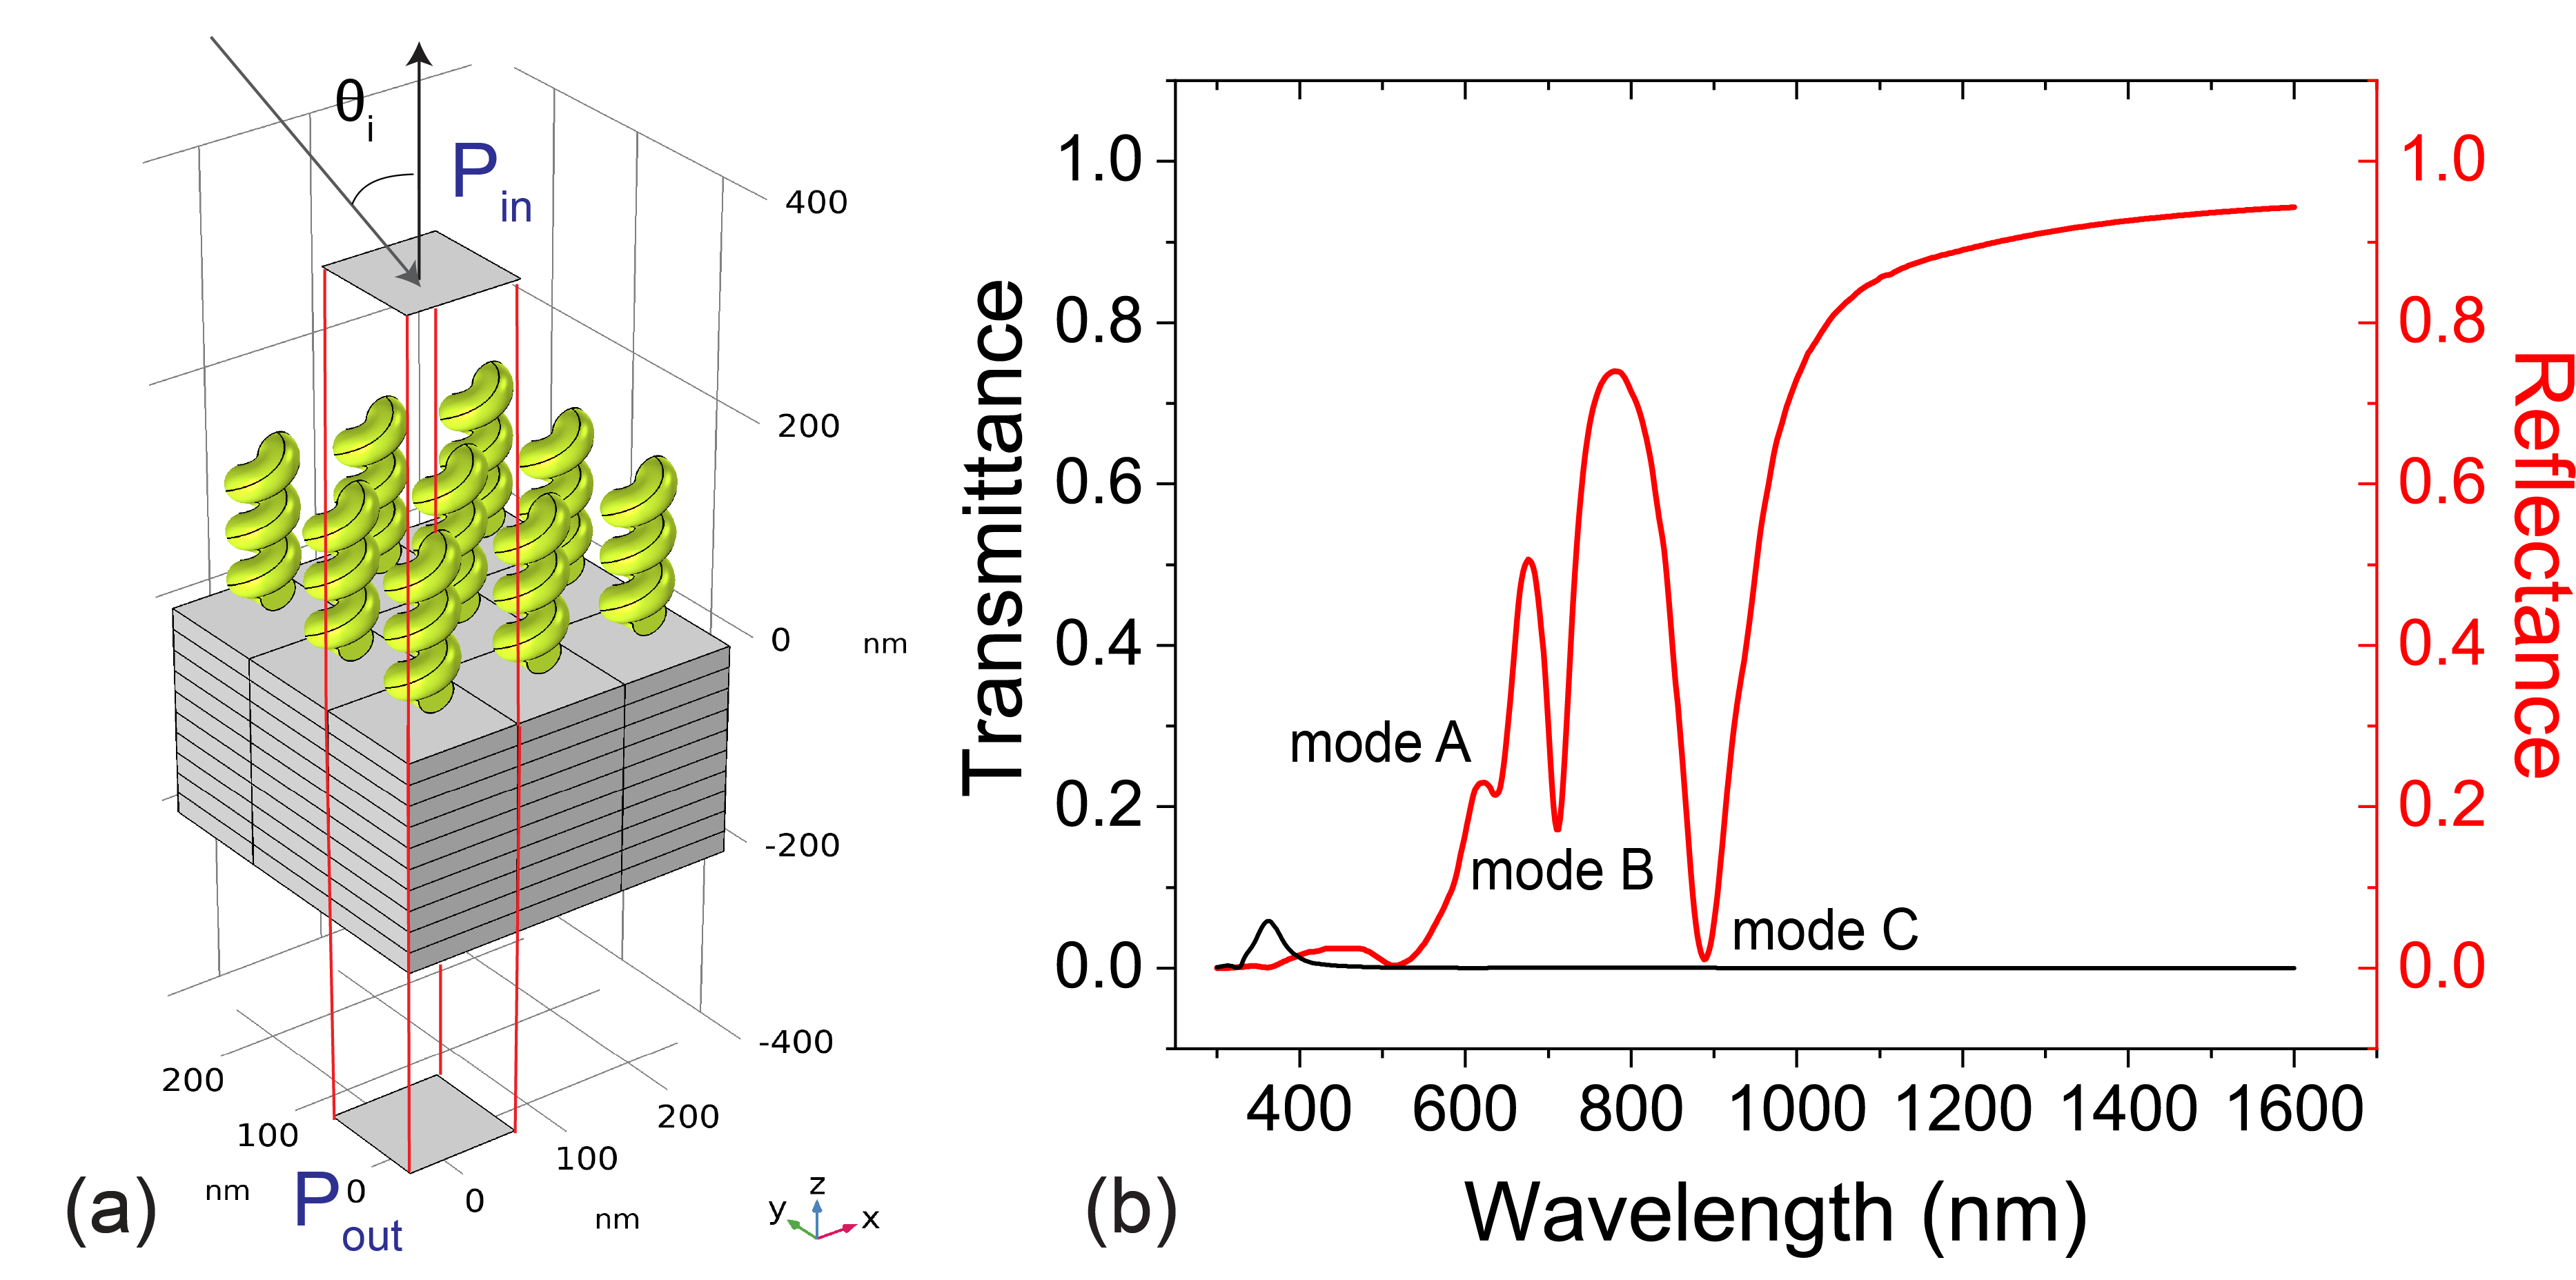
Here, an electromagnetic plane wave impinges on the combined system from the superstrate, with a specific incident angle () and polarization (s-polarization (TE) or p-polarization (TM)). Light interacting with the structure is then collected through both its substrate (typically glass) and superstrate, allowing to compute the optical quantities of interest (transmittance (T) and reflectance (R)).
This is done by solving the frequency-domain partial differential equation (PDE) that governs the and fields associated with the electromagnetic wave propagating through the structure:
| (1) |
In the condition of the electric conductivity and non-magnetic materials (), the previous equation reduces to:
| (2) |
Here is the incident wavevector in vacuum or air (), while represents the material dielectric permittivity. By providing as an input the values of real and imaginary parts of the refractive index of any considered material, the software retrieves the corresponding dielectric permittivity () and numerically solves Eq. 2 to obtain the field distribution. Scattering parameters (S-parameter) for transmittance () and reflectance () are computed (See Supporting information).
In order to simulate the behavior of TM and TE light in a 3D environment, it is necessary to properly write the components of the electromagnetic fields with respect to the incidence plane () and set the polarizations accordingly: for TM and for TE.26
As we can see in Figure 2b, the calculated transmittance for the CMH-HMM turns out to be zero in all the considered vis-NIR regions, while the reflectance spectrum, calculated for a TM and , is totally modified respect to the reflectance of the HMM and the Au helix array considered separately (see Figures 1b-1d). In particular, we can distinguish three reflectance minima at 635 nm (mode A), 710 nm (mode B) and 890 nm (mode C).
It is important to note that these reflectance dips are closely related to the geometrical and material properties of the designed CMH. In fact, considering an out-of-plane 3D pillars hypergrating characterized by the same sizes of the wire radius (), or the helix radius () it does not leads to comparable signals usable for sensing (see Supplementary materials).
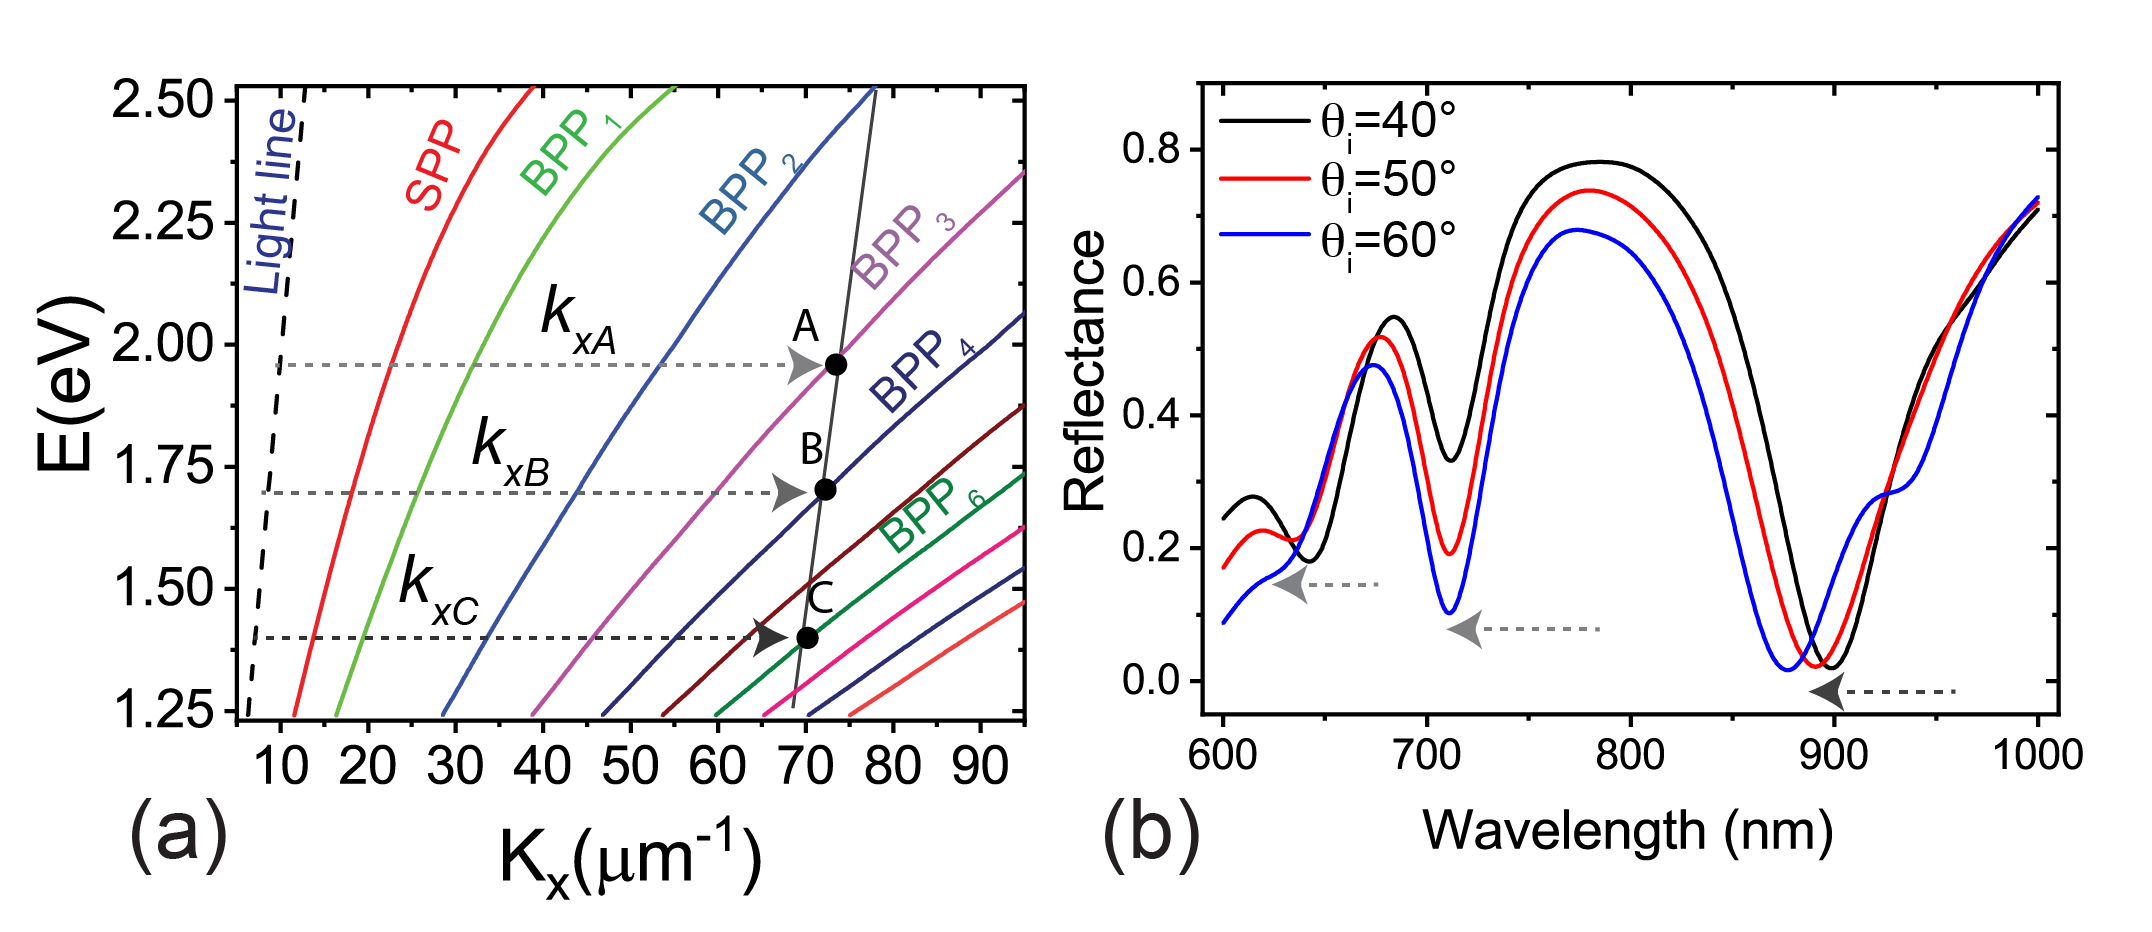
According to the grating coupling technique of surface plasmon excitation,27, 16 the surface plasmon modes can be excited when the wavevector of the grating diffraction orders are greater than that of the incident light. Under this condition, diffraction orders are no longer propagating waves, but evanescent field and the enhanced wavevector results to be responsible for the coupling of the incident light to the surface plasmon modes according to the coupling condition:28
| (3) |
where is the refractive index of the incident medium, is the vacuum wavevector, is the grating diffraction order and and are the incident grazing and azimuthal angle, respectively. is the grating wavevector, with the grating period, in our case corresponding to the the lattice constant . When , Eq. 3 results to be: . By using this equation we calculated the corresponding for our three modes: , and .
By considering the dispersion relations for the SPP and BPP modes given by:29
| (4) |
| (5) |
we can plot the SPP and BPP dispersion curves (Figure 3a) supported by the structure. In the above equations, , and , are the thickness and dielectric permittivity of the dielectric and metal, in our case ITO and Ag, respectively, while represents the order mode (=1,2,3…). In this plot it is possible to identify three points corresponding to the intersection between the component of modes A, B and C and the BPP modes of the structure, Figure 3a.
Since both surface and bulk plasmon mode excitation depends on the incident angle, we calculated the reflectance of the CMH-HMM for different angle of incidence (Figure 3b). We observed that there is a blue shift in the reflectance minima when the incident angle is increased. This is attributed to the variation in modal indices with incident angles.30
The reported data clearly show that the CMH can excite the BPP modes of the underneath hyperbolic metamaterial. These modes are expected to undergo a frequency shift as a function of the analytes concentration binding at the metasurface, defining the sensitivity of the sensing platform. To this end we use the experimental data of Koohyar et al.31 who tabulated the refractive index (RI) variations related to different molar fractions of aqueous solutions of methanol, ethanol, ethylene glycol, 1-propanol and 1, 2, 3-propantriol. In particular, we consider the data corresponding to the aqueous solution of 1, 2, 3-propantriol characterized by an ultra low molecular weight ( 60 Da).
Figure 4a shows the calculated reflection spectra of the CMH-HMM sensor in measuring 1, 2, 3-propantriol solutions with different concentrations. The shift of the resonances as a function of the different percentage of propantiol in the aqueous solution allows us to determine the sensitivity of the sensor. The reflectance minima (mode dips) shift towards longer wavelengths with the increase of RI, in the range , this last case corresponding to a molar fraction of of about 17% in the aqueous solution; the resonance wavelength shift () shows a linear behaviour with the RI change (), as reported in Figure 4b.
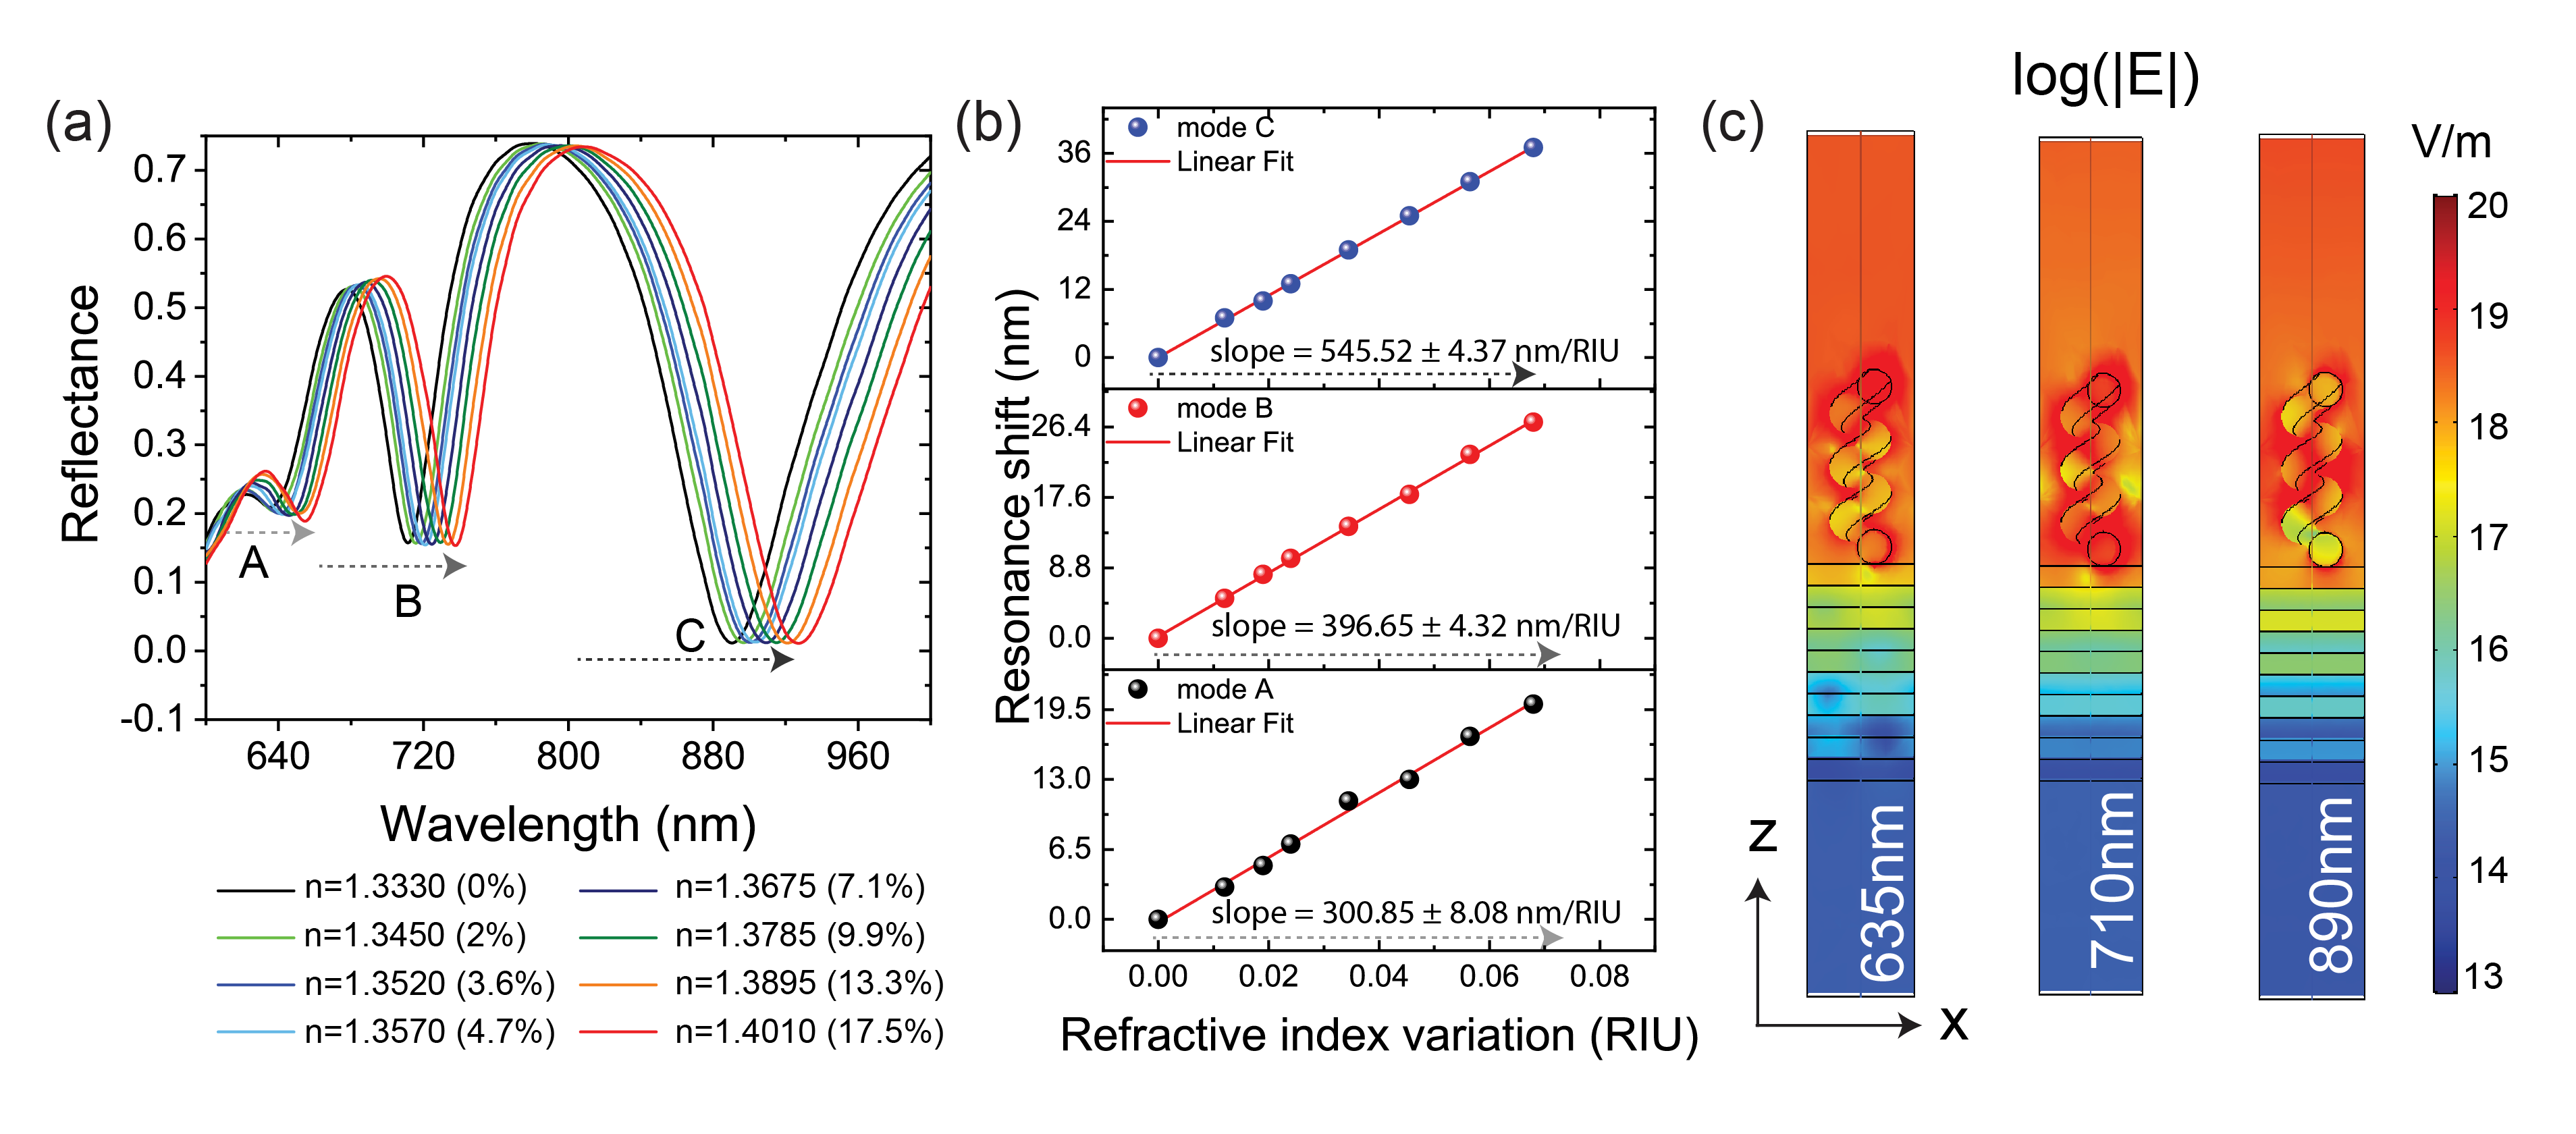
The spectral sensitivity of the sensor is defined as , where represents the change of the refractive index solution flowing on top of the sensor and the shift of the sensor resonance in .
In particular, =20 nm and =3.3 10-3 RIU/nm for the first mode A (635 nm), =26 nm and =2.5 10-3 RIU/nm for the second mode B (710 nm) and =37 nm and =1.8 10-3 RIU/nm for the third mode C (890 nm). The corresponding limit of detection (LOD), corresponding to the minimum RI variation that can be distinguished (shift of 1 nm) results to be equal to 0.0015. The difference in sensitivity for the three modes is related to their different . In particular, mode C is the one that shows the best result in terms of sensitivity respect to the other two modes, this is due to the highly confined field distributions on the superstrate at hyperbolic dispersion (Figure 4c) and to the fact that the transverse decay of the field in the HMM strongly varies from one mode to another.
Another important aspect related to the 3D hypergrating is represented by the significantly increase of the out-of-plane sensing surface, where the specific binding of the analytes occurs via functional groups immobilized in this specific case on a helical surface. At the same time, a chiral structure can modify the fluid dynamics around it, inducing an increase of the probability of a specific binding.
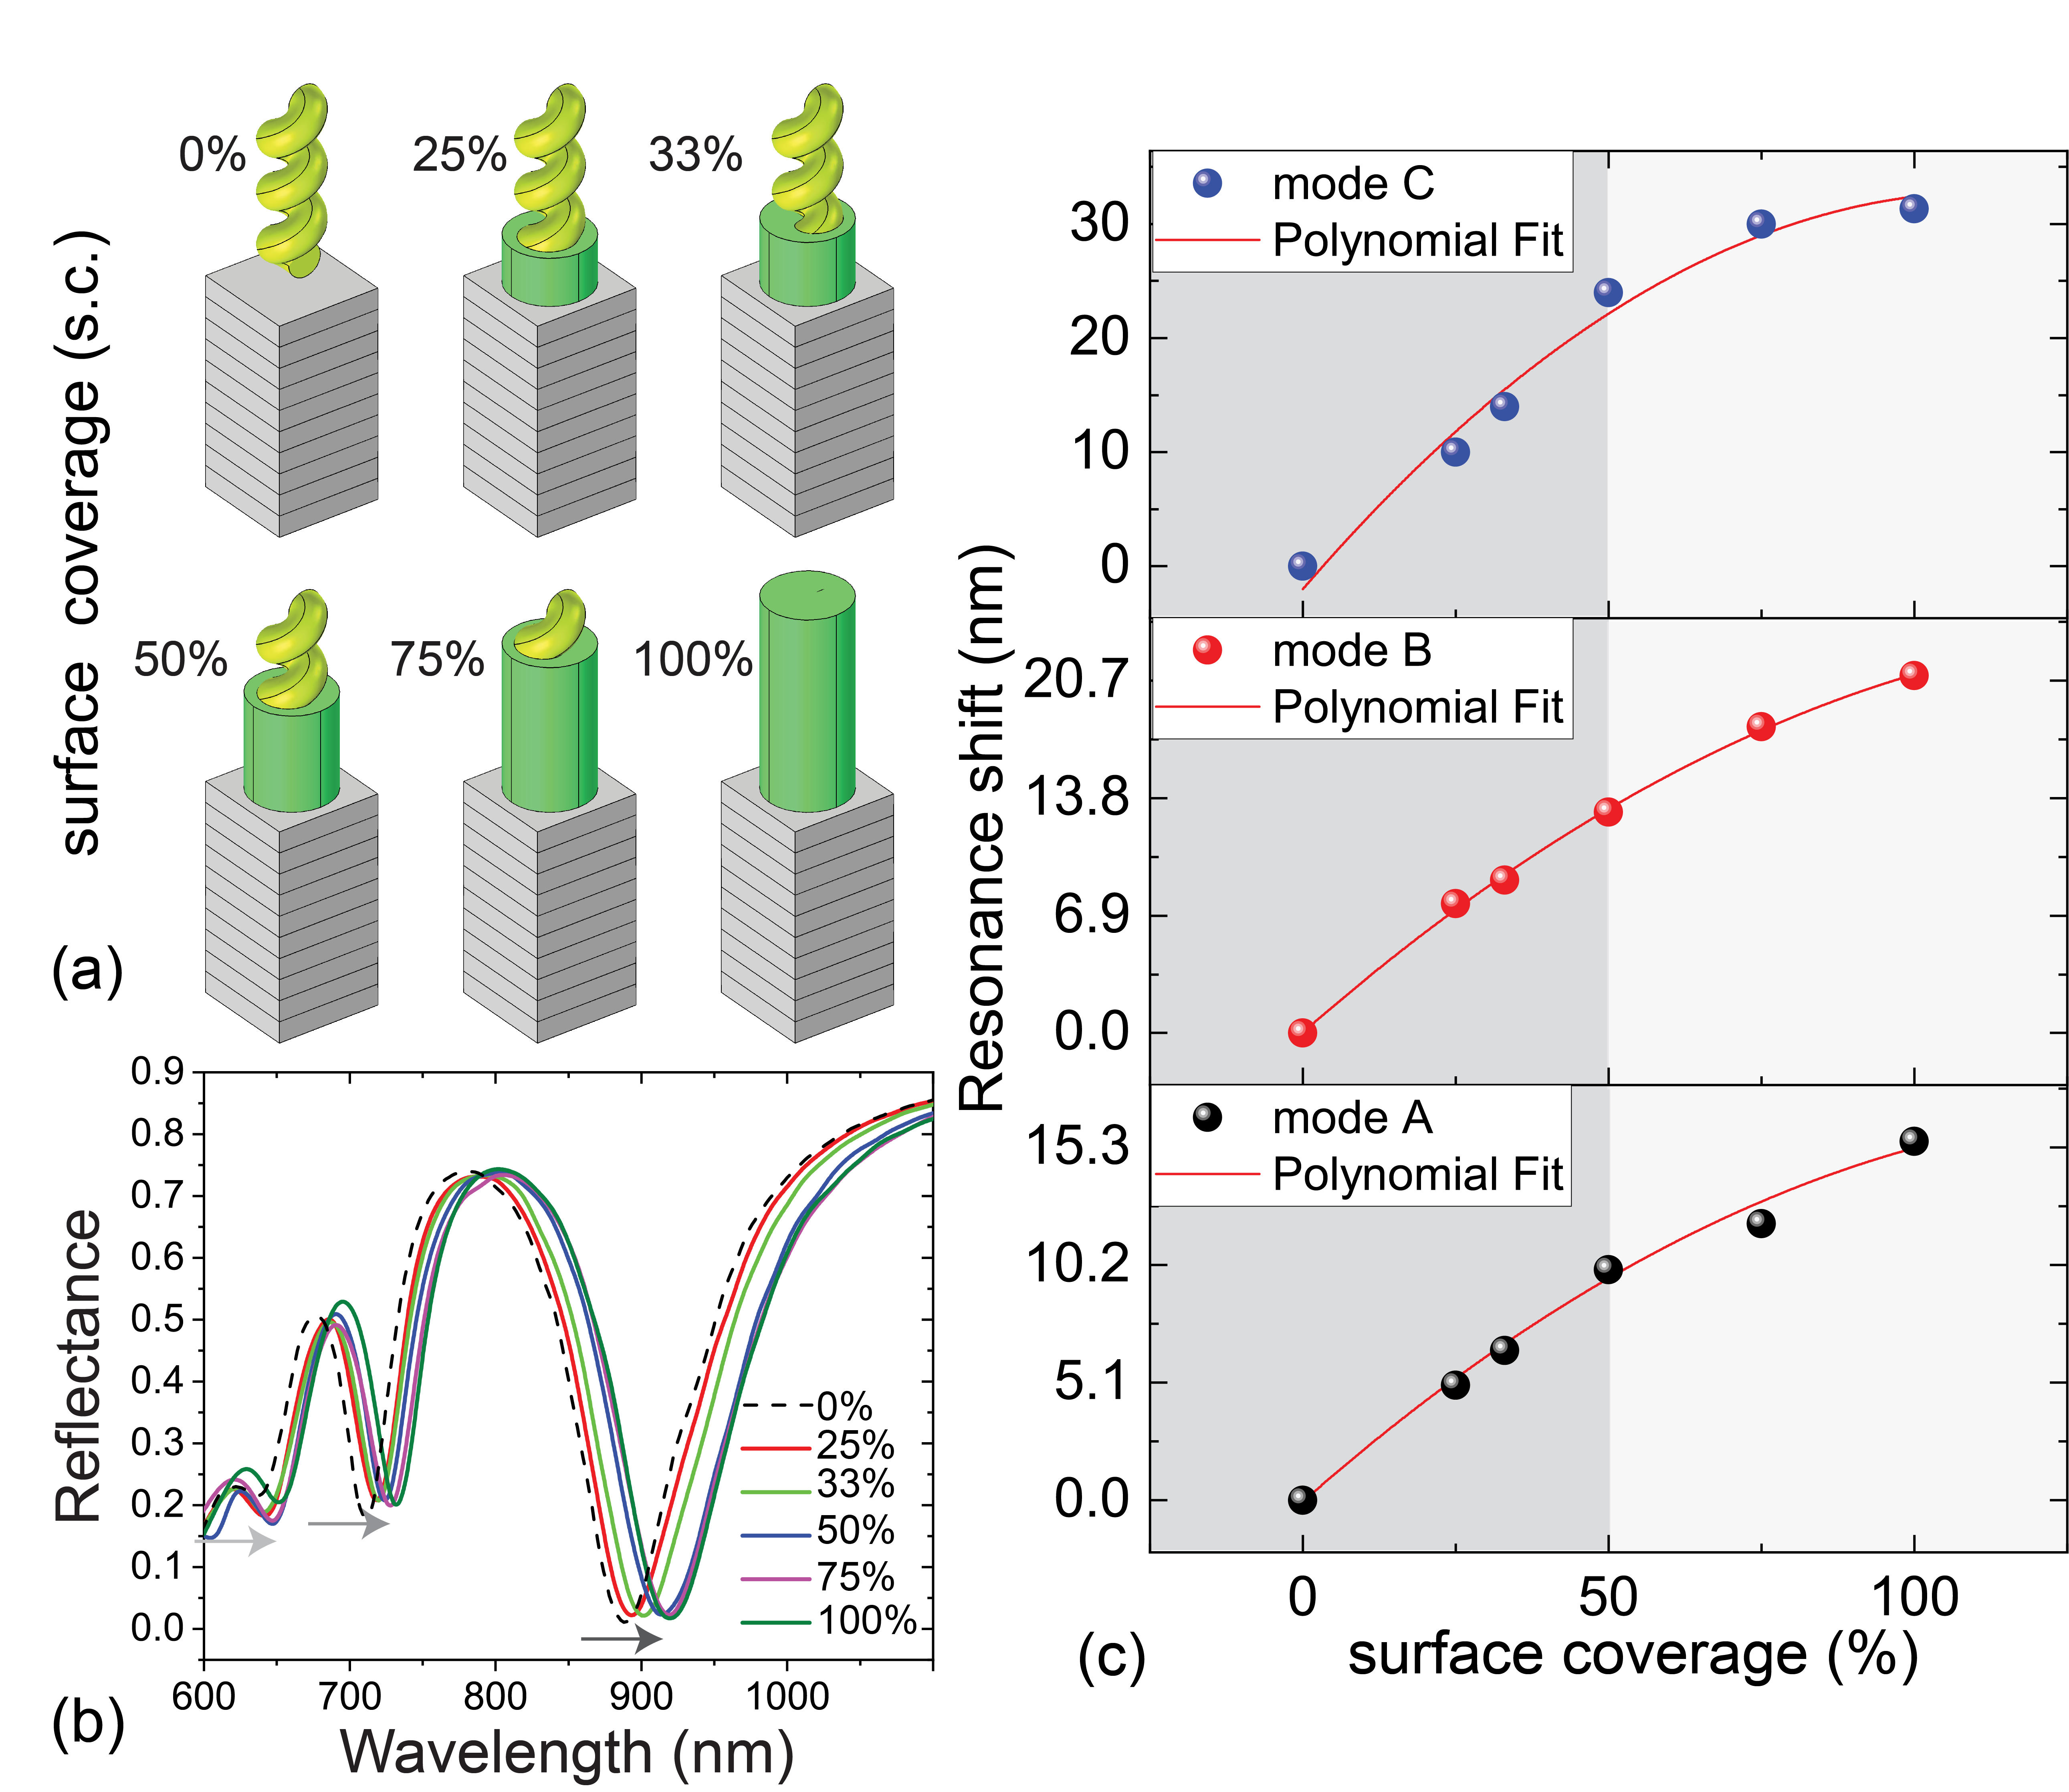
Clearly, the wavelength shift of BPP modes is strongly related to the quantity of molecules that bind selectively on the surface of the helices. To demonstrate this behavior numerically, we have considered different percentages of surface coverage of the helicoidal structures, starting from the HMM surface (Figure 5a), where the maximum variation of the considered refractive index (=0.0680) affects only particular regions around the helix. To this end, we have considered the two limiting cases: the 0% of surface coverage (s.c.) and the 100%, in which the whole surface of the helix is totally covered by molecules; in this last case we obtain the maximum shift of 31 nm for mode C, 21 nm for mode B and 15 nm for mode A. Then we considered four intermediate cases of partial s.c.: 25%, 33%, 50%, and 75% (Figure 5b). As we can see in Figure 5c the resonance wavelength shift of the helix/HMM modes shows a linear behaviour until 50% of surface coverage, once this value is exceeded the slope of the curve decreases, by showing that the sensitivity is decreasing too.
At the same time, it is possible to find the minimum percentage value, that in our case results to be equal to 16%, corresponding to the minimum surface coverage, necessary to have an appreciable shift of the modes. This leads to calculate the mass sensitivity, a key parameter used to describe the performance of a biosensor, that is strongly related to the surface coverage; for the considered system the mass sensitivity results equal to 0.04 (see Supplementary materials).
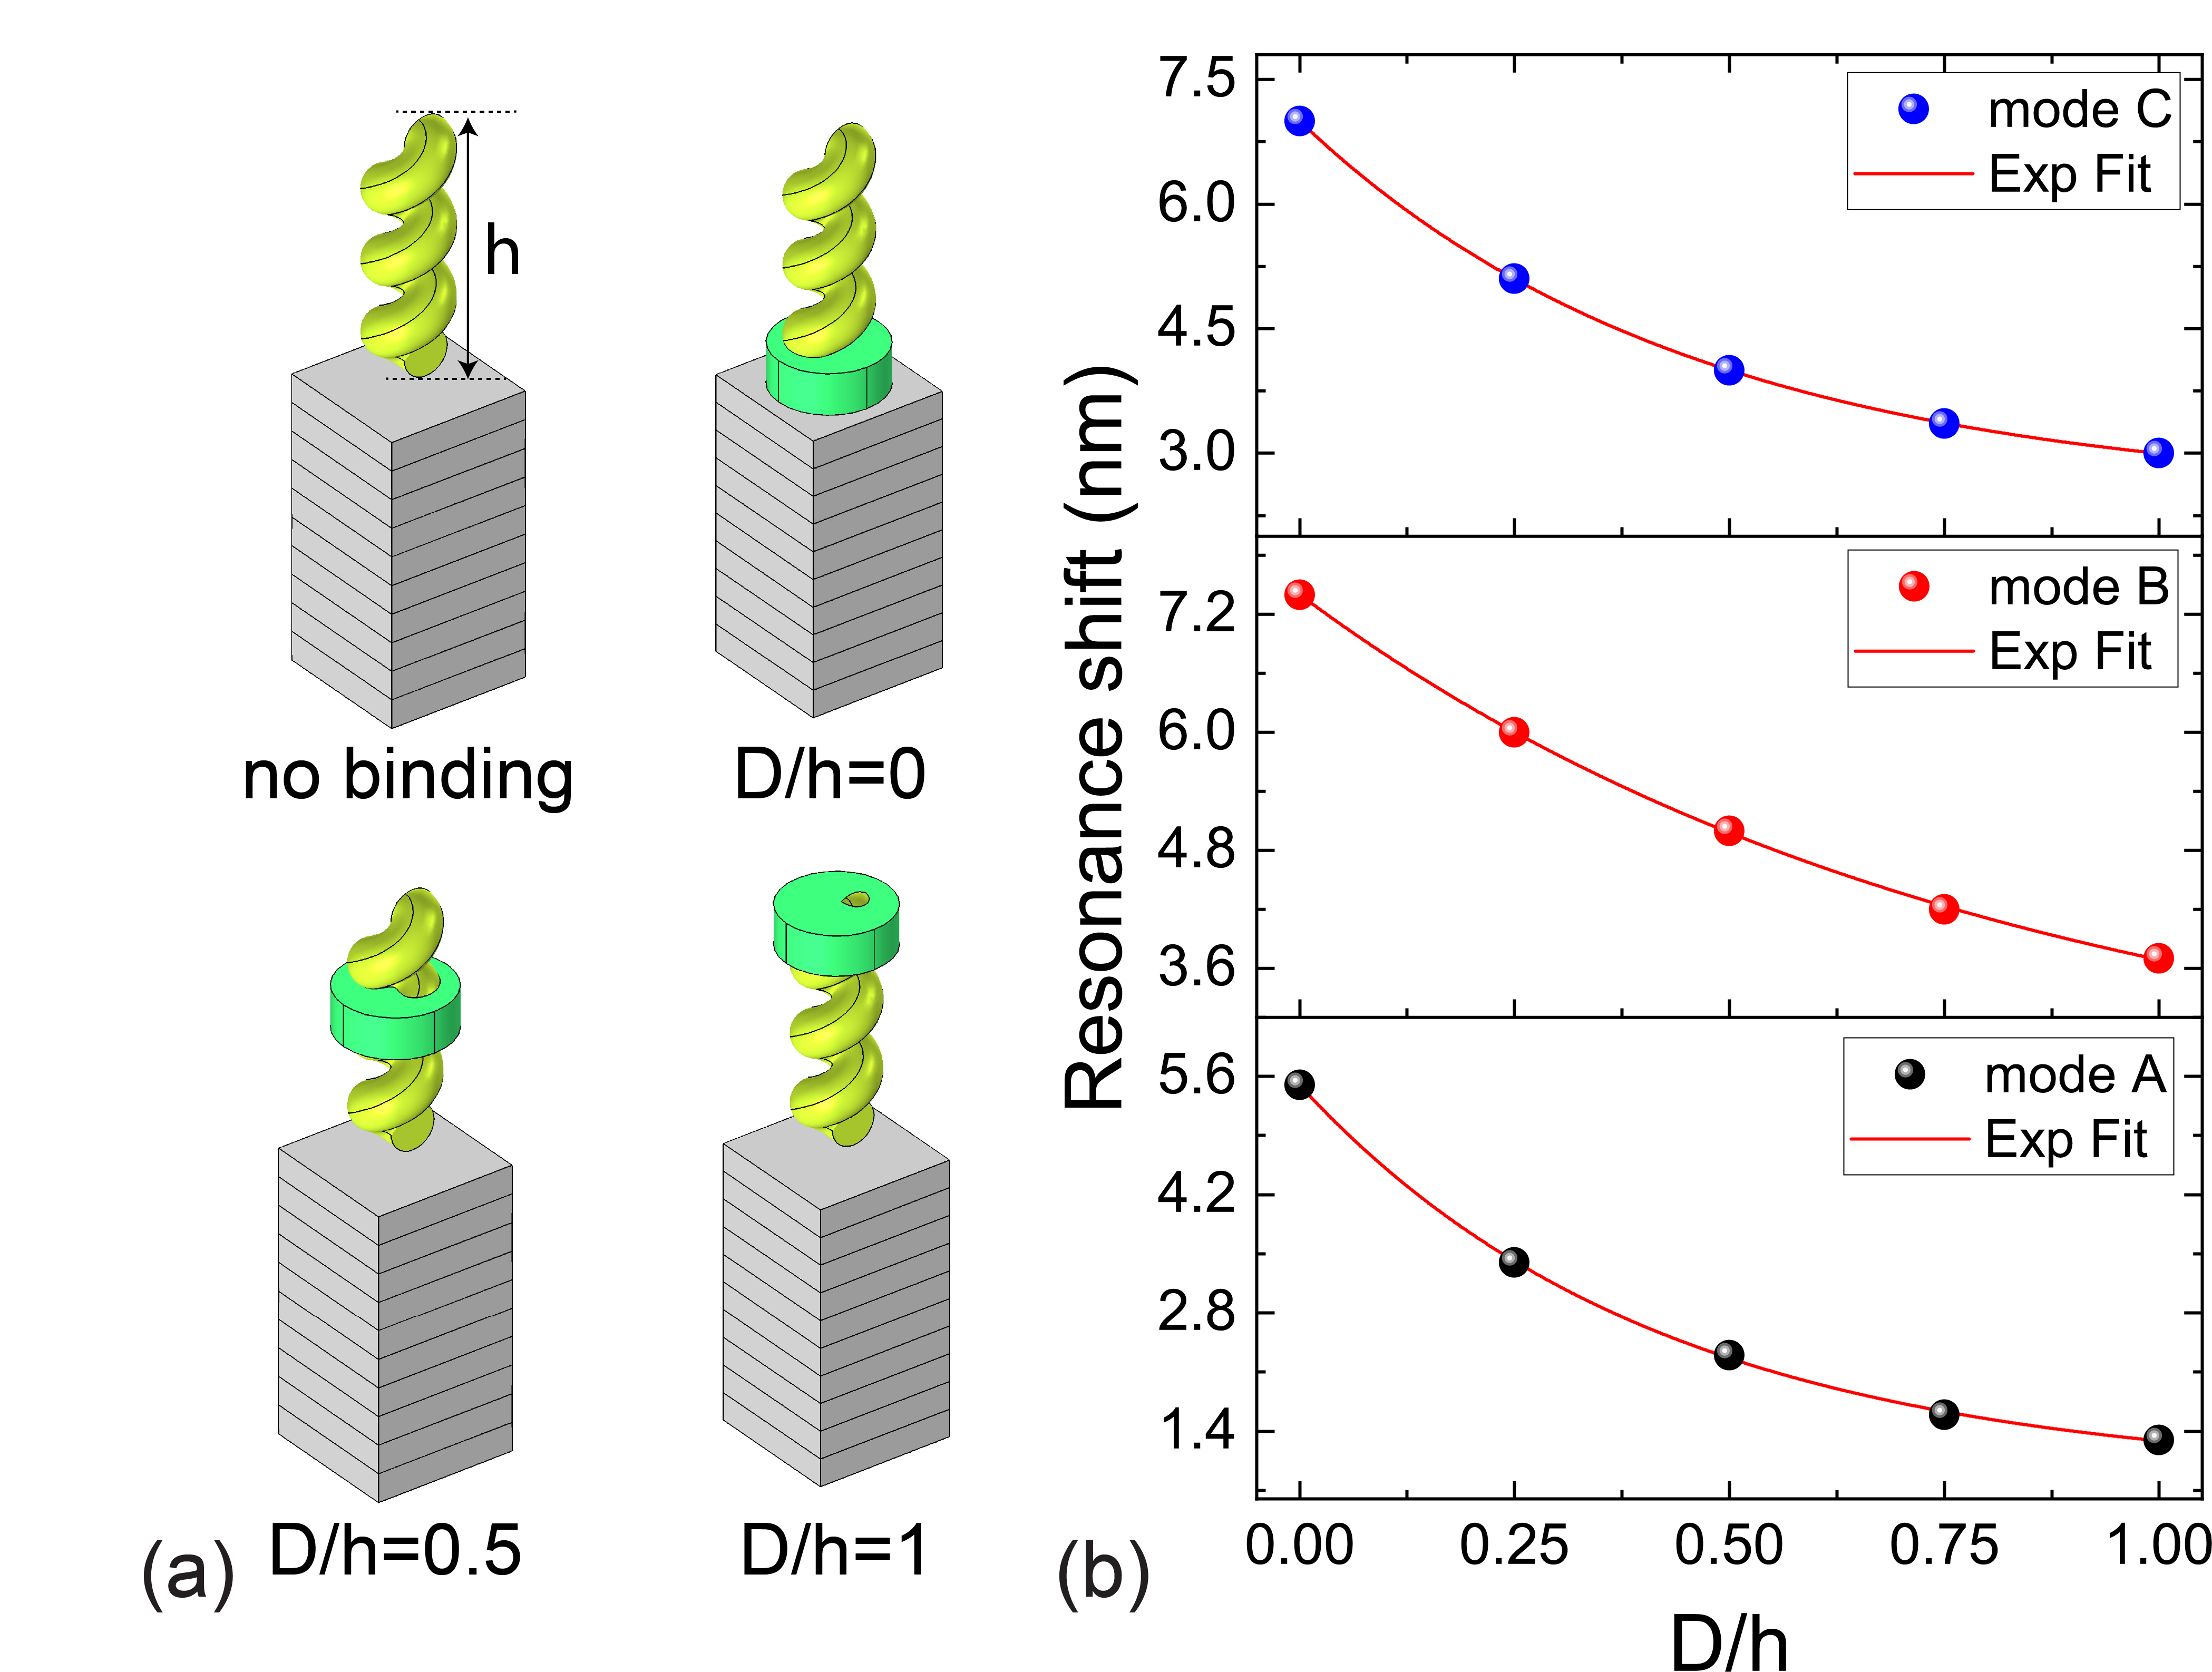
The last analysis is dedicated to investigate how the sensitivity changes as function of the relative surface coverage at different heights away from the HMM surface. In particular, it is possible to demonstrate that the local change of refractive index in a small disk surrounding the helix produces appreciable shifts even when the binding is confined exclusively in the upper region of the helix, which represents the maximum distance from the HMM. For this reason a small disk, with =1.401 and corresponding to an adsorbed surface of 20%, is positioned at different distance () respect to the surface of the HMM (Figure 6a). By plotting the resonance shift of the three modes A, B and C as a function of the distance normalized to the helix height () it is possible to see that the proposed biosensing platform is able to appreciate a shift of the considered modes even in the worst case (=1) of about 1.4 nm for the mode A, 3.6 nm for the mode B and 3.0 nm for the mode C, as reported in Figure 6b. It is interesting to note that the resonance shift decreases exponentially by moving away from the surface of the HMM. The corresponding sensitivity results to be 48.6 10-3RIU/nm for the mode A, 18.9 10-3RIU/nm for the mode B and 22.6 10-3RIU/nm for the mode C. These results demonstrate the strong sensing power of our innovative system to detect target analytes also away from the surface of the HMM exploiting the increased surface/volume ratio of the 3D CMH exposed to the analyte.
On the other hand, considering the intrinsic chirality of the nanohelices, CMH could excite new BPP modes of the HMM by coupling with their circular polarization-dependent plasmon modes. Indeed, as we can see in Figure 7a, for an angle of incidence of =75∘, different reflectance dips are obtained for left-handed circular polarized (LCP) and right-handed circular polarized (RCP) light. In particular, the reflectance dips obtained for LCP light, indicated in the figure as BPP3 to BPP6, are strongly related to a coupling between the plasmonic modes of the gold helix array and the HMM underneath. This can be verified through the intersection of the dispersion curves of the HMM with the wavelength corresponding to the reflectance dips that are expressed in terms of energy versus momentum and are indicated in the Figure 7b with the blue triangles. For LCP light, at these wavelengths, respectively: 597 nm, 713nm, 796 nm and 873 nm the electric field intensity |E| results to be confined between the helix antenna surface and the HMM layers - Figure 7c. A similar analysis could be carried out for RCP reflectance dips.
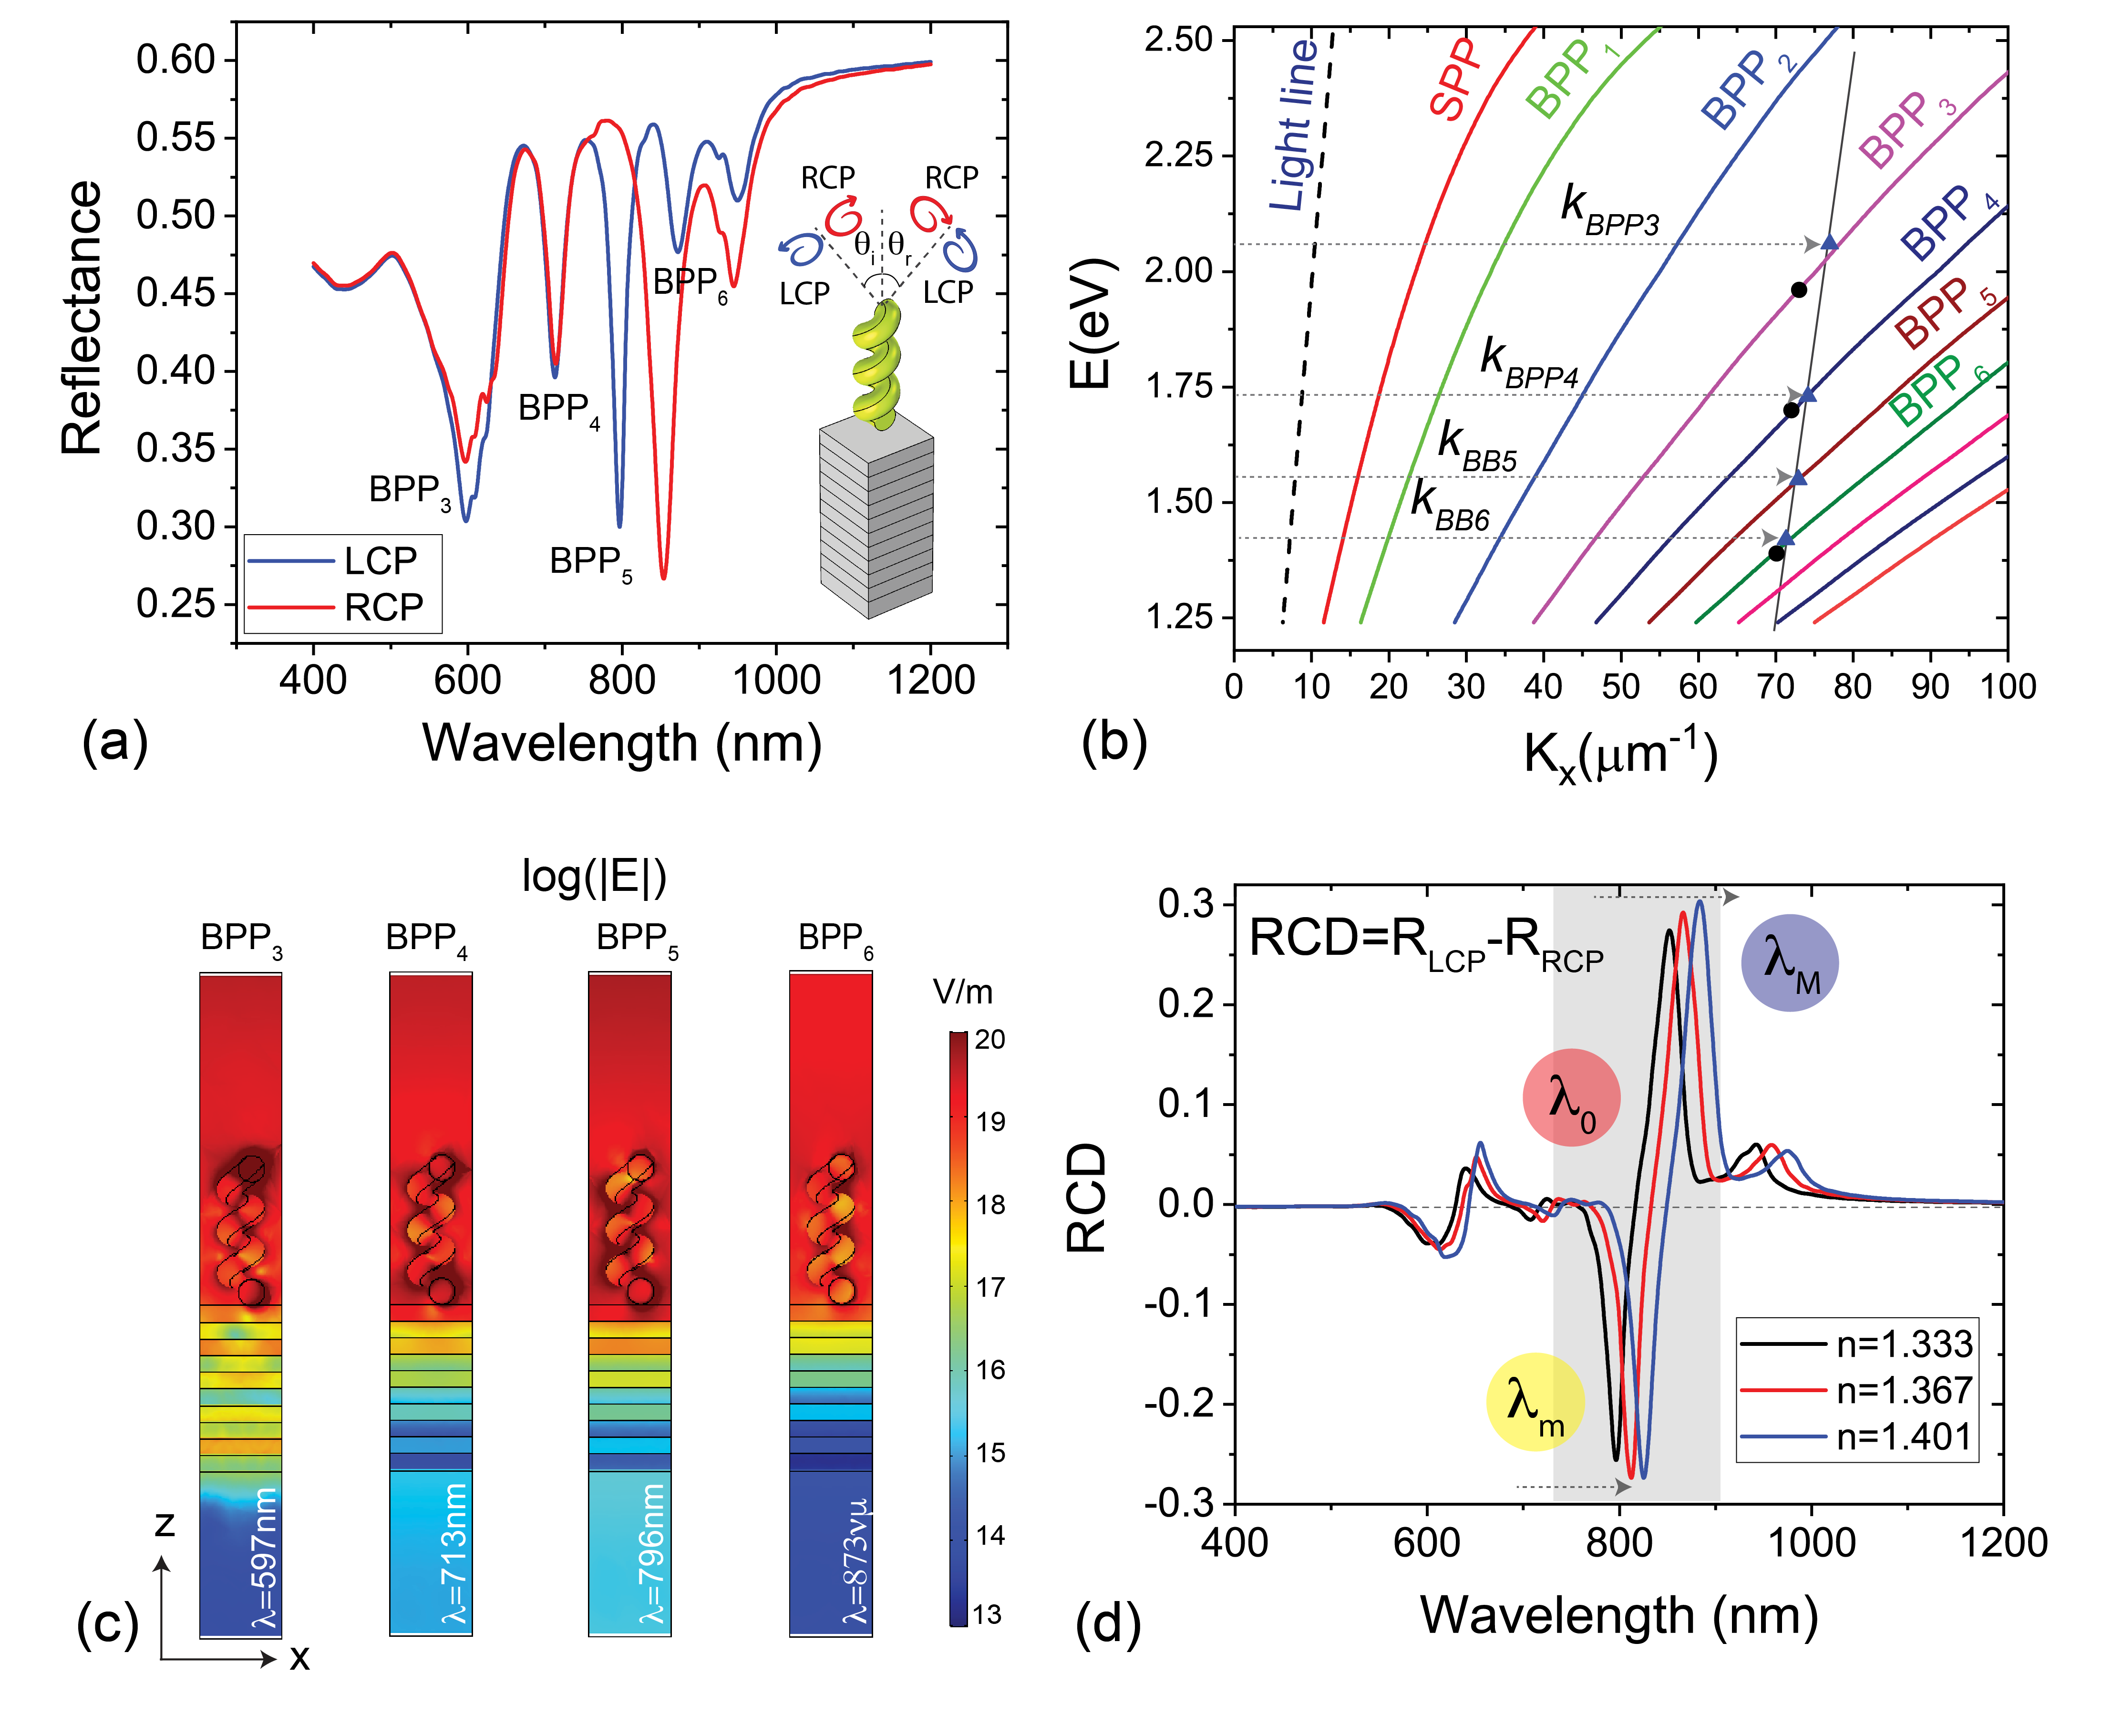
From the analysis of the chiroptical response of the CMH we can calculate the CD signal, typically riches of spectral signatures, such as bipolar peaks and crossing points, increasing the sensitivity and accuracy of the monitoring refractive index changes due to the analyte absorption. This sensing modality offers strong optical contrast even in the presence of highly achiral absorbing media, increasing the signal-to-noise CD measurements of a chiral analyte, an important consideration for use in complex biological media with limited transmission.32 For this purpose, the resulting reflectance curves obtained for LCP and RCP light, at =75∘ are used to calculate the reflectance circular dichroism (RCD) spectrum, which characterizes the reflectance difference between LCP and RCP light, leading to a RCD amplitude (RCD=RLCP-RRCP). As expected, the RCD spectra for the CMH-HMM exhibit multiple features: different maxima, minima and crossing points (Figure 7d). We have studied the RCD, as a function of the refractive indices variation between 1.333 and 1.401 (glycerol - water mixtures varying from 0 to 17.5% concentration - Figure 7d) to quantify the performance in terms of sensitivity and FOM of our sensor.
We can distinguish in the range 700-900 nm a minimum (), a crossing point () and a maximum () respectively at 797 nm, 816 nm and 852 nm which significantly shift and modify their intensity as the refractive index changes. These signals show a chiral plasmon sensitivity SCP= of 2.42 10-3RIU/nm for , 2.12 10-3RIU/nm for and 2.19 10-3RIU/nm for , respectively. After extracting the classical FWHM for the and modes and the FWHM in the |RCD| spectrum (see Supplementary materials) for , we have calculated the FOM,33 defined in our case as =, that resulted to be, respectively, equal to 18.72, 15.18 and 15.19, very high values if compared to previously reported results.
3 Conclusions
In this paper, we have numerically demonstrated how an out-of-plane chiral metasurface hypergrating can be used to excite the plasmonic modes of an underlying hyperbolic metamaterial with linearly and circularly polarized light. The electromagnetic modes resulting from the coupling between the CMH-HMM depend strongly on the material and geometrical parameters of the CMH-HMM. In our numerical study, we have demonstrated how the HMM BPPs modes can be used for the detection of ultra low molecular weight molecules ( 60 Da) with extremely low concentrations (mass sensitivity of 0.04 ) on the whole surface of the helices array. The CMH represents a new versatile way to couple circularly polarized light with the HMM, by exploiting the features of the reflectance circular dichroism (RCD) spectra, rich of signals that can be used to increase the processed data for the detection of analytes by the proposed biosensing platform.
This research has been supported by the "AIM: Attraction and International Mobility" - PON R&I 2014-2020 Calabria and "Progetto Tecnopolo per la Medicina di precisione, Deliberazione della Giunta Regionale n. 2117" Puglia. The authors thank the Area della Ricerca di Roma 2, Tor Vergata, for the access to the ICT Services (ARToV-CNR) for the use of the COMSOL Multiphysics Platform, Origin Lab and Matlab, and the Infrastructure BeyondNano (PONa3-00362) of CNR-Nanotec for the access to research instruments.
References
- Joosse and Pantel 2013 Joosse, S. A.; Pantel, K. Biologic challenges in the detection of circulating tumor cells. Cancer research 2013, 73, 8–11
- Palmirotta et al. 2018 Palmirotta, R.; Lovero, D.; Cafforio, P.; Felici, C.; Mannavola, F.; Pellè, E.; Quaresmini, D.; Tucci, M.; Silvestris, F. Liquid biopsy of cancer: a multimodal diagnostic tool in clinical oncology. Therapeutic advances in medical oncology 2018, 10, 1758835918794630
- Cohen et al. 2018 Cohen, J. D.; Li, L.; Wang, Y.; Thoburn, C.; Afsari, B.; Danilova, L.; Douville, C.; Javed, A. A.; Wong, F.; Mattox, A., et al. Detection and localization of surgically resectable cancers with a multi-analyte blood test. Science 2018, 359, 926–930
- Gorgannezhad et al. 2018 Gorgannezhad, L.; Umer, M.; Islam, M. N.; Nguyen, N.-T.; Shiddiky, M. J. Circulating tumor DNA and liquid biopsy: opportunities, challenges, and recent advances in detection technologies. Lab on a Chip 2018, 18, 1174–1196
- Mattox et al. 2019 Mattox, A. K.; Bettegowda, C.; Zhou, S.; Papadopoulos, N.; Kinzler, K. W.; Vogelstein, B. Applications of liquid biopsies for cancer. Science translational medicine 2019, 11, eaay1984
- Lim et al. 2019 Lim, S. B.; Di Lee, W.; Vasudevan, J.; Lim, W.-T.; Lim, C. T. Liquid biopsy: one cell at a time. NPJ precision oncology 2019, 3, 1–9
- Leca-Bouvier and Blum 2005 Leca-Bouvier, B.; Blum, L. J. Biosensors for protein detection: a review. Analytical Letters 2005, 38, 1491–1517
- Corrie et al. 2015 Corrie, S. R.; Coffey, J.; Islam, J.; Markey, K.; Kendall, M. Blood, sweat, and tears: developing clinically relevant protein biosensors for integrated body fluid analysis. Analyst 2015, 140, 4350–4364
- Sreekanth et al. 2016 Sreekanth, K. V.; Alapan, Y.; ElKabbash, M.; Ilker, E.; Hinczewski, M.; Gurkan, U. A.; De Luca, A.; Strangi, G. Extreme sensitivity biosensing platform based on hyperbolic metamaterials. Nature materials 2016, 15, 621
- Baqir et al. 2018 Baqir, M.; Farmani, A.; Fatima, T.; Raza, M.; Shaukat, S.; Mir, A. Nanoscale, tunable, and highly sensitive biosensor utilizing hyperbolic metamaterials in the near-infrared range. Applied optics 2018, 57, 9447–9454
- Sreekanth et al. 2016 Sreekanth, K. V.; Alapan, Y.; ElKabbash, M.; Wen, A. M.; Ilker, E.; Hinczewski, M.; Gurkan, U. A.; Steinmetz, N. F.; Strangi, G. Biosensing: Enhancing the Angular Sensitivity of Plasmonic Sensors Using Hyperbolic Metamaterials (Advanced Optical Materials 11/2016). Advanced Optical Materials 2016, 4, 1659–1659
- Poddubny et al. 2013 Poddubny, A.; Iorsh, I.; Belov, P.; Kivshar, Y. Hyperbolic metamaterials. Nature photonics 2013, 7, 948
- Ferrari et al. 2015 Ferrari, L.; Wu, C.; Lepage, D.; Zhang, X.; Liu, Z. Hyperbolic metamaterials and their applications. Progress in Quantum Electronics 2015, 40, 1–40
- Shekhar and Jacob 2014 Shekhar, P.; Jacob, Z. Strong coupling in hyperbolic metamaterials. Physical Review B 2014, 90, 045313
- Shekhar et al. 2014 Shekhar, P.; Atkinson, J.; Jacob, Z. Hyperbolic metamaterials: fundamentals and applications. Nano convergence 2014, 1, 14
- Sreekanth et al. 2013 Sreekanth, K. V.; De Luca, A.; Strangi, G. Experimental demonstration of surface and bulk plasmon polaritons in hypergratings. Scientific reports 2013, 3, 3291
- Choy 2015 Choy, T. C. Effective medium theory: principles and applications; Oxford University Press, 2015; Vol. 165
- Multiphysics 1998 Multiphysics, C. Introduction to COMSOL Multiphysics®. COMSOL Multiphysics, Burlington, MA, accessed Feb 1998, 9, 2018
- Caligiuri et al. 2016 Caligiuri, V.; Dhama, R.; Sreekanth, K.; Strangi, G.; De Luca, A. Dielectric singularity in hyperbolic metamaterials: the inversion point of coexisting anisotropies. Scientific reports 2016, 6, 20002
- Gansel et al. 2010 Gansel, J. K.; Wegener, M.; Burger, S.; Linden, S. Gold helix photonic metamaterials: a numerical parameter study. Optics express 2010, 18, 1059–1069
- Esposito et al. 2014 Esposito, M.; Tasco, V.; Todisco, F.; Benedetti, A.; Sanvitto, D.; Passaseo, A. Three dimensional chiral metamaterial nanospirals in the visible range by vertically compensated focused ion beam induced-deposition. Advanced Optical Materials 2014, 2, 154–161
- Mark et al. 2013 Mark, A. G.; Gibbs, J. G.; Lee, T.-C.; Fischer, P. Hybrid nanocolloids with programmed three-dimensional shape and material composition. Nature materials 2013, 12, 802
- Hawkeye and Brett 2007 Hawkeye, M. M.; Brett, M. J. Glancing angle deposition: Fabrication, properties, and applications of micro-and nanostructured thin films. Journal of Vacuum Science & Technology A: Vacuum, Surfaces, and Films 2007, 25, 1317–1335
- Robbie et al. 1996 Robbie, K.; Brett, M. J.; Lakhtakia, A. Chiral sculptured thin films. Nature 1996, 384, 616
- Zhao et al. 2003 Zhao, Y.; Ye, D.; Wang, G.-C.; Lu, T.-M. Designing nanostructures by glancing angle deposition. Nanotubes and Nanowires. 2003; pp 59–73
- Lio et al. 2019 Lio, G. E.; Palermo, G.; Caputo, R.; De Luca, A. A comprehensive optical analysis of nanoscale structures: from thin films to asymmetric nanocavities. RSC advances 2019, 9, 21429–21437
- Sambles et al. 1991 Sambles, J.; Bradbery, G.; Yang, F. Optical excitation of surface plasmons: an introduction. Contemporary physics 1991, 32, 173–183
- Barnes et al. 2004 Barnes, W. L.; Murray, W. A.; Dintinger, J.; Devaux, E.; Ebbesen, T. Surface plasmon polaritons and their role in the enhanced transmission of light through periodic arrays of subwavelength holes in a metal film. Physical review letters 2004, 92, 107401
- Avrutsky et al. 2007 Avrutsky, I.; Salakhutdinov, I.; Elser, J.; Podolskiy, V. Highly confined optical modes in nanoscale metal-dielectric multilayers. Physical Review B 2007, 75, 241402
- Fan et al. 2006 Fan, X.; Wang, G. P.; Lee, J. C. W.; Chan, C. All-angle broadband negative refraction of metal waveguide arrays in the visible range: theoretical analysis and numerical demonstration. Physical review letters 2006, 97, 073901
- Koohyar et al. 2012 Koohyar, F.; Kiani, F.; Sharifi, S.; Sharifirad, M.; Rahmanpour, S. H. Study on the change of refractive index on mixing, excess molar volume and viscosity deviation for aqueous solution of methanol, ethanol, ethylene glycol, 1-propanol and 1, 2, 3-propantriol at T= 292.15 K and atmospheric pressure. Research Journal of Applied Sciences, Engineering and Technology 2012, 4, 3095–3101
- Jeong et al. 2016 Jeong, H.-H.; Mark, A. G.; Alarcón-Correa, M.; Kim, I.; Oswald, P.; Lee, T.-C.; Fischer, P. Dispersion and shape engineered plasmonic nanosensors. Nature communications 2016, 7, 11331
- Mayer and Hafner 2011 Mayer, K. M.; Hafner, J. H. Localized surface plasmon resonance sensors. Chemical reviews 2011, 111, 3828–3857
Contents:
-
•
Electric permittivity of the HMM calculated by means of the effective medium theory
-
•
Equations for Scattering parameters and
-
•
Meshed geometry
-
•
Unchiral hypergratings
-
•
Calculation of the mass sensitivity
-
•
Detailed plots for the FOM calculation