1: Kavli Institute for Cosmological Physics, University of Chicago, Chicago, IL 60637, USA.
2: High-Energy Physics Division, Argonne National Laboratory, Argonne, IL 60439, USA
3: Jet Propulsion Laboratory, Pasadena, CA 91109, USA
4: California Institute of Technology, Pasadena, CA 91125, USA
5: Department of Physics and Atmospheric Science, Dalhousie University, Halifax NS B3H 1A6, Canada
6: School of Physics & Astronomy, Cardiff University, Cardiff CF24 3AA, UK
7: Center for Astrophysics and Space Astronomy, University of Colorado Boulder, Boulder, CO 80309, USA
8: School of Earth and Space Exploration, Arizona State University, Tempe, AZ 85287, USA
9: Harvard-Smithsonian Center for Astrophysics, Cambridge, MA 02138
Full-Array Noise Performance of Deployment-Grade SuperSpec mm-wave On-Chip Spectrometers
Abstract
SuperSpec is an on-chip filter-bank spectrometer designed for wideband moderate-resolution spectroscopy at millimeter wavelengths, employing TiN kinetic inductance detectors. SuperSpec technology will enable large-format spectroscopic integral field units suitable for high-redshift line intensity mapping and multi-object spectrographs. In previous results we have demonstrated noise performance in individual detectors suitable for photon noise limited ground-based observations at excellent mm-wave sites. In these proceedings we present the noise performance of a full spectrometer measured using deployment-ready RF hardware and software. We report typical noise equivalent powers through the full device of W Hz-1/2 at expected sky loadings, which are photon noise dominated. Based on these results, we plan to deploy a six-spectrometer demonstration instrument to the Large Millimeter Telescope in early 2020.
Keywords:
Kinetic inductance detectors, spectrometer, NEP, SuperSpec, Large Millimeter Telescope, ROACH21 Introduction
Spectroscopy at millimeter wavelengths is a unique probe of the early Universe. High-redshift star-forming galaxies emit most of their energy in the infrared due to dust absorption of optical/UV radiation from young stars1. In addition to dust continuum, this radiation also excites far-IR line emission such as the CO rotational ladder and the [CII] ionized carbon fine structure transition. Detecting these lines—which for high- galaxies are redshifted into the mm atmospheric window and observable from the ground—enables precise determination of a galaxy’s redshift and unique understanding of its astrophysical properties.
While detections have been made with ALMA2, its modest bandwidth and narrow field of view preclude it from efficiently surveying large numbers of galaxies. A large-scale instrument with moderate mm-wave spectral resolution and hundreds of detectors would be an invaluable complement to ALMA’s individual, deep spectra. Science goals such as understanding the global star formation rate and molecular gas content as a function of cosmic time would be enabled with a steered multi-object spectrograph. Since galaxies also trace the underlying dark matter, their spatial distribution probes cosmology and would be accessible with an integral field spectrometer performing line intensity mapping3 of CO and [CII]. Intensity mapping experiments with filled focal planes could constrain the expansion history4 or primordial non-Gaussianity to higher precision than galaxy surveys by extending the available cosmological volume from up to the Epoch of Reionization ().
SuperSpec is designed to enable the next generation of large-format mm-wave spectroscopic surveys. In our device a mm-wave filter bank spectrometer patterned on a few-square-cm silicon chip provides the favorable attributes of a diffraction grating spectrometer—wide instantaneous bandwidth and background-limited sensitivity—but in a package which is orders of magnitude smaller. The design can be scaled up to hundreds or thousands of spectrometers on modestly-sized instruments, potentially enabling an increase in sensitivity similar to that experienced by recent cosmic microwave background experiments. The natural multiplexing capability of kinetic inductance detectors (KIDs) enables the high detector counts necessary for these instruments. Several other projects are pursuing similar approaches, including the DESHIMA on-chip filter bank5, the Micro-Spec on-chip grating spectrometer6, and the WSPEC waveguide filter bank 7.
In previous publications we have described the spectrometer design, filter performance, and noise characteristics for individual spectrometer channels suitable for excellent mm-wave observing sites8, 9, 10. We plan to deploy a demonstration instrument to the 50-m Large Millimeter Telescope11 (LMT) in early 2020. This instrument will feature six individual SuperSpec devices, configured as three dual-polarization beams on the sky. In these proceedings, we present the noise performance of a full SuperSpec device in deployment configuration, i.e., with the readout RF hardware and software that we plan to use at the LMT, and with optical loading similar to on-sky values. The device tested is a 50-channel spectrometer fully covering 255–278 GHz. In Section 2 we describe the device, optical setup, and readout configuration. Measurement results including full-device noise equivalent power (NEP) are presented in Section 3, and we conclude in Section 4.
2 Experimental Setup
In preparation for deployment to the LMT, we characterized a deployment-grade SuperSpec device in several configurations, including one designed to match astronomical observations. Here we describe the device and experimental setups.
2.1 SuperSpec Device and Optical Configurations
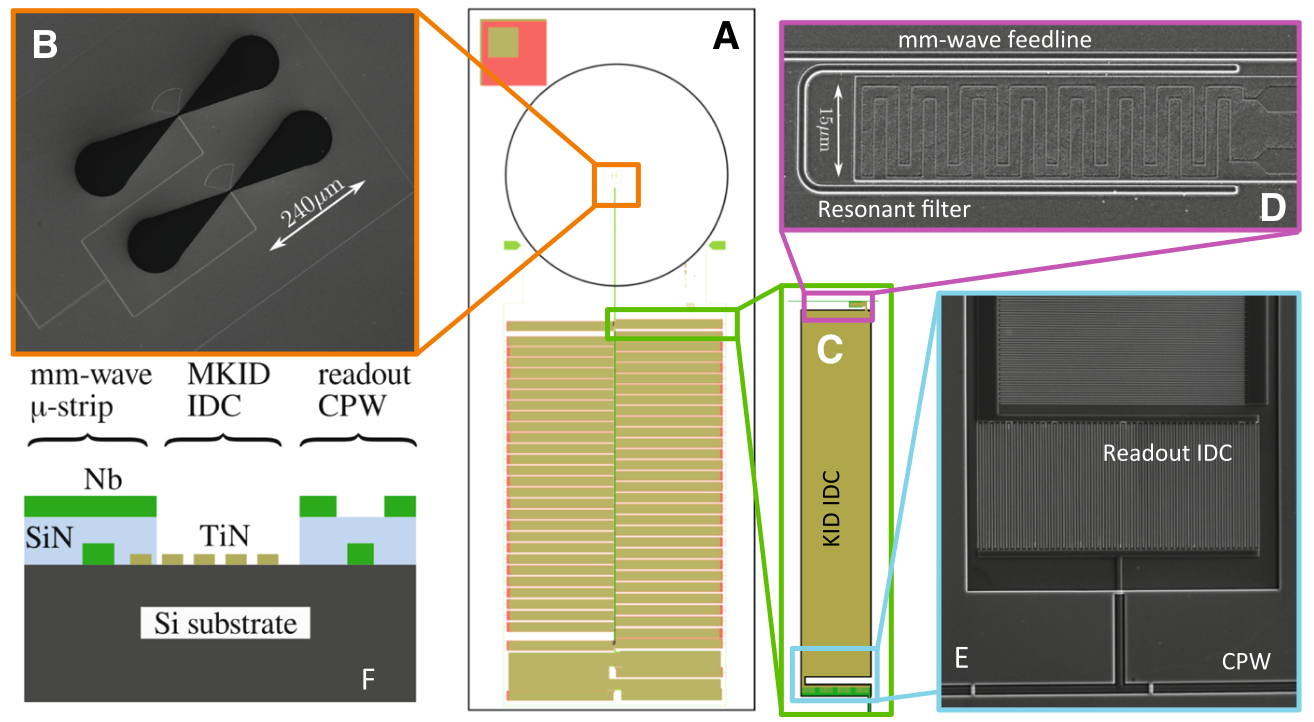
We tested a 3rd-generation SuperSpec device: a 50-channel spectrometer with resolving power , spanning 255–278 GHz and illustrated in Fig. 19, 10. Radiation incident on the device is first focused by an anti-reflection coated hyperhemispherical silicon lenslet. It is then coupled to microstrip using a dual bow-tie slot antenna, which achieves the requisite wide bandwidth. Traveling down the feedline, the mm-wave radiation is proximity coupled to a series of tuned filters, decreasing in frequency. The currents in these filters couple to the inductor of a TiN KID. Finally, the KID resonator circuit (with microwave frequencies from 80–160 MHz) is coupled to the coplanar waveguide readout line using an interdigitated capacitor. The tested device has been re-etched to separate 6 pairs of resonators that were previously collided12 (separated by less than 5 linewidths). The typical is K. The device was held at a base temperature of 230 mK, achievable with a standard 4He-3He-3He sorption refrigerator.
A swept coherent source was used to measure the millimeter-wave filter bank at high spectral resolution. The 220–330 GHz source, consisting of a commercial amplifier/multiplier chain, was coupled to a feed horn and radiated directly into the optical cryostat 13. For noise measurements, a low-loading environment was used to simulate observing at the LMT. Using historical precipitable water vapor values measured on-site14 we calculated the expected loading incident on the device lens (using the zenith temperature predicted by the am atmospheric model15, the measured mirror surface roughness, and other estimates of illumination efficiency). In typical conditions we will likely see pW of loading incident on the lenslet, depending on the detector bandwidth. We therefore used a cryogenic blackbody load, which filled the beam emerging from the lenslet. The load was coupled to the 4 K stage of the pulse tube cooler, and had a temperature variable up to 60 K ( pW).
2.2 RF Chain and Readout
The device is read out with a ROACH2-based system using firmware that was originally developed for the BLAST-TNG experiment16. A comb of resonant frequencies is used to synthesize a waveform which is output from the ROACH2 FPGA to a MUSIC ADC/DAC board. The baseband frequencies range from MHz. The DAC output is then mixed with a local oscillator (LO) to the KID frequencies. We drive the KIDs at the optimal power (typically 0.5–1 dB below bifurcation, which varies by dB across the filter bank) by adjusting the individual tone powers in the DAC waveform and using a variable attenuator at the cryostat input. After interacting with the detectors, a low-noise amplifier at 4K amplifies the signal by 40 dB. Upon exiting the cryostat, another variable attenuator is used to keep the output signal within the full-scale range of the ADC. The signal is then demodulated using a copy of the LO signal. The now-baseband frequencies are finally digitized by the ADC. The firmware filters, Fourier transforms, digitally down-converts, downsamples, and packetizes the and timestreams. The downsampled data can be saved at a maximum rate of 488 Hz. For our scan strategy, which will use a chopping mirror operating at a few Hz, we may downsample further.
To control the ROACH2 boards and RF hardware, we have developed a Python-based software suite called pcp (Python control program). pcp contains the functionality to perform frequency sweeps, adjust and fine-tune probe tone frequencies, optimize readout power levels, start and stop data streaming, and live-stream detector timestreams along with auxiliary data (such as telescope pointing or chopping mirror position). All six ROACH2 boards are controllable simultaneously, and depending on the range of readout frequencies may use a single or multiple LOs. The noise data in Section 3 were taken with pcp.
3 Measurement Results
3.1 Filter Bank, Resonant Frequencies, and Responsivity
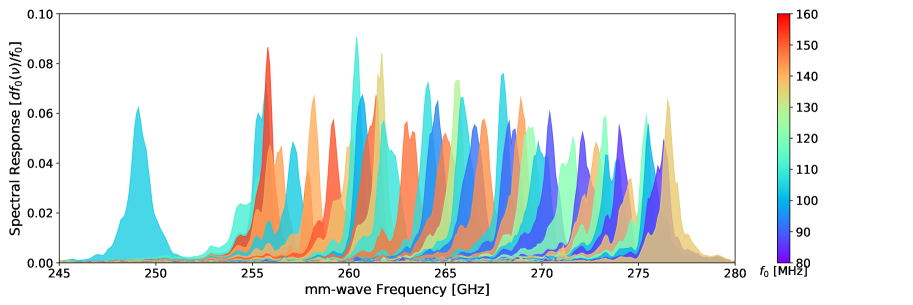
Spectral profiles of the 50-channel device are shown in Fig. 2, measured by sweeping the coherent source across the bandwidth of the filter bank. The typical FWHM of these Lorentzian profiles is GHz, as expected for the filter bank. Profiles are colored by microwave readout frequency , which range from 80–160 MHz. Note that by design, resonators with similar mm-wave response are widely spaced out in readout frequency8.
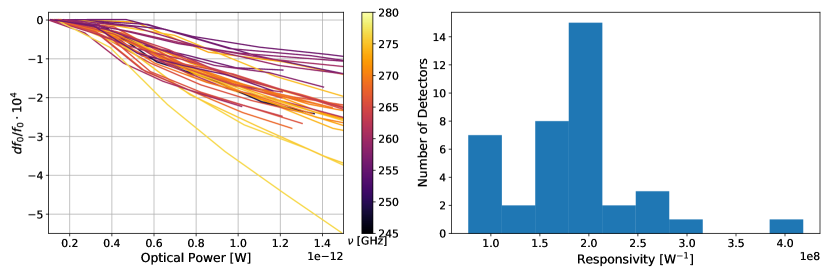
Responsivity to an optical load was determined by measuring the shift in resonant frequency as the cryogenic blackbody load temperature was varied. The power incident on the device was calculated as . accounts for optical filters between the device and the blackbody; their combined transmission spectrum is flat to within several percent across the 255–278 GHz band. The bandwidth is determined directly from the filter profiles , shown in Fig. 2, as . The typical bandwidth is GHz. Fig. 3 shows the fractional frequency shift vs. load for each operational KID, colored by mm-wave frequency. Dark KIDs—i.e., those not coupled through the filter bank—exhibited nonzero response to the blackbody ( of the typical filter bank KID response), which was subtracted from the optical devices assuming constant responsivity across the tested power range. The mean responsivity is W-1, where the error indicates the typical KID-to-KID variation and not measurement uncertainty. While in a previous publication we reported a detector-only responsivity referenced to power absorbed at the KID17, this full-device responsivity is referenced to power incident on the lens and includes losses in the lens, antenna, and filter bank.
3.2 Power Spectral Densities and Noise Equivalent Power
Noise performance in conditions similar to those at the LMT was measured using deployment-grade RF hardware and pcp. At two cryogenic blackbody temperatures corresponding to realistic sky loadings (0.7 and 1.2 pW for the average KID), we tuned tone frequencies and readout powers using pcp’s automated routines and then recorded detector timestreams at the full 488 Hz data rate. Previously we have shown that added noise from the readout system is negligible when the detectors are on-resonance12. There was non-negligible response to the pulse tube cooler at 1.4 Hz, which was notch-filtered from the timestreams.
Fractional frequency power spectral densities (PSDs) for all channels are shown in Fig. 4 at the two optical loadings. There is common-mode noise across all detectors on long timescales ( knee at Hz), which is dominated by temperature drifts from the PID loop holding the device at 230 mK. Performing a principal component analysis to remove correlated noise reduces this to Hz and softens the slope (Fig. 4 green curves); the white noise level changes by only . At the LMT we plan to observe by chopping on and off source with a mirror at Hz, well into the white noise regime of the KIDs.
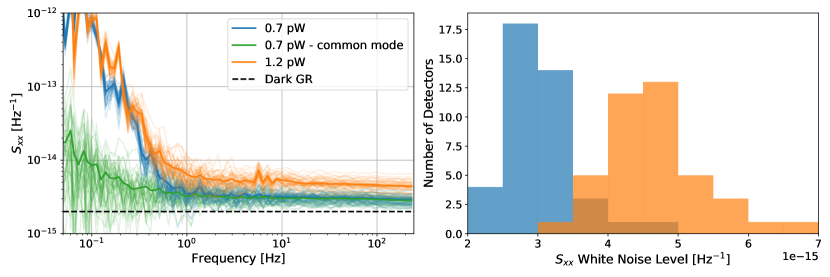
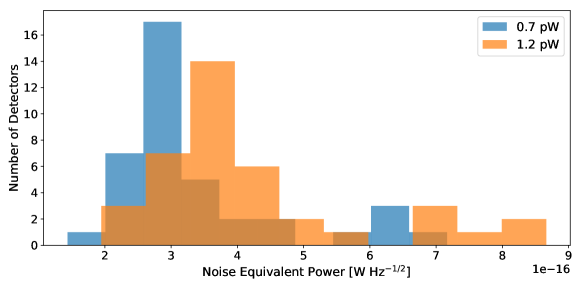
In previous testing of the same device we measured the noise in a dark environment to be Hz-1 for the average channel, which is consistent with being dominated by generation-recombination (GR) noise12. Here, we see that the addition of an optical load leads to an increment over this value (shown with a dashed black line in Fig. 4) that is proportional to the load. Converting to noise equivalent power (NEP) with , where is calculated as the average of the white-noise regime of the PSDs ( Hz), we obtain the distributions in Fig 5. The array means are W Hz-1/2 and W Hz-1/2 for 0.7 and 1.2 pW, respectively.
Modeling the measured NEP as the sum of the dark GR noise and photon noise, i.e., , we obtain averages of W Hz-1/2 for 0.7 pW and W Hz-1/2 for 1.2 pW. Comparing to the theoretical expectation for photon noise at these loadings and accounting for a power-dependent recombination term in the photon NEP, the optical efficiencies are 9% and 10%—consistent with our simulations for a single detector in this filter bank (note that at any one frequency, oversampling of spectral profiles ensures that the total efficiency is much higher). However, given the number of assumptions (e.g., that of a beam-filling load) there is substantial uncertainty on these estimates. In this loading range the photon contribution overtakes the GR component; therefore, at higher loadings the device is photon noise dominated. We again note that these full-device responsivities, NEPs, and efficiencies are referenced to power incident on the device lens (but not outside the cryostat). They include losses from the lens, antenna, and filter bank, and are not directly comparable to the detector-only values reported in other publications17 which are referenced to power absorbed at the KID.
4 Conclusions and Future Outlook
Using deployment-grade RF and readout hardware, we report full-device NEPs of W Hz-1/2 for our 50-channel, filter bank spectrometer when the device lens is illuminated with optical loads typical of those that we will experience at the LMT. Most NEPs are clustered to within 20% of the array median, so we expect reasonably uniform on-sky sensitivity across the 255–278 GHz filter bank. We estimate an optical efficiency through the lens and filter bank of . At the tested range of loadings the GR and photon noise components are comparable, while the contribution from the readout system is negligible.
This demonstrated noise performance is sufficient for deployment to the LMT. Initially we will focus on demonstrating spectrometer performance by detecting known CO lines in nearby galaxies and high- CO in sources where lower- lines have been detected. Eventually we will use SuperSpec to blindly detect [CII] in high- galaxies, complementing the existing LMT instrumentation suite. In one hour we expect a detection of [CII] in a , galaxy at SNR (assuming a line luminosity fraction of ).
While we conservatively baseline 50-channel SuperSpec devices for our demonstration instrument, we have also recently fabricated 100- and 300-channel devices18. If further testing in the next few months demonstrates similar noise performance, they will be strong candidates for deployment and will improve our spectral coverage significantly. Looking beyond the demonstration instrument, we anticipate fabricating many spectrometers on single wafers within the next year. Such devices would be suitable for deployment in near-term intensity mapping experiments (e.g., TIME19) as a drop-in replacement for existing grating or Fourier Transform spectrometers.
Acknowledgements.
This work is supported by the National Science Foundation under Grant No. AST-1407457. K. S. Karkare is supported by the Grainger Foundation and the Kavli Institute for Cosmological Physics at the University of Chicago through an endowment from the Kavli Foundation and its founder Fred Kavli. R. M. J. Janssen’s research was supported by an appointment to the NASA Postdoctoral Program at the NASA Jet Propulsion Laboratory, administered by Universities Space Research Association under contract with NASA.References
- 1 G. Lagache et al., Ann. Rev. Astron. Astroph. 43, 727 (2005)
- 2 M. Bradač et al., Astroph. J. 836, L2 (2017)
- 3 E. Kovetz et al., arXiv eprints:1709.09066 (2017)
- 4 K. S. Karkare et al., Phys. Rev. D. 98, 043529 (2018)
- 5 A. Endo et al., J. Astr. Tel. Instr. Syst. 5(3), 035004 (2019)
- 6 G. Cataldo et al., J. Low Temp. Phys. 193, 923 (2018)
- 7 S. Bryan et al., J. Low Temp Phys. 184, 114 (2016)
- 8 E. Shirokoff et al., Proc. SPIE 8452, 84520R (2012)
- 9 S. Hailey-Dunsheath et al., J. Low Temp. Phys. 184, 180 (2016)
- 10 J. Wheeler et al., Proc. SPIE 9914, 99143K (2016)
- 11 F. Schloerb et al., Proc. SPIE 5489, 551935 (2004)
- 12 R. McGeehan et al., J. Low Temp. Phys. 193, 1024 (2018)
- 13 S. Hailey-Dunsheath et al., Proc. SPIE 9153, 91530M (2014)
- 14 M. Zeballos et al., Proc. SPIE 9906, 99064U (2016)
- 15 S. Paine, The am atmospheric model, 10.5281/zenodo.1193646 (2018)
- 16 S. Gordon al., J. Astr. Instru. 5(4), 1641003 (2016)
- 17 J. Wheeler et al., J. Low Temp. Phys. 193, 408 (2018)
- 18 J. Redford et al., Proc. SPIE 10708, 107081O (2018)
- 19 A. T. Crites et al., Proc. SPIE 9153, 91531W (2014)