-symmetric potentials having continuous spectra
Abstract
One-dimensional -symmetric quantum-mechanical Hamiltonians having continuous spectra are studied. The Hamiltonians considered have the form , where is odd in , pure imaginary, and vanishes as . Five -symmetric potentials are studied: the Scarf-II potential , which decays exponentially for large ; the rational potentials and , which decay algebraically for large ; the step-function potential , which has compact support; the regulated Coulomb potential , which decays slowly as and may be viewed as a long-range potential. The real parameters measure the strengths of these potentials. Numerical techniques for solving the time-independent Schrödinger eigenvalue problems associated with these potentials reveal that the spectra of the corresponding Hamiltonians exhibit universal properties. In general, the eigenvalues are partly real and partly complex. The real eigenvalues form the continuous part of the spectrum and the complex eigenvalues form the discrete part of the spectrum. The real eigenvalues range continuously in value from to . The complex eigenvalues occur in discrete complex-conjugate pairs and for () the number of these pairs is finite and increases as the value of the strength parameter increases. However, for there is an infinite sequence of discrete eigenvalues with a limit point at the origin. This sequence is complex, but it is similar to the Balmer series for the hydrogen atom because it has inverse-square convergence.
1 Introduction
A -symmetric quantum theory is defined by a Hamiltonian that is invariant under combined space reflection (parity) and time reversal . An early class of non-Hermitian -symmetric Hamiltonians that has been studied in depth is ( real). These Hamiltonians are invariant because under and under . It was observed in Refs. [1, 2] that the eigenvalues of this class of Hamiltonians are real, discrete, and positive for all and the reality of these eigenvalues was attributed to the symmetry of . Subsequently, the reality of the spectrum was established at a mathematically rigorous level in Refs. [3, 4].
The eigenvalues of a -symmetric Hamiltonian are either real or come in complex-conjugate pairs. If the eigenvalue spectrum is entirely real, the symmetry of the Hamiltonian is said to be unbroken, but if some of the eigenvalues are complex, the symmetry of the Hamiltonian is said to be broken. Many studies of model quantum systems whose Hamiltonians are invariant have been published (see Refs. [5, 11]). -symmetric Hamiltonians often exhibit a transition from a parametric region of unbroken symmetry to a region of broken symmetry. This transition occurs in both the classical and in the quantized versions of a -symmetric Hamiltonian [2] and this transition has been observed in numerous laboratory experiments [5, 11].
Many papers on -symmetric Hamiltonians having discrete spectra have been published, but there have been only very few studies of -symmetric Hamiltonians having continuous spectra. Therefore, in this paper we consider Hamiltonians whose potentials possess continuous spectra. The potentials that we discuss here decay to as . Thus, it is not surprising that we find that in general the real part of the spectrum is continuous and that these eigenvalues range continuously from 0 to . Since the potential is odd under and is pure imaginary, is invariant, and hence complex eigenvalues must appear as complex-conjugate pairs. On the basis of our study we believe that short-range potentials typically have a finite number of discrete complex eigenvalues and that long-range potentials have an infinite number of discrete complex eigenvalues.
To be specific, in this paper we study five one-dimensional Hamiltonians of the form , where
| (1) |
and the strength parameters are real. In all cases is odd in and is pure imaginary, so the are all symmetric. Furthermore, these potentials all vanish as . In all these cases the Hamiltonians have real eigenvalues that range continuously from to . However, the universal property of the five Hamiltonians studied here is that in addition to the real continuous part of the spectra, there are complex-conjugate pairs of discrete eigenvalues for sufficiently large strength parameters . Thus, in all these cases the symmetry of these Hamiltonians is broken.
The five potentials vanish at different rates for large : The Scarf-II potential decays exponentially for large [6, 7, 8, 9], the rational potentials and decay algebraically like and for large , and the step-function potential has compact support [10]. These are all short-range potentials and we find that these potentials confine a finite number of discrete complex bound states. The number and size of these complex eigenvalues increase as the strength parameters increase.
The potential is special; it vanishes slowly like for large . Because it vanishes slowly,/and to it is a long-range potential like the Coulomb potential. Even though this potential is bounded, the property that it is long range allows it to confine infinitely many discrete complex bound states. Like the Balmer series for the hydrogen atom, the sequence of complex-conjugate pairs of eigenvalues converges to a limit point, which happens to be at , and the th pair of eigenvalues approaches like .
In previous studies of -symmetric Hamiltonians it was found that accurate numerical calculations of real discrete eigenvalues could be done by using the shooting method [1]. However, if the discrete eigenvalues are complex, the shooting method becomes unwieldy. Therefore, alternative techniques based on the finite-element and variational methods were used. A numerical technique known as the Arnoldi algorithm was used in Ref. [12].
Let us summarize the numerical technique used in this paper: For numerical calculations of eigenvalues one cannot work directly on the infinite axis, so one reduces the problem to solving the Schrödinger equation on a large but finite interval. Consequently, the numerical techniques used to calculate eigenvalues can only return discrete values and one must determine whether a given eigenvalue belongs to a discrete or a continuous part of the spectrum. To distinguish between these two possibilities we examine the associated eigenfunctions and observe how they satisfy the boundary conditions. As explained in detail in Ref. [12], the eigenfunctions associated with discrete eigenvalues are localized in space (like bound states) and decay to 0 smoothly and exponentially as approaches the boundary points of the interval. However, the eigenfunctions for eigenvalues that belong to the continuous part of the spectrum drop abruptly to at one or both endpoints of the finite interval.
The technique used here to compute the eigenvalues of is called Chebyshev spectral collocation. This technique relies on the properties of Chebyshev polynomials and Chebyshev series and is explained in detail in Ref. [13]. To calculate the spectra of the Hamiltonians by using Chebyshev spectral collocation we replace the infinite axis by the finite interval . We then decompose the interval into subintervals bounded by grid points at , where . These subintervals are not of equal length; rather, the subintervals shorten as we approach the endpoints at and . To determine the positions of the grid points, we construct a semicircle of radius centered at the origin and divide the circle into equal sectors. We then project onto the axis. Thus, the grid points are located at . For all computations done in this paper we take . The first and last grid points lie at , but since is odd there is no grid point at the origin. We make this choice because the potential is discontinuous at . To find the eigenvalues we impose homogeneous boundary conditions at the endpoints and finally let tend to infinity. In all cases we take , , and , and we find that the eigenvalues converge rapidly to their values.
2 Eigenvalues for the Scarf-II potential
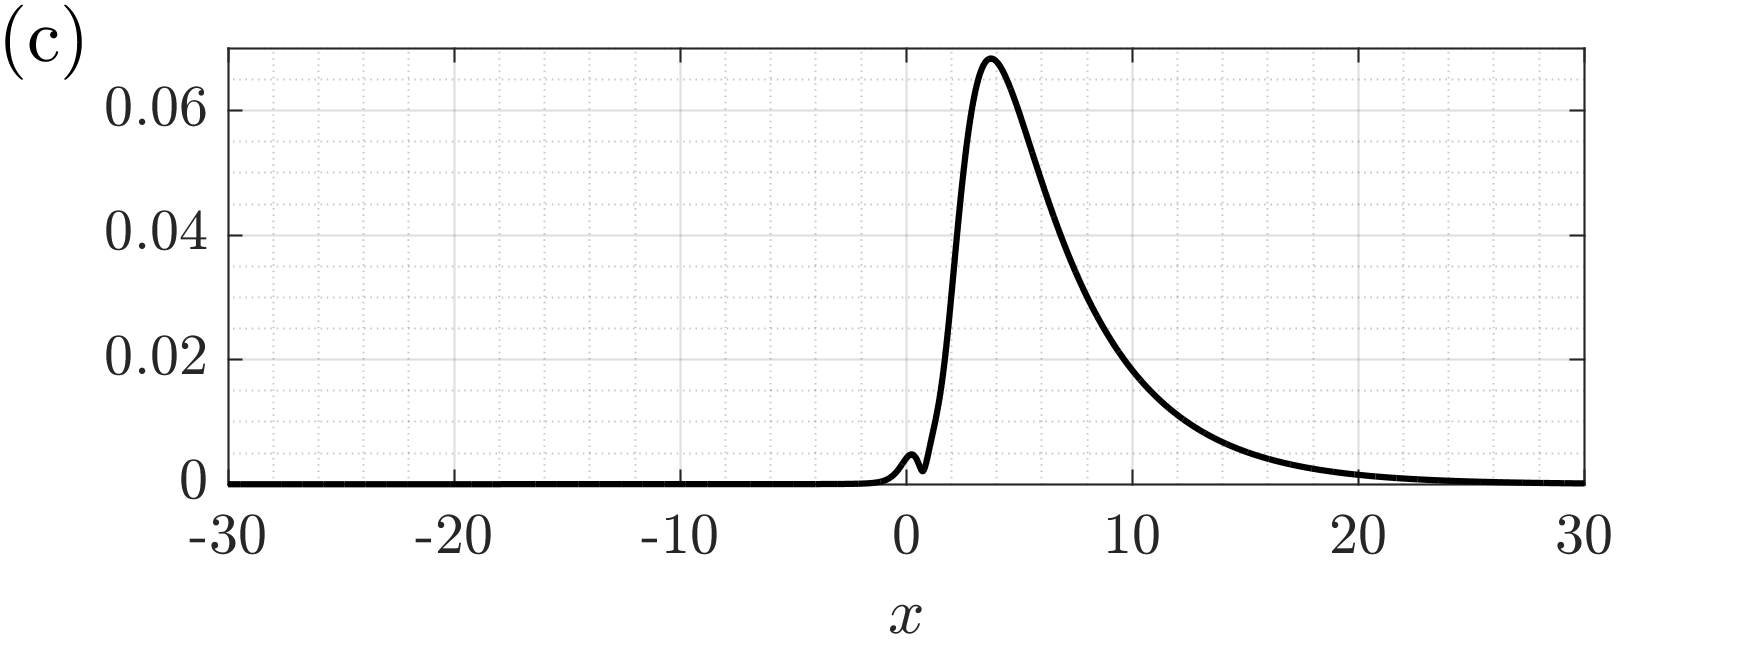
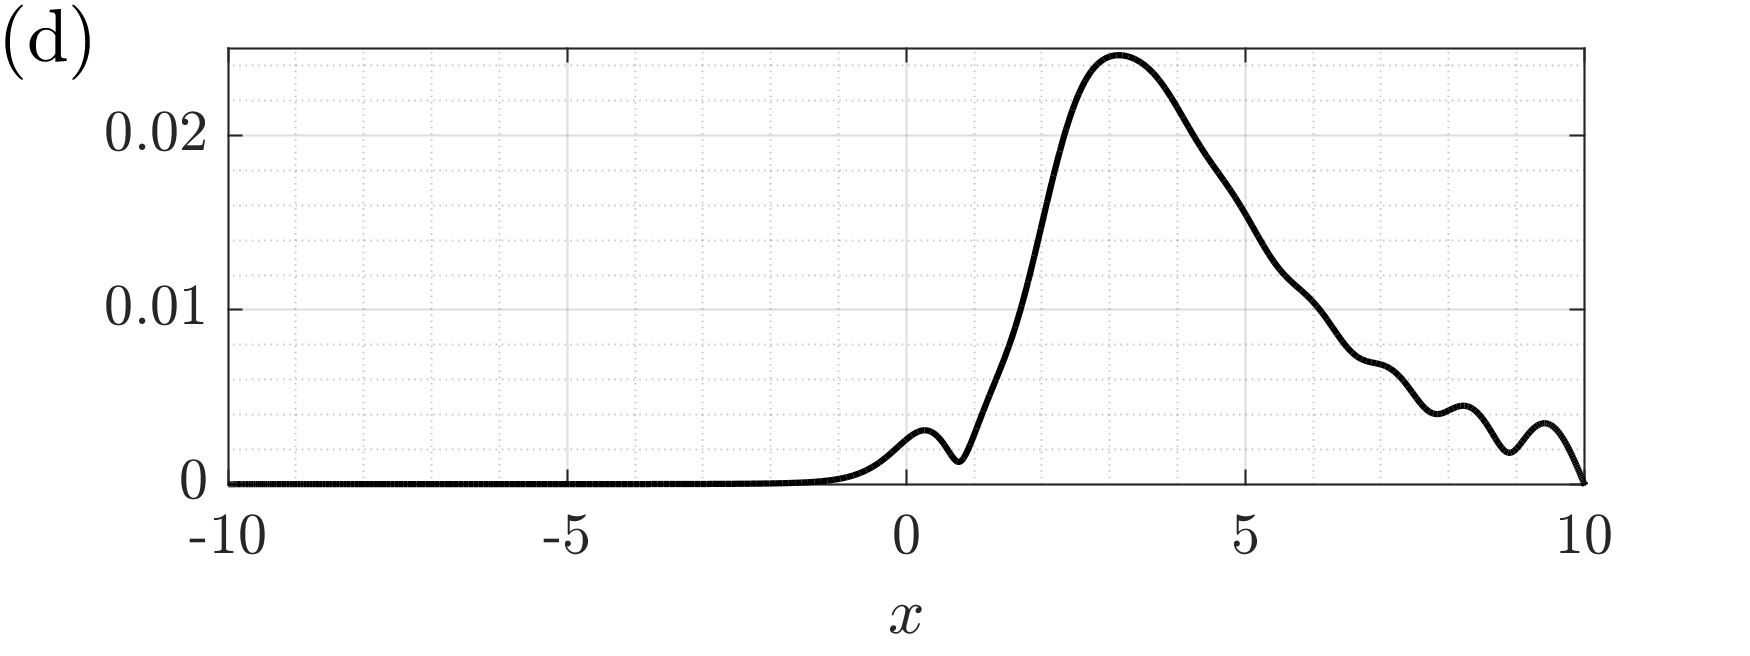
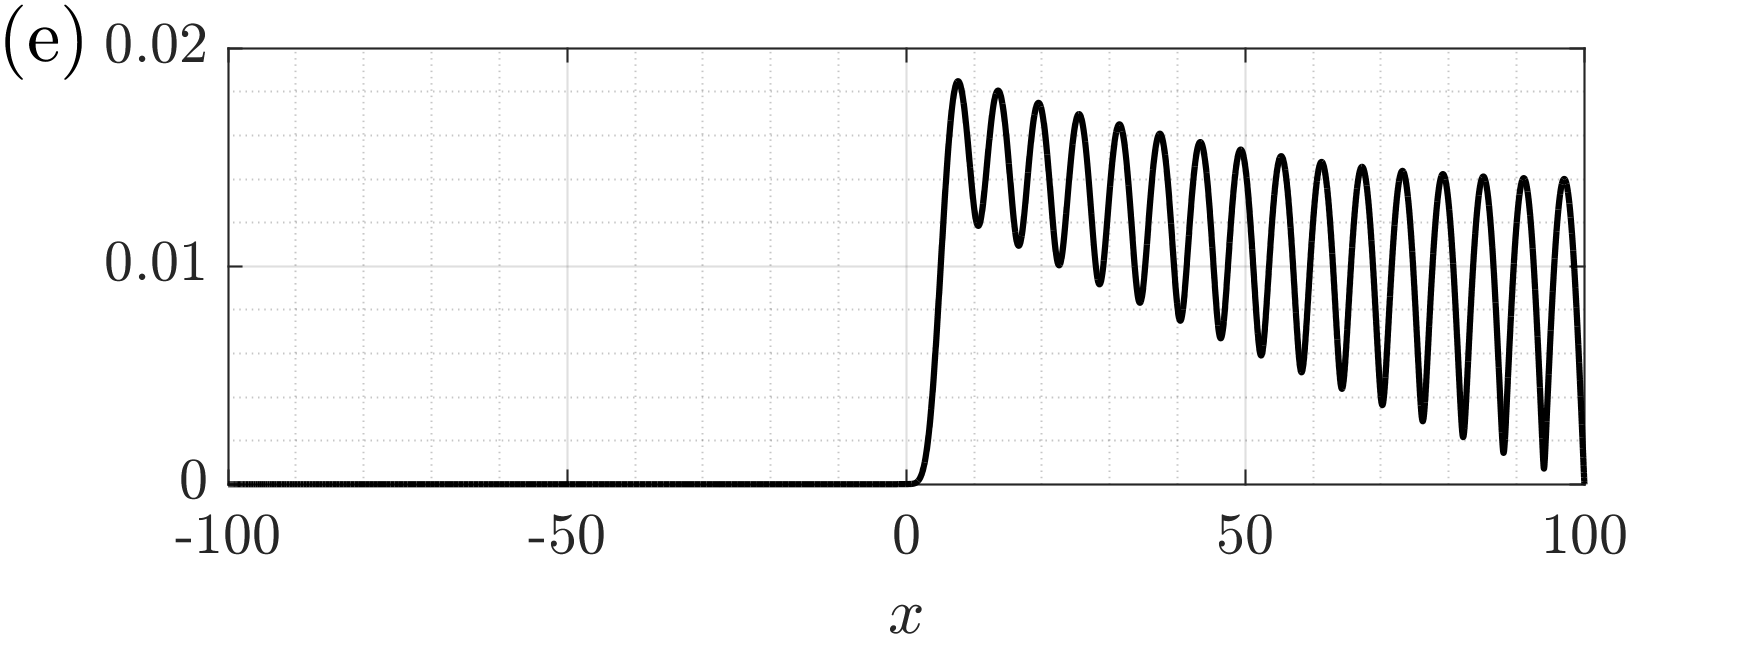
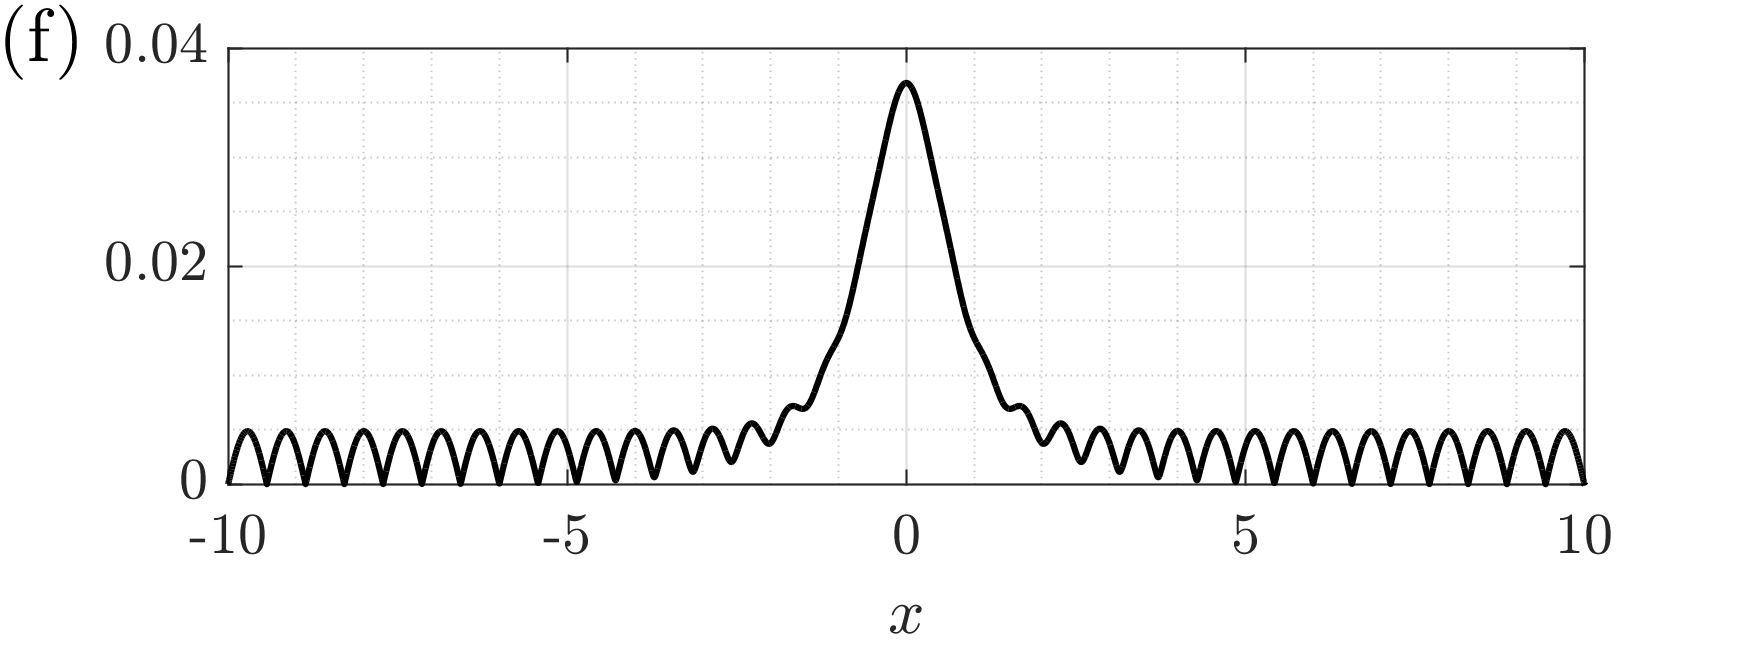
For the potential in (1) we have chosen . In Fig. 1 we plot the eigenvalues in the complex plane for in panel (a) and for in panel (b). We observe two kinds of eigenvalues, bound-state eigenvalues, which are indicated by circles, and continuum eigenvalues, which are indicated by crosses in (a) and by dots in (b). As we will see in Fig. 4, we can distinguish between bound-state and continuum eigenvalues by examining the corresponding eigenfunctions. This plot of the absolute values of the eigenfunctions as functions of shows that the eigenfunctions for bound-state eigenvalues decay smoothly and exponentially to 0 as approaches the boundaries at while the continuum eigenfunctions abruptly drop to 0 at one or both boundaries. Note that as increases from in (a) to in (b), the positions of the bound-state eigenvalues stabilize rapidly but the continuum eigenvalues approach the real axis.


We observe two kinds continuum eigenvalues in Fig. 1. Above a critical value near the continuum eigenvalues are real, but below this critical value the continuum eigenvalues come in complex-conjugate pairs that lie slightly above and below the real axis. These pairs of eigenvalues approach the real axis as increases but the position of the critical value near does not change. With increasing each member of the complex-conjugate pair of eigenvalues approaches the real axis vertically, but as they reach the real axis, one member of the pair moves slightly rightward and the other moves slightly leftward along the real axis, thus doubling the density of points. (This behavior of the continuum eigenvalues is in exact analogy to the motion of the roots of the famous Wilkenson polynomial [14].) For , the continuum eigenvalues below are extremely close to the real axis, but the positions of the complex bound states do not move, as we can see in Fig. 2.


Figure 3 is a logarithmic plot of the eigenvalues shown in Figs. 1 and 2. Observe that the critical point at at which the continuum eigenvalues jump from being complex-conjugate pairs to real numbers does not move as is increased.
To distinguish between discrete and continuum eigenvalues we investigate the behavior of the associated eigenfunctions. Six possible behaviors of the eigenfunctions are displayed in Fig. 4. In general, the eigenfunctions of discrete eigenvalues decay smoothly to 0 at the endpoints of the interval but the eigenfunctions of continuum eigenvalues abruptly drop to 0 at one or both endpoints.


3 Eigenvalue behavior of
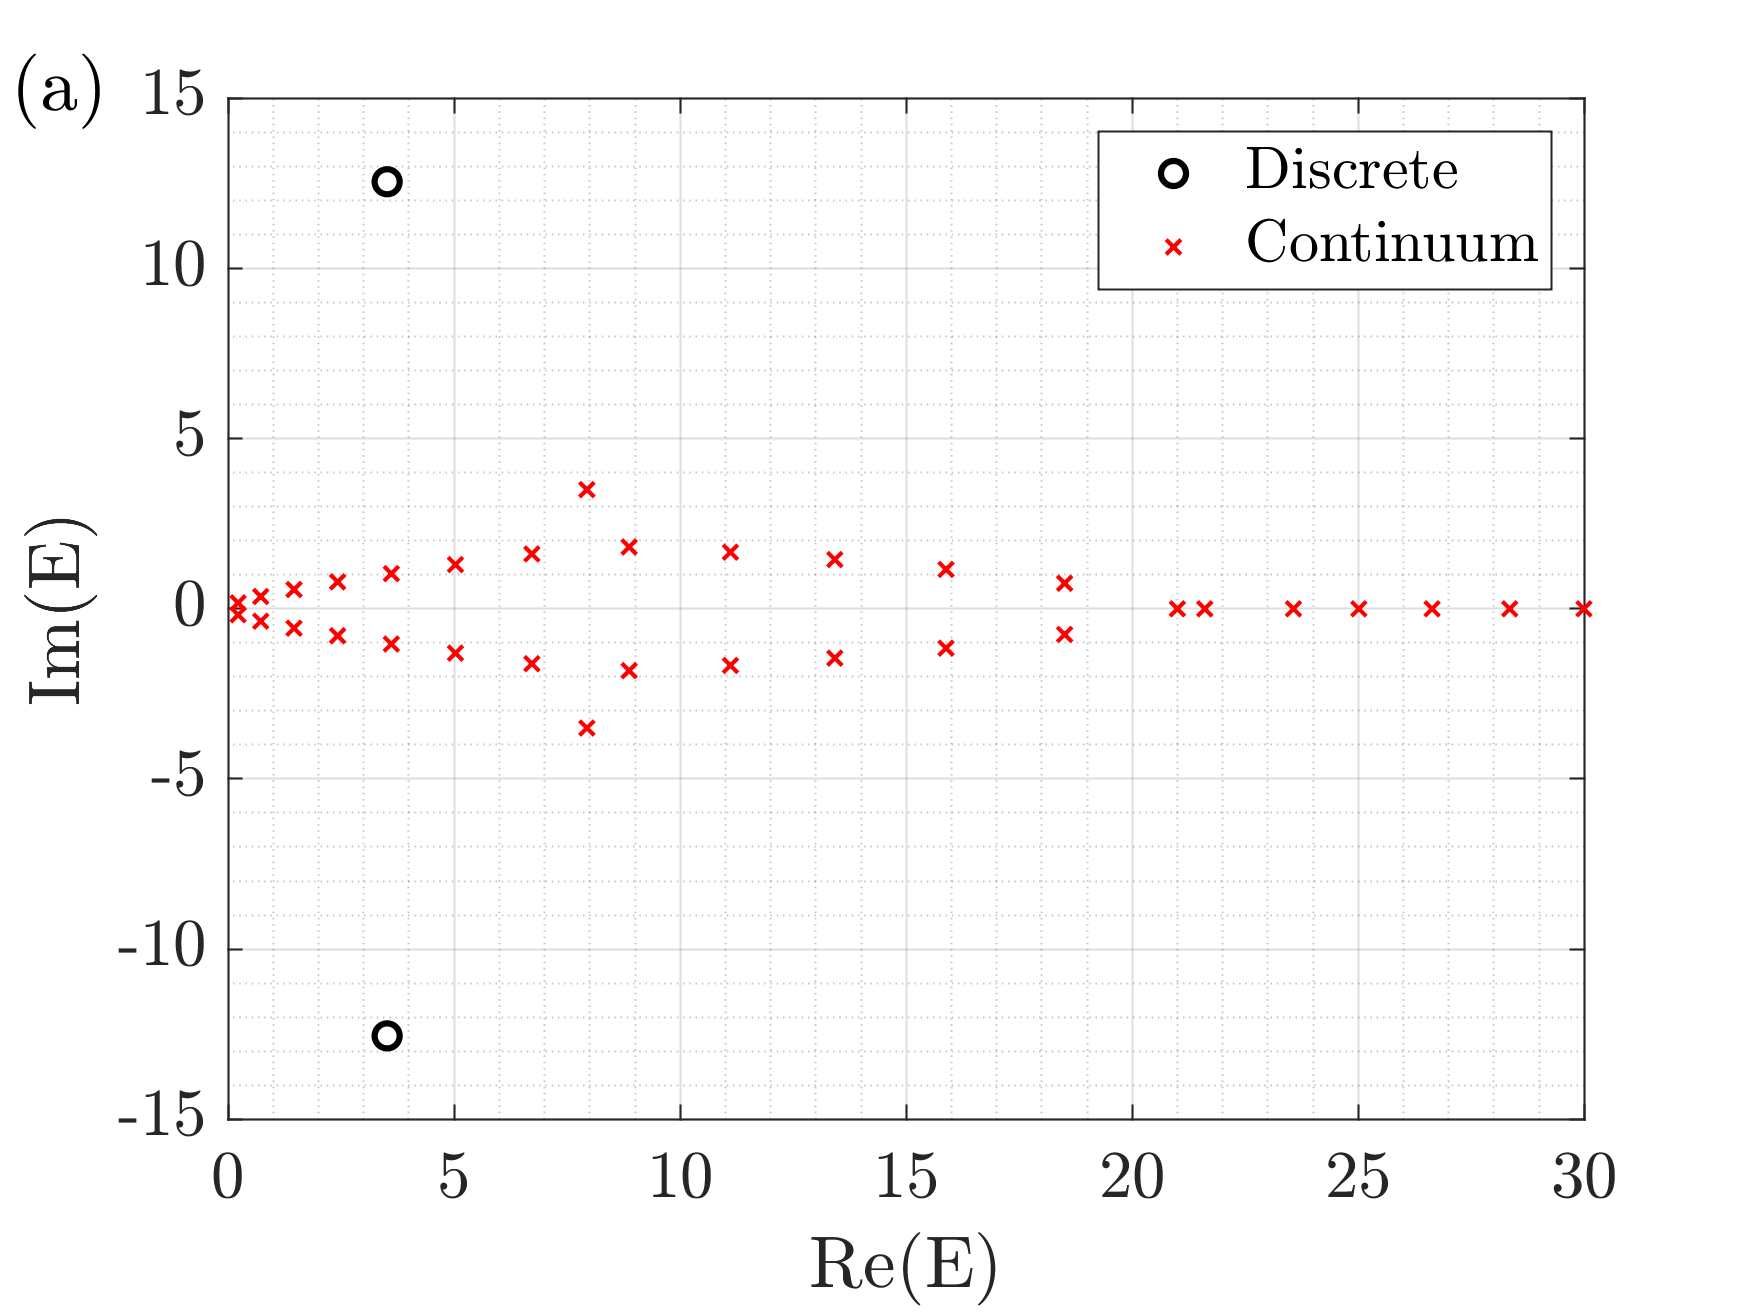
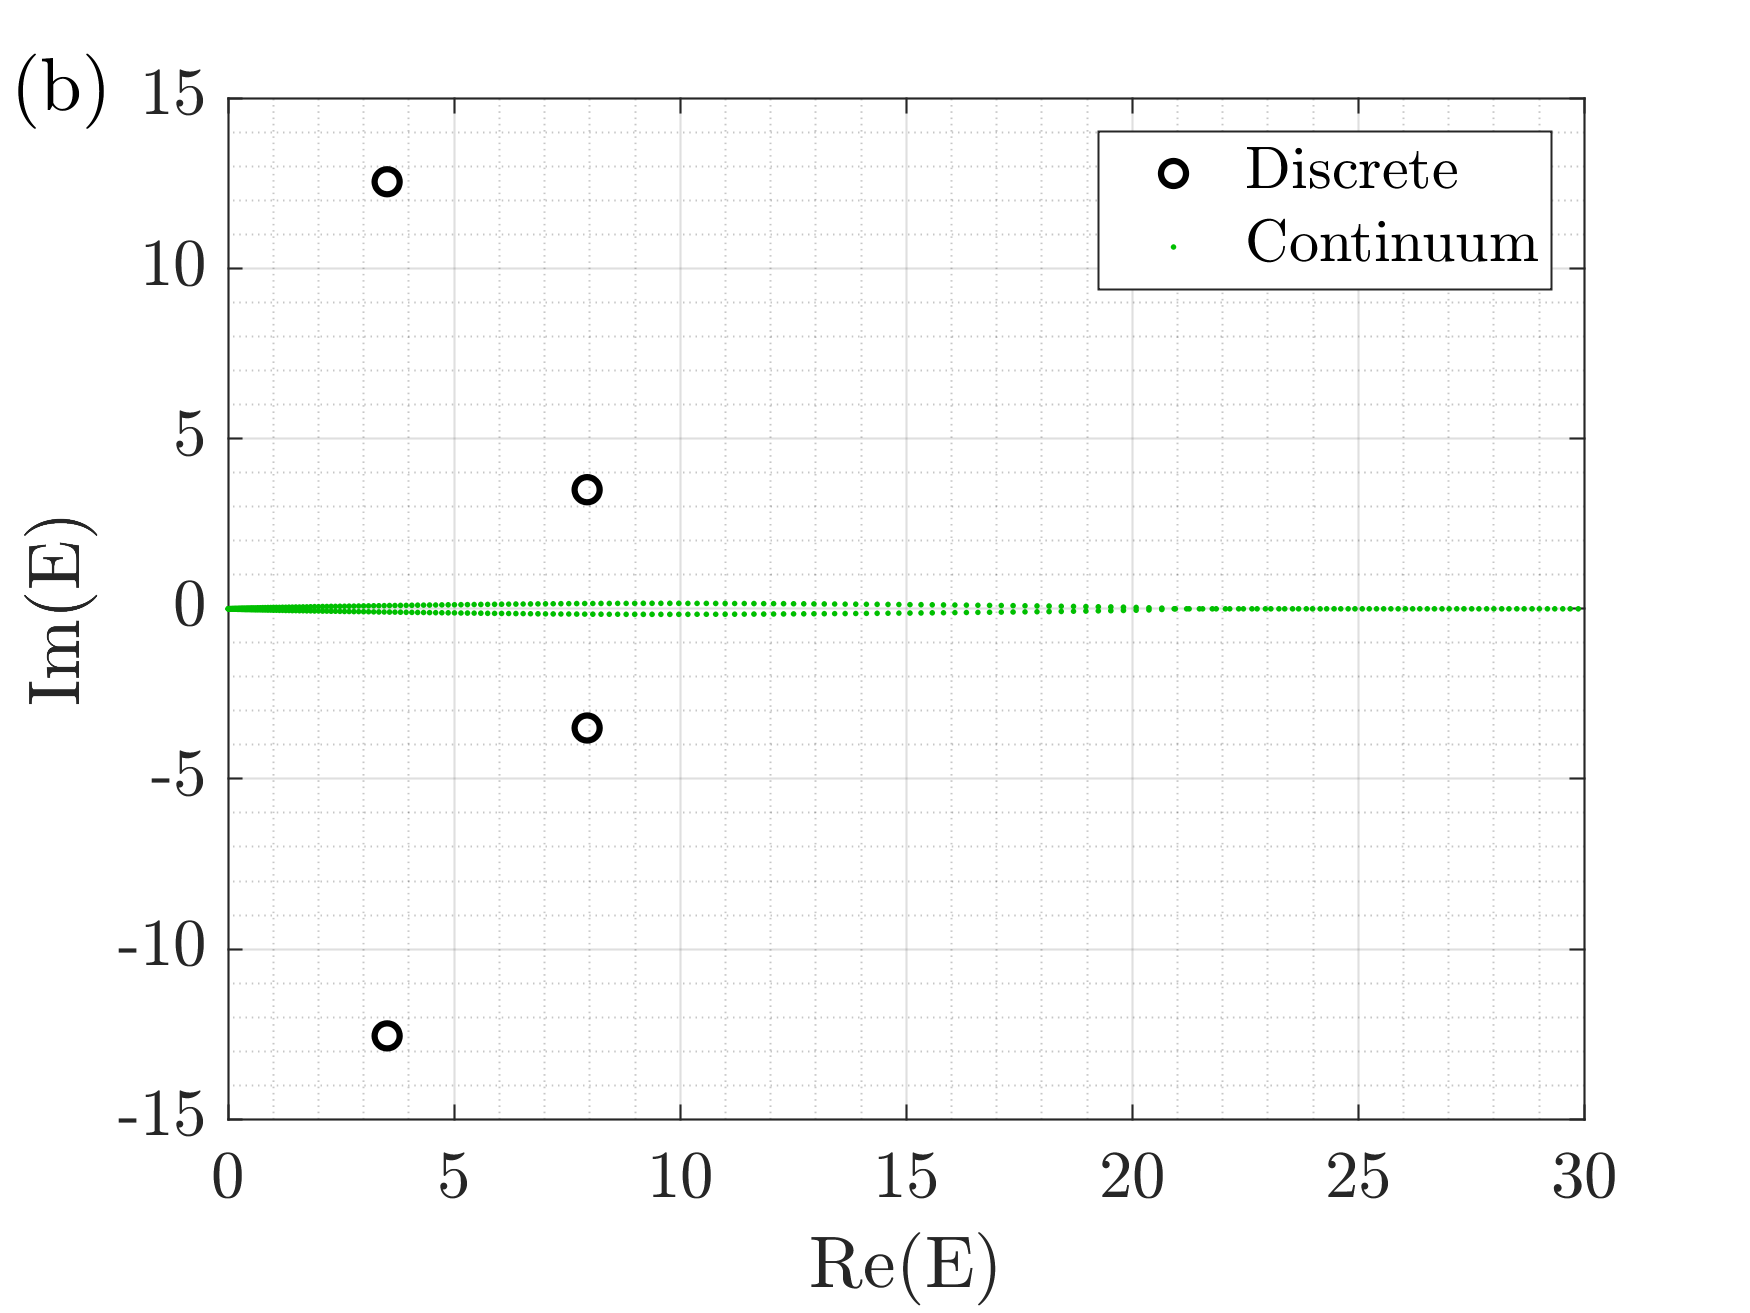
While the potential decays exponentially for large , the potential decays algebraically like for large . Nevertheless, the spectral properties of are strikingly similar to those of . For the analog of Fig. 1 is Fig. 5. Again, we have taken the strength parameter to be and we observe one complex-conjugate pair of bound-state eigenvalues for in panel (a) and two complex-conjugate pairs of bound-state eigenvalues for in panel (b). The new pair of bound-state eigenvalues is uncovered as the continuum eigenvalues collapse towards the real axis.
If we increase to , we observe in Fig. 6 that the bound-state eigenvalues do not move. However, the continuum eigenvalues lie very close to the real axis.

As with the Scarf-II potential , there is a transition in the continuum part of the spectrum that for this model occurs near . To examine this transition, we plot the eigenvalues on a logarithmic scale in Fig. 7. Observe that near the continuum eigenvalues undergo an abrupt jump in their imaginary parts of 10 orders of magnitude.

4 Eigenvalue behavior of
The spectral structure associated with the potential is qualitatively similar to that of . We take the strength parameter and plot the eigenvalues for in Fig. 8, panel (a), and for in Fig. 8, panel (b).
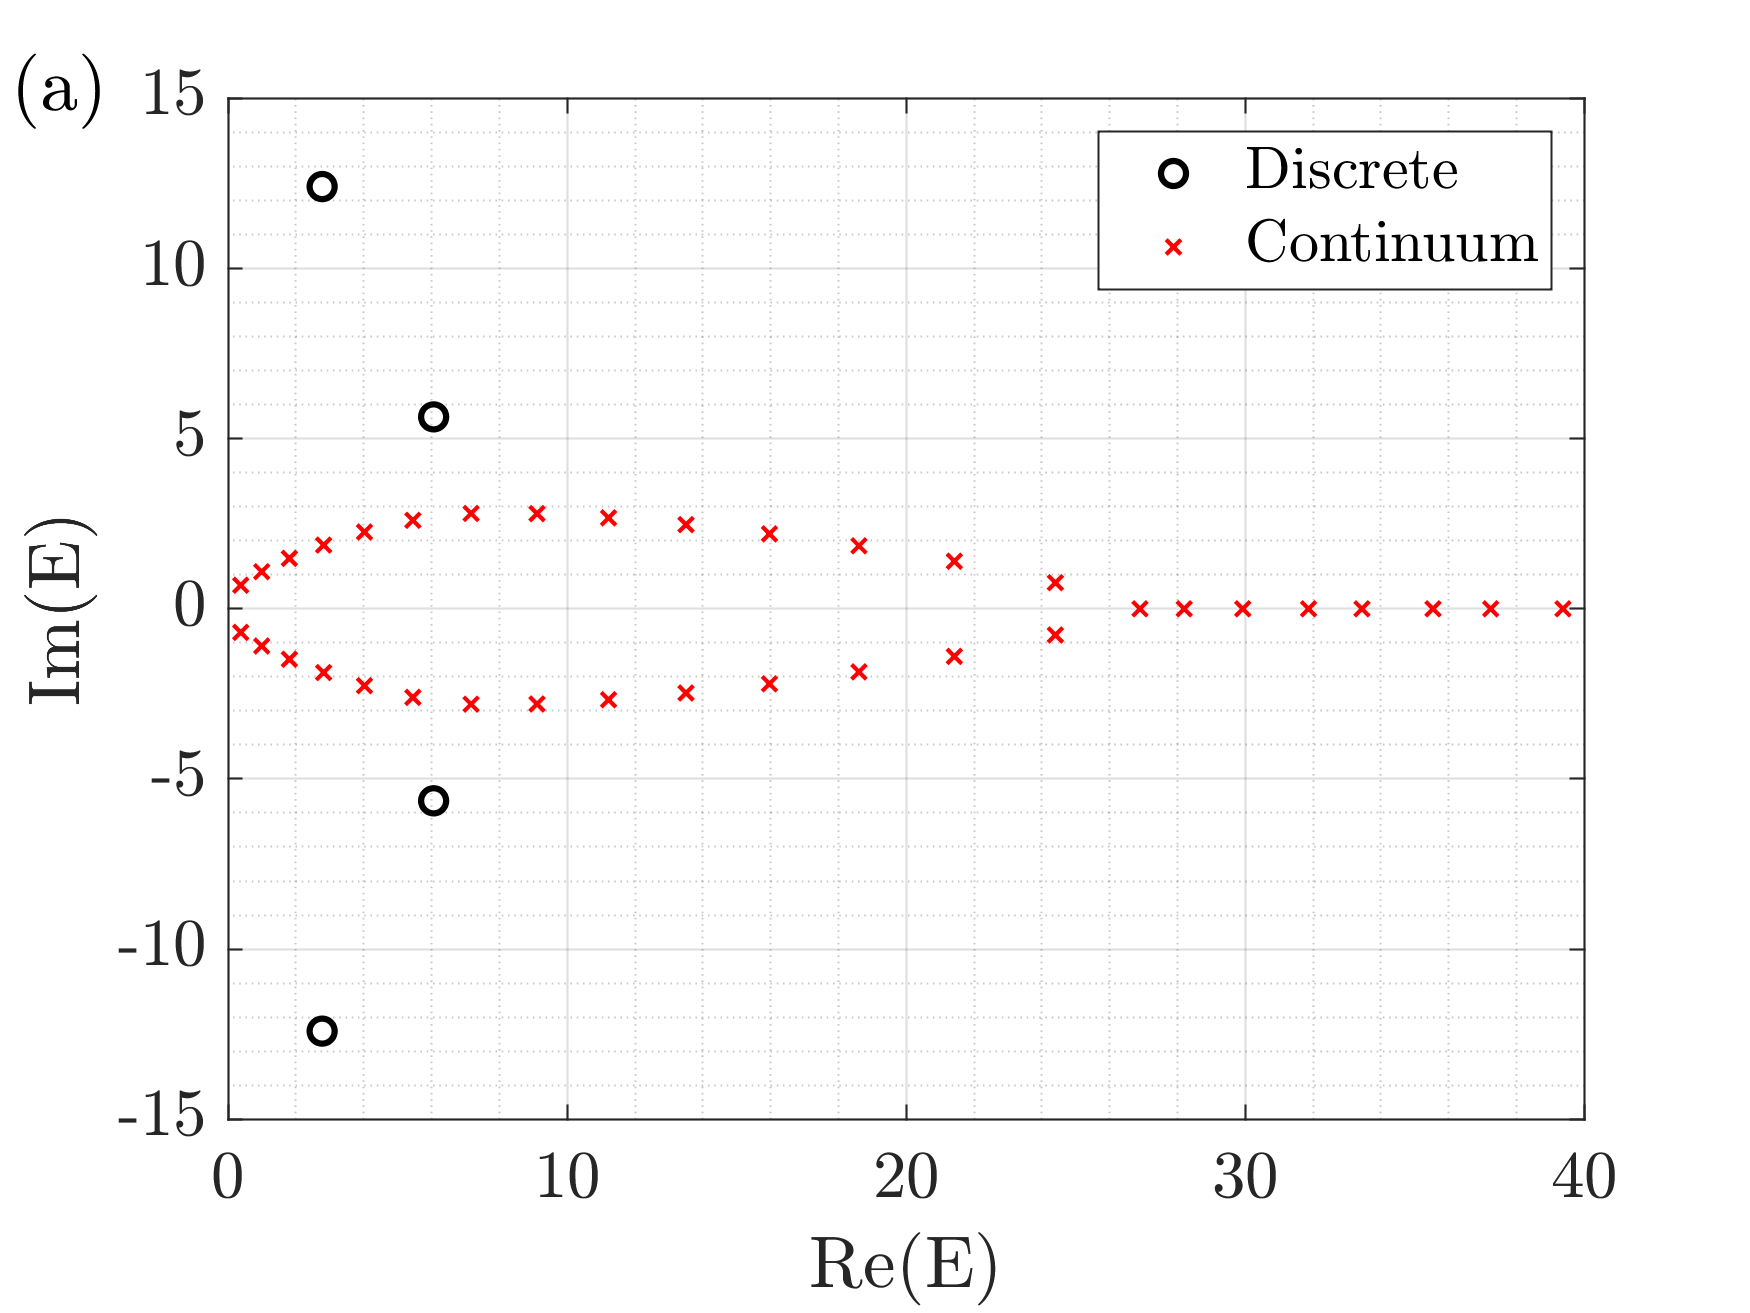
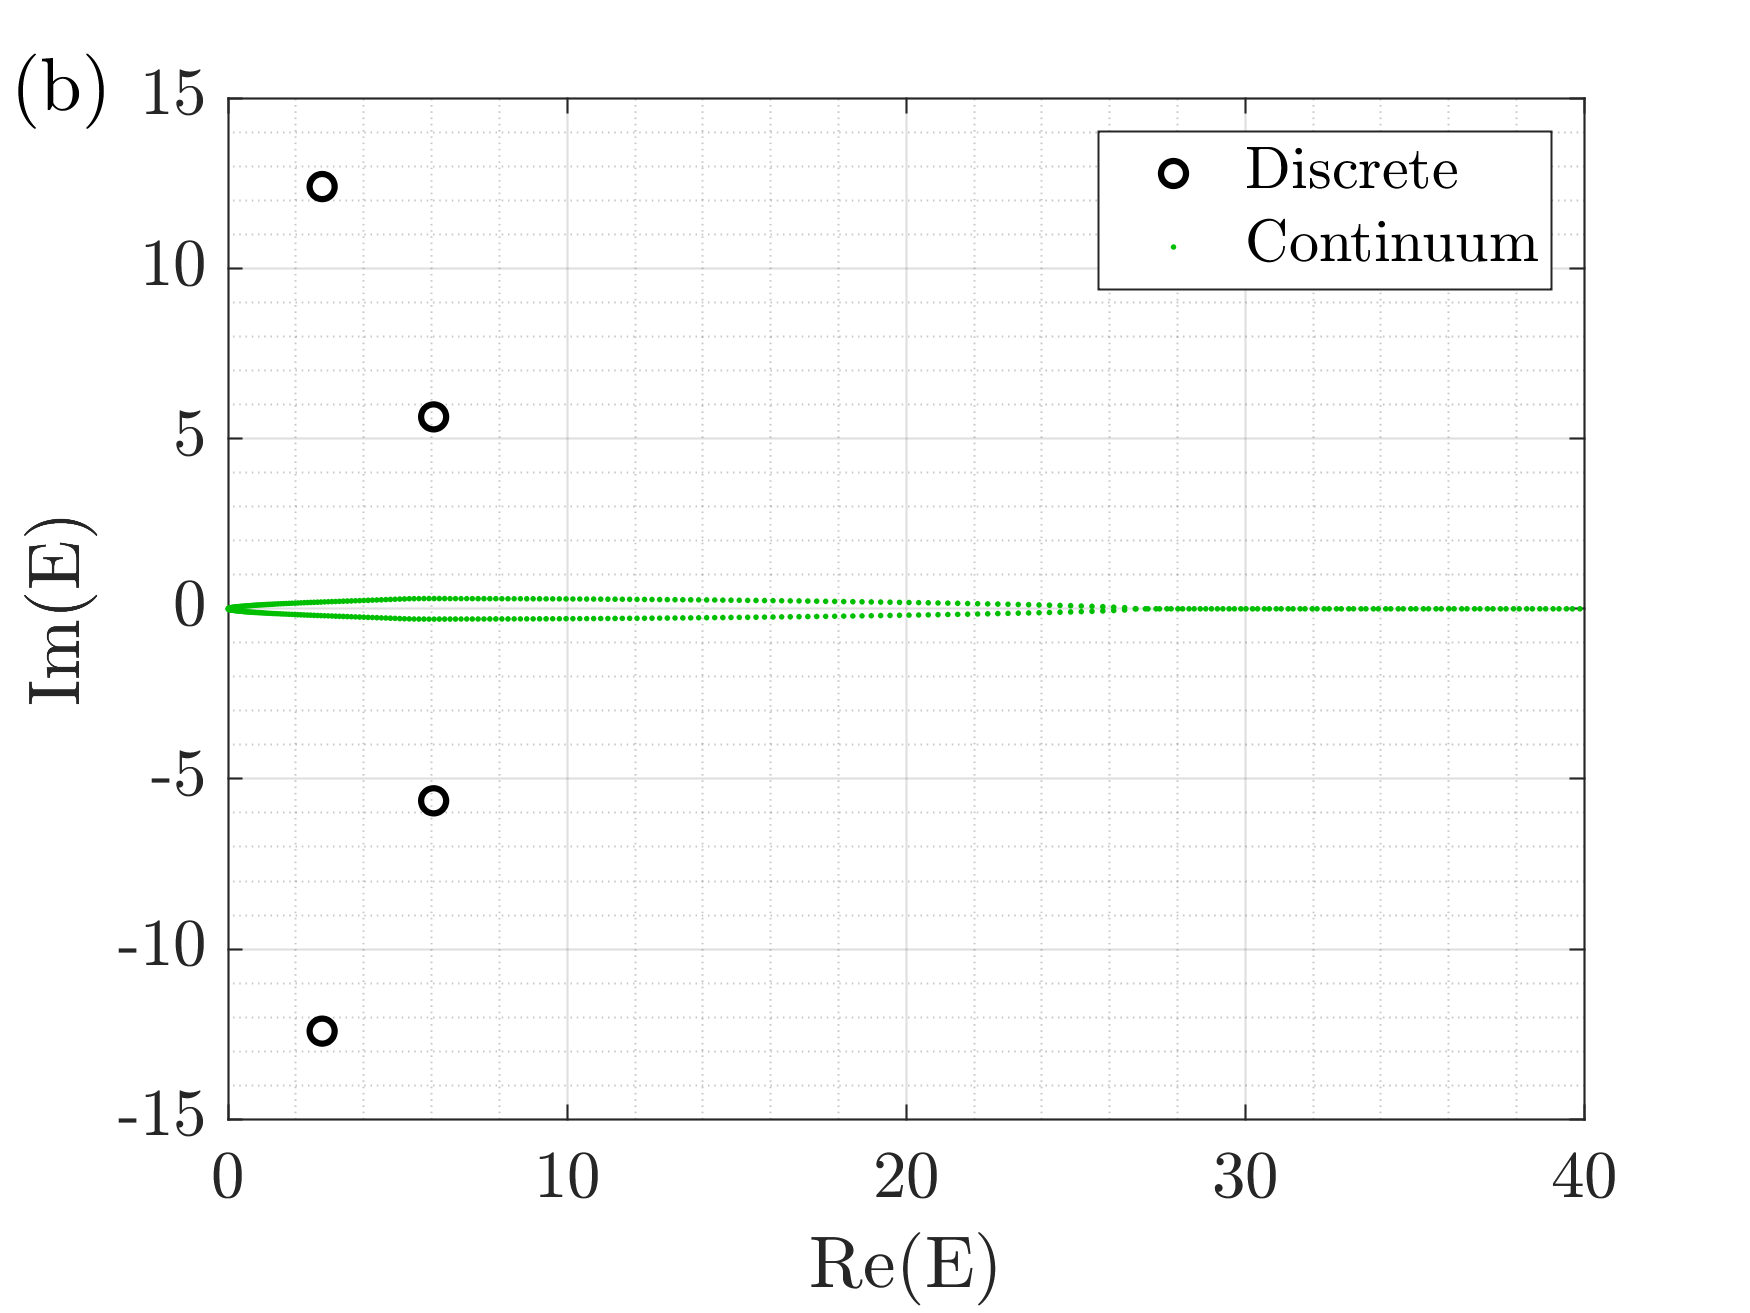
Observe that as is increased from to , the discrete bound-state eigenvalues do not move but the continuum part of the spectrum rapidly approaches the real axis. In Fig. 9 we increase the value of to 1000. This higher-accuracy calculation shows that the continuum eigenvalues are extremely close to the real axis. However, there is still a critical point where the continuum eigenvalues go from having a small imaginary part to a vanishing imaginary part. This transition point is near and the transition is indicated in Fig. 10 by a dashed line. Once again, the logarithmic plot shows that at the transition the imaginary parts of the continuum eigenvalues abruptly drop by about ten orders of magnitude.


5 Eigenvalue behavior of
The pattern of eigenvalues associated with is similar to that of , , and . For this potential we take the strength parameter and plot the spectra for and in Fig. 11 and for in Fig. 12. These figures show no qualitatively new features.
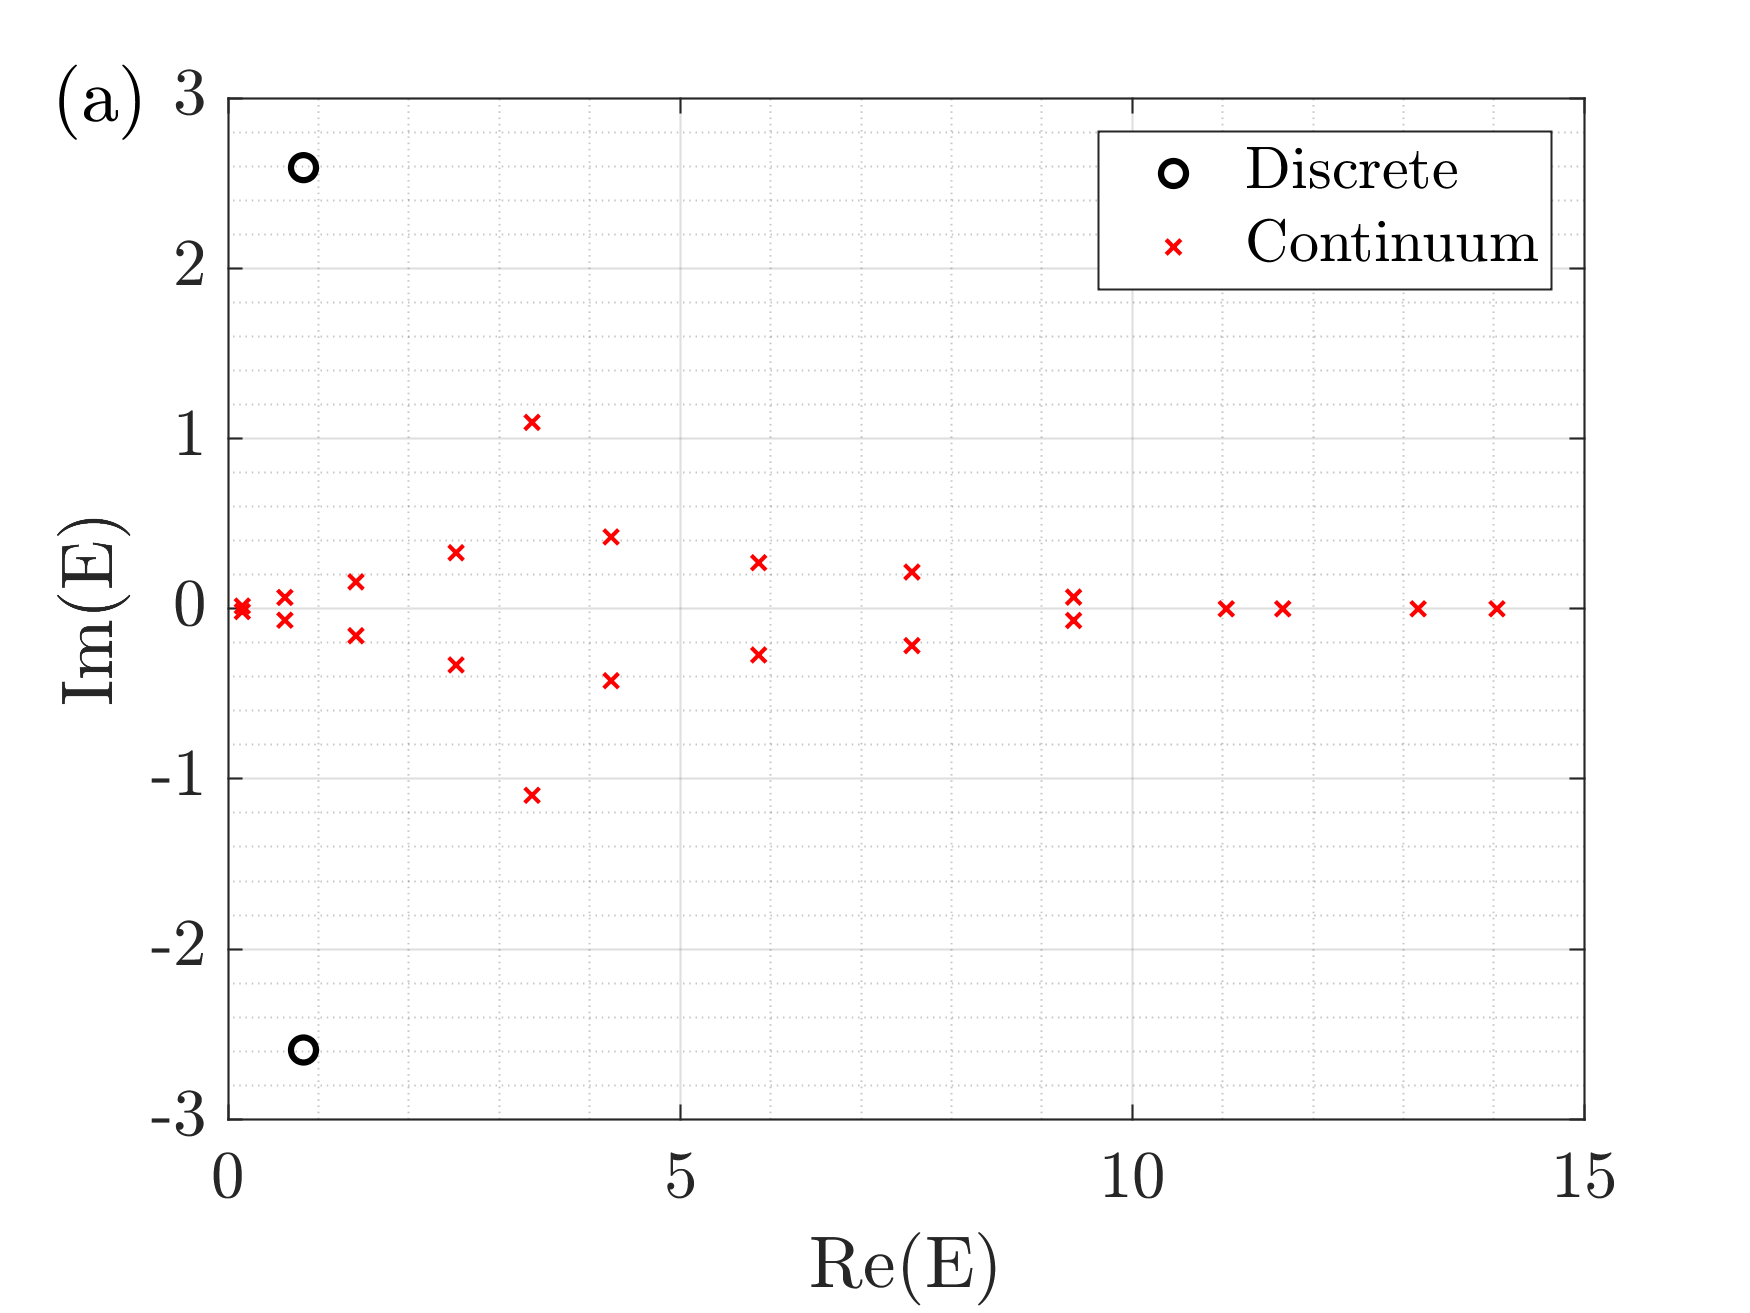
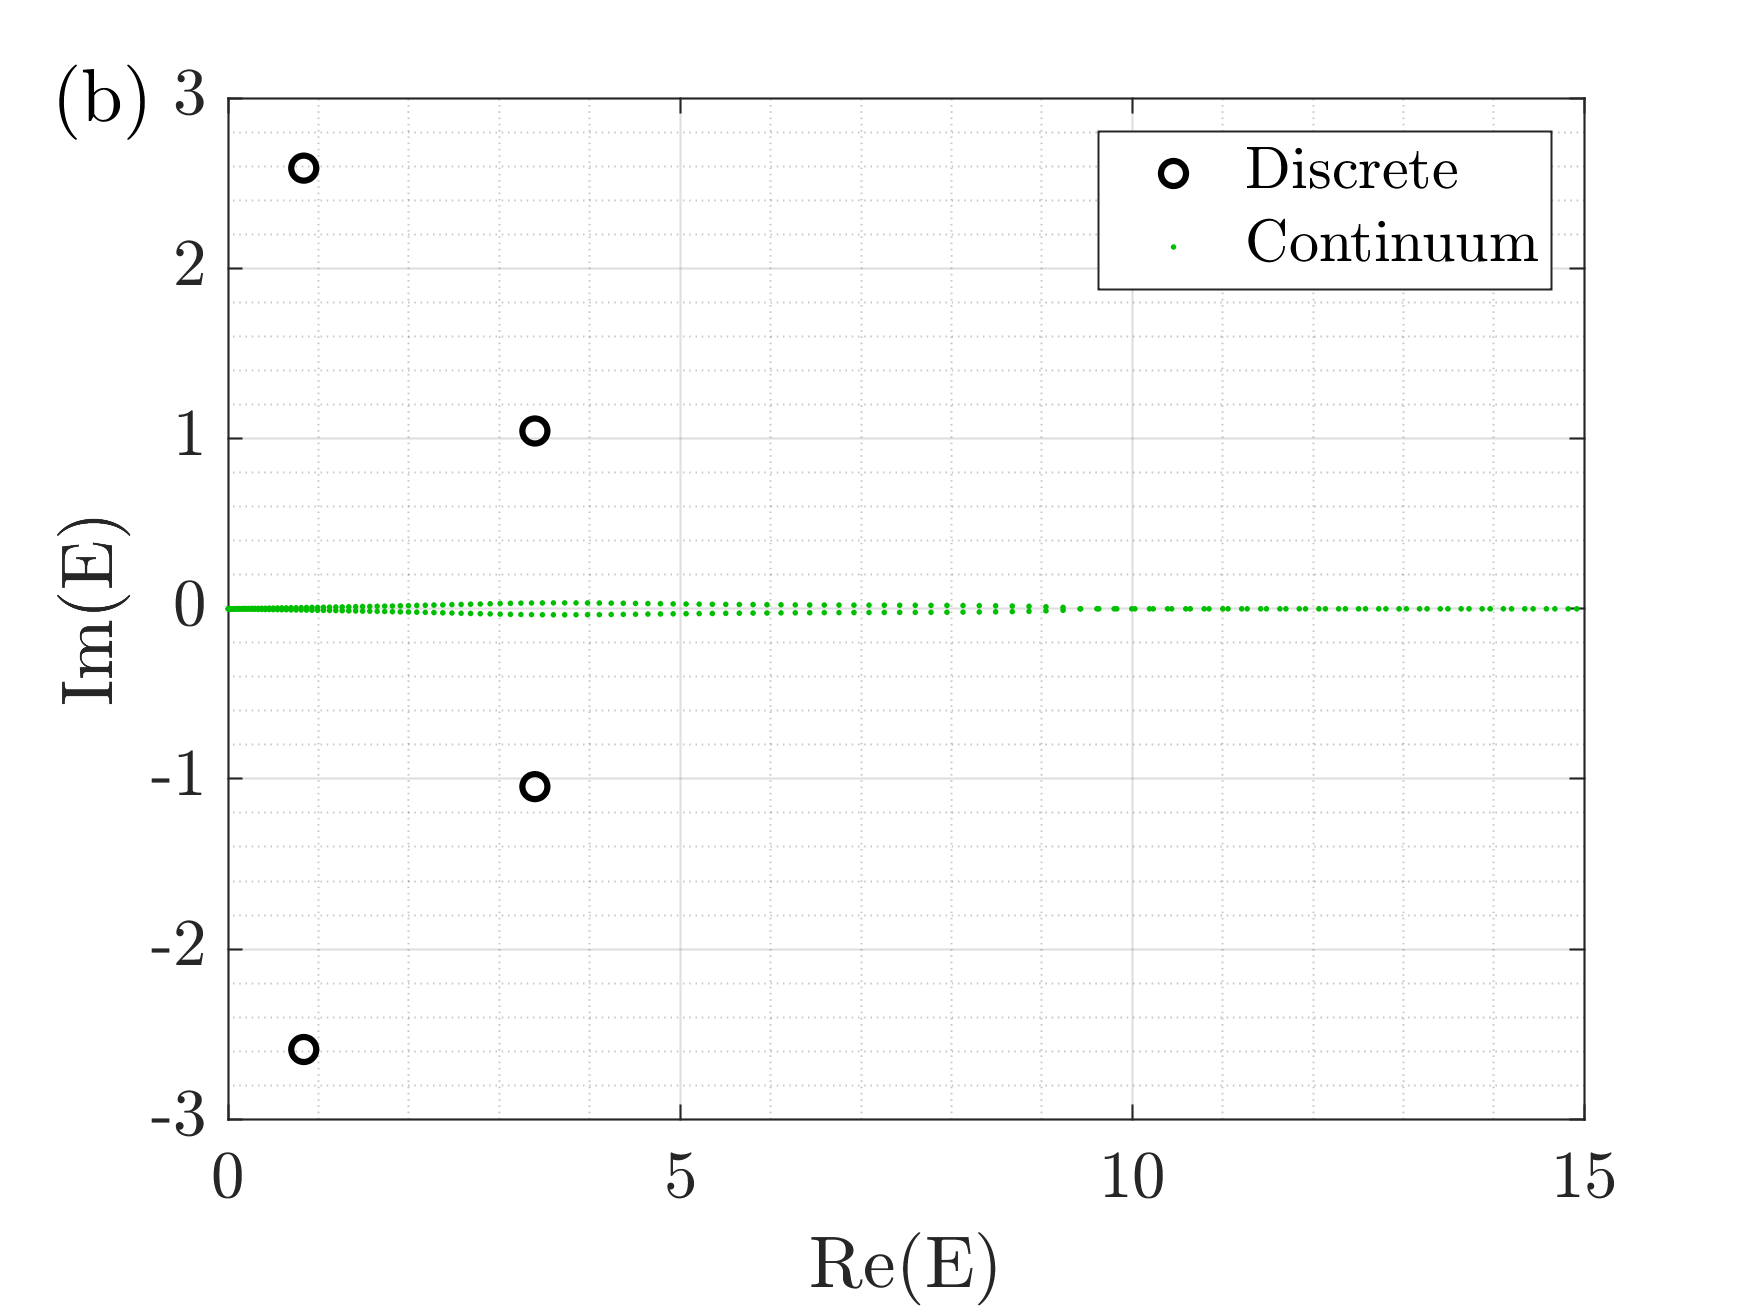

A logarithmic plot of the eigenvalue data in Figs. 11 and 12 is shown in Fig. 13. Once again we see a transition, in this case near , at which the continuum eigenvalues abruptly drop in magnitude by about ten orders of magnitude. The location of the transition is again insensitive to the value of .

6 Eigenvalue behavior of
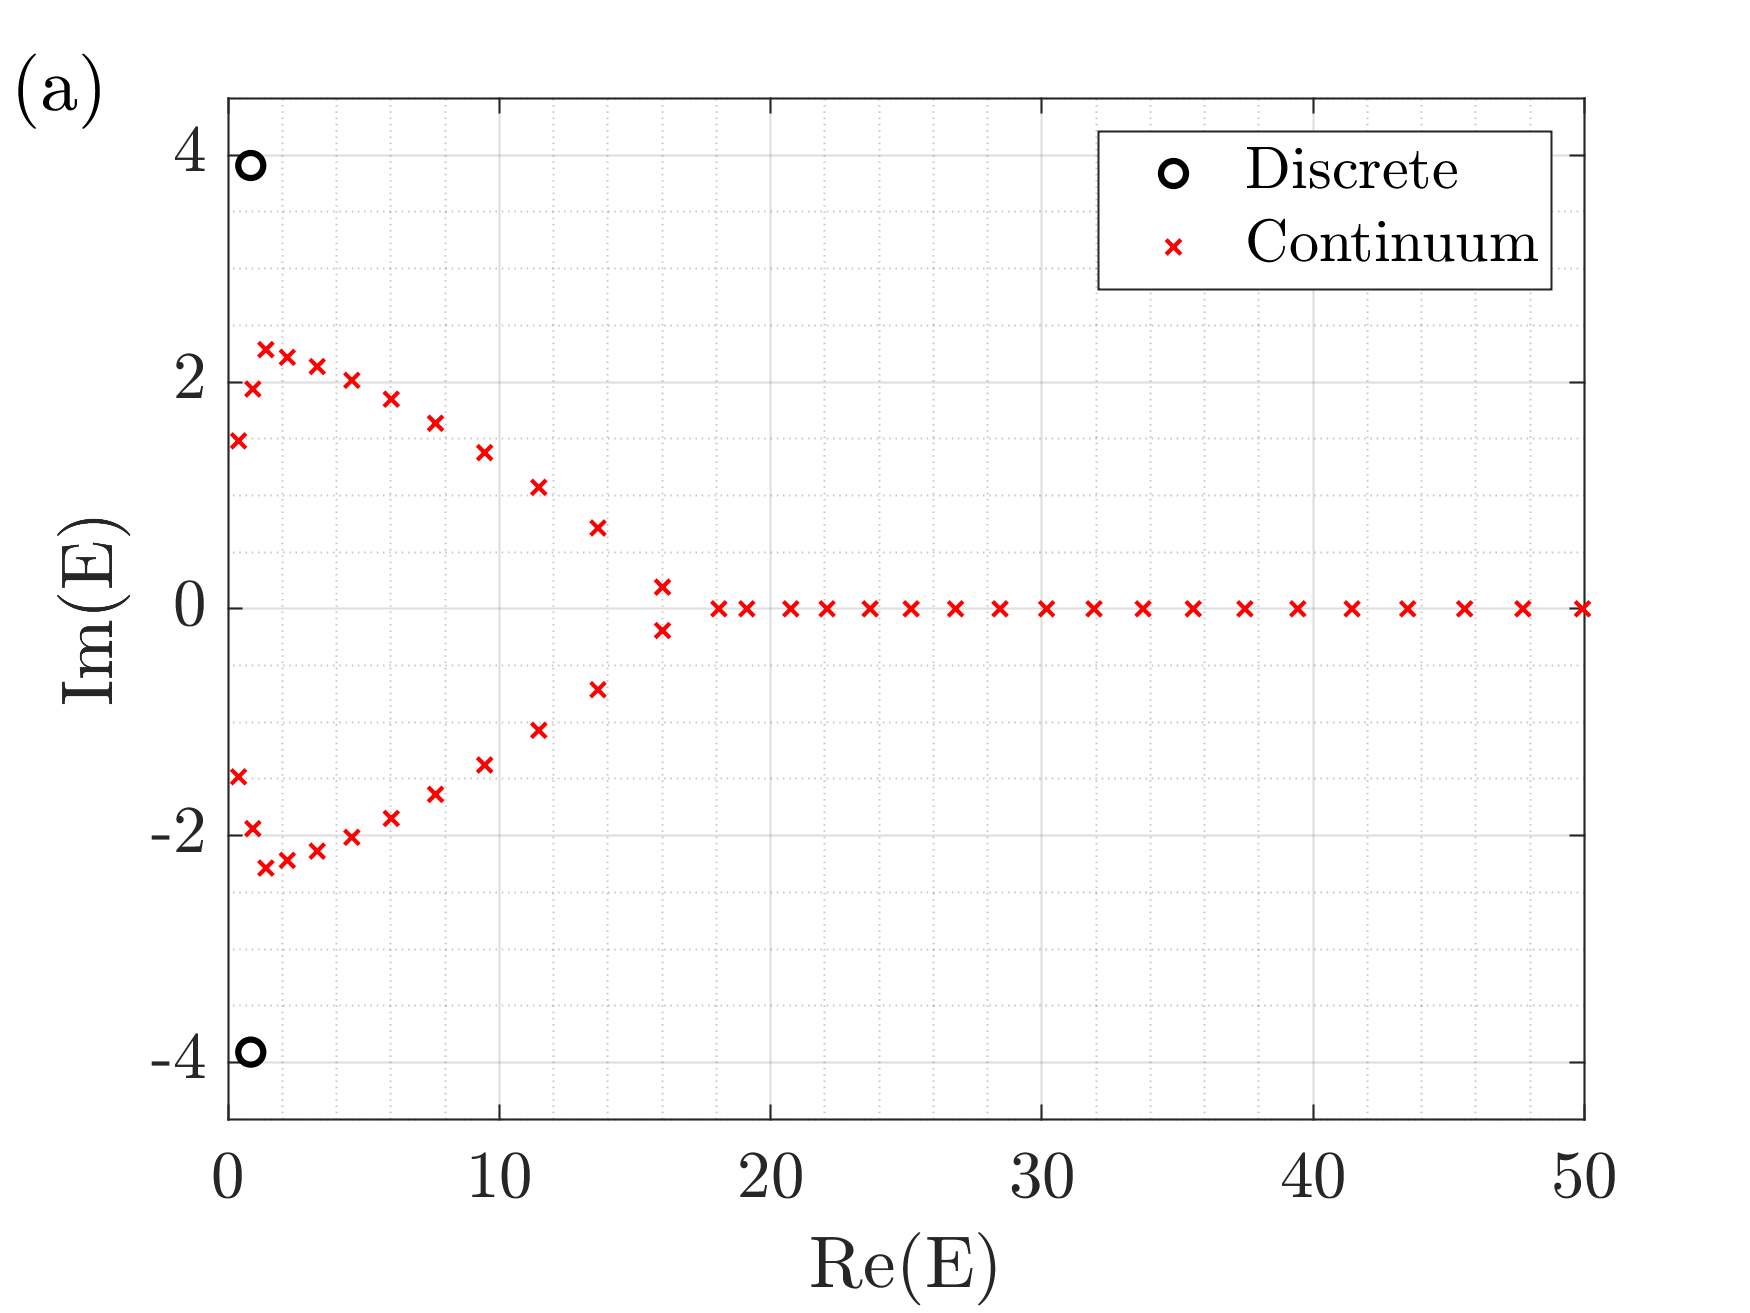
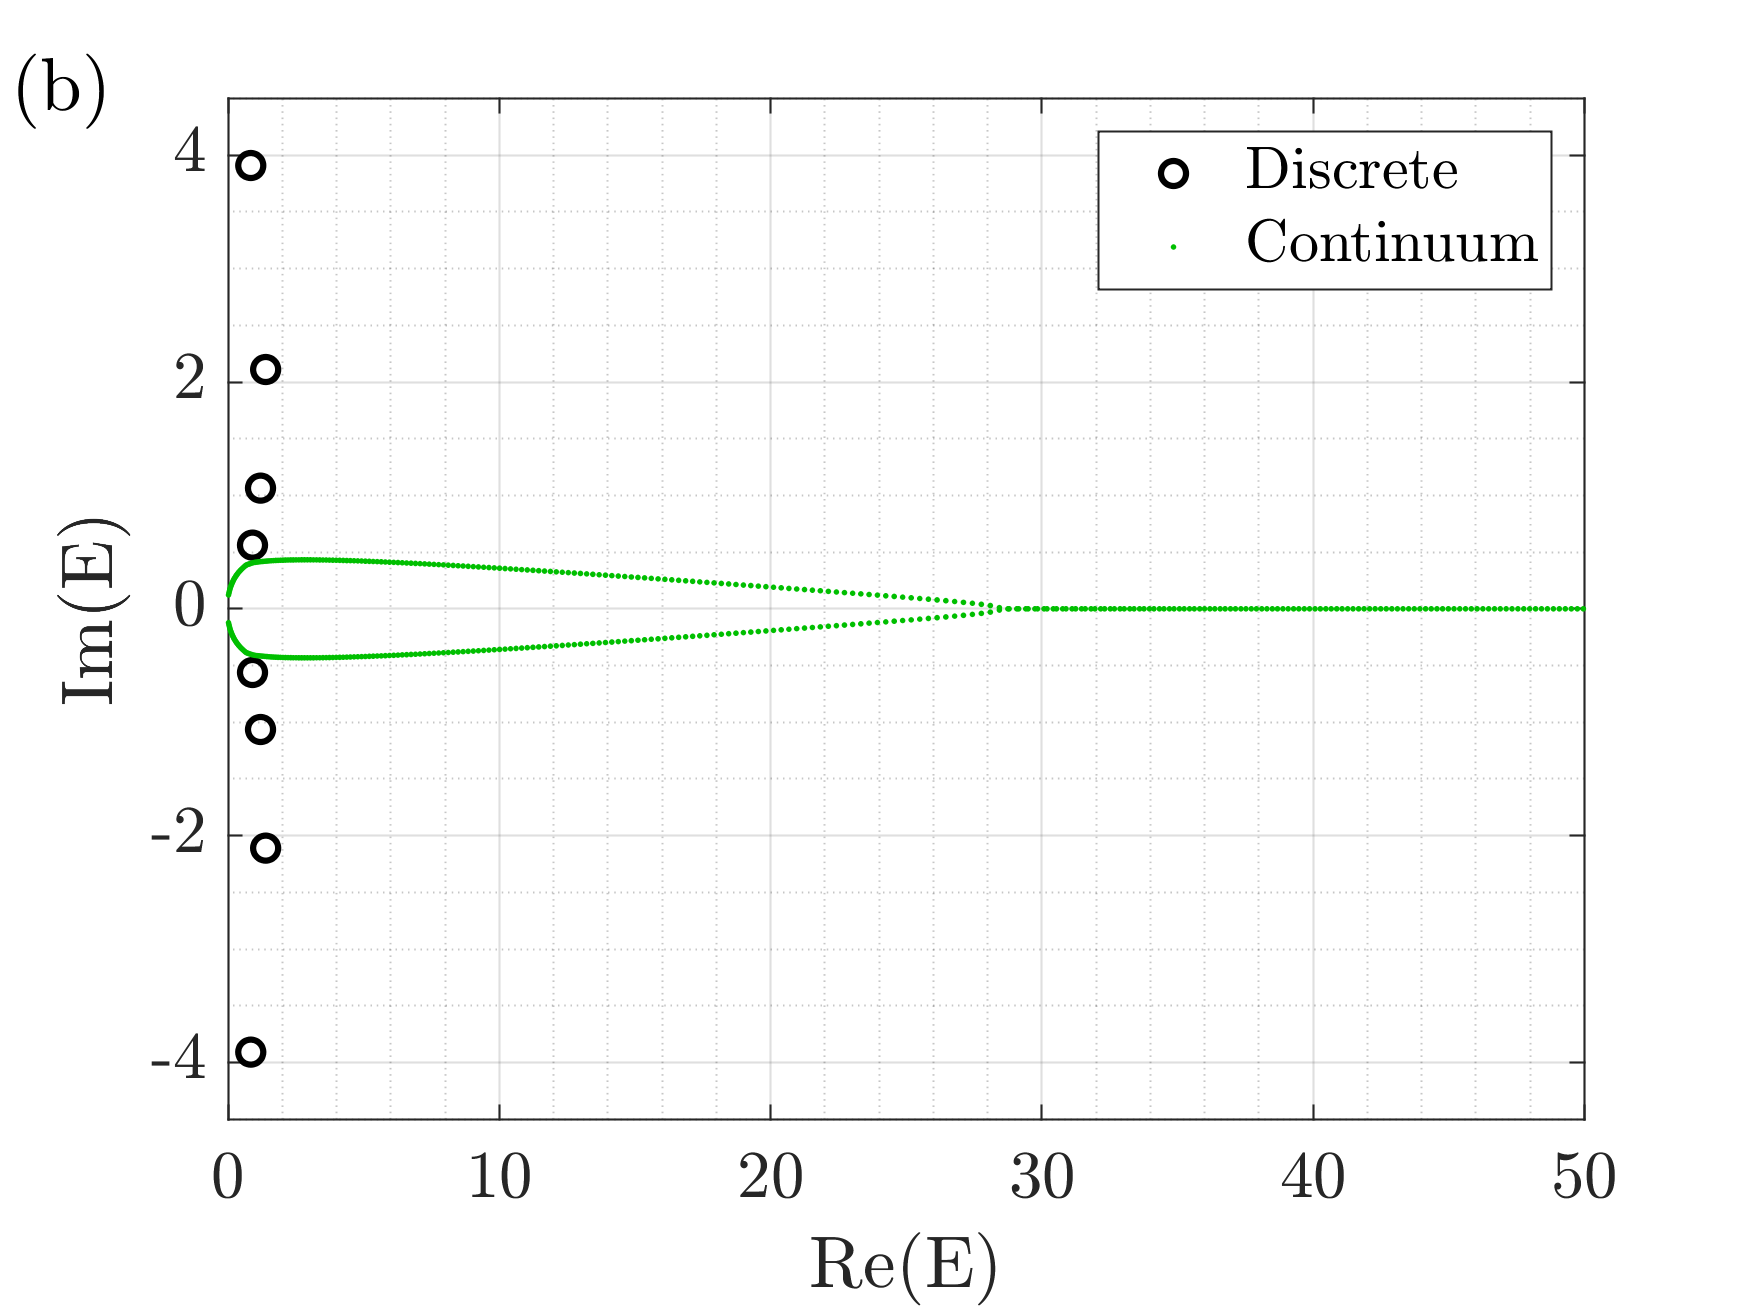
The most interesting and surprising results that we have obtained concern the eigenspectrum associated with . For this potential we take the strength parameter . Because this is a long-range potential, it is not easy to obtain accurate and trustworthy numerical results, and we have had to do the calculation in quadruple precision (for all other results in this paper double precision is sufficient). In Fig. 14 we plot the eigenvalues for in panel (a) and in panel (b). There is one pair of bound-state eigenvalues in panel (a). When we increase the size of the interval, we see in panel (b) that the continuum spectrum has dropped much closer to the real axis and has uncovered three new pairs of bound-state eigenvalues.
Figure 14 reveals two new effects that we have not observed in our studies of short-range potentials. First, the sequence of bound-state eigenvalues has turned around and is heading backward towards the origin. In Figs. 1, 5, 8, and 11 the real parts of the eigenvalues are increasing, not decreasing. Second, the transition in the continuum part of the spectrum at which the eigenvalues become real is no longer a fixed point on the real axis; rather, the transition point is moving up the real axis as increases. In panel (a) the transition is near but in panel (b) it is near .
If we increase to , Fig. 15 shows that there are now nine complex-conjugate pairs of bound-state eigenvalues (which are not easy to see clearly). This sequence of bound-state eigenvalues is tending towards the origin. To observe the bound-state eigenvalues more clearly we have replotted in Fig. 16 the data in Fig. 15 on a log-log plot. We can see on this plot that the sequence of bound-state eigenvalues is becoming linear.


To observe the transition points in the continuum part of the eigenspectrum, we have plotted the data in Figs. 14 and 15 on a logarithmic graph in Fig. 17. Note that the transition point in the continuum eigenvalues from complex to real is moving up the real axis; it is no longer fixed as it was for finite-range potentials. Observe that at the transition near there is a drop of nearly (and not ) orders of magnitude. To see this effect requires that we use quadruple and not double precision in our numerical calculations.

The most interesting aspect of the long-range potential is that it appears to confine an infinite number of bound states and the complex bound-state energies appear to be approaching . To verify this we use Richardson extrapolation [14] to study the behavior of the sequence of bound-state energies.
Richardson extrapolation enables one to find the limit of the sequence as if the limit is a finite number. Given such a sequence we can calculate more and more accurate Richardson extrapolants, which converge faster to the limiting value. The formulas for the first five Richardson extrapolants are given by
| (2) | |||||
From our numerical analysis, we have determined that the th bound-state energy has the asymptotic form
| (3) |
where and are real numbers. This shows that the bound-state eigenvalues associated with share many of the quantitative features of the Balmer series for the hydrogen atom. As indicated in the tables 1 and 2, we have determined that the numerical value of is about and the numerical value of is about . To obtain these results we have multiplied the real part of by and the imaginary part of by and computed the first five Richardson extrapolations.
| 1 | 0.83298288 | 0.83298 | 10.2355 | 26.6628 | 29.8431 | 23.8084 | 24.2927 |
|---|---|---|---|---|---|---|---|
| 2 | 1.38356468 | 5.53426 | 21.1871 | 29.0481 | 25.0154 | 24.2120 | 25.5106 |
| 3 | 1.19465086 | 10.7519 | 25.1176 | 26.6284 | 24.4798 | 25.1396 | 25.2280 |
| 4 | 0.89645517 | 14.3433 | 25.7219 | 25.5541 | 24.8568 | 25.1949 | 25.0599 |
| 5 | 0.66476032 | 16.6190 | 25.6660 | 25.2553 | 25.0258 | 25.1199 | — |
| 6 | 0.50352322 | 18.1268 | 25.5486 | 25.1692 | 25.0676 | — | — |
| 7 | 0.39157331 | 19.1871 | 25.4538 | 25.1354 | — | — | — |
| 8 | 0.31203794 | 19.9704 | 25.3830 | — | — | — | — |
| 9 | 0.25397318 | 20.5718 | — | — | — | — | — |
| 1 | 3.90859038 | 3.90859 | 29.8484 | 63.7004 | 62.5280 | 53.5920 | 61.0166 |
|---|---|---|---|---|---|---|---|
| 2 | 2.10981263 | 16.8785 | 52.4164 | 62.8211 | 55.3792 | 59.7791 | 62.5903 |
| 3 | 1.06386938 | 28.7245 | 57.6188 | 58.3560 | 58.3125 | 61.7871 | 61.3005 |
| 4 | 0.56168819 | 35.9480 | 57.9136 | 58.3342 | 60.2980 | 61.4830 | 60.9267 |
| 5 | 0.32272930 | 40.3412 | 58.0538 | 59.1758 | 60.8905 | 61.1739 | — |
| 6 | 0.20043182 | 43.2933 | 58.3744 | 59.8188 | 61.0165 | — | — |
| 7 | 0.13250064 | 45.4477 | 58.7355 | 60.2180 | — | — | — |
| 8 | 0.09200917 | 47.1087 | 59.0650 | — | — | — | — |
| 9 | 0.06644330 | 48.4372 | — | — | — | — | — |
7 Conclusions
In this paper we have studied numerically the five -symmetric potentials in (1) that have continuous spectra. Each of these potentials is pure imaginary and vanishes as . The interesting feature of these potentials is that even though they vanish at , they still confine bound states. Of course, an imaginary potential can confine bound states. For example, the potential has an infinite number of bound states [1]. However, this potential becomes stronger as . We emphasize that the five potentials that we have studied here decay and become weaker as . Even more remarkable is the fact that the potential , which decays very slowly as , binds an infinite number of bound states and that the sequence of bound-state energies asymptotically approaches the Balmer series for the hydrogen atom.
CMB thanks the Alexander von Humboldt Foundation for partial financial support.
References
- [1] C. M. Bender and S. Boettcher, Phys. Rev. Lett. 80, 5243 (1998).
- [2] C. M. Bender, S. Boettcher, and P. N. Meisinger, J. Math. Phys. 40, 2201 (1999).
- [3] P. E. Dorey, C. Dunning, and R. Tateo, J. Phys. A: Math. Gen. 34, 5679 (2001).
- [4] P. E. Dorey, C. Dunning, and R. Tateo, J. Phys. A: Math. Theor. 40, R205 (2007).
- [5] C. M. Bender, PT Symmetry: in Quantum and Classical Physics (World Scientific, Singapore, 2018).
- [6] This potential was considered in Z. Ahmed, Phys. Lett. A 282, 343 (2001) and in the next three references.
- [7] Z. Ahmed, D. Ghosh, J. A. Nathan, and G. Parkar, Phys. Lett. A 379, 2424 (2015).
- [8] J. Yang, Opt. Lett. 42, 4067 (2017).
- [9] G. Lévai, Á. Baran, P. Salamon, and T. Verste, Phys. Lett. A 381, 1936 (2017).
- [10] This potential was considered in V. V. Konotop and D. A. Zezyulin, Opt. Lett. 42, 5206 (2017).
- [11] D. N. Christodoulides and J. Yang, eds. 2018 Parity-time symmetry and its applications (Springer Tracts in Modern Physics 280).
- [12] C. M. Bender, N. Hassanpour, D. W. Hook, S. P. Klevansky, C. Sunderhauf, and Z. Wen, Phys. Rev. A 95, 052113 (2017).
- [13] L. N. Trefethen, Spectral Methods in Mattlab (Society for Industrial and Applied Mathematics, Philadelphia, 2000).
- [14] C. M. Bender and S. A. Orszag, Advanced Mathematical Methods for Scientists and Engineers (McGraw-Hill, New York, 1978), Chap. 7.