Resolving the degree of order in the bacterial
chromosome using a statistical physics approach
Abstract
While bacterial chromosomes were long thought to be amorphous, recent experiments reveal pronounced organizational features. However, the extent of bacterial chromosome organization remains unclear. Here, we develop a fully data-driven maximum entropy approach to extract the distribution of single-cell chromosome conformations from experimental normalized Hi-C data. We apply this inference to the model organism Caulobacter crescentus. On small genomic scales of - basepairs, our model reveals a pattern of local chromosome extensions that correlates with transcriptional and DNA loop extrusion activity. On larger genomic scales, we find that chromosome structure is predominantly present along the long cell axis: chromosomal loci not only have well-defined axial positions, they also exhibit long-ranged correlations due interacting large emergent genomic clusters, termed Super Domains. Finally, our model reveals information contained in chromosome structure that can guide cellular processes. Our approach can be generalized to other species, providing a principled way of analyzing spatial chromosome organization.
Chromosomes carry all information to generate a living cell. In many bacteria this information is stored on a single circular chromosome, with a length three orders of magnitude larger than the cell. This implies a major organizational problem Thanbichler and Shapiro (2006); Wang et al. (2013); Badrinarayanan et al. (2015): The DNA not only has to be condensed to fit in the bacterial cell, its organization also needs to facilitate functions such as transcription and replication. Various proteins regulate chromosome structure Dame et al. (2019); Dillon and Dorman (2010); Broedersz et al. (2014); Graham et al. (2014); Brackley et al. (2017), but it remains unclear how organized it is across all length scales. Resolving this organization requires a characterization of the distribution of single-cell chromosome conformations, posing a key challenge for experiment and theory Imakaev et al. (2015).
The classical picture in which the bacterial chromosome is arranged as an amorphous polymer has become obsolete thanks to recent experimental advances Robinett et al. (1996); Cattoni et al. (2015); Wu et al. (2019); Lieberman-Aiden et al. (2009). Indeed, fluorescence microscopy experiments revealed that chromosomal loci localize to well-defined cellular addresses in various species Teleman et al. (1998); Wiggins et al. (2010); Bates and Kleckner (2005); Lau et al. (2004), including Caulobacter crescentus Viollier et al. (2004). Further insights were obtained by chromosome conformation capture 5C/Hi-C experiments Umbarger (2012); Le and Laub (2014), measuring average pair-wise contacts between loci. These experiments revealed Chromosomal Interaction Domains (CIDs) of up to basepairs, comprising loci preferentially interacting within their domain. Various processes Marbouty et al. (2015); Lioy et al. (2018), including transcription Le and Laub (2016); Le et al. (2013), impact CID organization. On larger genomic scales, locus pairs on opposite chromosomal arms often favor a juxtaposed arrangement, induced by the loop extrusion motor SMC Le et al. (2013); Umbarger et al. (2011); Tran et al. (2017); Marbouty et al. (2015); Wang et al. (2015, 2017); Böhm et al. (2019). Despite these observations, the degree of structural order in the bacterial chromosome still remains elusive.
To exploit advances in Hi-C experiments on various bacteria Le et al. (2013); Marbouty et al. (2015); Wang et al. (2015); Lioy et al. (2018); Böhm et al. (2019); Trussart et al. (2017), a principled data-driven theoretical approach is needed. However, there are several outstanding challenges that preclude a fully data-driven model Le et al. (2013); Umbarger et al. (2011); Yildirim and Feig (2018); Imakaev et al. (2015). Hi-C data is typically normalized, and it is unclear how to relate normalized Hi-C scores to theoretical contact frequencies. Previous approaches Umbarger et al. (2011); Yildirim and Feig (2018); Oluwadare et al. (2019) rely on an assumed relation between Hi-C scores and the average spatial distance between locus pairs, and this constraint is independently enforced on each pair, ignoring correlations. Alternative methods generate configuration ensembles, e.g. using iterative maximum likelihood algorithms Tjong et al. (2016). However, Hi-C maps could be consistent with many ensembles. Thus, a principled criterium is needed to select an unbiased configuration distribution with high predictive power. For eukaryotes, an equilibrium Maximum Entropy (MaxEnt) selection method was proposed Zhang and Wolynes (2015); Di Pierro et al. (2016); Abbas et al. (2019), as used for protein structure prediction Weigt et al. (2009); Marks et al. (2011). However, such an approach may be unsuitable for chromosomes in living cells, which exhibit non-equilibrium fluctuations Weber et al. (2012); Javer et al. (2013); Smith et al. (2015). Thus, a principled and unbiased approach to derive a unique non-equilibrium model for the distribution of chromosome conformations is still lacking.
Here, we develop a fully data-driven MaxEnt approach for the bacterial chromosome based on Hi-C data. This approach infers the least-structured distribution of chromosome conformations that fits Hi-C experiments, capturing population heterogeneity at the single-cell level. Our MaxEnt model does not rely on equilibrium assumptions, it is inferred directly from normalized Hi-C scores, it does not require an assumed Hi-C—distance relation, and we determine the coarse-graining scale of our model using experiments. The MaxEnt model reveals structural features over a broad range of genomic length scales, and we quantify the positional information in the cellular location of chromosomal loci that can be used by cellular processes. Our theoretical framework may be generalized to other prokaryotic and eukaryotic species, providing a rigorous approach to resolve chromosome organization from Hi-C data.
I Maximum entropy model inferred from chromosomal contact frequencies
Our goal is to determine the ensemble of single-cell chromosome conformations for a heterogeneous cell population from experimental Hi-C data. To this end, we build on existing MaxEnt methods for analysing biophysical data Tkačik et al. (2013); Zhang and Wolynes (2015); Di Pierro et al. (2016); Marks et al. (2011); Mora et al. (2010); Bialek et al. (2012), to develop a principled approach for inferring the statistics of chromosome structure in bacteria from experiments.
The microstates of the system are defined as the set of all configurations of the chromosome contained within the cellular confinement. We seek the statistical weights , chosen to be consistent with the experimental Hi-C map. In general, however, a set of experimental constraints does not uniquely determine . The MaxEnt approach is based on selecting from these possible solutions by choosing the unique distribution with the largest Shannon entropy,
| (1) |
constituting the least-structured distribution consistent with experimental data. Put simply, we require that the only structure present in is due to experimental constraints from Hi-C scores, rather than assumed features of the underlying polymer model, the interpretation of Hi-C scores, or the ensemble-generating algorithm.
To apply the MaxEnt method to experimental Hi-C data, we employ a coarse-grained representation of the chromosome: a polymer on a 3D cubic lattice, with a subset of monomers representing genomic regions. This provides an efficient computational framework, while still capturing key organizational features. Specifically, this representation is chosen to preserve experimentally measured distance fluctuations at the coarse-graining scale (Methods and SI S1-2). At larger scales, the statistics of polymer configurations are only constrained by Hi-C data. Within this representation, a microstate is defined by the monomer positions . Two genomic regions have a contact probability if they occupy the same lattice site, and otherwise.
To obtain the least-structured distribution of configurations consistent with experiments, we seek that maximizes (Eq. (1)) under two constraints: 1) the model contact frequencies should match experimental contact frequencies between genomic regions and (the correspondence between and Hi-C scores is discussed in the next section), and 2) the distribution should be normalized. To this end, we introduce constraints to the entropy functional:
| (2) |
For each data point , there is a corresponding Lagrange multiplier , and is the Kronecker delta. In addition, the Lagrange multiplier ensures normalization. We maximize the Shannon entropy under these constraints, setting , yielding
| (3) |
with . The ’s paramatrizing are determined by solving
| (4) |
for each experimental constraint. For typical Hi-C data on a bacterial chromosome, this amounts to of order constraints Le et al. (2013). These equations can not be solved directly, as they are highly nonlinear and the state space is very large.
The daunting challenge of finding the Lagrange multipliers can be overcome by noting that the distribution in Eq. (3) can be mapped to a statistical mechanics model: a confined lattice polymer, with a (dimensionless) Hamiltonian
| (5) |
where are the effective interaction energies between overlapping loci. We numerically obtain the inverse solutions of this model using iterative Monte Carlo simulations (SI S3). Testing this algorithm on contact frequency maps generated from a set of chosen input , we find that our algorithm precisely and robustly recovers the correct input values (SI S4).
II Inferring the MaxEnt model directly from normalized Hi-C scores
A major hurdle in applying data-driven inference approaches is finding a correspondence between experimental Hi-C scores and the contact frequencies in a coarse-grained polymer model. Published Hi-C maps are typically normalized Pal et al. (2019). This normalization compensates known biases in raw Hi-C data, for instance due to the proportionality between the number of restriction sites in a genomic region and its Hi-C score. Furthermore, absolute Hi-C scores are hard to interpret because it is difficult to estimate the conversion factor to physical contact frequencies. Importantly however, even if absolute contact scores could be obtained, a mapping to contact frequencies in a coarse-grained model is challenging.
We address this conversion issue by treating the conversion factor as an unknown parameter in our MaxEnt procedure. Thus, we write , with the normalized experimental Hi-C scores. We absorb the contact probability factor into (Eq. (I)), setting , and require that maximizes the model entropy (SI S3.2), yielding the additional constraint
| (6) |
Thus, we infer the least-structured distribution of chromosome conformations from normalized Hi-C data, without assuming a conversion between Hi-C scores and contact frequencies or average distances between loci.
III MaxEnt model of the C. crescentus chromosome quantitatively captures measured cellular localization
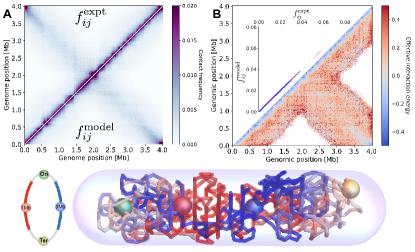
We investigate the degree of organization of the bacterial chromosome by considering newborn swarmer cells of the model organism C. crescentus. To develop the MaxEnt model, we first experimentally determine the coarse-graining scale, set by the average distance between consecutive 10 kb genomic regions (Methods SI 1-2). Subsequently, we infer the parameters of the MaxEnt model from published experimental Hi-C data (SI S5) Le et al. (2013). Our inverse algorithm robustly converges to an accurate description of the Hi-C map: the modelled and experimental contact map agree within with a Pearson’s correlation coefficient of 0.9996 (Fig. 1A, B inset).
Our MaxEnt model quantitatively reproduces essential features of the experimental Hi-C map (Fig. 1A), including the fine structure of the CIDs as well as the secondary diagonal, which is attributed to the loop extrusion activity of SMC (Structural Maintenance of the Chromosome)Wang et al. (2017); Bürmann and Gruber (2015); Miermans and Broedersz (2018); Ganji et al. (2018). The inferred ’s (Fig. 1B) should not be interpreted as physical interaction energies. Rather, they parametrize the predicted physical distribution of chromosome configurations . We can directly interpret the organizational features implied by and use it to sample single-cell configurations (Fig. 1C).
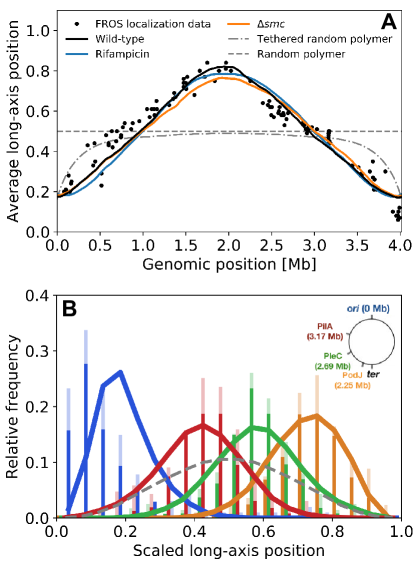
We test the predictive power of the MaxEnt model by computing the distribution of axial locations of several loci. Importantly, we do not assume (polar) cell envelope tethering of specific loci, such as the origin of replication (ori). We orient cells by setting the ori pole in the cell-half containing ori. Interestingly, we find a high degree of axial localization of loci: the average axial position of loci is roughly linearly organized, and the predicted positions match previous live-cell microscopy experiments Viollier et al. (2004) (Fig. 2A). By contrast, a confined random polymer—not constrained by Hi-C data—does not exhibit the linear organization, even when ori is tethered to the cell pole.
The MaxEnt model also predicts distributions of long-axis positions of chromosomal loci, in remarkable agreement with prior experiments (Fig. 2B). This comparison with independent experimental data constitutes a strong validation of our MaxEnt model. The slight deviation of position of ori compared to the experiment (Fig. 2A,B) can be addressed with an extended MaxEnt model that incorporates the distribution of axial ori positions as an additional constraint (SI S12). However, other aspects of the predicted chromosomal organization are largely unaffected by this modification, and therefore we will not impose this additional constraint in our analysis.
IV Large-scale chromosome organization primarily characterized by long-axis correlations due to Super Domains
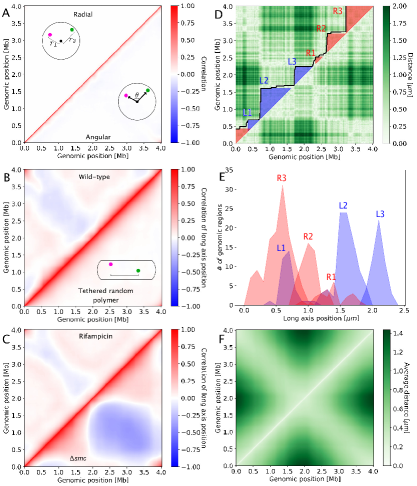
Large-scale organizational features of the chromosome can be revealed by measuring various two-point correlation functions. Earlier models suggested a three-dimensional organization in which the two chromosomal arms wind around each other with roughly one helical turn Umbarger et al. (2011); Yildirim and Feig (2018). To test if this organization also emerges in our MaxEnt model, we compute two-point correlations of angular orientations. For each chromosome segment, we assign an orientation vector in the plane perpendicular to the long axis. We find that angular correlations decay rapidly for genomic distances Mb (Fig. 3A lower right). Long-range negative correlations between the two chromosomal arms are thus negligible, indicating that a pronounced helical organization is not required to model the experimental Hi-C map.
The two-point correlation function in radial positions decays even more rapidly with genomic distance up to Mb (Fig. 3A upper left), indicating the absence of large-scale organization in this direction. By contrast, two-point correlations in the long-axis position exhibit a striking structure: we observe positive long-ranged correlations for pairs of genomic regions on the same chromosomal arm, whereas correlations in axial positions between arms are predominantly negative (Fig. 3B upper left). These long-ranged correlations signify collective behavior. Importantly, for a model with a tethered origin not constrained by Hi-C data, such organization is absent (Fig. 3B lower right).
We find that these intra-arm anticorrelations result from the spatial exclusion of large genomic clusters between the two chromosomal arms, which we term Super Domains (SuDs). SuDs emerge from a clustering analysis of genomic regions (SI S6). The formation of domain-like structures is revealed by plotting the distance between pairs of loci for a specific chromosome configuration, with domains spanning up to a quarter of chromosome length (Fig. 3D-E). On average, SuDs contain genomic regions; compared to CIDs, they are typically larger with a more variable size and genomic location across chromosome conformations. The variable and delocalized nature of SuDs is apparent from the average distance map between genomic regions, indicating no discrete structure (Fig. 3F). Importantly, SuDs forming on opposing chromosomal arms tend to spatially exclude each other (Fig. 3E): the fraction of overlap in axial positions is reduced by compared to randomly paired left and right arm configurations. This exclusion behavior translates to intra-arm anticorrelations for pairs of genomic regions with similar average axial positions.
To investigate the influence of cellular processes on long-axis organization, we perform the same analysis (SI S9) on published Hi-C data of rifampicin-treated cells and a mutant lacking SMC (smc) Le et al. (2013). Rifampicin treatment inhibits transcription, whereas SMC actively extrudes DNA loops and induces juxtaposed chromosomal arms Wang et al. (2013); Bürmann and Gruber (2015). For both cases, our models predict an average localization along the long axis similar to the wild-type (Fig. 2A). However, the predicted long-axis correlations exhibit marked differences: for rifampicin-treated cells with inhibited transcription, anticorrelations between chromosomal arms are less pronounced (Fig. 3C upper left). In contrast, smc cells display a broad regime with strong anticorrelations between loci on opposite arms (Fig. 3C lower right). These effects are reflected in the statistics of SuDs: upon inhibition of transcription, the SuDs contain 10% more genomic regions per domain than in the wild-type. Despite this increased density, the transcription-inhibited cells show a similar overlap of SuDs (16% lower than for randomly paired arms). By contrast, smc cells exhibit the same average SuD density as the wild-type, but a strong reduction of inter-arm domain overlap ( lower than for randomly paired arms). Thus, the action of SMC enhanced interactions between SuDs, whereas transcription alters their density.
V Local chromosome extension coincides with high transcription, but only for one chromosomal arm
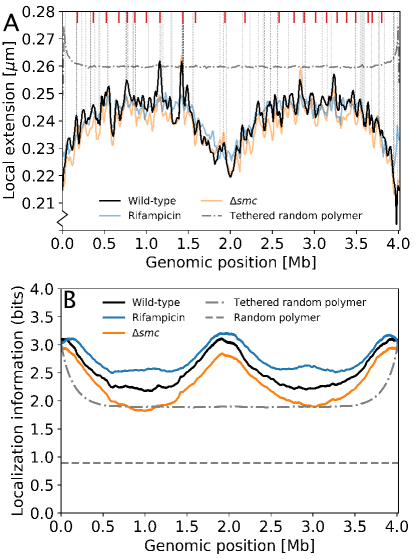
The MaxEnt model provides access to local structural features that may be difficult to determine experimentally. Specifically, we consider the local chromosomal extension , defined as the average spatial distance between two neighbouring genomic regions of region (SI S11). Interestingly, the -profile exhibits an overall trend that is lowest at ori and ter (Fig. 4A), indicating that these regions are intrinsically more compact (SI S11). In addition, pronounced peaks and valleys in local extension are revealed at a smaller genomic scale similar to that of CIDs. The same structure appears for smc cells, although their chromosome appears to be locally more compact than the wild-type. By contrast, in rifampicin-cells, peak amplitudes are significantly suppressed, suggesting a link with transcription.
Previous work reported a connection between CID boundaries and highly transcribed genes Le et al. (2013). Based on this observation and polymer simulations, it was suggested that high transcription creates plectoneme-free regions, physically separating CIDs. To further investigate the impact of gene expression activity on local structure, we compare the locations of local chromosome extension peaks in our MaxEnt model and the 2% most highly transcribed genes. Indeed, we observe a significantly increased overlap of local chromosome extension peaks and the locations of highly transcribed genes, compared to a random distribution of peaks, but only for genes on the forward strand of the right ori-ter arm (0-2.0 Mb) (SI S7). If the colocalization of local extension peaks by highly transcribed genes would only depend on the relative direction of transcription and replication, this should also occur for highly transcribed genes on backward strands on the left arm, which we do not observe. Thus a feature is required to break this symmetry. While our results indicate a connection between high local chromosome extension and the direction of replication and transcription of highly transcribed genes, the underlying molecular mechanism is still unclear.
VI Chromosomal structure provides positional information in the cell
The inferred structural features of the chromosome not only yield insights into cellular organization, they may also have functional significance: organizational features provide information that could guide cellular processes. For example, proteins with a high relative affinity to certain genomic regions will be positioned more precisely within the cell. In addition, this information may enable a mechanism to position protein droplets Shin and Brangwynne (2017), by nucleating on specific chromosomal regions, as e.g. suggested for clusters of DNA-binding chromosome partitioning proteins Broedersz et al. (2014).
Using our MaxEnt model, we can quantify how much localization information (SI S10) Dubuis et al. (2013) is encoded by chromosome organization per genomic regions (Fig. 4B). The information is largest near ori and ter, providing 3 bits of localization information, equivalent to reducing the positional uncertainty to one cellular octant. Comparing these results with those for modified conditions, we find that rifampicin treatment increases localization information, whereas information is reduced in smc cells, suggesting that SMC action and transcription have opposing effects on localization information. This localization information is just one example of how structural features in the organization of the chromosome can be used to guide cellular processes. The MaxEnt approach provides a scheme to estimate the information available to the cell that is contained in the distribution of chromosome conformations.
VII Discussion
We established a fully data-driven principled approach to infer the spatial organization of the bacterial chromosome at the single-cell level, and applied this approach to normalized Hi-C data of the model organism C. crescentus. The predictive power of this MaxEnt model is confirmed by prior microscopy experiments Viollier et al. (2004) showing the distributions of axial positions of chromosomal loci within the cell. This approach could, however, also be extended towards an integrated MaxEnt model, simultaneously constrained by both Hi-C and such microscopy data (SI S12). Contrary to previous modelling approaches, our MaxEnt model does not rely on an assumed connection between Hi-C scores and average spatial distances Umbarger (2012). Instead, we can predict how these quantities are related: we find an approximate linear trend between intra-arm genomic distance and spatial distance (SI S8). However, there are substantial deviations from this trend, together with significant correlations in distances between genomic regions. Previous approaches could not account for such deviations and correlations. This may explain differences in model predictions such as the helical structure suggested in Umbarger et al. (2011); Yildirim and Feig (2018), which we do not observe.
By design, the MaxEnt model yields the least-structured distribution of chromosome conformations consistent with Hi-C experiments, allowing us to investigate the degree of order in the bacterial chromosome. To extract structural information from the MaxEnt model, we considered two-point correlation functions in the cellular positions of genomic regions. While we observe negligible radial and angular correlations, there are pronounced long-ranged correlations along the long cell axi, indicating collective behavior. This structure is related to the observation of variable and delocalized clusters of genomic regions, which we term Super Domains (SuDs). These SuDs might reflect blob-like structures observed with microscopy in Bacillus subtilis Marbouty et al. (2015) and Escherichia coli Wu et al. (2019). Our MaxEnt model indicates a spatial exclusion of opposing SuDs from different chromosomal arms, resulting in longe-ranged anticorrelations in axial positions. Transcription and SMC have opposing effects on SuD properties: inter-arm overlap between domains is reduced by transcription and increased by SMC, consistent with the idea that SMC links chromosomal arms Marbouty et al. (2015); Wang et al. (2015, 2017); Bürmann and Gruber (2015). At the smaller genomic scale of CIDs, we observe a characteristic pattern of local chromosomal extensions, being most compact at ori and ter. The compaction of the ori region may be due to the ParABS chromosome partitioning system Broedersz et al. (2014); Graham et al. (2014). However, it is still unclear if C. crescentus contains other nucleoid-associated proteins Dame et al. (2019); Dillon and Dorman (2010) that are involved in the compaction of other chromosomal regions such as ter. Interestingly, peaks in local extension tend to coincide with highly transcribed genes, but only for the forward strand of the right chromosomal arm (SI S7).
Using our MaxEnt model we estimated the cellular location information per genomic region. This information reaches up to 3 bits around ori and ter, equivalent to a positional uncertainty in the cell of one cellular octant. We speculate that such positional information encoded by the organization of the chromosome could be exploited for sub-cellular positioning of proteins and protein droplets. Our approach may be extended to other prokaryotes as well as eukaryotes, paving the road for unraveling an unprecedented amount of information on chromosome conformations at multiple length scales, elucidating single-cell variability and population averages.
VIII Acknowledgement
We thank Ben Machta for inspiring discussions, Karsten Miermans and Lucas Tröger for valuable input for the simulations, and Maritha Lippmann for excellent technical assistance. This research was funded by the Deutsche Forschungsgemeinschaft (DFG, German Research Foundation, Project 269423233 - TRR174). J.M. is supported by a DFG fellowship within the Graduate School of Quantitative Biosciences Munich (QBM).
IX Methods
Here, we consider Hi-C data on C. crescentus newborn swarmer cells Le et al. (2013), which have a single, non-replicating chromosome. Our algorithm (SI 3,4) requires two length scales: the dimensions of the cellular confinement and the lattice spacing. As a cellular confinement, we use a cylinder capped with hemispheres with the dimensions of a newborn swarmer cell minus the cell envelope: (SI S1-2). A more detailed representation of the cellular confinement shape does not appear to affect our main results (SI S12). To set the coarse-graining scale of our MaxEnt model, we experimentally determined the distribution of spatial distances between subsequent Hi-C bins. Specifically, the lattice spacing, , is set by the average spatial distance between consecutive 10kb regions (the Hi-C bin size). To determine this parameter, we probed the physical distance of two loci separated by 10kb in five different regions of the chromosome, using an approach comparable to Hensel et al. (2013); Gaal et al. (2016). To this end, we constructed strains whose chromosomes contained two independent arrays of transcription factor binding sites (comprising 10 LacI or TetR binding sites, respectively) inserted at the proper distance (SI S1). The sub-cellular positions of these arrays were then visualized by producing the respective fluorescently labeled transcription factors (LacI-eCFP and TetR-eYFP) at very low levels, based solely on the basal activity of the inducible promoter driving their expression. Swarmer cells were imaged immediately after isolation, and the localization of the two arrays was determined with sub-pixel precision by fitting a 2D Gaussian to the acquired images. The Euclidean distances between the two arrays were calculated, taking into account correction factors for a systematic shift produced by the set-up (see Methods for further details) and are shown in (Table S5). The average distance between genomic loci 10 kb apart was found to be nm, implying a lattice spacing nm (SI S2).
References
- Thanbichler and Shapiro (2006) M. Thanbichler and L. Shapiro, Journal of Structural Biology 156, 292 (2006), ISSN 1047-8477.
- Wang et al. (2013) X. Wang, P. M. Llopis, and D. Z. Rudner, Nature Reviews Genetics 14, 191 (2013), ISSN 14710056.
- Badrinarayanan et al. (2015) A. Badrinarayanan, T. B. K. Le, and M. T. Laub, Annual Review of Cell and Developmental Biology 31, 171 (2015), ISSN 1081-0706, URL https://doi.org/10.1146/annurev-cellbio-100814-125211.
- Dame et al. (2019) R. T. Dame, F.-Z. M. Rashid, and D. C. Grainger, Nature Reviews Genetics 25, 1 (2019), ISSN 1471-0064.
- Dillon and Dorman (2010) S. C. Dillon and C. J. Dorman, Nature Reviews Microbiology 8, 185 (2010), ISSN 1740-1534.
- Broedersz et al. (2014) C. P. Broedersz, X. Wang, Y. Meir, J. J. Loparo, D. Z. Rudner, and N. S. Wingreen, Proceedings of the National Academy of Sciences of the United States of America 111, 8809 (2014), ISSN 10916490.
- Graham et al. (2014) T. G. Graham, X. Wang, D. Song, C. M. Etson, A. M. van Oijen, D. Z. Rudner, and J. J. Loparo, Genes and Development 28, 1228 (2014), ISSN 15495477.
- Brackley et al. (2017) C. A. Brackley, J. Johnson, D. Michieletto, A. N. Morozov, M. Nicodemi, P. R. Cook, and D. Marenduzzo, Physical Review Letters 119, 138101 (2017), ISSN 10797114, eprint 1612.07256.
- Imakaev et al. (2015) M. V. Imakaev, K. M. Tchourine, S. K. Nechaev, and L. A. Mirny, Soft Matter 11, 665 (2015), ISSN 17446848, eprint 1404.0763.
- Robinett et al. (1996) C. C. Robinett, A. Straight, G. Li, C. Willhelm, G. Sudlow, A. Murray, and A. S. Belmont, The Journal of Cell Biology 135, 1685 (1996), ISSN 0021-9525, URL https://doi.org/10.1083/jcb.135.6.1685.
- Cattoni et al. (2015) D. I. Cattoni, A. Valeri, A. Le Gall, and M. Nollmann, Trends in Genetics 31, 454 (2015), ISSN 0168-9525, URL https://doi.org/10.1016/j.tig.2015.05.011.
- Wu et al. (2019) F. Wu, A. Japaridze, X. Zheng, J. Wiktor, J. W. J. Kerssemakers, and C. Dekker, Nature Communications 10, 2194 (2019), ISSN 2041-1723, URL https://doi.org/10.1038/s41467-019-10221-0.
- Lieberman-Aiden et al. (2009) E. Lieberman-Aiden, N. L. Van Berkum, L. Williams, M. Imakaev, T. Ragoczy, A. Telling, I. Amit, B. R. Lajoie, P. J. Sabo, M. O. Dorschner, et al., Science 326, 289 (2009), ISSN 00368075.
- Teleman et al. (1998) A. A. Teleman, P. L. Graumann, D. C. H. Lin, A. D. Grossman, and R. Losick, Current Biology 8, 1102 (1998), ISSN 09609822.
- Wiggins et al. (2010) P. A. Wiggins, K. C. Cheveralls, J. S. Martin, R. Lintner, and J. Kondev, Proceedings of the National Academy of Sciences 107, 4991 (2010), ISSN 0027-8424.
- Bates and Kleckner (2005) D. Bates and N. Kleckner, Cell 121, 899 (2005), ISSN 00928674.
- Lau et al. (2004) I. F. Lau, S. R. Filipe, B. Søballe, O. A. Økstad, F. X. Barre, and D. J. Sherratt, Molecular Microbiology 49, 731 (2004), ISSN 0950382X.
- Viollier et al. (2004) P. H. Viollier, M. Thanbichler, P. T. McGrath, L. West, M. Meewan, H. H. McAdams, and L. Shapiro, Proceedings of the National Academy of Sciences of the United States of America 101, 9257 (2004), ISSN 00278424.
- Umbarger (2012) M. A. Umbarger, Methods 58, 212 (2012), ISSN 10462023.
- Le and Laub (2014) T. B. K. Le and M. T. Laub, Current Opinion in Microbiology 22, 15 (2014), ISSN 1369-5274, URL http://www.sciencedirect.com/science/article/pii/S1369527414001349.
- Marbouty et al. (2015) M. Marbouty, A. Le Gall, D. I. Cattoni, A. Cournac, A. Koh, J. B. Fiche, J. Mozziconacci, H. Murray, R. Koszul, and M. Nollmann, Molecular Cell 59, 588 (2015), ISSN 10974164.
- Lioy et al. (2018) V. S. Lioy, A. Cournac, M. Marbouty, S. Duigou, J. Mozziconacci, O. Espéli, F. Boccard, and R. Koszul, Cell 172, 771 (2018), ISSN 10974172.
- Le and Laub (2016) T. B. K. Le and M. T. Laub, The EMBO journal 35, 1582 (2016), ISSN 1460-2075.
- Le et al. (2013) T. B. K. Le, M. V. Imakaev, L. A. Mirny, and M. T. Laub, Science 342, 731 (2013), ISSN 10959203.
- Umbarger et al. (2011) M. A. Umbarger, E. Toro, M. A. Wright, G. J. Porreca, D. Bau, S.-H. Hong, M. J. Fero, L. J. Zhu, M. A. Marti-Renom, and H. H. McAdams, Molecular cell 44, 252 (2011), ISSN 1097-2765.
- Tran et al. (2017) N. T. Tran, M. T. Laub, and T. B. K. Le, Cell Reports 20, 2057 (2017), ISSN 2211-1247, URL https://doi.org/10.1016/j.celrep.2017.08.026.
- Wang et al. (2015) X. Wang, T. B. K. Le, B. R. Lajoie, J. Dekker, M. T. Laub, and D. Z. Rudner, Genes & development 29, 1661 (2015), ISSN 0890-9369.
- Wang et al. (2017) X. Wang, H. B. Brandão, T. B. K. Le, M. T. Laub, and D. Z. Rudner, Science 355, 524 (2017), URL http://science.sciencemag.org/content/355/6324/524.abstract.
- Böhm et al. (2019) K. Böhm, G. Giacomelli, A. Schmidt, A. Imhof, R. Koszul, M. Marbouty, and M. Bramkamp, bioRxiv p. 649749 (2019).
- Trussart et al. (2017) M. Trussart, E. Yus, S. Martinez, D. Baù, Y. O. Tahara, T. Pengo, M. Widjaja, S. Kretschmer, J. Swoger, S. Djordjevic, et al., Nature Communications 8, 14665 (2017), ISSN 2041-1723, URL https://doi.org/10.1038/ncomms14665.
- Yildirim and Feig (2018) A. Yildirim and M. Feig, Nucleic Acids Research 46, 3937 (2018), ISSN 13624962.
- Oluwadare et al. (2019) O. Oluwadare, M. Highsmith, and J. Cheng, Biological procedures online 21, 7 (2019), ISSN 1480-9222.
- Tjong et al. (2016) H. Tjong, W. Li, R. Kalhor, C. Dai, S. Hao, K. Gong, Y. Zhou, H. Li, X. J. Zhou, M. A. Le Gros, et al., Proceedings of the National Academy of Sciences of the United States of America 113, E1663 (2016), ISSN 10916490.
- Zhang and Wolynes (2015) B. Zhang and P. G. Wolynes, Proceedings of the National Academy of Sciences of the United States of America 112, 6062 (2015), ISSN 10916490.
- Di Pierro et al. (2016) M. Di Pierro, B. Zhang, E. L. Aiden, P. G. Wolynes, and J. N. Onuchic, Proceedings of the National Academy of Sciences of the United States of America 113, 12168 (2016), ISSN 10916490.
- Abbas et al. (2019) A. Abbas, X. He, J. Niu, B. Zhou, G. Zhu, T. Ma, J. Song, J. Gao, M. Q. Zhang, and J. Zeng, Nature Communications 10, 2049 (2019), ISSN 20411723.
- Weigt et al. (2009) M. Weigt, R. A. White, H. Szurmant, J. A. Hoch, and T. Hwa, Proceedings of the National Academy of Sciences of the United States of America 106, 67 (2009), ISSN 0027-8424.
- Marks et al. (2011) D. S. Marks, L. J. Colwell, R. Sheridan, T. A. Hopf, A. Pagnani, R. Zecchina, and C. Sander, PloS one 6, e28766 (2011), ISSN 1932-6203.
- Weber et al. (2012) S. C. Weber, A. J. Spakowitz, and J. A. Theriot, Proceedings of the National Academy of Sciences of the United States of America 109, 7338 (2012), ISSN 0027-8424.
- Javer et al. (2013) A. Javer, Z. Long, E. Nugent, M. Grisi, K. Siriwatwetchakul, K. D. Dorfman, P. Cicuta, and M. C. Lagomarsino, Nature communications 4, 3003 (2013), ISSN 2041-1723.
- Smith et al. (2015) K. Smith, B. Griffin, H. Byrd, F. C. MacKintosh, and M. L. Kilfoil, Soft matter 11, 4396 (2015).
- Tkačik et al. (2013) G. Tkačik, O. Marre, T. Mora, D. Amodei, M. J. Berry II, and W. Bialek, Journal of Statistical Mechanics: Theory and Experiment 2013, P03011 (2013), ISSN 1742-5468.
- Mora et al. (2010) T. Mora, A. M. Walczak, W. Bialek, and C. G. Callan, Proceedings of the National Academy of Sciences of the United States of America 107, 5405 (2010), ISSN 0027-8424.
- Bialek et al. (2012) W. Bialek, A. Cavagna, I. Giardina, T. Mora, E. Silvestri, M. Viale, and A. M. Walczak, Proceedings of the National Academy of Sciences of the United States of America 109, 4786 (2012), ISSN 0027-8424.
- Pal et al. (2019) K. Pal, M. Forcato, and F. Ferrari, Biophysical Reviews 11, 67 (2019), ISSN 18672469.
- Bürmann and Gruber (2015) F. Bürmann and S. Gruber, Nature Structural and Molecular Biology 22, 653 (2015), ISSN 15459985, URL http://dx.doi.org/10.1038/nsmb.3082.
- Miermans and Broedersz (2018) C. A. Miermans and C. P. Broedersz, Journal of the Royal Society Interface 15, 20180495 (2018), ISSN 1742-5689.
- Ganji et al. (2018) M. Ganji, I. A. Shaltiel, S. Bisht, E. Kim, A. Kalichava, C. H. Haering, and C. Dekker, Science 360, 102 (2018), ISSN 0036-8075, URL https://www.sciencemag.org/lookup/doi/10.1126/science.aar7831.
- Shin and Brangwynne (2017) Y. Shin and C. P. Brangwynne, Science 357, eaaf4382 (2017), URL http://science.sciencemag.org/content/357/6357/eaaf4382.abstract.
- Dubuis et al. (2013) J. O. Dubuis, G. Tkacik, E. F. Wieschaus, T. Gregor, and W. Bialek, Proceedings of the National Academy of Sciences 110, 16301 (2013), ISSN 0027-8424, URL http://www.pnas.org/cgi/doi/10.1073/pnas.1315642110.
- Hensel et al. (2013) Z. Hensel, X. Weng, A. C. Lagda, and J. Xiao, PLoS biology 11, e1001591 (2013), ISSN 1545-7885.
- Gaal et al. (2016) T. Gaal, B. P. Bratton, P. Sanchez-Vazquez, A. Sliwicki, K. Sliwicki, A. Vegel, R. Pannu, and R. L. Gourse, Genes & development 30, 2272 (2016), ISSN 0890-9369.