Comparative intra-night optical variability of X-ray and -ray detected narrow-line Seyfert 1 galaxies
Abstract
In a systematic program to characterise the intra-night optical variability (INOV) of different classes of narrow-line Seyfert 1 galaxies (NLSy1s), we report here the first comparative INOV study of NLSy1 sets detected in the X-ray and -ray bands. Our sample consists of 18 sources detected in X-ray but not in -rays (hereafter xNLSy1s) and 7 sources detected in -rays (hereafter gNLSy1s), out of which 5 are detected also in X-rays. We have monitored these two sets of NLSy1s, respectively, in 24 and 21 sessions of a minimum of 3 hours duration each. The INOV duty cycles for these two sets are found to be 12% and 53%, respectively (at a 99% confidence level). In the set of 18 xNLSy1s, INOV duty cycle is found to be zero for the 13 radio-quiet members (monitored in 14 sessions) and 43% for the 5 radio-loud members (10 sessions). The latter is very similar to the aforementioned duty cycle of 53% found here for the set of gNLSy1s (all of which are radio-loud). Thus it appears that the radio loudness level is the prime factor behind the INOV detection and the pattern of the high-energy radiation plays only a minor role.
keywords:
surveys – galaxies: active – galaxies: jets – galaxies: photometry – galaxies: Seyfert – gamma-rays: galaxies.1 Introduction
The unexpected discovery of -ray emissions from Narrow-line Seyfert 1 (NLSy1) galaxies (Abdo et al., 2009a, b, c; Foschini et al., 2010; Foschini, 2011; D’Ammando et al., 2012, 2015; Yao et al., 2015; Yang et al., 2018; Paliya et al., 2018; Yao et al., 2019) and the realisation that essentially all of them have detection () in the radio band too (Komossa et al., 2006; Yuan et al., 2008; Yao et al., 2015; Kynoch et al., 2018; Lähteenmäki et al., 2018), suggesting a possible relationship between some NLSy1s and blazars. This hypothesis is further corroborated by the finding that the Spectral Energy Distributions (SEDs) of some NLSy1 galaxies show the canonical double-humped profile such that the lower energy hump representing the relativistic jet’s synchrotron emissions peaks somewhere between the near-infrared and X-ray frequencies. Among blazars, such a wide range in the synchrotron hump’s peak frequency () is observed only for their subset called BL Lac objects. BL Lacs having in the X-ray band are called HBLs and they are preferentially picked up in X-ray surveys. In contrast, BL Lacs with falling in the near-infrared/optical part of SED are called LBLs and they form a vast majority of the BL Lacs found in radio surveys (Urry & Padovani, 1995). For almost two decades it is known that, in comparison to LBLs, HBLs exhibit distinctly milder optical flux variability, both on hour-like (Heidt & Wagner, 1998; Romero et al., 1999) and longer time scales (Jannuzi et al., 1993, 1994; Xie et al., 1996); the former being termed as Intra-Night Optical Variability (INOV) (Gopal-Krishna et al., 1995). Further, it is found that the difference in INOV persists even when only the TeV detected subsets of HBLs are considered (Gopal-Krishna et al., 2011). Since the entire synchrotron hump of the AGN SED has normally been attributed to the same population of radiating relativistic electrons, the difference between the optical variability of LBLs and HBLs has sometimes been attributed to the magnetic field, by postulating a stronger field in the jets of HBLs, which would tend to suppress the plasma turbulence in them, leading to their milder INOV (Sambruna et al., 1995; Romero et al., 1999). However, the real situation could be more complex.
From the SWIFT near-infrared imaging of jets of the blazars 3C 273 and PKS 1136135, it has been inferred that the optical emission component of the SED is synchrotron emission arising from two distinct populations of relativistic particles, one linked to the radio emission and the other to the X-ray emission, the latter component could even be dominated by contribution from relativistic protons (Jester et al., 2006; Uchiyama et al., 2006; Cara et al., 2013). This raises the possibility that HBLs could differ from LBLs in a more fundamental way and, if so, then the physical difference may even be mirrored in NLSy1 galaxies. Assuming that a possible X-ray linked optical synchrotron component is more likely to provide a substantial, if not a dominant, contribution in an X-ray detected sample of NLSy1s, a possible way to assess the competing physical scenarios reported above is by comparing the INOV characteristics of different NLSy1 samples exhibiting different high energy properties; this is the approach we propose in the present work.
NLSy1 galaxies are characterised by the narrow width of optical Balmer emission line, with FWHM(H) 2000 km s-1 (Osterbrock & Pogge, 1985; Goodrich et al., 1989) and a flux ratio [O 3 (Shuder & Osterbrock, 1981). Moreover, with some possible exceptions, they exhibit strong [Fe VII] and [Fe X] line emissions (Pogge, 2011) and strong permitted lines of the optical/UV Fe ii emission (Boroson & Green, 1992; Grupe et al., 1999). They also show a steep soft X-ray spectrum (Boller et al., 1996; Wang et al., 1996; Grupe et al., 1998), rapid X-ray and optical flux variability (Leighly, 1999; Komossa & Meerschweinchen, 2000; Miller et al., 2000; Klimek et al., 2004), and a frequently observed blue-shifted line profile (Zamanov et al., 2002; Leighly & Moore, 2004; Boroson, 2005). Observations suggest that, compared to radio galaxies, NLSy1 galaxies tend to possess less massive central black holes and higher Eddington ratios (defined as the ratio of bolometric-to-Eddington luminosities, R) as compared to broad-line Seyfert galaxies (BLSy1s) and radio-quiet QSOs (e.g. see, Boroson & Green, 1992; Pounds et al., 1995; Sulentic et al., 2000; Boroson, 2002; Collin & Kawaguchi, 2004). In addition, NLSy1 galaxies exhibit the radio-loud/radio-quiet bimodality displayed by QSOs and are also mostly radio-quiet (Kellermann et al., 2016, and references therein). The fraction of radio-loud NLSy1s (RL-NLSy1s), with the radio-loudness parameter111Radio-loudness is usually parametrised by the ratio (R) of the rest frame flux densities at 5 GHz and at 4400Å, being R 10 and 10 for radio-quiet and radio-loud quasars, respectively (e.g. see, Visnovsky et al., 1992; Stocke et al., 1992; Kellermann et al., 1994, 1989). R 10 is only 7% (Komossa et al., 2006; Zhou et al., 2006; Rakshit et al., 2017; Singh & Chand, 2018), dropping further to just 2-3 percent for R 100 (Komossa et al., 2006, see also, Zhou & Wang, 2002; Yuan et al., 2008). Comprehensive information on radio properties of NLSy1 galaxies can be found in Lister (2018).
Liu et al. (2010) reported the first detection of INOV in a -ray detected NLSy1, which showed that the NLSy1 galaxy J094857.30002224.0 exhibits INOV amplitude as large as 0.5 mag on a timescale of several hours. Similarly, for 3 Fermi-Large Area Telescope (Fermi-LAT)222https://heasarc.gsfc.nasa.gov/docs/heasarc/missions/fermi.html -ray detected NLSy1s, viz., J032441.20341045.0, J094857.30002224.0 and J150506.48032630.8, Paliya et al. (2013) have reported INOV with amplitude 3% within a few hours, occurring with a very high duty cycle of 85%. Recently, Kshama et al. (2017) have compared the INOV properties of different classes of NLSy1s, consisting of -ray-loud NLSy1s (GL-NLSy1s, 4 sources), -ray-quiet NLSy1s (GQ-NLSy1s, 4 sources) and radio-quiet NLSy1s (RQ-NLSy1s, 4 sources). They found the INOV duty cycles (DCs) to be, respectively, 52% and 39% for GL-NLSy1s and GQ-NLSy1s, while none of the RQ-NLSy1s showed INOV even at a modest (95%) confidence level. We note that among their GL-NLSy1s and GQ-NLSy1s, a large fraction (viz., 100% and 50%, respectively) is radio-loud, supporting the inference that radio loudness is the hallmark of strong INOV in these AGNs.
On the other hand, a recent study of three -ray detected NLSy1s by Ojha et al. (2019) has indicated that superluminal motion in the radio-jet might be a more robust diagnostic of INOV. Therefore, it would be interesting to examine among NLSy1s, whether the INOV has any link to other observed properties besides the radio-loudness and superluminal motion, such as high-energy radiation in X-ray and/or -ray bands. This is made possible by the fact that many NLSy1s have now been detected in the X-ray and/or -ray bands, thanks to the various X-ray missions and the Fermi-LAT. Starting from the compilation of 76 NLSy1s by Foschini (2011), we have carried out a study of the INOV characteristics of 18 NLSy1s detected in X-rays but not in -rays (five of which are radio-loud), and 7 NLSy1 galaxies currently known to have a -rays detection (all of which are found to be radio-loud).
The paper is organised as follows. In Sect. 2 we present an outline of our sample of NLSy1 galaxies. Sect. 3 describes their intranight optical monitoring and the data reduction procedure. Details of the statistical analysis are provided in Sect. 4, while our main results followed by a brief discussion are presented in Sect. 5.
| SDSS Name333Monitored with the 1.04m Sampurnanand Telescope (ST) and also with the 1.3m DFOT (⋆). Monitored with the 1.04m ST only (†). The remaining sources were monitored using the 1.3m DFOT alone. | B-mag444 Optical B-band magnitudes are taken from Foschini (2011), except for two gNLSy1s, viz., J122222.99041315.9 and J164442.53261913.3, for which the USNO-A2.0 catalog was used (Monet, 1998). | z555 Emission redshifts values are taken from Foschini (2011), except for the gNLSy1s, viz., J122222.99041315.9 and J164442.53261913.3, for which the Sloan Digital Sky Survey release 10 (SDSS DR-10, Ahn et al., 2014) catalogue was used. | 666 values are taken from Foschini (2011), except for J164442.53261913.3 for which the value is taken from Yuan et al. (2008) and J122222.99041315.9 for which is estimated using a core flux density of 0.6 Jy at 1.4 GHz (Yuan et al., 2008). The sources with are termed here as radio-loud (e.g., see Sect. 2). |
| (1) | (2) | (3) | (4) |
| xNLSy1s | |||
| J071340.30382039.8 | 15.10 | 0.123 | 20 |
| J073623.14392617.9 | 16.88 | 0.118 | 3 |
| J075245.60261735.9 | 17.06 | 0.082 | 2 |
| ⋆J080638.98724820.5 | 16.50 | 0.098 | 41 |
| J093703.02361537.1 | 17.99 | 0.180 | 12 |
| J100541.85433240.2 | 16.87 | 0.179 | 4 |
| ⋆J101000.70300321.6 | 17.23 | 0.256 | 2 |
| J140516.22255533.9 | 15.46 | 0.165 | 1 |
| †J140827.81240924.8 | 16.96 | 0.130 | 4 |
| J144240.80262332.6 | 17.06 | 0.108 | 5 |
| J144825.10355946.7 | 16.87 | 0.114 | 2 |
| J151936.15283827.6 | 17.34 | 0.270 | 4 |
| J162901.32400759.5 | 18.04 | 0.272 | 50 |
| ⋆J163323.59471859.0 | 17.55 | 0.116 | 154 |
| †J170231.05324719.7 | 16.15 | 0.164 | 1 |
| ⋆J170330.38454047.3 | 16.52 | 0.060 | 102 |
| J171304.46352333.4 | 16.56 | 0.085 | 10 |
| J171601.94311213.7 | 16.18 | 0.110 | 1 |
| gNLSy1s | |||
| J032441.20341045.0 | 16.38 | 0.063 | 318 |
| J084957.98510829.0 | 19.27 | 0.584 | 4496 |
| J094857.32002225.6 | 18.86 | 0.585 | 846 |
| J110223.37223920.5 | 19.55 | 0.455 | 32 |
| J122222.99041315.9 | 17.88 | 0.966 | 1534 |
| J150506.48032630.8 | 18.99 | 0.408 | 3364 |
| J164442.53261913.3 | 18.80 | 0.144 | 447 |
2 The sample
Our sample for intranight monitoring has been drawn from the multi-wavelength compilation by Foschini (2011) of 76 NLSy1s with observations at high energies, namely X-ray (using ROSAT777https://heasarc.gsfc.nasa.gov/docs/rosat/rosat.html) and/or -rays (using Fermi/LAT). For each member of their sample, these authors have estimated the radio loudness parameter R1.4GHz, where R1.4GHz is the ratio of the monochromatic rest-frame flux densities at 1.4 GHz and 4400Å (see Yuan et al., 2008). Note that the usual dividing line of R = 10 between RQ-QSOs and RL- QSOs (e.g., Kellermann et al., 1989) is defined for 5 GHz and it corresponds to R1.4GHz = 19 at 1.4 GHz, taking both radio and optical spectral indices to be 0.5.
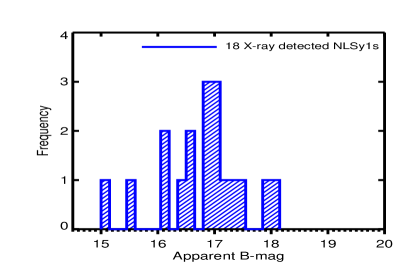
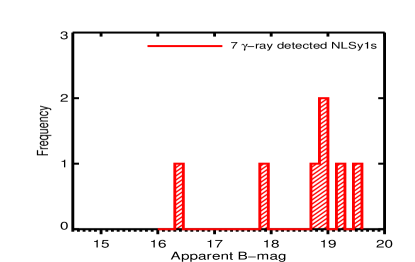
From observational considerations, we discarded 3 of the 76 NLSy1s which lie at declinations south of . Out of the remaining 73 NLSy1s, 18 have more than detection in X-rays (albeit undetected in -rays), as well as B-band magnitude mB 18, hence bright enough for intranight monitoring with the available 1-meter class optical telescopes. Five of the 73 NLSy1s have detection in -rays, among those, three have been detected in the X-rays too. We have not imposed any optical brightness threshold on these 5 NLSy1s, in view of the paucity of -ray detected NLSy1 galaxies at present. For the same reason, we have included another two known -ray detected NLSy1s taken from the literature, namely J164442.53+261913.3 (D’Ammando et al., 2015) and J122222.99+041315.9 (Yao et al., 2015). Thus, our sample for INOV monitoring consists of 18 NLSy1 galaxies detected in X-rays (but not in -rays) and 7 NLSy1 galaxies detected in -rays (including five detected in X-rays, as well, see Table 1). Hereafter, they will be referred to as xNLSy1 galaxies and gNLSy1 galaxies, respectively. Their B-magnitude distributions are shown in Fig. 1 (upper panel for the xNLSy1 and bottom panel for the gNLSy1 galaxies).
(photometric aperture radius used = 2FWHM).
| NLSy1 | Datea | Tb | Nc | Mediand | -test | INOV | -test | INOV | ||
| (SDSS name) | yyyy.mm.dd | FWHM | , | statuse | statusf | (AGN-s)† | (%) | |||
| (hr) | (arcsec) | 99% | 99% | |||||||
| (1) | (2) | (3) | (4) | (5) | (6) | (7) | (8) | (9) | (10) | (11) |
| xNLSy1s | ||||||||||
| J071340.30382039.8 | 2016.03.10 | 4.34 | 54 | 1.98 | 0.23, 0.19 | NV , NV | 1.39 | NV | 0.020 | – |
| J073623.14392617.9 | 2015.11.04 | 4.30 | 45 | 2.10 | 0.31, 0.11 | NV , NV | 1.40 | NV | 0.015 | – |
| J075245.60261735.9 | 2016.11.22 | 4.32 | 31 | 2.30 | 0.57, 0.43 | NV , NV | 0.81 | NV | 0.006 | – |
| J080638.98724820.5 | 2016.02.06 | 4.32 | 40 | 3.93 | 0.19, 0.19 | NV , NV | 0.51 | NV | 0.017 | – |
| 2017.11.19 | 5.22 | 41 | 1.86 | 2.77, 3.28 | V , V | 4.12 | V | 0.006 | 3.76 | |
| 2019.02.03 | 3.60 | 32 | 2.18 | 14.01, 20.46 | V , V | 2.80 | V | 0.008 | 13.29 | |
| J093703.02361537.1 | 2016.11.23 | 3.47 | 28 | 2.60 | 0.45, 0.50 | NV , NV | 0.97 | NV | 0.010 | – |
| J100541.85433240.2 | 2016.12.01 | 4.00 | 37 | 1.86 | 0.42, 0.56 | NV , NV | 0.65 | NV | 0.007 | – |
| J101000.70300321.6 | 2016.11.30 | 2.94 | 27 | 2.26 | 0.40, 0.47 | NV , NV | 0.83 | NV | 0.008 | – |
| 2019.03.10 | 3.56 | 30 | 2.11 | 0.55, 0.46 | NV , NV | 0.83 | NV | 0.012 | – | |
| J140516.22255533.9 | 2019.03.23 | 3.88 | 26 | 2.39 | 0.81, 0.92 | NV , NV | 0.64 | NV | 0.016 | – |
| J140827.81240924.8 | 2019.03.26 | 3.21 | 32 | 3.17 | 0.62, 0.68 | NV , NV | 1.20 | NV | 0.012 | – |
| J144240.80262332.6 | 2017.05.05 | 3.90 | 23 | 1.86 | 0.74, 0.55 | NV , NV | 2.08 | NV | 0.010 | – |
| J144825.10355946.7 | 2017.05.04 | 3.59 | 39 | 2.30 | 0.35, 0.50 | NV , NV | 0.83 | NV | 0.010 | – |
| J151936.15283827.6 | 2019.02.16 | 3.33 | 20 | 3.07 | 0.83, 0.81 | NV , NV | 1.14 | NV | 0.010 | – |
| J162901.32400759.5 | 2017.05.05 | 3.30 | 24 | 2.14 | 0.66, 0.65 | NV , NV | 2.54 | V | 0.020 | 5.60 |
| 2019.04.09 | 3.13 | 22 | 2.35 | 0.77, 0.47 | NV , NV | 0.95 | NV | 0.017 | – | |
| J163323.59471859.0 | 2017.05.20 | 4.33 | 36 | 2.26 | 0.93, 0.76 | NV , NV | 1.95 | V | 0.007 | 2.44 |
| 2019.03.20 | 3.69 | 33 | 2.66 | 1.68, 1.78 | NV , NV | 2.15 | V | 0.016 | 9.16 | |
| J170231.05324719.7 | 2019.03.10 | 3.01 | 26 | 2.18 | 0.88, 0.64 | NV , NV | 0.87 | NV | 0.006 | – |
| J170330.38454047.3 | 2017.06.03 | 3.76 | 37 | 2.41 | 0.51, 0.75 | NV , NV | 0.67 | NV | 0.004 | – |
| 2019.03.25 | 3.13 | 45 | 4.45 | 0.63, 1.08 | NV , NV | 0.59 | NV | 0.010 | – | |
| J171304.46352333.4 | 2017.05.04 | 3.35 | 40 | 2.11 | 0.74, 0.55 | NV , NV | 1.17 | NV | 0.007 | – |
| J171601.94311213.7 | 2017.04.17 | 3.57 | 29 | 2.18 | 0.48, 0.42 | NV , NV | 1.63 | NV | 0.005 | – |
| gNLSy1s | ||||||||||
| J032441.20341045.0 | 2016.11.22 | 4.42 | 57 | 2.32 | 09.87, 13.87 | V, V | 15.30 | V | 0.004 | 5.17 |
| 2016.11.23 | 4.27 | 55 | 2.13 | 07.10, 12.24 | V, V | 05.52 | V | 0.004 | 4.44 | |
| 2016.12.02 | 4.41 | 47 | 2.60 | 89.82, 92.80 | V, V | 57.04 | V | 0.003 | 11.36 | |
| 2017.01.03 | 3.00 | 40 | 2.47 | 06.55, 10.03 | V, V | 02.78 | V | 0.003 | 4.10 | |
| 2017.01.04 | 3.39 | 36 | 2.45 | 33.28, 35.16 | V, V | 12.58 | V | 0.003 | 7.52 | |
| J084957.98510829.0 | 2017.12.13 | 5.36 | 31 | 2.83 | 00.61, 00.68 | NV, NV | 00.81 | NV | 0.034 | – |
| 2019.04.08 | 3.04 | 13 | 2.88 | 00.65, 01.32 | NV, NV | 00.46 | NV | 0.033 | – | |
| J094857.32002225.6 | 2016.12.02 | 4.15 | 17 | 2.58 | 01.61, 01.76 | NV, NV | 05.99 | V | 0.017 | 7.82 |
| 2017.12.21 | 5.20 | 33 | 2.24 | 13.95, 16.31 | V , V | 26.48 | V | 0.011 | 16.49 | |
| J110223.37223920.5 | 2018.01.15 | 5.34 | 28 | 2.66 | 00.74, 00.92 | NV, NV | 02.99 | V | 0.018 | 4.87 |
| 2019.04.09 | 3.91 | 16 | 2.51 | 00.20, 00.31 | NV, NV | 00.82 | NV | 0.017 | – | |
| J122222.99041315.9 | 2017.01.03 | 3.52 | 17 | 2.38 | 00.53, 00.25 | NV, NV | 00.73 | NV | 0.020 | – |
| 2017.01.04 | 3.14 | 16 | 2.36 | 00.32, 00.37 | NV, NV | 01.95 | NV | 0.014 | – | |
| 2017.02.21 | 4.44 | 41 | 2.65 | 00.74, 00.76 | NV, NV | 01.95 | V | 0.020 | 6.28 | |
| 2017.02.22 | 5.50 | 51 | 2.59 | 03.98, 03.56 | V , V | 05.89 | V | 0.017 | 13.32 | |
| 2017.03.04 | 4.93 | 40 | 2.61 | 00.73, 01.08 | NV, NV | 00.94 | NV | 0.019 | – | |
| 2017.03.24 | 3.94 | 39 | 2.37 | 00.93, 00.74 | NV, NV | 01.41 | NV | 0.020 | – | |
| J150506.48032630.8 | 2017.03.25 | 5.21 | 41 | 2.08 | 00.60, 00.60 | NV, NV | 01.70 | NV | 0.028 | – |
| 2018.04.12 | 3.05 | 19 | 2.55 | 00.67, 00.53 | NV, NV | 00.84 | NV | 0.032 | – | |
| J164442.53261913.3 | 2017.04.03 | 4.37 | 37 | 2.50 | 01.15, 01.44 | NV, NV | 03.23 | V | 0.012 | 5.66 |
| 2019.04.26 | 3.22 | 24 | 2.27 | 02.78, 03.06 | V , V | 03.75 | V | 0.011 | 7.38 | |
| aDate(s) of the monitoring session(s). | ||||||||||
| bDuration of the session. | ||||||||||
| cNumber of data points in the DLCs of the monitoring session. | ||||||||||
| dMedian FWHM of the seeing disk during the monitoring session. | ||||||||||
| eV = Variable, if both DLCs show INOV at confidence level 99% using the -test, otherwise NV = Non-variable. | ||||||||||
| fV, if F using the -test, otherwise NV. | ||||||||||
| Mean for the three DLCs of the AGN (i.e., relative to the three comparison stars). | ||||||||||
| Using -test | Using -test | ||||
| NLSy1 | Number | ||||
| (%) | (%) | (%) | (%) | ||
| (1) | (2) | (3) | (4) | (5) | (6) |
| NLSy1 (RQ) | 13 | 0 | 0 | 0 | 0 |
| NLSy1 (RL) | 5 | 43 | 7 | 13 | 8 |
| NLSy1 (RQRL) | 18 | 12 | 7 | 4 | 8 |
| NLSy1 (RL) | 7 | 53 | 8 | 31 | 11 |
| aFor the 13 radio-quiet xNLSy1 galaxies. | |||||
| bFor the 5 radio-loud xNLSy1 galaxies. | |||||
| cFor the entire set of 18 (13 RQ 5 RL) xNLSy1 galaxies. | |||||
| dFor the entire set of 7 gNLSy1 galaxies (all radio-loud). | |||||
| ⋆Using only good quality DLCs (24 for xNLSy1s and 21 | |||||
| for gNLSy1s) for which the mean error is 3% (cf. Table 2, | |||||
| column 10) and the monitoring time is 3.0 hours. | |||||
| †This is the mean for all the DLCs belonging to the category ‘V’. | |||||
3 Observations and Data Reduction
3.1 Photometric observations
All the 18 xNLSy1s and 7 gNLSy1s in our sample were monitored in the Johnson-Cousin R (hereafter Rc) filter, using the 1.3 metre (m) Devasthal Fast Optical Telescope (DFOT) located at Devasthal near Nainital (Sagar et al., 2010) and the 1.04m Sampurnanand Telescope (ST) (Sagar, 1999) located at Nainital, both of telescopes operated by the Aryabhatta Research Institute of Observational Sciences (ARIES). Out of the total 25 NLSy1 galaxies, 19 were monitored exclusively with the DFOT, 2 with the ST, while the remaining 4 were monitored with both the telescopes. The 1.3m DFOT is a Ritchey-Chretien (RC) telescope with a fast beam (f/4) and a pointing accuracy better than 10 arcsec rms. It is equipped with a 2k2k and a 512512 deep thermoelectrically cooled (to about C) Andor CCD cameras. The 512512 CCD camera having a pixel size of 16 microns and a plate scale of 0.63 arcsec per pixel, covers a 55 arcmin2 field-of-view (FOV) on the sky. The CCD was read out at 1 MHz speed, having rms noise and gain of 6.1 and 1.4 ADU-1, respectively. The second camera on DFOT, with a 2k2k CCD, has a pixel size of 13.5 microns, a plate scale of 0.53 arcsec per pixel and covers a FOV of 1818 arcmin2 on the sky. The 2k2k CCD was read out at 1 MHz speed, having a system rms noise and gain of 7.5 and 2.0 ADU-1, respectively. The 1.04m ST is also of the RC design, with an f/13 beam at the Cassegrain focus. The telescope is equipped with a 1k1k, a PyLoN 13401300 and a 4k4k CCD cameras. All three CCDs, viz., the 1k1k, the PyLoN 13401300 and the 4k4k are cooled with Liquid nitrogen (LN2) to -120∘C. The 1k1k CCD (read noise = 7.0 ) has a gain of 11.98 ADU-1 and with its pixel size of 24 microns, covers a FOV of 6.26.2 arcmin2 on the sky. The PyLoN 13401300 CCD camera with a pixel size of 20 microns and a plate scale of 0.31 arcsec per pixel, covers a FOV of 6.86.6 arcmin2 on the sky. Our monitoring with this CCD camera was carried out at 1 MHz speed, a read noise of 6.4 and a gain of 2 ADU-1. The third camera, with a 4k4k CCD chip, has a pixel size of 15 microns and a plate scale of 0.23 arcsec per pixel, giving a FOV of 1515 arcmin2 on the sky. The CCD was set up at 44 binning with a readout speed of 1 MHz and a gain of 3 ADU-1 which corresponds to the read noise of 10 . As suggested by Carini (1990), the probability of INOV detection can be significantly enhanced by monitoring the target continuously for about 3-4 hours. Accordingly, we have monitored each of our target AGN (7 gNLSy1 and 18 xNLSy1 galaxies) continuously for 3.0 hours during each session. Typical exposure time for a session was set at between 4 and 15 minutes, depending on the brightness of the target source, the lunar phase, and the sky transparency.
3.2 Data reduction
Pre-processing of the raw frames (bias subtraction, flat-fielding and cosmic-ray removal) was done using the standard tasks within the IRAF software package888Image Reduction and Analysis Facility (http://iraf.noao.edu/). Instrumental magnitudes of the monitored NLSy1 and the three chosen comparison stars also recorded in the CCD image frames were determined by aperture photometry (Stetson, 1992, 1987), using the DAOPHOT II algorithm999Dominion Astrophysical Observatory Photometry (http://www.astro.wisc.edu/sirtf/daophot2.pdf). A crucial parameter for the photometry is the radius of the photometric aperture, which also determines the signal to noise ratio (SNR) of the individual photometric data points. As suggested by Howell (1989), the maximum SNR of an object in a frame is achieved when the photometric aperture radius is approximately equal to the full width at half maximum (FWHM) of the point spread function (PSF), and it decreases for both larger and smaller apertures. However, following the analysis by Cellone et al. (2000), the situation can be more complex in the present situation where the targets are nearby and hence the integrated light falling within the aperture centered on the target AGN is often expected to have a significant contribution from the underlying host galaxy. Consequently, the relative contributions from the AGN and the host galaxy within the aperture can vary significantly with changing seeing disk during a session, and the differential light curves (DLCs) may then show statistically significant, albeit spurious variability. Taking note of this, we have first determined for each CCD frame the seeing disk FWHM (by averaging over the profiles of 5 bright but clearly unsaturated stars in that frame) and then found the median FWHM for the entire session. The aperture photometry for each session was then performed by setting the aperture radius equal to 2FWHM, 3FWHM and 4FWHM. The resulting DLCs of the target AGN were compared with the observed variation of the seeing disk (FWHM) during the session, before proceeding with a quantitative analysis. This has amounted to an extra-cautious approach, since during our various monitoring sessions, FWHM remained mostly between 2 to 3 arcsecs (except for two sessions) and hence an aperture radius = 2FWHM is expected to yield fairly reliable DLCs for the AGN even if its host galaxy is up to 2-mag brighter (see, table 2 of Cellone et al., 2000). For each monitored NLSy1, we derived DLCs relative to three (steady) comparison stars which we had selected on the basis of their proximity to the target AGN, both in brightness and location within the CCD frame. In our sample, except for 2 xNLSy1 galaxies, at least one of the chosen comparison star (considered as reference star) falls within 1-mag of the target NLSy1. Coordinates and other parameters of the reference/comparison stars used for the different sessions are given in Table LABEL:tab_xray_comp_star and Table 5 for the xNLSy1 and gNLSy1 galaxies, respectively. The g-r color difference for the target NLSy1 and the corresponding chosen reference and comparison stars is always 0.8 and 2.0, with the median values being 0.30 and 0.67, respectively (column 7 in Table LABEL:tab_xray_comp_star and Table 5). It has been shown by Carini et al. (1992) and Stalin et al. (2004a) that color differences of this order should produce a negligible effect on the DLCs as the atmospheric attenuation changes during a monitoring session.
4 STATISTICAL ANALYSIS OF THE DLCs
To check for the presence of INOV in a DLC, we have used two flavours of the Ftest: (i) the standard Ftest (hereafter test, see, e.g., Goyal et al., 2012) and (ii) the power-enhanced Ftest (hereafter test, see, e.g., de Diego, 2014). For the test, it is important that the rms errors on the photometric data points are corrected for the underestimation of the error in the instrumental magnitude returned by the routines in the standard softwares DAOPHOT and IRAF used here. It has been found in various studies that the error underestimation factor ranges between 1.3 and 1.75 (Gopal-Krishna et al., 1995; Garcia et al., 1999; Sagar et al., 2004; Stalin et al., 2004b; Bachev et al., 2005). Recently Goyal et al. (2013b) have estimated the best-fit value of to be 1.540.05, using the data acquired in 262 quasar monitoring sessions.
The -statistics can be written as (e.g., Goyal et al., 2012)
where , and are the variances of the ‘AGN-star1’, ‘AGN-star2’ and ‘star1-star2’ DLCs, respectively, while , and are the mean square (formal) rms errors of the individual data points in the corresponding DLCs. As mentioned above, the scaling factor ‘’ is taken to be following Goyal et al. (2013b).
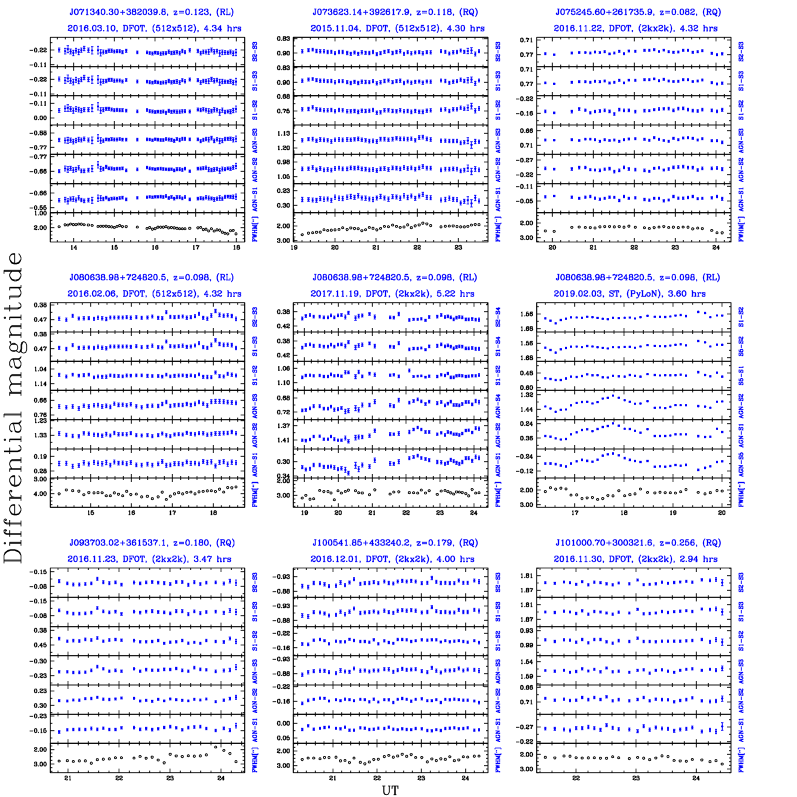
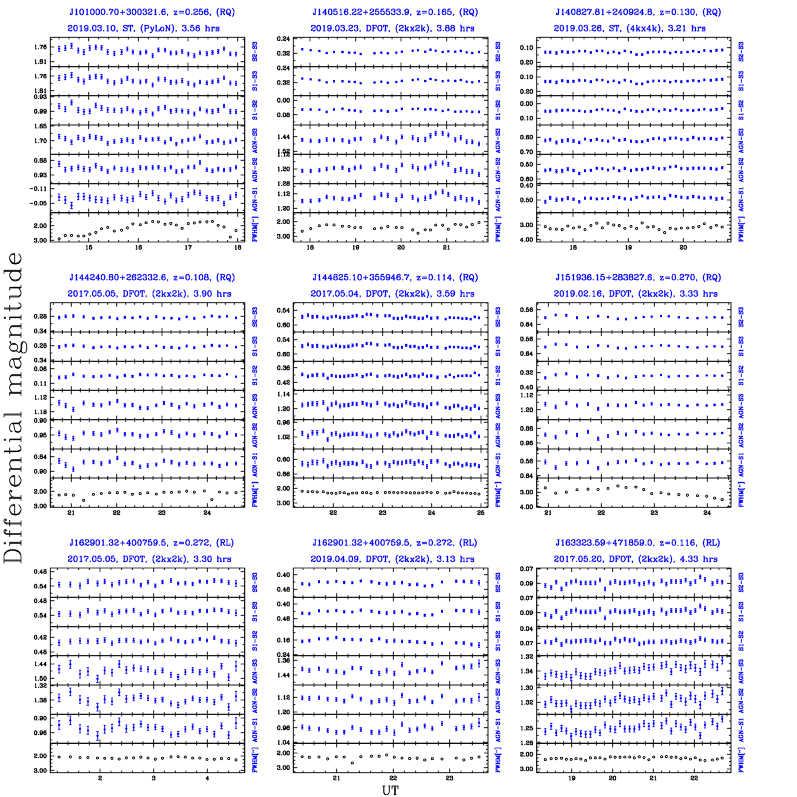
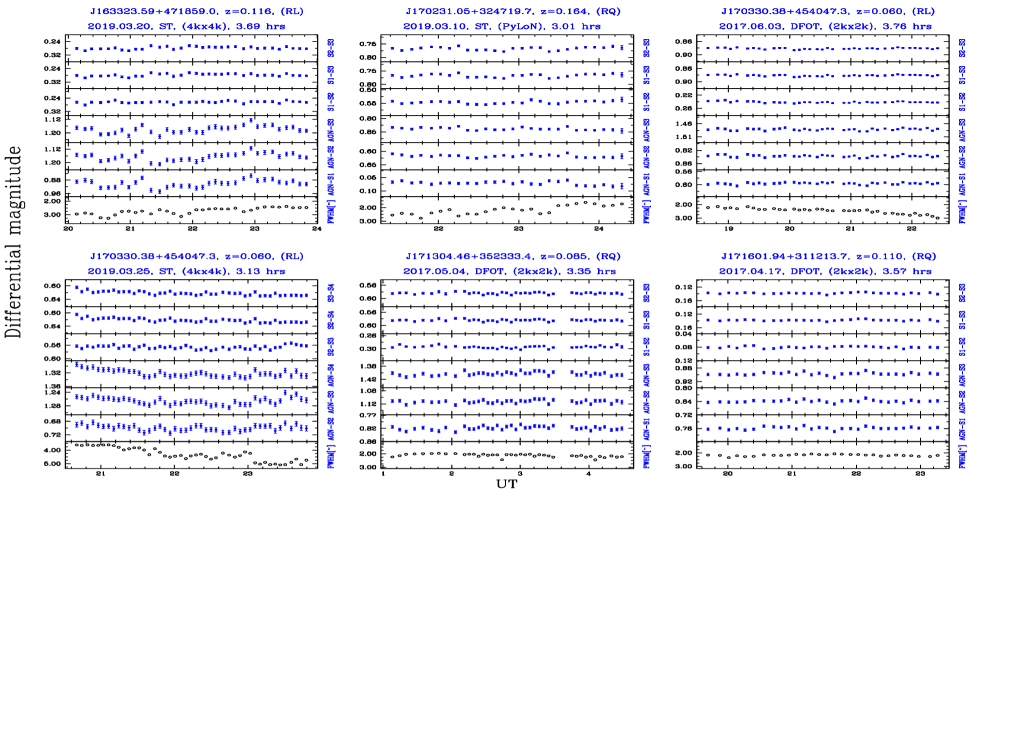
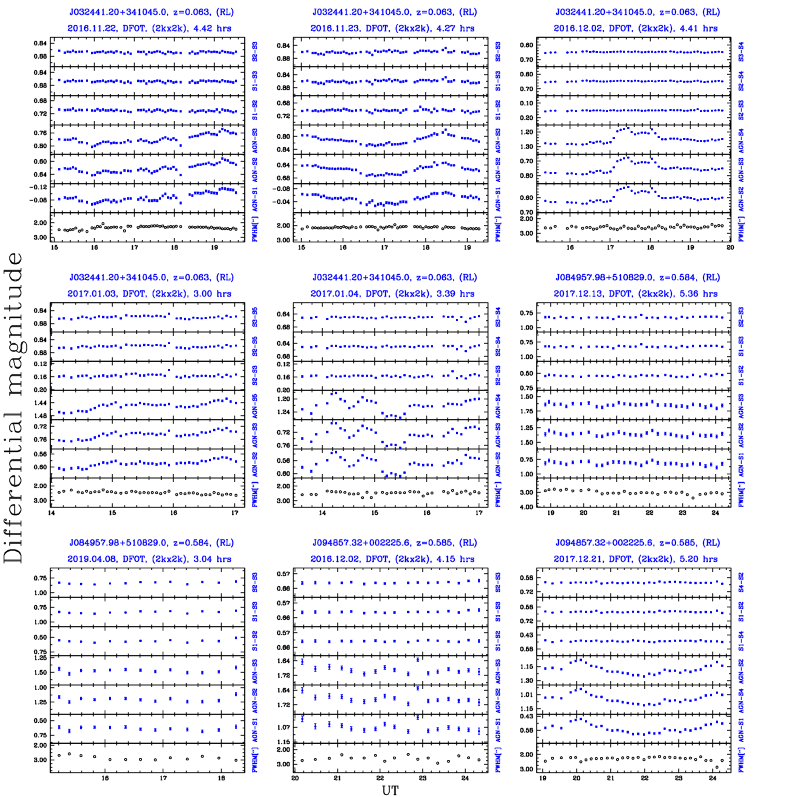
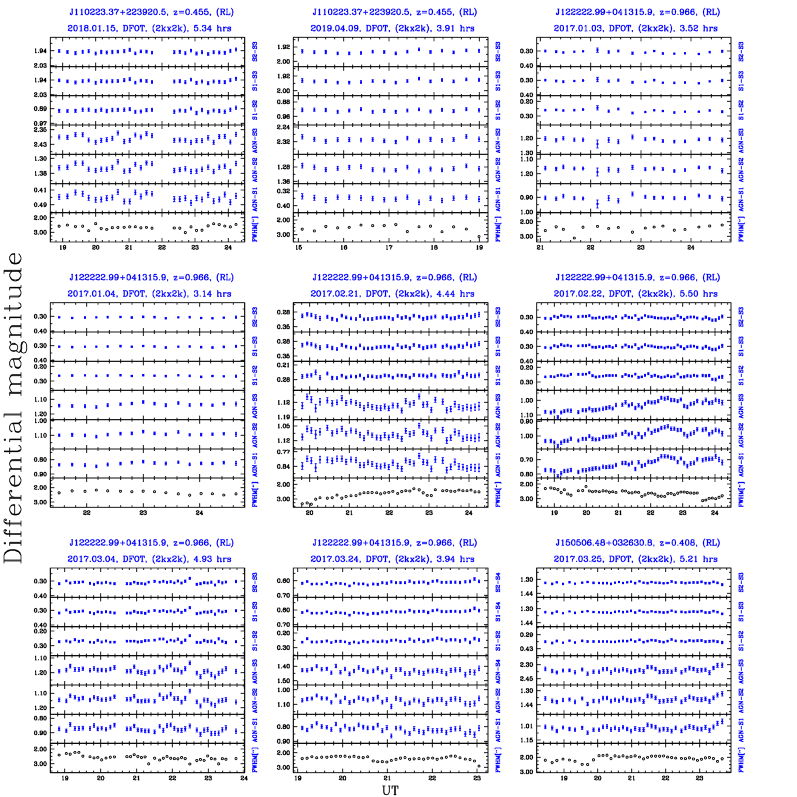
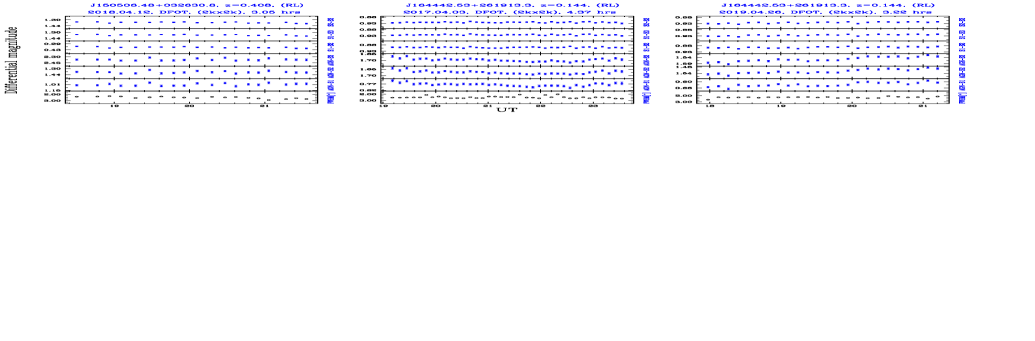
For -test we have used the DLCs of ‘AGN-star1’, ‘AGN-star2’ and ‘star1-star2’ displayed in the 2nd, 3rd and 5th panels from the bottom in Figs. 1-6, respectively.
The -values were computed for each DLC using Eq. 4, and compared with the critical value, , where is the significance level set for the test, and and are the degrees of freedom for the ‘AGN-star’ and ’star-star’ DLCs (both degrees of freedom are equal to N-1 in the present case). Here, we set a critical significance level, 0.01 which corresponds to a confidence level of 99%, so that an AGN is designated as variable (V) if its computed -value is found to be for both its DLCs (i.e., relative to the two comparison stars), or, non-variable (NV) if the computed -value is found to be for either of the two DLCs. The computed -values and the correspondingly inferred variability status for xNLSy1 and gNLSy1 galaxies are given in columns 6 and 7 of Table 2.
The second version of the Ftest employed here is the, so-called, test (de Diego, 2014). Its chief merit is that it transforms the DLCs of the comparison stars to the same photometric noise level as if the magnitudes of the comparison stars are exactly matched to the mean magnitude of the AGN monitored (thereby making the analysis free from the effect of the magnitude difference between the target AGN and the comparison star(s), which can significantly impact some versions of the -test wherein the factor is ignored, e.g., see Joshi et al., 2011). Furthermore, the power of the test increases with the number of comparison stars used. Therefore, in this work, for a given session of NLSy1 galaxy, we have chosen three (steady) comparison stars present in all the frames, among which the star with the closest match in magnitude to the target NLSy1 galaxy is taken as a reference star. The statistical criterion of test is defined as:
| (1) |
where is the variance of the DLC of the target AGN (relative to the chosen reference star), while is the stacked variance of the DLCs of the comparison stars and the reference star (de Diego, 2014). is the number of observations of the star and is the total number of comparison stars used.
Here, is the scaled square deviation defined as
| (2) |
where is the scaling factor, ’s are the differential instrumental magnitudes and is the mean differential magnitude of the reference star and the comparison star. Following Joshi et al. (2011), we have taken as the ratio of the averaged square error of the differential instrumental magnitudes in the ‘AGN-reference star’ DLC to the averaged square error of the differential instrumental magnitudes in the ‘comparison star-reference star’ DLC. For the DLC of the star
| (3) |
From the previous section, we may recall that the photometric errors returned by IRAF are underestimated by a factor of =1.5. However, such underestimation will not affect the scaling factor since it is designed to take care of any magnitude difference between the target AGN and the reference/comparison stars. Furthermore, by stacking variances of the comparison stars, the degrees of freedom of test given in Eq. 1 can be increased and thereby the power of the test enhanced (de Diego, 2014). For this test, we set the same critical significance level as we have used for the -test. Thus, we mark an AGN as variable (V) at 99% confidence level, if the computed value of is found to be and non-variable (NV) otherwise. The computed values (Eq. 1) and the correspondingly assigned variability status for the sets of xNLSy1 and gNLSy1 galaxies are given in columns 8, 9 of Table 2.
4.1 Estimation of duty cycle and amplitude of INOV
Following the definition of INOV duty cycle (DC) given by Romero et al. (1999), we have computed DC as
| (4) |
where z is the duration of the monitoring session, corrected for the AGN’s redshift, . The proposed definition of DC takes into consideration the actual monitoring duration for the session, to compensate for the fact that the duration of the sessions for a given AGN differs from night to night. For session, is set equal to 1 if INOV is detected, otherwise is taken as 0.
To compute the average (i.e., representative) value of INOV duty cycle () for an AGN subclass/set, it is important to appreciate that the observational coverages of the different members of the set are often unequal in terms of the overall duration of the monitoring sessions devoted to a given member. Consequently, the computed DC of INOV for that AGN set would get biased in favour of the longer monitored member(s) of the set. For instance, the computed DC for an AGN set would be too high in case of longer overall monitoring durations were devoted in the campaign to its members which happen to be intrinsically more variable. In order to avoid this potential bias, we have first computed the INOV DC for individual members of the AGN subclass and then taken an average over all the members. The computed average DC values of INOV for the different subclasses of NLSy1s are listed in columns 3 and 5 of Table 3, based on the and -tests.
The amplitude of INOV () for the monitored AGN is given by (e.g., Heidt & Wagner, 1996)
| (5) |
with = minimum (maximum) values in the AGN-star DLC and , where, is the mean square (formal) rms errors of individual data points in the DLC and =1.5 (Goyal et al., 2013b).
The mean value of the INOV amplitude () for each AGN subclass (e.g., xNLSy1s and gNLSy1s) is computed by taking the average of over the DLCs with positive INOV detection (i.e., ‘V’ category DLCs). The computed values for the subclasses of NLSy1s covered in the present study are tabulated in columns 4 and 6 of Table 3, based on the and -tests.
5 Results and discussion
To recapitulate, the two sets/subclasses of NLSy1 galaxies for which intranight optical monitoring is reported here, are: xNLSy1 (detected in X-rays, but undetected in -rays) and gNLSy1 (detected in -rays and, in some cases, in X-rays as well). From Table 1, 18 galaxies belong to the xNLSy1 subclass (out of which 5 are radio-loud) and 7 to the gNLSy1 subclass (all 7 being radio-loud). We have monitored these two sets, respectively, in 24 and 21 sessions of a minimum 3-hour duration each. The computed mean values of the INOV duty cycle () for the two sets, based on the -test and the -test, at 99% confidence level (Sect. 4), are given in Table 3. We believe these estimates of the INOV duty cycle for NLSy1 galaxies are more representative compared to those reported in previous studies (Liu et al., 2010; Paliya et al., 2013; Kshama et al., 2017). This assertion stems from the smaller likelihood of the INOV detections being spurious on account of any variations in the seeing disk during the monitoring session (see below and Sect. 3.2). The reason for this is that, unlike the usual practice, we have taken into consideration the DLCs derived from aperture photometry employing not just one but 3 apertures sizes, having radii equal to 2, 3 and 4 times the median seeing (FWHM) for the session. This caution is specially important in case of the nearby ( 0.3) xNLSy1 and gNLSy1 galaxies for which a (spurious) variation in the DLC, which correlates with the variation of the seeing disk can become statistically significant on account of a changing contribution from the host galaxy into the aperture during the monitoring session (e.g., see Cellone et al., 2000). From a careful inspection of the DLCs shown in Fig. 4, it is inferred that the impact of such a possibility can be significant for just one session (on 20th March 2019) when the (xNLSy1) galaxy J163323.59471859.0 was monitored (see the top left panel of Fig. 4). However, since those DLCs exhibited highly significant variability even when aperture radii equal to 3 and 4 times the median seeing (FWHM) were used, the INOV detection claimed here is almost certainly genuine.
It is seen that the INOV duty cycle (DC) for the xNLSy1s is 12%, much smaller than the DC 53% found here for the gNLSy1s. Conceivably, the difference might have stemmed from the mismatch between the limiting apparent magnitudes we adopted for selecting these two sets of NLSy1 galaxies (Sect. 2). However, this possibility seems highly unlikely since the set of xNLSy1s should, in fact, be more amenable to INOV detection, being systemically brighter compared to the set of gNLSy1s (see Fig. 1). Considering now just the radio-loud subset of xNLSy1s (i.e., 5 out of the total 18 galaxies), it is seen from Table 3 that they exhibit an INOV DC very similar to that found for the gNLSy1 galaxies (all 7 of which are radio-loud). This point is further considered below.
As mentioned in Sect. 1, detailed multi-band photometry (combined with optical/near-infrared polarimetry) of the inner knots in the jets of a few prominent blazars has strongly hinted that their optical synchrotron emission consists of two physically distinct components, one linked to the X-ray synchrotron emission and the other to the radio synchrotron emission (Jester et al., 2006; Uchiyama et al., 2006; Cara et al., 2013). One objective of the present study of NLSy1s was to investigate the INOV characteristics of their optical synchrotron emission component linked to the X-ray emission, by carrying out intranight monitoring of NLSy1s whose optical emission is more likely to have a substantial contribution coming from the X-ray linked optical synchrotron component. Clearly, such candidates are more likely to be picked up in X-ray detected samples of NLSy1s. It is then quite plausible that some such NLSy1s are present among the 13 radio-quiet members of the present set of 18 xNLSy1 galaxies. The present finding of lack of INOV detection in all the 13 radio-quiet xNLSy1, in stark contrast to their 5 radio-loud counterparts, suggests that the INOV associated with the putative X-ray linked optical synchrotron component is rather muted. Thus, it appears that the radio loudness level is the prime factor behind the INOV detection in NLSy1 galaxies and the pattern of the high-energy radiation plays only a minor role. A possible interpretation of this result is that, in relativistic jets, compared to their radio-emitting regions, the sites of synchrotron X-rays emission (and associated optical radiation) are more strongly magnetised and hence more stable against turbulence.
The high INOV duty cycle of 43% estimated here for the radio-loud subset comprising of 5 xNLSy1s, compares well with the INOV DC of 53% we find for the set of 7 gNLSy1s all of which are, as usual, radio-loud (Table 1). Interestingly, the similarity in INOV DC has been observed inspite of all the xNLSy1s in our sample being undetected in gamma-rays (Sect. 2, Table 1). Here it may be recalled that for quasars, neither radio-loudness nor radio core-dominance (a marker of relativistic beaming) guarantees a pronounced INOV, only a blazar characteristic, viz., a high optical polarisation does (Goyal et al., 2012; Gopal-Krishna & Wiita, 2018). Thus, in the context of the present finding, a polarimetric check on the blazar-like nature of the nuclei of the radio-loud xNLSy1 galaxies would be desirable.
It is possible to compare the present estimates of INOV DC for xNLSy1 and gNLSy1 galaxies with those reported for several other classes of (more luminous) AGNs covered in the INOV study by Goyal et al. (2013a). Such a comparison is feasible because, like us, they too have applied the -test to the intranight DLCs and also set the confidence level for INOV detection at 99% (see Sect. 4). Their estimates of INOV duty cycles for INOV amplitude 3% are 6, 11, 3, 10, 38 and 32 percent, respectively, for radio-quiet quasars (RQQs), radio-intermediate quasars (RIQs), radio lobe-dominated quasars (LDQs), low optical polarisation core-dominated quasars (LPCDQs), high optical polarisation core-dominated quasars (HPCDQs) and TeV blazars. For our set of 7 gNLSy1s galaxies (21 sessions), we find and of 31% and 11%, respectively. As cited above, only blazars match such a high INOV duty cycle. In fact, one might argue that the estimated INOV DCs of NLSy1 galaxies may be too low because of a substantial dilution of the optical synchrotron emission by a comparatively steady thermal optical component which is contributed by the host galaxy and the nuclear accretion disk in these high Eddington accretors (Sect. 1, also see, Ojha et al., 2019). Further observational evidence is needed to assess this hypothesis.
Acknowledgments
We thank an anonymous referee for his/her very important comments that helped us to improve this manuscript considerably.
References
- Abdo et al. (2009a) Abdo A. A. et al., 2009a, ApJ, 699, 976
- Abdo et al. (2009b) Abdo A. A. et al., 2009b, ApJ, 707, 727
- Abdo et al. (2009c) Abdo A. A. et al., 2009c, ApJ, 707, L142
- Abolfathi et al. (2018) Abolfathi B. et al., 2018, ApJS, 235, 42
- Ahn et al. (2014) Ahn C. P. et al., 2014, ApJS, 211, 17
- Bachev et al. (2005) Bachev R., Strigachev A., Semkov E., 2005, MNRAS, 358, 774
- Boller et al. (1996) Boller T., Brandt W. N., Fink H., 1996, A&A, 305, 53
- Boroson (2005) Boroson T., 2005, AJ, 130, 381
- Boroson (2002) Boroson T. A., 2002, ApJ, 565, 78
- Boroson & Green (1992) Boroson T. A., Green R. F., 1992, ApJS, 80, 109
- Cara et al. (2013) Cara M. et al., 2013, ApJ, 773, 186
- Carini (1990) Carini M. T., 1990, PhD thesis, , George State University, Atlanta, USA, (1990)
- Carini et al. (1992) Carini M. T., Miller H. R., Noble J. C., Goodrich B. D., 1992, AJ, 104, 15
- Cellone et al. (2000) Cellone S. A., Romero G. E., Combi J. A., 2000, AJ, 119, 1534
- Collin & Kawaguchi (2004) Collin S., Kawaguchi T., 2004, A&A, 426, 797
- D’Ammando et al. (2012) D’Ammando F. et al., 2012, MNRAS, 426, 317
- D’Ammando et al. (2015) D’Ammando F., Orienti M., Larsson J., Giroletti M., 2015, MNRAS, 452, 520
- de Diego (2014) de Diego J. A., 2014, AJ, 148, 93
- Foschini (2011) Foschini L., 2011, in Narrow-Line Seyfert 1 Galaxies and their Place in the Universe, p. 24
- Foschini et al. (2010) Foschini L., Fermi/Lat Collaboration, Ghisellini G., Maraschi L., Tavecchio F., Angelakis E., 2010, in Astronomical Society of the Pacific Conference Series, Vol. 427, Accretion and Ejection in AGN: a Global View, Maraschi L., Ghisellini G., Della Ceca R., Tavecchio F., eds., pp. 243–248
- Garcia et al. (1999) Garcia A., Sodré L., Jablonski F. J., Terlevich R. J., 1999, MNRAS, 309, 803
- Goodrich et al. (1989) Goodrich R. W., Stringfellow G. S., Penrod G. D., Filippenko A. V., 1989, ApJ, 342, 908
- Gopal-Krishna et al. (2011) Gopal-Krishna, Goyal A., Joshi S., Karthick C., Sagar R., Wiita P. J., Anupama G. C., Sahu D. K., 2011, MNRAS, 416, 101
- Gopal-Krishna et al. (1995) Gopal-Krishna, Sagar R., Wiita P. J., 1995, MNRAS, 274, 701
- Gopal-Krishna & Wiita (2018) Gopal-Krishna, Wiita P. J., 2018, Bulletin de la Societe Royale des Sciences de Liege, 87, 281
- Goyal et al. (2012) Goyal A., Gopal-Krishna, Wiita P. J., Anupama G. C., Sahu D. K., Sagar R., Joshi S., 2012, A&A, 544, A37
- Goyal et al. (2013a) Goyal A., Gopal-Krishna, Wiita P. J., Stalin C. S., Sagar R., 2013a, MNRAS, 435, 1300(GGWSS13)
- Goyal et al. (2013b) Goyal A., Mhaskey M., Gopal-Krishna, Wiita P. J., Stalin C. S., Sagar R., 2013b, Journal of Astrophysics and Astronomy, 34, 273
- Grupe et al. (1999) Grupe D., Beuermann K., Mannheim K., Thomas H.-C., 1999, A&A, 350, 805
- Grupe et al. (1998) Grupe D., Beuermann K., Thomas H.-C., Mannheim K., Fink H. H., 1998, A&A, 330, 25
- Heidt & Wagner (1996) Heidt J., Wagner S. J., 1996, A&A, 305, 42
- Heidt & Wagner (1998) Heidt J., Wagner S. J., 1998, A&A, 329, 853
- Howell (1989) Howell S. B., 1989, PASP, 101, 616
- Jannuzi et al. (1993) Jannuzi B. T., Smith P. S., Elston R., 1993, ApJS, 85, 265
- Jannuzi et al. (1994) Jannuzi B. T., Smith P. S., Elston R., 1994, ApJ, 428, 130
- Jester et al. (2006) Jester S., Harris D. E., Marshall H. L., Meisenheimer K., 2006, ApJ, 648, 900
- Joshi et al. (2011) Joshi R., Chand H., Gupta A. C., Wiita P. J., 2011, MNRAS, 412, 2717
- Kellermann et al. (2016) Kellermann K. I., Condon J. J., Kimball A. E., Perley R. A., Ivezić Ž., 2016, ApJ, 831, 168
- Kellermann et al. (1989) Kellermann K. I., Sramek R., Schmidt M., Shaffer D. B., Green R., 1989, AJ, 98, 1195
- Kellermann et al. (1994) Kellermann K. I., Sramek R. A., Schmidt M., Green R. F., Shaffer D. B., 1994, AJ, 108, 1163
- Klimek et al. (2004) Klimek E. S., Gaskell C. M., Hedrick C. H., 2004, ApJ, 609, 69
- Komossa & Meerschweinchen (2000) Komossa S., Meerschweinchen J., 2000, A&A, 354, 411
- Komossa et al. (2006) Komossa S., Voges W., Xu D., Mathur S., Adorf H.-M., Lemson G., Duschl W. J., Grupe D., 2006, AJ, 132, 531
- Kshama et al. (2017) Kshama S. K., Paliya V. S., Stalin C. S., 2017, MNRAS, 466, 2679
- Kynoch et al. (2018) Kynoch D. et al., 2018, MNRAS, 475, 404
- Lähteenmäki et al. (2018) Lähteenmäki A., Järvelä E., Ramakrishnan V., Tornikoski M., Tammi J., Vera R. J. C., Chamani W., 2018, A&A, 614, L1
- Leighly (1999) Leighly K. M., 1999, ApJS, 125, 297
- Leighly & Moore (2004) Leighly K. M., Moore J. R., 2004, ApJ, 611, 107
- Lister (2018) Lister M., 2018, in Revisiting Narrow-Line Seyfert 1 Galaxies and their Place in the Universe, p. 22
- Liu et al. (2010) Liu H., Wang J., Mao Y., Wei J., 2010, ApJ, 715, L113
- Miller et al. (2000) Miller H. R., Ferrara E. C., McFarland J. P., Wilson J. W., Daya A. B., Fried R. E., 2000, New A Rev., 44, 539
- Monet (1998) Monet D. G., 1998, in Bulletin of the American Astronomical Society, Vol. 30, American Astronomical Society Meeting Abstracts, p. 1427
- Ojha et al. (2019) Ojha V., Krishna G., Chand H., 2019, MNRAS, 483, 3036
- Osterbrock & Pogge (1985) Osterbrock D. E., Pogge R. W., 1985, ApJ, 297, 166
- Paliya et al. (2018) Paliya V. S., Ajello M., Rakshit S., Mandal A. K., Stalin C. S., Kaur A., Hartmann D., 2018, ApJ, 853, L2
- Paliya et al. (2013) Paliya V. S., Stalin C. S., Kumar B., Kumar B., Bhatt V. K., Pandey S. B., Yadav R. K. S., 2013, MNRAS, 428, 2450
- Pogge (2011) Pogge R. W., 2011, in Narrow-Line Seyfert 1 Galaxies and their Place in the Universe, p. 2
- Pounds et al. (1995) Pounds K. A., Done C., Osborne J. P., 1995, MNRAS, 277, L5
- Rakshit et al. (2017) Rakshit S., Stalin C. S., Chand H., Zhang X.-G., 2017, ApJS, 229, 39
- Romero et al. (1999) Romero G. E., Cellone S. A., Combi J. A., 1999, A&AS, 135, 477
- Sagar (1999) Sagar R., 1999, Current Science, 77, 643
- Sagar et al. (2010) Sagar R., Kumar B., Omar A., Pandey A. K., 2010, in Astronomical Society of India Conference Series, Vol. 1, Astronomical Society of India Conference Series
- Sagar et al. (2004) Sagar R., Stalin C. S., Gopal-Krishna, Wiita P. J., 2004, MNRAS, 348, 176
- Sambruna et al. (1995) Sambruna R. M., Urry C. M., Ghisellini G., Maraschi L., 1995, ApJ, 449, 567
- Shuder & Osterbrock (1981) Shuder J. M., Osterbrock D. E., 1981, ApJ, 250, 55
- Singh & Chand (2018) Singh V., Chand H., 2018, MNRAS, 480, 1796
- Stalin et al. (2004a) Stalin C. S., Gopal-Krishna, Sagar R., Wiita P. J., 2004a, MNRAS, 350, 175
- Stalin et al. (2004b) Stalin C. S., Gopal Krishna, Sagar R., Wiita P. J., 2004b, Journal of Astrophysics and Astronomy, 25, 1
- Stetson (1987) Stetson P. B., 1987, PASP, 99, 191
- Stetson (1992) Stetson P. B., 1992, in Astronomical Society of the Pacific Conference Series, Vol. 25, Astronomical Data Analysis Software and Systems I, Worrall D. M., Biemesderfer C., Barnes J., eds., p. 297
- Stocke et al. (1992) Stocke J. T., Morris S. L., Weymann R. J., Foltz C. B., 1992, ApJ, 396, 487
- Sulentic et al. (2000) Sulentic J. W., Zwitter T., Marziani P., Dultzin-Hacyan D., 2000, ApJ, 536, L5
- Uchiyama et al. (2006) Uchiyama Y. et al., 2006, ApJ, 648, 910
- Urry & Padovani (1995) Urry C. M., Padovani P., 1995, PASP, 107, 803
- Visnovsky et al. (1992) Visnovsky K. L., Impey C. D., Foltz C. B., Hewett P. C., Weymann R. J., Morris S. L., 1992, ApJ, 391, 560
- Wang et al. (1996) Wang T., Brinkmann W., Bergeron J., 1996, A&A, 309, 81
- Xie et al. (1996) Xie G. Z., Zhang Y. H., Li K. H., Liu F. K., Wang J. C., Wang X. M., 1996, AJ, 111, 1065
- Yang et al. (2018) Yang H. et al., 2018, MNRAS, 477, 5127
- Yao et al. (2019) Yao S., Komossa S., Liu W.-J., Yi W., Yuan W., Zhou H., Wu X.-B., 2019, MNRAS, 487, L40
- Yao et al. (2015) Yao S., Yuan W., Zhou H., Komossa S., Zhang J., Qiao E., Liu B., 2015, MNRAS, 454, L16
- Yuan et al. (2008) Yuan W., Zhou H. Y., Komossa S., Dong X. B., Wang T. G., Lu H. L., Bai J. M., 2008, ApJ, 685, 801
- Zamanov et al. (2002) Zamanov R., Marziani P., Sulentic J. W., Calvani M., Dultzin-Hacyan D., Bachev R., 2002, ApJ, 576, L9
- Zhou et al. (2006) Zhou H., Wang T., Yuan W., Lu H., Dong X., Wang J., Lu Y., 2006, ApJS, 166, 128
- Zhou & Wang (2002) Zhou H.-Y., Wang T.-G., 2002, Chinese J. Astron. Astrophys., 2, 501
Appendix A Appendix
| NLsy1 | Date(s) of monitoring | R.A.(J2000) | Dec.(J2000) | g | r | g-r |
|---|---|---|---|---|---|---|
| Comparison stars | (h m s) | (∘ ′ ′′) | (mag) | (mag) | (mag) | |
| (1) | (2) | (3) | (4) | (5) | (6) | (7) |
| J071340.30382039.8 | 2016 March 10 | 07 13 40.29 | 38 20 39.83 | 15.40 | 15.00 | 0.40∗ |
| S1 | 07 13 45.41 | 38 20 08.52 | 17.40 | 15.40 | 2.00∗ | |
| S2 | 07 13 47.42 | 38 21 36.36 | 16.50 | 15.40 | 1.10∗ | |
| S3 | 07 13 41.90 | 38 20 57.14 | 16.00 | 15.30 | 0.70∗ | |
| J073623.14392617.9 | 2015 Nov. 04 | 07 36 23.13 | 39 26 17.88 | 16.22 | 15.91 | 0.31 |
| S1 | 07 36 27.30 | 39 28 36.67 | 16.12 | 15.56 | 0.56 | |
| S2 | 07 36 11.18 | 39 26 29.61 | 15.23 | 14.79 | 0.44 | |
| S3 | 07 36 22.37 | 39 27 17.39 | 15.20 | 15.16 | 0.04 | |
| J075245.60261735.9 | 2016 Nov. 22 | 07 52 45.60 | 26 17 35.88 | 16.79 | 16.65 | 0.14 |
| S1 | 07 53 03.29 | 26 17 08.70 | 16.93 | 16.52 | 0.41 | |
| S2 | 07 52 49.56 | 26 17 07.74 | 17.01 | 16.67 | 0.34 | |
| S3 | 07 52 49.31 | 26 17 36.11 | 16.07 | 15.74 | 0.33 | |
| J080638.98724820.5 | 2016 Feb. 06, 2017 Nov. 19, 2019 Feb. 03 | 08 06 38.98 | 72 48 20.53 | 16.40 | 15.80 | 0.60∗ |
| S1 | 2016 Feb. 06, 2017 Nov. 19, 2019 Feb. 03 | 08 06 20.59 | 72 48 16.00 | 15.74 | 14.23 | 1.44∗ |
| S2 | 2016 Feb. 06, 2017 Nov. 19, 2019 Feb. 03 | 08 06 22.31 | 72 48 47.69 | 15.50 | 14.70 | 0.80∗ |
| S3 | 2016 Feb. 06 | 08 06 25.19 | 72 49 18.15 | 17.00 | 15.60 | 1.40∗ |
| S4 | 2017 Nov. 19 | 08 06 14.47 | 72 51 48.14 | 16.40 | 15.40 | 1.00∗ |
| S5 | 2019 Feb. 03 | 08 07 17.42 | 72 48 41.73 | 17.20 | 16.20 | 1.00∗ |
| J093703.02361537.1 | 2016 Nov. 23 | 09 37 03.02 | 36 15 37.08 | 17.58 | 17.00 | 0.58 |
| S1 | 09 37 01.85 | 36 14 47.64 | 18.14 | 17.14 | 1.00 | |
| S2 | 09 37 21.41 | 36 19 18.33 | 18.25 | 16.80 | 1.45 | |
| S3 | 09 36 30.15 | 36 21 34.08 | 17.67 | 17.23 | 0.44 | |
| J100541.85433240.2 | 2016 Dec. 01 | 10 05 41.85 | 43 32 40.19 | 16.39 | 16.37 | 0.02 |
| S1 | 10 05 31.35 | 43 24 21.76 | 17.57 | 16.58 | 0.99 | |
| S2 | 10 05 32.95 | 43 30 34.54 | 17.77 | 16.71 | 1.06 | |
| S3 | 10 05 28.77 | 43 32 38.09 | 18.45 | 17.43 | 1.02 | |
| J101000.70300321.6 | 2016 Nov. 30, 2019 March 10 | 10 10 00.70 | 30 03 21.60 | 16.97 | 16.82 | 0.15 |
| S1 | 10 10 12.91 | 30 04 34.61 | 18.28 | 17.13 | 1.15 | |
| S2 | 10 10 10.51 | 30 02 25.28 | 16.65 | 16.11 | 0.54 | |
| S3 | 10 09 48.18 | 30 03 02.45 | 15.64 | 15.24 | 0.40 | |
| J140516.22255533.9 | 2019 March 23 | 14 05 16.22 | 25 55 33.96 | 15.29 | 15.40 | 0.11 |
| S1 | 14 05 10.82 | 25 58 08.37 | 14.97 | 14.49 | 0.48 | |
| S2 | 14 05 18.50 | 26 01 43.42 | 16.02 | 14.87 | 1.15 | |
| S3 | 14 05 12.93 | 26 03 51.49 | 16.20 | 14.89 | 1.31 | |
| J140827.81240924.8 | 2019 March 26 | 14 08 27.81 | 24 09 24.84 | 16.65 | 16.37 | 0.28 |
| S1 | 14 07 59.37 | 24 15 02.86 | 16.18 | 15.71 | 0.47 | |
| S2 | 14 08 14.49 | 24 13 06.99 | 16.23 | 15.63 | 0.60 | |
| S3 | 14 08 05.74 | 24 10 52.96 | 16.69 | 15.78 | 0.91 | |
| J144240.80262332.6 | 2017 May 05 | 14 42 40.80 | 26 23 32.64 | 16.68 | 16.14 | 0.54 |
| S1 | 14 41 55.52 | 26 20 19.87 | 16.03 | 15.50 | 0.53 | |
| S2 | 14 42 33.66 | 26 27 29.53 | 15.89 | 15.40 | 0.49 | |
| S3 | 14 41 49.35 | 26 19 26.46 | 15.65 | 15.21 | 0.44 | |
| J144825.10355946.7 | 2017 May 04 | 14 48 25.10 | 35 59 46.68 | 16.56 | 16.23 | 0.33 |
| S1 | 14 48 04.84 | 35 56 47.01 | 17.01 | 15.69 | 0.32 | |
| S2 | 14 48 16.22 | 35 56 16.84 | 15.75 | 15.18 | 0.57 | |
| S3 | 14 48 09.86 | 36 04 22.75 | 15.38 | 14.98 | 0.40 | |
| J151936.15283827.6 | 2019 Feb. 16 | 15 19 36.14 | 28 38 27.67 | 17.05 | 16.80 | 0.25 |
| S1 | 15 19 26.28 | 28 47 09 53 | 17.79 | 16.32 | 1.47 | |
| S2 | 15 19 12.21 | 28 41 45.49 | 16.96 | 15.74 | 1.22 | |
| S3 | 15 18 52.45 | 28 35 44.30 | 16.52 | 15.98 | 0.54 | |
| J162901.32400759.5 | 2017 May 05, 2019 April 09 | 16 29 01.32 | 40 07 59.53 | 17.77 | 16.64 | 0.13 |
| S1 | 16 28 33.12 | 40 07 28.61 | 17.61 | 17.01 | 0.60 | |
| S2 | 16 28 29.55 | 40 05 26.72 | 18.13 | 16.74 | 1.39 | |
| S3 | 16 29 07.57 | 40 13 06.50 | 18.12 | 16.69 | 1.43 | |
| J163323.59471859.0 | 2017 May 20, 2019 March 20 | 16 33 23.59 | 47 18 59.04 | 17.24 | 16.94 | 0.30 |
| S1 | 16 32 59.26 | 47 26 05.45 | 15.57 | 15.18 | 0.39 | |
| S2 | 16 32 56.00 | 47 21 01.26 | 15.55 | 15.11 | 0.44 | |
| S3 | 16 33 10.21 | 47 14 56.91 | 15.42 | 15.07 | 0.35 | |
| J170231.05324719.7 | 2019 March 10 | 17 02 31.05 | 32 47 19.68 | 15.91 | 15.82 | 0.09 |
| S1 | 17 02 41.94 | 32 49 32.93 | 16.16 | 15.71 | 0.45 | |
| S2 | 17 02 32.16 | 32 49 17.32 | 15.77 | 15.18 | 0.59 | |
| S3 | 17 02 32.84 | 32 49 55.16 | 15.43 | 14.94 | 0.49 | |
| J170330.38454047.3 | 2017 June 03, 2019 March 25 | 17 03 30.38 | 45 40 47.27 | 16.06 | 15.30 | 0.76 |
| S1 | 2017 June 03 | 17 04 33.46 | 45 41 16.10 | 15.37 | 14.68 | 0.69 |
| S2 | 2017 June 03, 2019 March 25 | 17 04 02.02 | 45 42 16.56 | 15.02 | 14.39 | 0.63 |
| S3 | 2017 June 03, 2019 March 25 | 17 04 34.88 | 45 40 08.65 | 15.00 | 13.91 | 1.09 |
| S4 | 2019 March 25 | 17 04 29.72 | 45 35 40.77 | 14.71 | 13.88 | 0.83 |
| J171304.46352333.4 | 2017 May 04 | 17 13 04.46 | 35 23 33.36 | 16.27 | 16.03 | 0.24 |
| S1 | 17 12 57.91 | 35 28 40.55 | 15.49 | 15.12 | 0.37 | |
| S2 | 17 13 33.48 | 35 19 13.05 | 15.52 | 15.08 | 0.44 | |
| S3 | 17 13 12.62 | 35 15 48.18 | 16.44 | 14.94 | 1.50 | |
| J171601.94311213.7 | 2017 April 17 | 17 16 01.94 | 31 12 13.68 | 15.89 | 15.67 | 0.22 |
| S1 | 17 15 47.58 | 31 08 22.95 | 15.31 | 14.81 | 0.50 | |
| S2 | 17 15 40.90 | 31 13 38.06 | 15.11 | 14.70 | 0.41 | |
| S3 | 17 15 42.64 | 31 07 13.85 | 15.15 | 14.67 | 0.48 | |
| Position and apparent magnitude data have been taken from the SDSS DR14 (Abolfathi et al., 2018). | ||||||
| ∗Due to the unavailability of SDSS ‘g-r’ colour, ‘B-R’ colour has been used from the USNO-A2.0 catalog (Monet, 1998). | ||||||
| NLSy1 | Date(s) of monitoring | R.A.(J2000) | Dec.(J2000) | g | r | g-r |
| Comparison stars | (h m s) | (∘ ′ ′′) | (mag) | (mag) | (mag) | |
| (1) | (2) | (3) | (4) | (5) | (6) | (7) |
| J032441.20341045.0 | 2016 Nov. 22, 23; Dec. 02; 2017 Jan. 03, 04 | 03 24 41.20 | 34 10 45.00 | 14.50 | 13.70 | 0.80∗ |
| S1 | 2016 Nov. 22, 23 | 03 24 46.40 | 34 06 37.57 | 16.00 | 15.20 | 0.80∗ |
| S2 | 2016 Nov. 22, 23; Dec. 02; 2017 Jan. 03, 04 | 03 24 53.68 | 34 12 45.62 | 15.60 | 14.40 | 1.20∗ |
| S3 | 2016 Nov. 22, 23; Dec. 02; 2017 Jan. 03, 04 | 03 24 53.55 | 34 11 16.58 | 16.20 | 14.40 | 1.80∗ |
| S4 | 2016 Dec. 02; 2017 Jan. 04 | 03 25 05.53 | 34 17 57.26 | 14.80 | 14.20 | 0.60∗ |
| S5 | 2017 Jan. 03 | 03 24 52.52 | 34 17 06.80 | 15.00 | 14.00 | 1.00∗ |
| J084957.98510829.0 | 2017 Dec. 13, 2019 April 08 | 08 49 57.98 | 51 08 29.04 | 18.92 | 18.28 | 0.64 |
| S1 | 08 50 12.62 | 51 08 08.03 | 19.45 | 18.06 | 1.39 | |
| S2 | 08 50 39.07 | 51 04 59.77 | 17.95 | 17.37 | 0.58 | |
| S3 | 08 50 03.07 | 51 09 12.23 | 17.82 | 17.09 | 0.73 | |
| J094857.32002225.6 | 2016 Dec. 02; 2017 Dec. 21 | 09 48 57.32 | 00 22 25.56 | 18.59 | 18.43 | 0.16 |
| S1 | 2016 Dec. 02; 2017 Dec. 21 | 09 48 36.95 | 00 24 22.55 | 17.69 | 17.28 | 0.41 |
| S2 | 2016 Dec. 02; 2017 Dec. 21 | 09 48 37.47 | 00 20 37.02 | 17.79 | 16.70 | 1.09 |
| S3 | 2016 Dec. 02 | 09 48 53.69 | 00 24 54.91 | 17.52 | 16.65 | 0.87 |
| S4 | 2017 Dec. 21 | 09 49 00.44 | 00 22 34.91 | 18.27 | 16.84 | 1.43 |
| J110223.37223920.5 | 2018 Jan. 15, 2019 April 09 | 11 02 23.37 | 22:47:14.20 | 19.57 | 18.10 | 1.47 |
| S1 | 11 02 17.47 | 22 38 24.31 | 19.74 | 18.28 | 1.46 | |
| S2 | 11 02 57.30 | 22 46 05.04 | 17.58 | 17.06 | 0.52 | |
| S3 | 11 02 06.45 | 22 46 23.87 | 16.56 | 16.03 | 0.53 | |
| J122222.99041315.9 | 2017 Jan. 03, 04; Feb. 21, 22; March 04, 24 | 12 22 22.99 | 04 13 15.95 | 17.02 | 16.80 | 0.22 |
| S1 | 2017 Jan. 03, 04; Feb. 21, 22; March 04, 24 | 12 22 34.02 | 04 13 21.57 | 18.63 | 17.19 | 1.44 |
| S2 | 2017 Jan. 03, 04; Feb. 21, 22; March 04, 24 | 12 21 56.12 | 04 15 15.19 | 17.22 | 16.78 | 0.44 |
| S3 | 2017 Jan. 03, 04; Feb. 21, 22; March 04 | 12 22 27.21 | 04 21 17.34 | 18.11 | 17.33 | 0.78 |
| S4 | 2017 March 24 | 12 22 21.29 | 04 21 17.43 | 16.97 | 16.43 | 0.54 |
| J150506.48032630.8 | 2017 March 25; 2018 April 12 | 15 05 06.48 | 03 26 30.84 | 18.64 | 18.22 | 0.42 |
| S1 | 15 05 32.05 | 03 28 36.13 | 18.13 | 17.64 | 0.49 | |
| S2 | 15 05 16.38 | 03 28 07.52 | 18.76 | 17.34 | 1.42 | |
| S3 | 15 04 58.23 | 03 32 16.29 | 17.37 | 16.32 | 1.05 | |
| J164442.53261913.3 | 2017 April 03; 2019 April 26 | 16 44 42.53 | 26 19 13.3 | 18.03 | 17.61 | 0.42 |
| S1 | 16 44 54.56 | 26 23 20.38 | 18.14 | 16.79 | 1.35 | |
| S2 | 16 45 20.03 | 26 20 54.55 | 16.56 | 15.89 | 0.67 | |
| S3 | 16 44 34.40 | 26 15 30.27 | 16.28 | 15.80 | 0.48 | |
| Position and apparent magnitude data have been taken from the SDSS DR14 (Abolfathi et al., 2018). | ||||||
| ∗Due to the unavailability of SDSS ‘g-r’ colour, ‘B-R’ colour has been used from the USNO-A2.0 catalog (Monet, 1998). | ||||||