Implications of Abiotic Oxygen Buildup for Earth-like Complex Life
Abstract
One of the chief paradoxes of molecular oxygen (O2) is that it is an essential requirement for multicellular eukaryotes on Earth while simultaneously posing a threat to their survival via the formation of reactive oxygen species. In this paper, the constraints imposed by O2 on Earth-like complex life are invoked to explore whether worlds with abiotic O2 inventories can harbor such organisms. By taking the major O2 sources and sinks of Earth-like planets into account using a simple model, it is suggested that worlds that receive time-averaged X-ray and extreme ultraviolet fluxes that are times higher than Earth might not be capable of hosting complex lifeforms because the photolysis of molecules such as water may lead to significant O2 buildup. Methods for testing this hypothesis by searching for anticorrelations between biosignatures and indicators of abiotic O2 atmospheres are described. In the event, however, that life successfully adapts to high-oxygen environments, these worlds could permit the evolution of large and complex organisms.
1 Introduction
The evolution of oxygenic photosynthesis and the subsequent rise in the inventories of atmospheric and oceanic molecular oxygen (O2) is known to have caused a dramatic transformation of Earth’s biosphere (Knoll, 2015). Among other factors, the rise in O2 levels is believed to have facilitated the emergence of multicellular eukaryotic life on Earth (Nursall, 1959). In a similar vein, it has been argued that O2 ranks high among the list of desiderata for complex multicellularity to arise elsewhere (Catling et al., 2005; Ward et al., 2019).
However, the presence of O2 is a double-edged sword, seeing as how complex multicellular organisms cannot live without it, but the very same gas poses an incessant threat to their existence. It is for this reason that this issue has been dubbed the “oxygen paradox” (Davies, 1995). The threat posed by O2 is a direct consequence of its chemical properties, namely, the fact that it has two unpaired electrons. Cells offer plenty of pathways by which molecular oxygen can be reduced to yield highly reactive intermediates, which in turn are responsible for oxygen toxicity (Halliwell & Gutteridge, 2015). Thus, on the one hand, O2 seems to be an essential prerequisite for complex life, but on the other, high concentrations of O2 are potentially lethal to these organisms.
Hence, it is apparent that a careful analysis of the atmospheric O2 inventories of other worlds is warranted from a biological standpoint. This issue acquires an additional significance when recent developments in exoplanetary science are duly taken into account. In particular, M-dwarf exoplanets have attracted a great deal of attention from both theoretical and observational standpoints, partly due to their commonality and partly because of the discovery of several high-profile exoplanetary systems in recent times (Lingam & Loeb, 2019a). One of the most notable among them has to do with the high X-ray and extreme ultraviolet (XUV) fluxes received by these planets (Linsky, 2019).
A number of models suggest that high XUV fluxes play a vital role in the buildup of massive O2 atmospheres by way of desiccation and photolysis (Kasting, 1988; Wordsworth & Pierrehumbert, 2014; Ramirez & Kaltenegger, 2014; Luger & Barnes, 2015; Bolmont et al., 2017; Palubski et al., 2020). However, other models indicate that this buildup may be mitigated by a number of mechanisms that may result in modest O2 accumulation and H2O retention (Tian, 2015; Wordsworth et al., 2018; Harman et al., 2018; Johnstone, 2020). At this juncture, it is essential to recognize that the buildup of dense abiotic O2 atmospheres is often (but not always) accompanied by the depletion of surface water, because it serves as the source for oxygen by undergoing evaporation and photolysis by XUV radiation. Hence, the resultant desiccation could also impose stringent constraints on their habitability, although this issue depends on the initial water inventories of these worlds (Tian et al., 2018).
Hence, in the event that the buildup of massive O2 atmospheres is rendered feasible by abiotic means, there are two phenomena that merit consideration. First, the requirements for Earth-like complex life can be assessed by drawing upon the available data for oxygen toxicity. Second, if life does find a way to adapt to the myriad challenges posed by hyperoxic environments, the high O2 concentrations become a boon of sorts and permit the evolution of large organisms, although high levels of O2 could fuel fires that may engender other difficulties for life. To some degree, the trend toward larger organismal size has been observed in the Permo-Carboniferous period, where elevated O2 levels - roughly higher than the present-day value (Graham & Aguilar, 1995) - exhibit a strong positive correlation with an increase in maximal insect sizes (Harrison et al., 2010; Clapham & Karr, 2012). Insect gigantism was prevalent in this epoch with dragonflies of genus Meganeura reaching wingspans of m (Taylor & Lewis, 2005; Smith et al., 2016).
It is therefore the goal of this paper to explore the above two issues. In Sec. 2, we provide a primer on oxygen toxicity and discuss the threshold(s) at which O2 becomes lethal to Earth-based complex multicellular organisms. Next, we develop a simple model in Sec. 3 that takes the major O2 sources and sinks into account to assess the partial pressure of atmospheric oxygen. This is followed by a presentation of our central results in Sec. 4. We conclude with a summary of our findings and their accompanying implications in Sec. 5.
2 Oxygen Toxicity: A Synopsis
By the 1960s, it was already well established that high concentrations of O2 were responsible for the inhibition of metabolic processes in eukaryotes as well as prokaryotes due to the intricate interactions between O2 and a number of proteins such as flavoproteins and ferredoxins (Haugaard, 1968). Subsequently, a number of experiments have been conducted to uncover the mechanisms by which O2 can cause extensive damage.
Of the various model organisms, Escherichia coli has been the most widely studied (Imlay, 2013). When subjected to high extracellular oxygen concentrations, the diffusion of O2 across cellular membranes is followed by the abstraction of electrons from reduced flavoprotein cofactors, thereby driving the formation of reactive oxygen species (ROS) such as superoxide (O) and hydrogen peroxide (H2O2). The resultant ROS suppress enzymatic activity (especially in the case of metalloenzymes) and damage lipid membranes as well as DNA (Jamieson, 1989), thus promoting mutagenesis and impairing organismal growth (Imlay, 2003).
Both prokaryotes and eukaryotes are adversely impacted at high concentrations of O2, with the latter typically displaying higher sensitivity to hyperoxia than the former (Baez & Shiloach, 2014). A number of studies have established that microbes such as Enterococcus faecalis, Bacillus subtilis, Lactobacillus sake, Vibrio vulnificus and E. coli experience inhibition of respiration and growth to varying degrees when the partial pressure of oxygen () exceeds atm (Gregory et al., 1974; Boehme et al., 1976; Harley et al., 1978; Amanatidou et al., 2001; Tsuneyoshi et al., 2001; Tamura et al., 2012). Experiments suggest that atm of O2 constitutes a lethal limit for the likes of Saccharomyces cerevisiae and E. coli (Gregory et al., 1974).
The oxygen tolerance levels for animals tend to be lower in general. For example, the exposure of rats to hyperoxic environments comprising O2 for several days caused respiratory failure and death (Crapo et al., 1980; Olivera et al., 1995) and similar effects have been documented for humans (Kallet & Matthay, 2013). Likewise, the exposure of human, Chinese hamster, and mouse cells to oxygen partial pressures of atm was accompanied by a strong inhibition of cell growth and extensive DNA damage (Lin & Miller, 1992; Cacciuttolo et al., 1993; Martinez-Cayuela, 1995). Aside from animals, plants are also very susceptible to oxygen toxicity as they undergo cell wall damage, diminished seed viability, and inhibition of chloroplast growth, to name a few (Schloss, 2002; Gill & Tuteja, 2010).
At the same time, however, it is important to recognize that a number of defense mechanisms exist to combat the deleterious effects of ROS. Antioxidant compounds such as glutathione, ubiquinone, and the vitamins C and E are selectively oxidized to protect more sensitive components of cells from the same fate (Cadenas, 1989). A number of antioxidant enzymes, such as the superoxide dismutases and quinone reductases, catalyze the transformation of oxidants into less reactive species (Fridovich, 1995; Davies, 1995). Furthermore, DNA-repair enzymes, phospholipases, and proteasomes collectively act to recognize and eliminate cellular components that have been oxidized (Pryor et al., 2006).
As the preceding discussion illustrates, the identification of “universal” limits for oxygen toxicity is rendered complex due to the fact that physiological damage is dependent not only on the partial pressure of O2 but also the exposure time and the rich palette of antioxidant mechanisms at play. With these caveats in mind, the threshold for complex multicellular life (after sufficiently long exposure) on Earth appears to be - atm (Halliwell & Gutteridge, 2015, Section 1.5). Hence, this range is adopted henceforth in our analysis, albeit with the explicit acknowledgement that our analysis is indubitably parochial by virtue of its Earth-centric focus.
Although parochial in nature, studies of this nature are nonetheless advantageous because they permit us to make concrete and testable predictions and could play a valuable role in the selection of target planets. It is for this reason that Earth-based limits are routinely employed in astrobiological studies, with the recent formulation of the habitable zone (HZ) for complex life based on CO2 and CO constraints (Schwieterman et al., 2019) constituting a compelling example of this approach.
3 Oxygen sources and sinks on Earth-like planets
In keeping with the prior outlook, we will restrict ourselves to worlds that are near-exact geological analogs of modern Earth. There are a number of sources and sinks for O2 that must be taken into consideration. As we wish to study the consequences of abiotic O2 buildup, we will set aside the contribution arising from organic carbon burial (i.e., involving photosynthesis).
We begin by quantifying the various sources of O2. Aside from organic carbon, the burial of pyrite and Fe2+ acts as an effective source. The net production of O2 via this pathway is estimated using Catling & Kasting (2017, Table 10.1), which yields
| (1) |
where denotes the radius of the world. In the above expression as well as subsequent equations, the scaling enters because the flux is held constant for analogs of modern Earth (Lingam & Loeb, 2019b). Here, we have expressed our result in units of bar/Myr as it will be convenient shortly hereafter. The other major source term for O2 entails the evaporation of water followed by H2O photolysis and hydrogen escape, thereby facilitating the buildup of atmospheric O2 (Luger & Barnes, 2015). The net production of O2 through this channel is determined by synthesizing two expressions (Lingam & Loeb, 2019a, Equations 11-13) as follows:
| (2) |
where denotes the average XUV flux incident on Earth and represents the Heaviside function. Here, we have adopted an XUV absorption efficiency of (Luger & Barnes, 2015; Bolmont et al., 2017) and utilized the mass-radius relationship (Zeng et al., 2016). The critical XUV flux () where the change in scaling occurs is defined as
| (3) |
Next, we turn our attention to the various O2 sinks. The first major sink worth noting entails contintental weathering, which is further decomposed into contributions from carbon, sulfide and Fe2+ weathering. From Catling & Kasting (2017, Table 10.2), the ensuing contribution to the total O2 budget is
| (4) |
where the negative sign on the RHS signifies the presence of an O2 sink. Aside from continental weathering, the depletion of O2 occurs due to reactions with reducing gases from volcanism, serpentinization and metamorphism. As per Catling & Kasting (2017, Table 10.3), the contribution from this sink is expressible as
| (5) |
Another major sink, often overlooked in most studies, entails the non-thermal escape of O+ ions due to stellar wind stripping (Lammer, 2013; Lingam & Loeb, 2019a). Although the complexity of this phenomenon requires numerical modeling using multi-fluid magnetohydrodynamics (Garcia-Sage et al., 2017; Dong et al., 2017b, a, 2018a; Airapetian et al., 2019), we will adopt the simple analytic prescription delineated in Airapetian et al. (2017) instead. If the O+ ions are assumed to be sourced from oxygen (Dong et al., 2019, Table 1), by using Airapetian et al. (2017, Equation 1), we have
| (6) |
The above sink exhibits the same functional dependence on and as that of the photochemical escape of hot O (Cravens et al., 2017), but the latter appears to constitute a smaller sink in comparison across the world’s entire history (Dong et al., 2018b), owing to which it may be neglected herein.
In principle, it is straightforward to estimate the total amount of atmospheric O2 that is generated over a given time interval () by applying the following formula.
| (7) |
where is obtained by summing (1)-(6) accordingly. At this stage, we encounter an immediate difficulty because all of the source and sink terms are time-dependent functions. In consequence, a rigorous calculation of the above integral is not feasible because of the many unknowns involved ranging from XUV evolution (Tian, 2015) to the water inventory and redox history of the Earth-analog. Hence, we introduce the simplifying assumption that the variables in the source and sink terms are roughly held constant at their present-day measured values.111Based on the fact that is a linear function of , we can interpret the latter quantity henceforth as the temporal average of the XUV flux over the age of the world. As explained in Sec. 2, the criterion is necessary for the sustenance of Earth-like complex life, which implies that
| (8) |
where the integral in (7) has been eliminated on account of the prior assumption. By using this inequality, we can gauge the parameter space wherein the existence of Earth-like complex life might be feasible.
Before doing so, a couple of important observations are in order. First, we wish to reiterate that the most dominant source of O2, corresponding to (3), is concomitantly accompanied by the loss of H2O. In fact, the depletion of bars of H2O - which is equivalent to the production of bars of O2 assuming that the stoichiometric ratio is preserved - would result in the complete loss of Earth’s oceans. By inspecting (3), we see that the depletion of many times the water inventory of Earth’s oceans is conceivable at high enough XUV fluxes. It must be noted, however, that this does not translate to a death knell for the habitability of all worlds because some of them may have sufficiently high water inventories to avoid total desiccation (Kuchner, 2003; Léger et al., 2004; Kite & Ford, 2018).
Second, we have implicitly assumed that is static through time in (8), although we did highlight the temporal dependence of . In actuality, a time-independent choice of constitutes an oversimplification, because the threshold for multicellular eukaryotes is not necessarily the same as that of microbes (especially anaerobic ones) and prebiotic compounds. For example, in the case of the latter, the synthesis of prebiotic compounds, and potentially the origin of life, is believed to have required a reducing atmosphere (McCollom, 2013; Luisi, 2016); to put it differently, the synthesis of biomolecules may be suppressed in massive O2 atmospheres as they could undergo rapid oxidation. Moreover, putative organisms might have to compete with O2 to access the free energy from redox reactions with organic molecules (Luger & Barnes, 2015, Section 6.3). The amount of energy to synthesize the same quantity of biomass is approximately times higher in oxygenated environments compared to their anoxic counterparts (McCollom & Amend, 2005, Table 4).
Therefore, the ensuing analysis is predicated on the premise that microbial life is already existent on the world,222A potential avenue by which this might occur is through interstellar panspermia (Belbruno et al., 2012; Lingam & Loeb, 2018a; Ginsburg et al., 2018), although this pathway faces many of its own challenges (Melosh, 2003; Nicholson, 2009). because we will restrict ourselves to exploring the prospects for Earth-like complex biota. A more encompassing and realistic study will, however, need to explicitly account for the temporal aspects of evolution and thereby assess whether: (i) life is capable of emerging on worlds with highly oxygenated atmospheres, and (ii) microbial lifeforms could subsequently become more complex over time via eco-evolutionary processes.
4 Prospects for Complex Life
The inequality (8) comprises three different variables, namely, , and and must be evaluated for two different choices of (viz. atm and atm) for reasons outlined previously in Sec. 2.
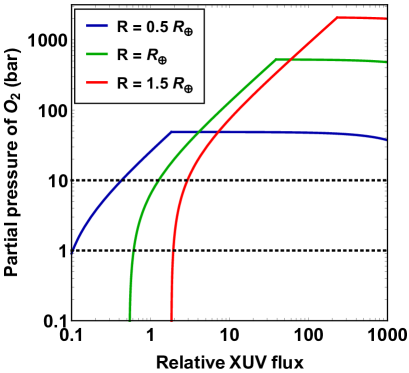
Our final results are depicted in Fig. 1. A number of general conclusions can be drawn from this figure. To begin with, for and , we find that Gyr becomes feasible. In other words, for this class of worlds, the buildup of atmospheric O2 is sufficiently low to avoid the dangers of oxygen toxicity. However, once we enter the regime of , we observe that Myr is necessary to avoid the harmful effects of oxygen toxicity; this bound is applicable to all sizes considered herein. Hence, at sufficiently high XUV fluxes, the sustenance of Earth-like complex life is rendered very difficult on most planets.
A synthesis of paleontological, phylogenetic and theoretical evidence indicates that the origin of life on Earth required at most Myr after its formation (Dodd et al., 2017; Betts et al., 2018; Benner et al., 2019). On the other hand, the emergence of complex multicellular life, required a few Gyr, although this delay was partly a consequence of low atmospheric O2 (Knoll, 2015).333This issue of oxygen paucity is, however, unlikely to be an issue on worlds with substantial abiotic O2. While these timescales are valid for Earth, we cannot infer much from this single datum (Spiegel & Turner, 2012). Nevertheless, in the absence of further information, we will choose Myr as a fiducial lower bound on the time required for the origin of complex multicellularity (McKay, 1996; Lingam & Loeb, 2018b).
For this choice, we invoke the inequality (8) and plot the ensuing results in Fig. 2. The first trend we discern is that larger worlds exhibit lower O2 buildup at smaller values of the XUV flux, but eventually increase rapidly and undergo near-saturation; the saturation thresholds are found to increase monotonically with the size of the world. Second, irrespective of the choice of , we find that is fulfilled only for relatively modest values of . More specifically, we require to ensure that stays within the requisite limit(s).
The XUV fluxes of the TRAPPIST-1 planetary system (Bourrier et al., 2017, Table 1), Proxima b (Ribas et al., 2016, Table 2), LHS 1140 b (Spinelli et al., 2019, Section 2), and the recently discovered TOI-700 d (Gilbert et al., 2020, Section 7.2) are at least an order of magnitude higher than that of Earth. Moreover, their ages are on the order of a few Gyr at the minimum. When both of these results are substituted into (7), we end up with that exceeds the desired threshold by a few orders of magnitude. Thus, at least insofar as Earth-like complex life is concerned, these worlds might have a low likelihood of hosting such lifeforms.
Let us, however, adopt the premise that highly efficient antioxidant mechanisms are functional on worlds with substantial abiotic O2 atmospheres. This brings up an interesting corollary. As the atmospheric O2 inventory increases, so too does the maximal size of organisms that are reliant on “simple” mechanisms of O2 capture and transport, with diffusion and blood circulation constituting two common examples. For the latter two cases, the theoretical sizes were estimated in Alexander (1971) and Catling et al. (2005). Although the scaling laws are independent of the organismal geometry, the prefactors are dependent on it. In view of this fact, by drawing upon Catling et al. (2005, Table 2), the following heuristic scaling relations are formulated:
| (9a) | |||
| (9b) | |||
where and denote the maximal sizes of organisms reliant on diffusion and circulation, respectively. We caution that the above scalings represent an oversimplification because physiological parameters such as metabolic rate and permeability of O2 through tissue were held fixed. Based on Fig. 2, it is conceivable that atmospheres with - bar could exist on certain worlds (Luger & Barnes, 2015). By invoking (9) for this range, we obtain - m and - m. Thus, even in the absence of sophisticated respiratory systems (e.g., lungs and gills), organisms that are adapted to live in hyperoxic environments might be capable of attaining great sizes.
Furthermore, in light of the positive scaling between brain mass (and neurons) and body mass (Herculano-Houzel, 2016), worlds with high oxygen inventories may prove to be amenable to the development of large brains and concomitant high intelligence. This notion can be further quantified heuristically in the following fashion. Denoting the brain mass by and the body mass by , we use the scaling (Harvey & Krebs, 1990; Weisbecker & Goswami, 2010). Next, we use the fact that metabolic theory and empirical data suggests that neuron mass () scales as (Savage et al., 2007). Hence, the total number of neurons in the brain () scales as . Lastly, we draw upon the geometric scaling (where is the body size) to end up with .
Now, let us suppose that the hypothetical organisms under question reach a size that is some fixed fraction of the maximal size. In quantitative terms, this amounts to presuming that or depending on the context. Of the two categories, organisms with circulatory systems are probably more well-suited for the development of large brains as they enable the efficient delivery of nutrients and oxygen to the brain (Shulman et al., 2004). Hence, by utilizing (9b) in conjunction with the aforementioned scalings, we finally arrive at
| (10) |
Therefore, as the scaling with is quite pronounced, it suggests that the total number of neurons can become quite large in highly oxygenated environments. As the number of neurons is a reasonable proxy for intelligence (Herculano-Houzel, 2016), worlds with high O2 inventories (at least up to a certain limit) might provide conducive environments for the advent of organisms with sophisticated cognitive abilities.
5 Discussion and Conclusions
In this work, we sought to investigate the constraints placed by oxygen toxicity on putative Earth-like complex lifeforms on other worlds. We began with a brief summary of how oxygen becomes toxic to both prokaryotes and eukaryotes at high concentrations, and described tentative limits on the maximum partial pressures of O2 () that are tolerable by Earth’s biota.
Next, we described the various sinks and sources of O2 and employed them to construct a dynamical model for the evolution of atmospheric O2 over time. By imposing the condition must hold true, we studied the prospects for complex life in Figs. 1 and 2. One of the major results from the analysis was that worlds that receive temporally averaged XUV fluxes that are an order of magnitude more than Earth are potentially likely to exceed the limits of oxygen toxicity for Earth-based life. Hence, this casts doubt on whether M-dwarf exoplanets such as Proxima b and the TRAPPIST-1 system could host Earth-like complex life. In the event that complex life can survive in hyperoxic environments, we estimated the maximal sizes attainable by organisms and showed that these limits become very large with respect to Earth.
The hypothesis presented in this paper is complementary to that espoused in Schwieterman et al. (2019) in two respects. First, Schwieterman et al. (2019) showed that CO2 toxicity may move the outer edge of the HZ inward, as higher CO2 concentrations can prevail at the outer edge, whereas this work suggests that O2 toxicity might shift the inner edge of the HZ outward due to the higher XUV fluxes and abiotic buildup of O2. Second, the analysis by Schwieterman et al. (2019) indicates that the accumulation of CO (which is toxic to many metazoans on Earth) in atmospheres of M-dwarf exoplanets may render them uninhabitable, while this paper implies that exoplanets around M-dwarfs could become inhospitable to Earth-like biota because of their high XUV fluxes, which aid in abiotic O2 buildup and cause O2 toxicity in the process. Therefore, in a nutshell, CO2, CO and O2 toxicity might jointly conspire to preclude complex Earth-like life on many M-dwarf exoplanets.
Some of the major caveats concerning our analysis are worth pointing out here. First, as noted previously, we made the simplifying assumption that the threshold as well as the various sources and sinks of oxygen resemble those of modern Earth and are roughly constant over time. Second, our work does not take nonlinear feedbacks for O2 regulation - such as fires and their capacity to destroy organic matter (Killops & Killops, 2005) - into account. Third, the absorption of O2 by magma oceans especially during the pre-main-sequence phase (Wordsworth et al., 2018), and elimination of oxygen by NOx species produced during lightning (Harman et al., 2018) are two potentially important effects not incorporated in our simple model, both of which might suppress the buildup of abiotic O2. On the other hand, high fluxes of stellar energetic particles generated by active stars could facilitate the accumulation of O2 (Lingam et al., 2018), which is also not addressed herein.
On account of the numerous simplifications involved, we must ask ourselves whether the model yields predictions that are readily testable (or falsifiable). The answer is seemingly in the affirmative as described below. For starters, recall that this model suggests that worlds with would not host complex life and vice-versa. The identification of substantial abiotic O2 is feasible through a number of avenues, of which two of the best known metrics are dimer O2-O2 collisional absorption bands at visible wavelengths and CO features in the mid-infrared (Misra et al., 2014; Schwieterman et al., 2016). The presence of complex life may be inferred through a number of avenues ranging from the vegetation red edge (Schwieterman et al., 2018) and phase-angle-dependent reflectance (Doughty & Wolf, 2010) to atmospheric seasonality (Olson et al., 2018) and transient oceanic phenomena (Lingam & Loeb, 2018c).
Hence, in the event that the biosignatures are discovered simultaneously in the absence of markers for high abiotic O2, it would lend credence to the notion that relatively modest oxygen levels place a vital constraint on complex life. In contrast, if biosignatures of complex life are discovered concomitantly with massive inventories of abiotic O2, it would imply that oxygen toxicity is not an innate limiting factor for complex life, contra the hypothesis espoused in this paper. Therefore, by carefully distinguishing between the various scenarios using appropriate data from future telescopes, it might be possible to gauge whether excessive O2 constitutes a universal bane for complex multicellular life.
References
- Airapetian et al. (2017) Airapetian, V. S., Glocer, A., Khazanov, G. V., et al. 2017, Astrophys. J. Lett., 836, L3, doi: 10.3847/2041-8213/836/1/L3
- Airapetian et al. (2019) Airapetian, V. S., Barnes, R., Cohen, O., et al. 2019, Int. J. Astrobiol., arXiv:1905.05093, doi: 10.1017/S1473550419000132
- Alexander (1971) Alexander, R. M. 1971, Size and Shape (Edward Arnold)
- Amanatidou et al. (2001) Amanatidou, A., Bennik, M. H., Gorris, L. G., & Smid, E. J. 2001, Arch. Microbiol., 176, 79, doi: 10.1007/s002030100297
- Baez & Shiloach (2014) Baez, A., & Shiloach, J. 2014, Microb. Cell Fact., 13, 181, doi: 10.1186/s12934-014-0181-5
- Belbruno et al. (2012) Belbruno, E., Moro-Martín, A., Malhotra, R., & Savransky, D. 2012, Astrobiology, 12, 754, doi: 10.1089/ast.2012.0825
- Benner et al. (2019) Benner, S. A., Bell, E. A., Biondi, E., et al. 2019, ChemSystemsChem, arXiv:1908.11327, doi: 10.1002/syst.201900035
- Betts et al. (2018) Betts, H. C., Puttick, M. N., Clark, J. W., et al. 2018, Nat. Ecol. Evol., 2, 1556, doi: 10.1038/s41559-018-0644-x
- Boehme et al. (1976) Boehme, D. E., Vincent, K., & Brown, O. R. 1976, Nature, 262, 418, doi: 10.1038/262418a0
- Bolmont et al. (2017) Bolmont, E., Selsis, F., Owen, J. E., et al. 2017, Mon. Not. R. Astron. Soc., 464, 3728, doi: 10.1093/mnras/stw2578
- Bourrier et al. (2017) Bourrier, V., Ehrenreich, D., Wheatley, P. J., et al. 2017, Astron. Astrophys., 599, L3, doi: 10.1051/0004-6361/201630238
- Cacciuttolo et al. (1993) Cacciuttolo, M. A., Trinh, L., Lumpkin, J. A., & Rao, G. 1993, Free Radic. Biol. Med., 14, 267, doi: 10.1016/0891-5849(93)90023-n
- Cadenas (1989) Cadenas, E. 1989, Annu. Rev. Biochem., 58, 79, doi: 10.1146/annurev.bi.58.070189.000455
- Catling et al. (2005) Catling, D. C., Glein, C. R., Zahnle, K. J., & McKay, C. P. 2005, Astrobiology, 5, 415, doi: 10.1089/ast.2005.5.415
- Catling & Kasting (2017) Catling, D. C., & Kasting, J. F. 2017, Atmospheric Evolution on Inhabited and Lifeless Worlds (Cambridge University Press)
- Clapham & Karr (2012) Clapham, M. E., & Karr, J. A. 2012, Proc. Natl. Acad. Sci. USA, 109, 10927, doi: 10.1073/pnas.1204026109
- Crapo et al. (1980) Crapo, J. D., Barry, B. E., Foscue, H. A., & Shelburne, J. 1980, Am. Rev. Respir. Dis., 122, 123, doi: 10.1164/arrd.1980.122.1.123
- Cravens et al. (2017) Cravens, T. E., Rahmati, A., Fox, J. L., et al. 2017, J. Geophys. Res. A, 122, 1102, doi: 10.1002/2016JA023461
- Davies (1995) Davies, K. J. A. 1995, Biochem. Soc. Symp., 61, 1, doi: 10.1042/bss0610001
- Dodd et al. (2017) Dodd, M. S., Papineau, D., Grenne, T., et al. 2017, Nature, 543, 60, doi: 10.1038/nature21377
- Dong et al. (2019) Dong, C., Huang, Z., & Lingam, M. 2019, Astrophys. J. Lett., 882, L16, doi: 10.3847/2041-8213/ab372c
- Dong et al. (2017a) Dong, C., Huang, Z., Lingam, M., et al. 2017a, Astrophys. J. Lett., 847, L4, doi: 10.3847/2041-8213/aa8a60
- Dong et al. (2018a) Dong, C., Jin, M., Lingam, M., et al. 2018a, Proc. Natl. Acad. Sci. USA, 115, 260, doi: 10.1073/pnas.1708010115
- Dong et al. (2017b) Dong, C., Lingam, M., Ma, Y., & Cohen, O. 2017b, Astrophys. J. Lett., 837, L26, doi: 10.3847/2041-8213/aa6438
- Dong et al. (2018b) Dong, C., Lee, Y., Ma, Y., et al. 2018b, Astrophys. J. Lett., 859, L14, doi: 10.3847/2041-8213/aac489
- Doughty & Wolf (2010) Doughty, C. E., & Wolf, A. 2010, Astrobiology, 10, 869, doi: 10.1089/ast.2010.0495
- Fridovich (1995) Fridovich, I. 1995, Annu. Rev. Biochem., 64, 97, doi: 10.1146/annurev.bi.64.070195.000525
- Garcia-Sage et al. (2017) Garcia-Sage, K., Glocer, A., Drake, J. J., Gronoff, G., & Cohen, O. 2017, Astrophys. J. Lett., 844, L13, doi: 10.3847/2041-8213/aa7eca
- Gilbert et al. (2020) Gilbert, E. A., Barclay, T., Schlieder, J. E., et al. 2020, Astrophys. J., arXiv:2001.00952. https://arxiv.org/abs/2001.00952
- Gill & Tuteja (2010) Gill, S. S., & Tuteja, N. 2010, Plant physiology and biochemistry, 48, 909, doi: 10.1016/j.plaphy.2010.08.016
- Ginsburg et al. (2018) Ginsburg, I., Lingam, M., & Loeb, A. 2018, Astrophys. J. Lett., 868, L12, doi: 10.3847/2041-8213/aaef2d
- Graham & Aguilar (1995) Graham, J. B., & Aguilar, N. M. 1995, Nature, 375, 117, doi: 10.1038/375117a0
- Gregory et al. (1974) Gregory, E. M., Goscin, S. A., & Fridovich, I. 1974, J. Bacteriol., 117, 456
- Halliwell & Gutteridge (2015) Halliwell, B., & Gutteridge, J. M. C. 2015, Free Radicals in Biology and Medicine, 5th edn. (Oxford University Press)
- Harley et al. (1978) Harley, J. B., Santangelo, G. M., Rasmussen, H., & Goldfine, H. 1978, J. Bacteriol., 134, 808
- Harman et al. (2018) Harman, C. E., Felton, R., Hu, R., et al. 2018, Astrophys. J., 866, 56, doi: 10.3847/1538-4357/aadd9b
- Harrison et al. (2010) Harrison, J. F., Kaiser, A., & VandenBrooks, J. M. 2010, Proc. R. Soc. B, 277, 1937, doi: 10.1098/rspb.2010.0001
- Harvey & Krebs (1990) Harvey, P. H., & Krebs, J. R. 1990, Science, 249, 140, doi: 10.1126/science.2196673
- Haugaard (1968) Haugaard, N. 1968, Physiol. Rev., 48, 311, doi: 10.1152/physrev.1968.48.2.311
- Herculano-Houzel (2016) Herculano-Houzel, S. 2016, The Human Advantage: A New Understanding of How Our Brain Became Remarkable (The MIT Press)
- Imlay (2003) Imlay, J. A. 2003, Annu. Rev. Microbiol., 57, 395, doi: 10.1146/annurev.micro.57.030502.090938
- Imlay (2013) —. 2013, Nat. Rev. Microbiol., 11, 443, doi: 10.1038/nrmicro3032
- Jamieson (1989) Jamieson, D. 1989, Free Radic. Biol. Med., 7, 87, doi: 10.1016/0891-5849(89)90103-2
- Johnstone (2020) Johnstone, C. P. 2020, Astrophys. J., 890, 79, doi: 10.3847/1538-4357/ab6224
- Kallet & Matthay (2013) Kallet, R. H., & Matthay, M. A. 2013, Respir. Care, 58, 123, doi: 10.4187/respcare.01963
- Kasting (1988) Kasting, J. F. 1988, Icarus, 74, 472, doi: 10.1016/0019-1035(88)90116-9
- Killops & Killops (2005) Killops, S. D., & Killops, V. J. 2005, Introduction to Organic Geochemistry, 2nd edn. (Blackwell Publishing)
- Kite & Ford (2018) Kite, E. S., & Ford, E. B. 2018, Astrophys. J., 864, 75, doi: 10.3847/1538-4357/aad6e0
- Knoll (2015) Knoll, A. H. 2015, Life on a Young Planet: The First Three Billion Years of Evolution on Earth, Princeton Science Library (Princeton University Press)
- Kuchner (2003) Kuchner, M. J. 2003, Astrophys. J. Lett., 596, L105, doi: 10.1086/378397
- Lammer (2013) Lammer, H. 2013, Origin and Evolution of Planetary Atmospheres (Springer), doi: 10.1007/978-3-642-32087-3
- Léger et al. (2004) Léger, A., Selsis, F., Sotin, C., et al. 2004, Icarus, 169, 499, doi: 10.1016/j.icarus.2004.01.001
- Lin & Miller (1992) Lin, A. A., & Miller, W. M. 1992, Ann. NY Acad. Sci., 665, 117, doi: 10.1111/j.1749-6632.1992.tb42579.x
- Lingam et al. (2018) Lingam, M., Dong, C., Fang, X., Jakosky, B. M., & Loeb, A. 2018, Astrophys. J., 853, 10, doi: 10.3847/1538-4357/aa9fef
- Lingam & Loeb (2018a) Lingam, M., & Loeb, A. 2018a, Astron. J., 156, 193, doi: 10.3847/1538-3881/aae09a
- Lingam & Loeb (2018b) —. 2018b, J. Cosmol. Astropart. Phys., 2018, 020, doi: 10.1088/1475-7516/2018/05/020
- Lingam & Loeb (2018c) —. 2018c, Astrobiology, 18, 967, doi: 10.1089/ast.2017.1718
- Lingam & Loeb (2019a) —. 2019a, Rev. Mod. Phys., 91, 021002, doi: 10.1103/RevModPhys.91.021002
- Lingam & Loeb (2019b) —. 2019b, Astron. J., 157, 25, doi: 10.3847/1538-3881/aaf420
- Linsky (2019) Linsky, J. 2019, Lecture Notes in Physics, Vol. 955, Host Stars and their Effects on Exoplanet Atmospheres (Springer), doi: 10.1007/978-3-030-11452-7
- Luger & Barnes (2015) Luger, R., & Barnes, R. 2015, Astrobiology, 15, 119, doi: 10.1089/ast.2014.1231
- Luisi (2016) Luisi, P. L. 2016, The Emergence of Life: From Chemical Origins to Synthetic Biology, 2nd edn. (Cambridge University Press)
- Martinez-Cayuela (1995) Martinez-Cayuela, M. 1995, Biochimie, 77, 147, doi: 10.1016/0300-9084(96)88119-3
- McCollom (2013) McCollom, T. M. 2013, Annu. Rev. Earth Planet. Sci., 41, 207, doi: 10.1146/annurev-earth-040610-133457
- McCollom & Amend (2005) McCollom, T. M., & Amend, J. P. 2005, Geobiology, 3, 135, doi: 10.1111/j.1472-4669.2005.00045.x
- McKay (1996) McKay, C. P. 1996, in Circumstellar Habitable Zones, ed. L. R. Doyle (Travis House Publications), 405–419
- Melosh (2003) Melosh, H. J. 2003, Astrobiology, 3, 207, doi: 10.1089/153110703321632525
- Misra et al. (2014) Misra, A., Meadows, V., Claire, M., & Crisp, D. 2014, Astrobiology, 14, 67, doi: 10.1089/ast.2013.0990
- Nicholson (2009) Nicholson, W. L. 2009, Trends Microbiol., 17, 243, doi: 10.1016/j.tim.2009.03.004
- Nursall (1959) Nursall, J. R. 1959, Nature, 183, 1170, doi: 10.1038/1831170b0
- Olivera et al. (1995) Olivera, W. G., Ridge, K. M., & Sznajder, J. I. 1995, Am. J. Respir. Crit. Care Med., 152, 1229, doi: 10.1164/ajrccm.152.4.7551375
- Olson et al. (2018) Olson, S. L., Schwieterman, E. W., Reinhard, C. T., et al. 2018, Astrophys. J. Lett., 858, L14, doi: 10.3847/2041-8213/aac171
- Palubski et al. (2020) Palubski, I. Z., Shields, A. L., & Deitrick, R. 2020, Astrophys. J., 890, 30, doi: 10.3847/1538-4357/ab66b2
- Pryor et al. (2006) Pryor, W. A., Houk, K. N., Foote, C. S., et al. 2006, Am. J. Physiol. Regul. Integr. Comp. Physiol., 291, R491, doi: 10.1152/ajpregu.00614.2005
- Ramirez & Kaltenegger (2014) Ramirez, R. M., & Kaltenegger, L. 2014, Astrophys. J. Lett., 797, L25, doi: 10.1088/2041-8205/797/2/L25
- Ribas et al. (2016) Ribas, I., Bolmont, E., Selsis, F., et al. 2016, Astron. Astrophys., 596, A111, doi: 10.1051/0004-6361/201629576
- Savage et al. (2007) Savage, V. M., Allen, A. P., Brown, J. H., et al. 2007, Proc. Natl. Acad. Sci. USA, 104, 4718, doi: 10.1073/pnas.0611235104
- Schloss (2002) Schloss, J. V. 2002, Planta, 216, 38, doi: 10.1007/s00425-002-0905-3
- Schwieterman et al. (2019) Schwieterman, E. W., Reinhard, C. T., Olson, S. L., Harman, C. E., & Lyons, T. W. 2019, Astrophys. J., 878, 19, doi: 10.3847/1538-4357/ab1d52
- Schwieterman et al. (2016) Schwieterman, E. W., Meadows, V. S., Domagal-Goldman, S. D., et al. 2016, Astrophys. J. Lett., 819, L13, doi: 10.3847/2041-8205/819/1/L13
- Schwieterman et al. (2018) Schwieterman, E. W., Kiang, N. Y., Parenteau, M. N., et al. 2018, Astrobiology, 18, 663, doi: 10.1089/ast.2017.1729
- Shulman et al. (2004) Shulman, R. G., Rothman, D. L., Behar, K. L., & Hyder, F. 2004, Trends Neurosci., 27, 489, doi: 10.1016/j.tins.2004.06.005
- Smith et al. (2016) Smith, F. A., Payne, J. L., Heim, N. A., et al. 2016, Annu. Rev. Earth Planet. Sci., 44, 523, doi: 10.1146/annurev-earth-060115-012147
- Spiegel & Turner (2012) Spiegel, D. S., & Turner, E. L. 2012, Proc. Natl. Acad. Sci. USA, 109, 395, doi: 10.1073/pnas.1111694108
- Spinelli et al. (2019) Spinelli, R., Borsa, F., Ghirlanda, G., et al. 2019, Astron. Astrophys., 627, A144, doi: 10.1051/0004-6361/201935636
- Tamura et al. (2012) Tamura, T., Iida, K.-i., Saito, M., et al. 2012, Microbiol. Immunol., 56, 673, doi: 10.1111/j.1348-0421.2012.00491.x
- Taylor & Lewis (2005) Taylor, P. D., & Lewis, D. N. 2005, Fossil Invertebrates (Harvard University Press)
- Tian (2015) Tian, F. 2015, Earth Planet. Sci. Lett., 432, 126, doi: 10.1016/j.epsl.2015.09.051
- Tian et al. (2018) Tian, F., Güdel, M., Johnstone, C. P., et al. 2018, Space Sci. Rev., 214, 65, doi: 10.1007/s11214-018-0490-9
- Tsuneyoshi et al. (2001) Tsuneyoshi, I., Boyle, W. A., Kanmura, Y., & Fujimoto, T. 2001, J. Anesth., 15, 29, doi: 10.1007/s005400170048
- Ward et al. (2019) Ward, L. M., Stamenković, V., Hand, K., & Fischer, W. W. 2019, Astrobiology, 19, 811, doi: 10.1089/ast.2017.1779
- Weisbecker & Goswami (2010) Weisbecker, V., & Goswami, A. 2010, Proc. Natl. Acad. Sci. USA, 107, 16216, doi: 10.1073/pnas.0906486107
- Wordsworth & Pierrehumbert (2014) Wordsworth, R., & Pierrehumbert, R. 2014, Astrophys. J. Lett., 785, L20, doi: 10.1088/2041-8205/785/2/L20
- Wordsworth et al. (2018) Wordsworth, R. D., Schaefer, L. K., & Fischer, R. A. 2018, Astron. J., 155, 195, doi: 10.3847/1538-3881/aab608
- Zeng et al. (2016) Zeng, L., Sasselov, D. D., & Jacobsen, S. B. 2016, Astrophys. J., 819, 127, doi: 10.3847/0004-637X/819/2/127