2020/01/24\Accepted2020/02/07
Astrometry — Galaxy: fundamental parameters — masers
The First VERA Astrometry Catalog
Abstract
We present the first astrometry catalog from the Japanese VLBI (very long baseline interferometer) project VERA (VLBI Exploration of Radio Astrometry). We have compiled all the astrometry results from VERA, providing accurate trigonometric annual parallax and proper motion measurements. In total, 99 maser sources are listed in the VERA catalog. Among them, 21 maser sources are newly reported while the rest of 78 sources are referred to previously published results or those in preparation for forthcoming papers. The accuracy in the VERA astrometry are revisited and compared with those from the other VLBI astrometry projects such as BeSSeL (The Bar and Spiral Structure Legacy) Survey and GOBELINS (the Gould’s Belt Distances Survey) with the VLBA (Very Long Baseline Array). We have confirmed that most of the astrometry results are consistent with each other, and the largest error sources are due to source structure of the maser features and their rapid variation, along with the systematic calibration errors and different analysis methods. Combined with the BeSSeL results, we estimate the up-to-date fundamental Galactic parameter of kpc and km s-1 kpc-1, where and are the distance from the Sun to the Galactic center and the Sun’s angular velocity of the Galactic circular rotation, respectively.
1 Introduction
A distance toward astronomical object is the most fundamental parameter in astronomy and astrophysics. All the physical and dynamical properties of the target sources are estimated based on their distances. The most accurate and reliable method for distance determination is the trigonometric annual parallax measurements. For this purpose, the Hipparcos (Kovalevsky, 1998) and the very recent GAIA data release 2 (DR2) (Gaia Collaboration et al., 2018) have presented optical astrometry database for more than 105 and 109 parallaxes for visible stars with accuracy of 1 mas and a few 10 as, respectively. The large number of optical astrometry data play important roles for understanding not only basic properties of each target source but also statistics of various kind of stellar samples such as Hertzsprung-Russell (HR) Diagram, period-luminosity relation of variable stars, and dynamics of our Milky Way Galaxy. However, it is not very easy to access distant sources in the Galactic disk through observations at optical bands because of the extremely high optical extinction. In particular, it is crucial to determine the source distances toward dust/molecular clouds which are seen in the optical and sometimes infrared dark clouds.
To overcome the above issues, radio astrometry observations have been developed in the last two decades by utilizing the very long baseline interferometer (VLBI) technique (Reid & Honma, 2014). When the VLBI array consists of 1000 km baselines, the synthesized beam size (full-width half-maximum, FWHM) of an order of 1 milli-arcsecond (mas) is achievable, as roughly evaluated by where and are the observed wavelengths in centimeter and the maximum baseline length in kilometer, respectively. Furthermore, high signal-to-noise ratios () allow us to measure more accurate positions of target sources than the beam size with the random (or thermal) error of (Reid et al., 1988). Usually, the absolute position error in the VLBI astrometry is dominated by the systematic calibration error expressed as , where , , and are the speed of light, residual delay in calibration, and separation angle between the target source and calibrator (Reid & Honma, 2014). If careful phase calibration are successfully conducted, the high accuracy of VLBI astrometry yield the trigonometric parallax for the 10 kpc (corresponding to 0.1 mas parallax) sources in the Galaxy (Sanna et al., 2017; Nagayama et al., 2020a).
For this purpose, the VLBI Exploration of Radio Astrometry (VERA) project has been initiated in early 2000 by National Astronomical Observatory of Japan (NAOJ). VERA is designed to dedicate for the VLBI astrometry observations to reveal 3-dimensional velocity and spatial structures in the Galaxy. The observational targets are mostly limited to strong maser sources distributed across the Galaxy, with nearby position (phase) calibrators. The construction was completed in 2002 followed by scientific verification observations to establish method for accurate calibration and astrometry data analysis. Regular operations of VERA observations were started in 2004 and the first astrometry results were published in 2007 (Honma et al., 2007; Hirota et al., 2007). Until the end of 2019, more than 60 papers have been published to report results of VERA astrometry observations of Galactic maser sources associated with young stellar objects (YSOs) and late-type stars mostly in the asymptotic giant branch (AGB) and red supergiant (RSG) stars, as summarized in Table The First VERA Astrometry Catalog .
At almost the same time, the Very Long Baseline Array (VLBA) legacy program named The Bar and Spiral Structure Legacy (BeSSeL) Survey has also been carrying out intensive VLBI astrometry observations mainly for distant Galactic high-mass star-forming regions (SFRs) associated with masers (Reid et al., 2009a). Other VLBI arrays such as the European VLBI Network (EVN) and the Australian Long Baseline Array (LBA) are also conduncting VLBI astrometry for maser sources in high-mass SFRs by using the 6.7 GHz CH3OH masers (Rygl et al., 2010; Krishnan et al., 2015, 2017). As for low-mass nearby SFRs, another VLBA legacy survey, Gould’s Belt Distances Survey (GOBELINS), observes non-thermal radio emission from T-Tauri stars to measure their trigonometric annual parallaxes (Loinard et al., 2008; Dzib et al., 2016; Kounkel et al., 2017; Ortiz-León et al., 2017, 2018a). Along with these surveys, number of VLBI astrometry observations have been applied to various population of stellar radio emissions (Reid & Honma, 2014).
The primary aim of this paper is to compile all the published astrometry results from VERA to establish the first VERA catalog (Section 4). We also report some of new astrometry results from VERA in the present paper. The results will be compared with those of the other VLBI astrometry projects, BeSSeL (Section 5.1) and GOBELINS (Section 5.2). Based on the latest VERA astrometry dataset, we will revisit their accuracy and possible error sources of astrometry (Section 5.3). Thus, we mainly concentrate on the maser astrometry data for the samples of YSOs in SFRs and AGBs/RSGs in the present paper. The up-to-date Galactic constants will be estimated using all the available VLBI astrometry data (Section 5.4) based on the similar method discussed previously (Reid et al., 2009b; Honma et al., 2012; Reid et al., 2014b; Honma et al., 2015; Reid et al., 2019).
2 Observations
Although details are described in each paper, here we summarize general information about VERA astrometry observations. VERA is consisted of four 20 m radio telescopes in Japan; at Mizusawa, Iriki, Ogasawara, and Ishigaki-jima stations. The baseline lengths of VERA ranging from 1020 to 2270 km provide the synthesized beam size of 1.2 mas and 0.7 mas at 22 GHz and 43 GHz, respectively. We have mainly carried out astrometry observations using the - transition of H2O at 22.235080 GHz (Pickett et al., 1998). Some of the observations have been conducted for the =1-0 SiO maser transitions at 43.122075 GHz and 42.820586 GHz for =1 or/and =2, respectively (Müller et al., 2001). To measure trigonometric annual parallaxes of maser sources, we usually carry out monitoring observations at least for 1 year and sometimes 2 years or longer. In some cases, monitoring observations are interrupted due to shorter life time of the target masers. A typical interval of monitoring is 1-2 months depending on the variability of masers; more variable sources such as AGB stars and low-mass YSOs are observed in shorter interval than 1 month. To achieve better UV coverage, each epoch of observation lasts from horizon to horizon for about 5-10 hours depending on the source declination (i.e. maximum elevation). In a single horizon-horizon track, we observe one or two maser sources. In case of observations of two different sources, we switch the target sources every 10 minutes.
VERA astrometry observations are carried out with the dual-beam receiving system (Honma et al., 2008a). A pair of target maser source and reference continuum source (calibrator) is observed with two receivers simultaneously. The separation angle of these two sources is limited to 0.3-2.2 degrees. Reference sources are mainly selected from the VLBA Calibrator Catalog (Beasley et al., 2002), for which absolute positions are determined with sub-mas accuracy. Some of the calibrators have been newly detected by using fringe-check survey observations with VERA at 22 GHz and/or 43 GHz (Petrov et al., 2007, 2012). In addition to reference sources, bandpass and delay calibrator(s) are observed every 60-80 minutes. Amplitude calibrations are done through the chopper-wheel method (Ulich & Haas, 1976). Typical system noise temperatures are 100 K and 200 K at 22 GHz and 43 GHz, respectively, under good weather condition. However, they become higher by a factor of 2 or larger (200 K at 22 GHz and 400 K at 43 GHz) under the conditions of high humidity and temperature, in particular at the southern isolated islands, Ogasawara and Ishigaki stations, and/or in the summer season.
VERA can configure various frequency settings and recording settings, such as spectral resolution, total bandwidths, number of intermediate frequency (IF) channels and spectral channels within each IF. Details of the set-up in each observation can be seen in the respective original papers. In most of the observations, the digital filter output provides 16 IF channels with 16 MHz bandwidth (Iguchi et al., 2005). Only left-handed circular polarization is received and sampled with 2-bit per second at 1 Gbps. Dual-polarization observation mode is under comissioning at this moment. One of the 16 MHz IF channels is assigned to the target maser source and the rest of 15 IF channels are assigned to the reference source. For masers, a spectral resolution is set to be 15.625 kHz or 31.25 kHz, corresponding to a velocity resolution of 0.21-0.42 km s-1 or 0.11-0.22 km s-1 at 22 GHz and 43 GHz, respectively. Data were recorded with magnetic tapes before 2015 while more recently hard disk recording system is employed. The newly developed system will be capable of wider-band recoding up to 16 Gbps (Oyama et al., 2016). Correlation processing were made with the FX hardware correlator located at NAOJ Mitaka campus until early 2015 (Chikada et al., 1991). From 2015, regular operation of newly developed software correlator has been started in NAOJ Mizusawa campus (Oyama et al., 2016). An accumulation period in the correlation process is 1 second to produce visibility data for further post-processing data analysis.
To achieve accurate phase calibration, reference sources are required to have flux densities higher than 50-100 mJy on average (in case of 1 Gbps recording rate) to detect their fringes with the SNR of at least 5 within a coherence time of 1-2 minutes and the recording bandwidths of 240 MHz under the best weather condition. Target maser sources are detectable with the peak intensities of 1 Jy beam-1 after successful phase-referencing analysis.
3 Data analysis
Basic procedures for calibration and synthesis imaging are summarized in the early results from VERA (Honma et al., 2007; Hirota et al., 2007). Calibration processes and its accuracy, in particular possible error sources by atmospheric calibration, station positions, dual-beam calibration, and source structure effects are reported in separate papers (Honma et al., 2008a, b, 2010; Nagayama et al., 2020a). Only overall characteristics of astrometric accuracy will be discussed in the present paper.
Before the calibration, delay tracking models are re-calculated using a software based on the CALC software package developed for the geodetic VLBI observations (Manabe et al., 1991; Jike et al., 2009) because a priori models employed in the correlation processing are inaccurate for astrometry. In the recalculations, phase-tracking center positions of the target maser sources are shifted to the actual position of maser features within 100 mas. In the subsequent astrometry calibrations, more accurate delay tracking are done by using the following dataset: Tropospheric and ionospheric delays are recalculated based on the GPS measurements and meteorological data (Honma et al., 2008b; Nagayama et al., 2020a), the earth orientation parameters are taken from the International Earth rotation and Reference systems Service (IERS), and the antenna positions are measured through regular monthly geodetic observations with VERA at 22 GHz (Jike et al., 2009, 2018). For the dual-beam observations, path lengths between two receiving systems for masers and reference sources are calibrated by injecting artificial noise source on the dishes (Honma et al., 2008a), which is so-called ”horn-on-dish method”. Overall calibration errors are estimated to be 10-20 mm for the tropospheric zenith delay, 3-10 TECU for the ionospheric delay, 3 mm for the antenna position, and 0.1 mm for the instrumental optical path lengths between two beams, as summarized in Nagayama et al. (2020a) and references therein.
Other calibration processes are done in a standard manner of VLBI observations using the NRAO Astronomical Image Processing System (AIPS) software package. Amplitude calibrations are done by the AIPS task APCAL and ACCOR, while a template method is employed by using the AIPS task ACFIT in case of problems in chopper-wheel methods. The instrumental delays and phase offsets among all of the IF channels are determined by the AIPS task FRING on strong calibrator sources, and residual phases are also determined by the AIPS task FRING on reference sources. These delay and phase calibration solutions are copied to the target maser sources by the AIPS task TACOP, and are applied to the target maser sources by the AIPS tack CLCAL. If the reference sources are too weak to detect fringes, so-called inverse phase-referencing are carried out in which maser sources are used for phase calibration (Hirota et al., 2011; Imai et al., 2012; Burns et al., 2015). Synthesis imaging and deconvolution were performed using the AIPS task IMAGR.
After making images of target maser sources at all spectral channels in all observing epochs, each maser spot and feature are identified. A maser spot is defined as an emission component of a single velocity channel and a feature is used for a group of spots in consecutive velocity channels at position coincident with each others. The maser spots and features are identified by the Gaussian fitting (AIPS tasks JMFIT or SAD) with certain threshold of noise levels in a single-channel map and integrated intensity images, respectively.
Some of the data are analyzed by using the VEDA (VEra Data Analyzer) package developed by the VERA project for our own astrometry data (Honma et al., 2007, 2011; Niinuma et al., 2011; Chibueze et al., 2014a; Yamauchi et al., 2016). More details of the VEDA package will be presented in the forthcoming paper (Nagayama et al., 2020b).
The identified maser spots or features are used to determine their proper motions and trigonometric annual parallaxes by fitting the positional offsets in right ascension and declination as a function of time. The fitting parameters are the trigonometric annual parallax , right ascension and declination offset with respect to the tracking center position at the first epoch of observation , (, ), proper motions in right ascension and declination, (, ) (, ). If the astrometric accuracy is significantly worse in declination compared with that in right ascension due to different path length error in the atmospheric calibration (Nagayama et al., 2020a), only the latter data are employed to determine the parallax. If there are multiple maser spots or features, position offsets and proper motions for all the spots/features are fitted simultaneously with the common parallax value.
Usually, the post-fit residual of the fitting is much larger than the astrometric accuracy expected from the thermal noise. This can be interpreted that there could be systematic calibration errors in the fitting results. Thus, the errors of these best-fit parameters are estimated by adding the noise floor to all the astrometry results in order to set the reduced value of unity (Honma et al., 2007; Reid et al., 2009a) This additional noise floor is regarded as the total error of astrometry including both systematic and random (thermal) errors.
In case of VERA, error estimation is different from paper to paper. If there are multiple masers, two different approaches have been employed: One is to derive proper motions for individual features and common parallax for all features simultaneously by the least squares fitting. In this case, the fitting error is regarded as the parallax uncertainty. Another method is to derive parallax value for each maser feature and average all these values. In this case, the standard deviation of these parallaxes is regarded as an uncertainty. However, if the error source of astrometry is dominated by the calibration error of atmospheric phase fluctuation, they are common for all the features and hence, averaged parallax (the latter case) would include systematic errors which are common for all parallax values. Thus, the formal uncertainty could underestimate the error in the averaged parallax value. Although astrometry analysis methods are different from source to source in Table The First VERA Astrometry Catalog , future update of the VERA catalogue will be done by using the unified methods through the new data analysis software package VEDA (Nagayama et al., 2020b).
4 Results
In Table The First VERA Astrometry Catalog , we compile all the parallax measurements that have been conducted with VERA to date. In total, 99 of maser sources are listed. We include some sources in Table The First VERA Astrometry Catalog for which only parallax values are reported (i.e. no proper motion data). New astrometry results from VERA are reported for 21 sources for the first time in the present paper, while the others have been or will be published last column of Table The First VERA Astrometry Catalog . Most of the target sources are observed with the 22 GHz H2O masers, and 2 sources, Orion KL (Kim et al., 2008) and R Aqr (Kamohara et al., 2010; Min et al., 2014), are observed in the 43 GHz vibrationally excited SiO masers. Numbers of YSOs in SFRs and late-type stars (AGBs and RSGs) are 68 and 31, respectively. Some of the target sources classified as AGBs include possible candidates of post-AGB stars or young planetary nebulae, such as IRAS 182860959 (Imai et al., 2013) and K3-35 (Tafoya et al., 2011). Since the population of RSGs are relatively small, only 2 sources, VY CMa (Choi et al., 2008) and PZ Cas (Kusuno et al., 2013) are reported.
We refer the astrometry data from the original papers as listed in the last column in Table The First VERA Astrometry Catalog . Numbers of significant digits of astrometric parameters are different from source to source, depending on the relative uncertainties. We simply set the uniform number of significant digit for the parameters in Table The First VERA Astrometry Catalog except for the parallax values, for which we follow the definition of the original papers.
For proper motions, we need additional consideration in some cases. When the target sources are associated with multiple maser features, many literature calculated their averages to estimate systemic motions which are regarded to represent those of central stars. On the other hand, if there are insufficient number of maser feature(s) in a target source, a proper motion of single feature is used to estimate its systematic motion. If there is no explicit discussion on proper motions in the original paper, we calculate these values as mentioned above. In most of the VERA results, errors in the proper motions are determined by the formal uncertainties in the fitting in case of sources with a single feature or the mean proper motions of multiple maser features. To ensure the use of an accurate estimate of the source systemic proper motion in modelling the Galactic rotation, it is necessary to separate observed proper motions into their respective contributions from the internal proper motions caused by jets, outflows etc., and the true motion of the SFRs in the sky plane. In cases where the proper motions are symmetric or random, this can be done by simply averaging all measured proper motions. However, in asymmetricaly sampled cases, or cases of few detected maser features, the average motion may misrepresent the source proper motion. This consequently introduces errors into the evaluation of the model parameters during fitting. We did not consider such potential systematic uncertainties in the proper motions in Table The First VERA Astrometry Catalog . However, if a large enough sample of sources is used then these errors introduced should average out.
The radial velocities of the target sources, which are usually measured by the radio molecular lines such as CO and NH3 or by the maser lines themselves, are also listed in Table The First VERA Astrometry Catalog . Similarly, these radial velocities could result in significant amount of uncertainties in the estimated 3-dimensional velocity field of the Galaxy. In particular, the definition of the radial velocities would affect the estimation of the systemic velocity of the target sources depending on either average or central velocities of the maser features. It is known that the H2O masers show sometimes extremely high velocity features up to 10-100 km s-1 with respect to the systemic velocity (Motogi et al., 2016). For instance, one of the target sources, IRAS 202554032, shows the average velocity of the four maser features of km s-1, while the systemic velocity is determined by the CO line to be km s-1 (Sakai et al., 2020c). In such cases, maser data will lead erroneous assumption of the systemic velocities. If there is no estimation of uncertainties in the radial velocity, we take into account these uncertainties of 5 km s-1 as indicated in Table The First VERA Astrometry Catalog . Although the BeSSeL project employs the more conservative value of 10 km s-1, our results are not severely affected these different assumptions.
5 Discussion
In this section, we will revisit discussion on accuracy of the VERA astrometry and estimation of the Galactic fundamental parameters, as reported in previous summary papers (Reid et al., 2009b; Honma et al., 2012; Reid & Honma, 2014; Reid et al., 2014b; Honma et al., 2015; Reid et al., 2019).
5.1 Comparison with VERA and VLBA/EVN results
Figure 1 compares the results of parallax measurements carried out by VERA and VLBA/EVN. For this plot, most of the target sources are the H2O and/or CH3OH maser sources which are identified in the same SFRs within 1\arcmin as listed in Table The First VERA Astrometry Catalog . Some of high-mass SFRs host multiple YSOs associated with different maser clusters within individual regions. We do not include such sources because they could be located in different molecular clouds aligned along the line-of-sight by chance. Only exceptions are Orion KL and HH 12-15 which are observed in radio continuum emission (Menten et al., 2007; Dzib et al., 2016). For Orion KL, we refer to Menten et al. (2007), although there are multiple/different VLBI astrometry results for different YSOs in the same region (see more discussion in the next section). To compare these VLBI astrometry results with each other, we employ the astrometric parameters from VLBA/EVN reported in original references with the highest accuracy data for each source rather than those compiled in Reid et al. (2019) because some of their results are averaged value of multiple VLBI astrometry results. For G359.6200.25 and Sgr D/G001.1400.12, we use the parallax values in Reid et al. (2019) because the references are in preparation.
As seen in the clear correlation in Figure 1, most of the astrometry results are consistent within a factor of 1.5 except for a few sources with larger scatter. They are IRAS 051373919/G168.0600.82 (Honma et al., 2011; Hachisuka et al., 2015), Sgr D/G001.1400.12 (Sakai et al., 2017; Reid et al., 2019)111Although it is the largest error bar in the plot, we could not confirm the original reference in Reid et al. (2019)., G005.8800.39 (Motogi et al., 2011; Sato et al., 2014), and G048.6000.02 (Nagayama et al., 2011a; Zhang et al., 2013). These data show differences larger than a factor of 2.
To compare their differences, we calculate the normalized parallax differences scaled by their joint uncertainties, as defined by the following equation;
| (1) |
in which and are the parallaxes measured with VERA and VLBA, respectively, and and are the parallax errors for VERA and VLBA results, respectively. The results are listed in Table The First VERA Astrometry Catalog and the distribution is plotted in Figure 2. As seen in Figure 2, most of the target sources give consistent results within or less than 3 limit. The first quartile, median, and third quartile are , 0.35, and 1.49, respectively. The largest discrepant measurements are for G048.6000.02 (12.32), G005.8800.39 (8.28), S269 (), G135.2802.80 (), and IRAS 051373919 (). Sgr D/G001.1400.12 give the smaller value of 1.26 due to the exceptionaly large relative errors of VLBA parallax of 80%. We note that the possible systematic errors in the VERA parallax as discussed in the last paragraph of Section 4 are not included in the calculated . Thus, parallax measurements from VERA and VLBA/EVN for 23 out of total 28 samples (82%) agree with each others within 3 levels.
Possible origins of such large errors are due to insufficient number of observing epochs, in particular around the peak season of the annual parallax value (for IRAS 051373919), or errors in the atmospheric calibration and VERA dual-beam phase calibrations (for G048.6000.02). These results could be improved by using additional data and re-calibration processing. Furthermore, spatially extended structures of the target maser features could significantly degrade the accuracy of the position measurements of the maser features, which would introduce additional errors in the astrometry and hence, derived parallax values. In fact, the possible effect of such maser structures is intensively discussed for a high-mass YSO S269 at the distance of 4 kpc (Honma et al., 2007; Asaki et al., 2014; Quiroga-Nuñez et al., 2019), in which the possible structure effect results in a parallax error of 20%. It has been already discussed for the VERA data (Honma et al., 2010) and we will revisit this issue in the next sections.
5.2 Comparison for distances toward nearby SFRs
Several astrometry results are reported for the Orion Molecular Cloud both with VERA and VLBA since the beginning of the VERA and VLBA astrometry projects (Hirota et al., 2007; Kim et al., 2008; Sandstrom et al., 2007; Menten et al., 2007; Kounkel et al., 2017) including the new result from VERA (Nagayama et al., 2020b). In the central part of the Orion region, active high-mass SFRs Orion KL and Orion Nebular Cluster (ONC) are of great interest. The VERA results are for observations of the H2O masers or SiO masers (Orion Source I), while VLBA observes radio continuum emission from different non-thermal radio emitting YSOs in the ONC region. The first astrometry results for these sources had larger uncertainties of 43719 pc (Hirota et al., 2007) and 389 pc pc (Sandstrom et al., 2007) from the VERA H2O maser and VLBA 15 GHz continuum observations, respectively. Subsequent higher accuracy data of 4186 pc from the SiO masers with VERA (Kim et al., 2008) and 4147 pc from the 8 GHz continuum with VLBA (Menten et al., 2007) are in excellent agreement. These results suggest a weighted-mean distance of pc toward the Orion KL region or the central part of the ONC. On the other hand, recent comprehensive studies with VLBA by Kounkel et al. (2017) suggest a smaller distances of 3885 pc as a weighted average of distances of YSOs in wider area of ONC.
The possible reason for the differences in these parallax measurements, in particular compared with that of Menten et al. (2007), are discussed in Kounkel et al. (2017), which are attributed to the different number of samples, systematic errors originated from ionospheric calibration, multiplicity of the target sources, and/or different treatment of the data for the fitting (e.g. fitting routine for the right ascension and/or declination). If this difference is real, it would suggest the depth of the region along the line-of-sight; Source I could be located in the rear side of the ONC which argues against Kim et al. (2008).
For other nearby low-mass star-forming regions, we have carried out series of astrometry observations (Imai et al., 2007; Hirota et al., 2007, 2008a, 2008b; Kim et al., 2008; Hirota et al., 2011). Similar comprehensive survey are also carried out by the VLBA large program GOBELINS and their pilot surveys (Loinard et al., 2008; Dzib et al., 2016; Kounkel et al., 2017; Ortiz-León et al., 2017, 2018a). Some of the target regions are common, such as Orion, Monoceros, Ophiuchus, and Perseus molecular clouds. In Figure 1, only Orion KL, HH 12-15, and IRAS 162932422 in L1689 are plotted as they are regarded as the same SFRs observed with VERA.
We quantitatively compare the difference in distances between two astrometry measurements. Here we compare distances rather than parallaxes because many literature listed mean distances of multiple sources. In the following discussion, the error in the distance difference is calculated from the root sum square of each distance error, and the error in each distance is estimated from the geometric mean of both error bars (i.e. in case of ). The difference between relative errors in the parallax and distance estimated above are as small 0.1-0.3%.
For the Orion regions, GOBELINS also includes various molecular clouds outside Orion KL. One of examples is the L1641 region at the measured distance of 42810 pc (Kounkel et al., 2017). The VERA result for another nearby maser source, L1641 S3, presents the slightly larger distance of 473 pc. The difference in these two distance values of 4531 pc is not significant with the only 1.5 level. Although VLBA failed to determine the parallax of YSOs in Ori possibly due to scattering at the lower frequency (Kounkel et al., 2017), we can measure the parallax of a YSO associated with the Ori region, B35, to be 1.980.25 mas in the present paper, corresponding to the distance of 505 pc. The difference in distances between those from GAIA DR2, 402120 pc (Zucker et al., 2019), and VERA is 10368 pc, which is 1.5 level. Because the uncertainty in the parallax value from VERA is still large, future more accurate observations are required to confirm the result.
For YSOs in the Monoceros region, HH (or GGD) 12-15, distances from VERA and VLBA of 620 pc (present paper) and 893 pc (Dzib et al., 2016), respectively, are different by a factor of 45%. The difference in these two distances is pc. The error bar of the VERA result, 20%, is relatively larger the typical value (see Figure 3) as discussed in the next section.
For the Ophiuchus region, the distances measured by GOBELINS are 137.31.2 pc and 147.33.4 pc toward dark clouds L1688 and L1689, respectively (Ortiz-León et al., 2017). Parallax measurements for a protostar IRAS 162932422, which is located in L1689, give 178 pc and 141 pc from VERA (Imai et al., 2007) and VLBA (Dzib et al., 2018), respectively. These two values from maser astrometry marginally agree with each other (3736 pc), but the smaller distance of pc is more consistent with those from continuum sources in L1689.
Comparing with the GAIA DR2 results, VLBA results are confirmed to be in good agreement for Ophiuchus (Ortiz-León et al., 2017, 2018b) and Perseus (Ortiz-León et al., 2018a) regions. In case of another nearby SFR, NGC2264, the distance measured with VERA of 738 pc (Kamezaki et al., 2014a) is in good agreement with the GAIA DR2 value, 71916 pc (Maíz Apellániz, 2019). The mean distance toward slightly farther molecular clouds in Gem OB1, IRAS 060582138 (Oh et al., 2010), IRAS 060612151 (Niinuma et al., 2011), and S255 IR-SMA1 (Burns et al., 2016), of 1.85 kpc (with a standard deviation of 0.14 kpc) is also consistent with that from the GAIA DR2 result, 1.7860.0040.089 kpc (Zucker et al., 2019). On the other hand, some of the parallax values derived from VERA observations showed significantly large uncertainties which are larger differences than the error bars of VLBA and GAIA results. In the case of Perseus Molecular Cloud, the VERA results of 23413 pc from the weighted mean distance of NGC 1333 (Hirota et al., 2008a) and L1448 (Hirota et al., 2011) is smaller by pc than that of GAIA DR2 of 29322 pc Ortiz-León et al. (2018a), although the parallax of NGC 1333 was not determined with VLBA alone.
We note that the parallax values of GAIA DR2 would include the zero-point offset with an order of -0 mas (Gaia Collaboration et al., 2018). More detailed analysis are presented in Xu et al. (2019) and references therein, suggesting that the parallax offset in the GAIA DR2 data is as. It requires the correction of the parallax value corresponding to the systematic uncertainty from pc to pc at the distance of 140-1800 pc in the SFRs discussed above. This effect is already considered as the possible systematic error in each reference. In addition, the parallax offset in the GAIA DR2 data would affect more significant in the farther target sources. Thus, the large differences in the parallax values for nearby SFRs are mostly due to shorter lifetime of the H2O masers associated with the low-mass YSOs than the period of annual parallax (i.e. 1 year), and there seems no significant contribution from the zero-point offset in the GAIA DR2 parallaxes. In addition, significant spatial structures of the nearby sources could degrade the accuracy of the position measurements (Imai et al., 2007; Hirota et al., 2008b; Honma et al., 2010; Dzib et al., 2018). We will evaluate this effect in the next section.
5.3 Accuracy and dominant error sources in VERA Astrometry
As discussed in Honma et al. (2010), a motion of 0.5 km s-1, which is comparable to typical line widths of the masers (full-width half-maximum of 1 km s-1), corresponds to the transverse distance of 0.1 au within 1 yr. If the motion is systematic, it can partly contribute to the linear proper motion and hence, is measurable by the VLBI astrometry monitoring. However, if such a motion is originated from a turbulence in the maser cloud, it could cause change in the structure of the maser feature randomly. The possible structure change would affect the positional accuracy of the maser features. As a result, this effect will lead to the error in the annual parallax, which is equal to the angular size of 1 au at the distance of the target source, up to 10%. Even larger errors up to 20% or corresponding structure changes of 0.2 au scale would be likely, given the spatially extended nature of maser features (1 au).
Figure 3 shows the errors in the parallax as a function of the parallax values. Obviously, the plot shows a clear trend of correlation as seen in the smaller number of samples (Honma et al., 2010). In other word, the errors in the parallaxes are mostly 2-20% independent of the source distances. It is unlikely that the correlation is mostly due to the calibration errors as they should strongly depend on the separation angles between the calibrators and targets, weather condition, and source elevation (declination), rather than their distances.
It should be noted that the larger variation in Figure 3 than that of Honma et al. (2010) would also reflect different calibration errors and/or method of analysis such as different number of maser features employed in the parallax fitting and lengths of astrometry monitoring observations. In general, lower declination sources at degrees, such as NGC6334(I), are more seriously affected by atmospheric calibration errors (Chibueze et al., 2014a). However, we confirm that the correlation of parallaxes and their errors would be the results of source structures.
For the AGB stars, trigonometric parallax measurements can be done by using the VLBI astrometry of maser sources and optical astrometry like Hipparcos and GAIA (DR2). One example for a semi-regular variable star SV Peg demonstrates that there could be significant differences between VLBI and GAIA DR2 astrometry, for which parallax values are 3.000.06 mas and 1.120.28 mas, respectively (Sudou et al., 2019). The discrepancy is most likely attributed to an effect of unresolved structure of the stellar photosphere observed with GAIA DR2. Xu et al. (2019) discussed accuracy of parallax measurements of YSOs, AGBs, and pulsars from VLBI astrometry and GAIA DR2, and found the largest differences in the AGB samples. More detailed comparison of astrometry observations for each AGB star will be discussed in a separate paper (Matsuno et al., 2020; Nakagawa et al., 2020) and hence, it is out of the scope of this paper.
The structure effect is though to be more serious for highly variable sources such as low-mass nearby YSOs and AGB stars (Imai et al., 2007; Hirota et al., 2008b). In contrast, it is demonstrated that astrometry for the compact stellar emission could achieve 1% parallax accuracy for nearby open cluster Pleiades (Melis, et al., 2014) and continuum sources in the nearby Ophiuchus molecular clouds (Ortiz-León et al., 2017). The structure changes in maser features are found to be less significant for farther (10 kpc) sources because the other error budgets, in particular due to calibration errors of tropospheric delay term (Honma et al., 2008b; Nagayama et al., 2020a), become more significant than those from the source structure. Hence, we note that target maser sources should be selected carefully according to their spatial structures in the synthesized images to overcome this issue. It is also important to make images with better uv coverages to recover both spatially compact and extended emission components. In case of VERA, lack of shorter baselines (1000 km) would seriously resolve out spatially extended maser features. Thus, further KaVA (KVN and VERA Array) and EAVN (East Asian VLBI Network; An et al. 2018) are expected to improve the accuracy of the maser astrometry.
5.4 Galactic Structure
The currently available VLBI astrometry results are plotted in Figure 4. We plot positions of SFRs and RSGs but AGBs are not included because these sources will not be used for the further analysis as discussion later. Thus, total 224 sources are selected including both VERA and other VLBI results (Reid et al., 2019). We indicate the location of the best-fitted Galactic spiral arms determined by Reid et al. (2019). Most of the target sources are located in the northern hemisphere with the declination of degrees because of the visibility of the target sources from VERA, VLBA, and EVN. Thus, the sample distribution is strongly biased to the first and second Galactic quadrants ( deg deg, where is the Galactic longitude), while less number of sources are located in the third quadrant ( deg deg). Only exceptions are two sources, G339.8841.259 (Krishnan et al., 2015) and G305.2 region (Krishnan et al., 2017), which are observed with the Australian LBA, as plotted in the fourth quadrant ( deg deg) of Figure 4. The most distant parallax measurement with VLBI is achieved for a high-mass SFR G007.4700.05 with the trigonometric parallax from the BeSSeL project of 0.0490.006 mas, corresponding to 20.4 kpc (Sanna et al., 2017). This value is consistent with the astrometry observations with VERA of 202 kpc, which is estimated based on the absolute proper motions and radial velocity measurements and 3-dimensional Galactic rotation model (Yamauchi et al., 2016).
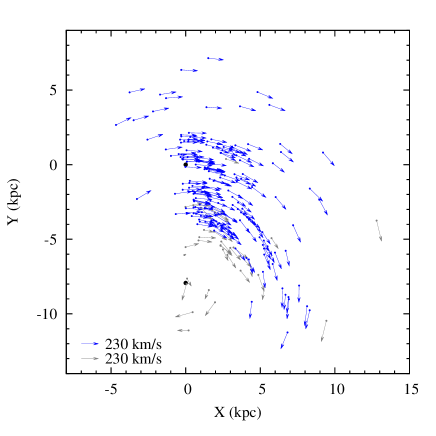
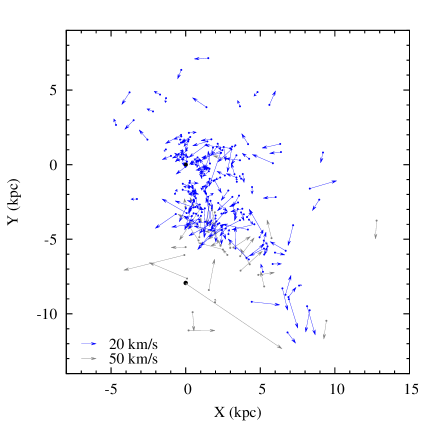
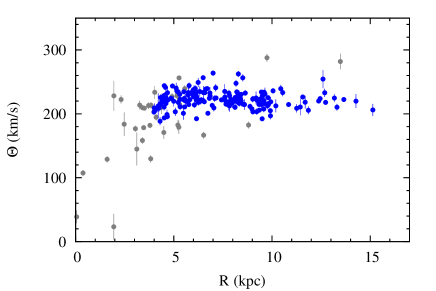
The Galactic rotation can be seen in Figure 5 in which positions of maser sources are plotted with 2-dimensional velocity vectors in the Galactic plane. The 2-dimensional vectors in the Galactic plane projection are determined by combination of sky plane and line of sight velocities as mentioned in Section 4. To transform from the measurements in a Heliocentric frame to the Galacto-centric reference frame, we employ the Galaxy model with the power-law rotation curve as discussed below. The parameters used for the transformation are summarized in Table The First VERA Astrometry Catalog . We also assume the Solar motion of (, , ) = (11.1, 12.24, 7.25) in km s -1 (Schönrich et al., 2010). The Galactic rotation curve can be constructed as plotted in Figure 6 using the same parameter set. The well known flat rotation curve is confirmed toward the distance up to 15 kpc from the Galactic center.
By combining currently available maser astrometry results from VERA, VLBA, EVN, and LBA, we can estimate the fundamental parameters of the Milky Way Galaxy as discussed in Honma et al. (2012) by using increased number of samples. Here we briefly summarize our data analysis. We employ SFRs and high-mass RSGs but exclude AGB stars for our data analysis. This is because dynamical properties of AGB stars are different from those of former samples, such as velocity dispersion and peculiar motions with respect to the Galactic rotation (known as asymmetric drift). In the model fitting, outliers which have the Galacto-centric distances within kpc or the peculiar motion of 50 km s-1 are also removed from the input data for further analysis to avoid systematic errors in the estimated parameters. The former condition is considered to exclude systematic motion caused by the Galactic bar (Honma et al., 2012; Reid et al., 2014b). These sources are indicated by gray symbols in Figures 5 and 6. The number of removed sources is 35, and hence, we used total 189 sources for the further analysis, which are plotted by blue symbols in Figures 5 and 6.
In the Galaxy model, we simply assume the circular rotation of the Local Standard of Rest (LSR) with small systematic/random motions. The distances toward the Galactic center and the rotation velocity of the LSR around the Galactic center are referred to and , respectively. The ratio of gives the Galactic angular velocity at the LSR, . As discussed previously, we will solve a set of and , rather than and because the latter set is known to be tightly correlated (Reid et al., 2009b; Honma et al., 2012). Although the correlation could become modest due to increased number of target sources in larger distribution of our present data, we follow the same data analysis by Honma et al. (2012) to compare the results consistently. For the Galactic rotation curve, we use two different models; a power law, , and 2nd-order polynomial, , functions of rotation curves. The power-law index , or the polynomial coefficients and are also solved in the analysis. In addition, mean systematic motions, are introduced in the models to account for the peculiar motions (Reid et al., 2009b; Honma et al., 2012). The , , and are defined as the velocity components toward the Galaxy center, the direction of Galactic rotation, and the north Galactic pole, respectively. The Solar motion is assumed to be (, , ) = (11.1, 12.24, 7.25) in km s -1 (Schönrich et al., 2010).
All the parameters are estimated by the same procedures described in Honma et al. (2012), based on the Markov Chain Monte Carlo (MCMC) method. To explore the posterior provability distribution of the parameters, MCMC simulation is iterated for the trial number of . Figure 7 shows the posterior probability distribution for six parameters of power-law model. For all parameters, the posterior profitability distribution shows a single-peaked symmetric structure, which confirms reasonable estimates of the parameters. Table The First VERA Astrometry Catalog summarize the best parameters and their statistical errors calculated from the means and the standard deviations of the posterior probability distributions in our two Galactic rotation models. As for and , both results agree well with each other with differences less than 1%. These differences are much smaller than the error bars. The inward motion of is non-zero values in contrast to the previous paper (Honma et al., 2012), while the vertical component with respect to the Galactic plane, suggests no significant motion. The power-law index of is slightly negative but is consistent with the flat rotation curve.
As listed in Table The First VERA Astrometry Catalog , we can directly compare the present results with the models of ID 14 for the power-law rotation curve and ID 22 for the polynomial rotation curve (removing outliers and adopting fixed km s-1) in Honma et al. (2012). Present results are in good agreement with those in Honma et al. (2012) but the statistical errors for and estimated by the MCMC method are smaller by a factor of 2.5 as the number of samples increases from 49 to 189. In particular, an increase in the number of further sources would significantly contribute to improve the precision.
As reported in the previous paper (Honma et al., 2012), and is tightly correlated and is dependent on the adopted value of . However, the angular velocity of the Sun defined by can be well determined. It is estimated to be =30.170.27 km s-1 kpc-1 using and in the power-law model shown in Table The First VERA Astrometry Catalog and the adopted value of =12.24 km s-1 (Schönrich et al., 2010).
As demonstrated in Honma et al. (2012), estimated Galactic fundamental parameters depend on the employed model of the Galaxy and input source samples. In the present paper, we did not perform the MCMC fitting by changing the Solar motion. The assumed values of the Solar motion would lead to systematic errors in the derived parameters and hence, the uncertainties in the estimated parameters could be underestimated. For instance, the difference in is as small as % while that of is about 6% when is assumed to be 5.25 km s-1 or 12.0 km s-1, or is solved in the MCMC analysis to be 19 km s-1 (Table 5 and Figure 4 in Honma et al. 2012). The different values of the Solar motion also result in the systematic error of of the same magnitude, 6% (Table 6 in Honma et al. 2012). However, it does not strongly affect the value, which is 0.3% difference (Table 6 in Honma et al. 2012). In summary, assuming the Solar motions in the MCMC analysis would lead systematic errors of 6% in and , while the effect is less than 1% for and . In order to take into account the above systematic errors, we estimate the systematic error in of 4%, adding the 1% of the model dependency (Table The First VERA Astrometry Catalog ) and 3% of the sample dependency (Honma et al., 2015). For the , the systematic error is 1% mainly due to the sample dependency (Honma et al., 2015), given the smaller differences among models in Table The First VERA Astrometry Catalog (Honma et al., 2012, 2015; Reid et al., 2019).
According to Reid et al. (2019), and are determined to be 8.150.15 kpc and km s-1 kpc-1, respectively, based on the VLBI astrometry of 147 maser sources, as listed in Table The First VERA Astrometry Catalog and The First VERA Astrometry Catalog . Our results considered both errors of the statistic and the systematic, kpc and km s-1 kpc-1 are consistent with each other. Small difference in could be attributed to the employed Galactic rotation curve in the models and/or the different input samples as noted in the previous paragraph (Honma et al., 2012, 2015). As already discussed in previous papers, new VLBI astrometry results are different from those recommended by the International Astronomical Union (IAU), =8.5 kpc and =220 km s-1 (Kerr, & Lynden-Bell, 1986). Our results yield km s-1. Thus, and are smaller by 6% and larger by 3%, respectively. The angular velocity of the Sun, is independently determined by proper motion measurements of a supermassive black hole at the Galactic center, Sgr A∗ (Reid & Brunthaler, 2004, 2020). As listed in Table The First VERA Astrometry Catalog , all the results of are in good agreement. Recently, the distance to Sgr A∗ is accurately determined to be kpc (Gravity Collaboration et al., 2019) and kpc (Do et al., 2019) by measurements of stellar orbital motions around Sgr A∗ (Table The First VERA Astrometry Catalog ). Our result is consistent with them. This consistency suggests that Sgr A∗ is truly located at the dynamical center of the Galactic rotation of LSR. When we adopt kpc (Gravity Collaboration et al., 2019), the Galactic rotation velocity is 3% upwardly revised to 234 km s-1.
6 Summary and future prospects
We have compiled all the astrometry measurements from VERA to construct the first version of the VERA catalogue. In total 99 target sources are listed in the catalogue including 21 new measurements in the present paper. The results are basically consistent with those from other VLBI astrometry project with VLBA (BeSSeL) and EVN while significant differences are also reported for several sources. It is mainly affected by the spatial structures of the target maser features and their time variation, along with the systematic calibration errors. The effects are more significant for the nearby lower-mass YSOs and AGBs.
Using all the available VLBI astrometry data base, we model the Galactic structure to estimate the fundamental parameters such as the distance toward the Galactic center, , angular velocity of the LSR around the Galactic center, , and the model of the rotation curve. Using these parameters, the angular velocity of the Sun, , is calculated to compare with the other results. The results, kpc and km s-1 kpc-1 are also consistent with those from VLBA (Reid et al., 2019).
Further astrometry observations with VERA will be able to advance the studies on the Galaxy model by increasing the number of target sources along with reducing systematic errors due to insufficient samples (Honma et al., 2015). New VLBI array such as KaVA/EAVN and those in southern hemisphere, LBA (Krishnan et al., 2015, 2017) and future SKA (Square Kilometer Array) in the VLBI mode (Green et al., 2015) will improve astrometry accuracy for spatially extended sources and southern sources, respectively, which are still insufficient for the currently available VERA catalogue. The new data analysis tool, VEDA, will provide systematic astrometry results for future VERA observational data and reanalysis of previous archive data (Nagayama et al., 2020b).
We are grateful to the referee for valuable comments to improve the manuscript. We would like to thank all the staff of Mizusawa VLBI Observatory of NAOJ to operate the VERA array, correlate the VLBI data, and analyze the results by using VEDA. We also thank staff and students of Kagoshima University VERA Group who involved in telescope operation. T. Hirota is financially supported by the MEXT/JSPS KAKENHI Grant Number 17K05398. HI is supported by the MEXT/JSPS KAKENHI (16H02167). J.O.C. acknowledges support by the Italian Ministry of Foreign Affairs and International Cooperation (MAECI Grant Number ZA18GR02) and the South African Department of Science and Technology’s National Research Foundation (DST-NRF Grant Number 113121) as part of the ISARP RADIOSKY2020 Joint Research Scheme. Data analysis were in part carried out on common use data analysis computer system at the Astronomy Data Center, ADC, of the National Astronomical Observatory of Japan.
References
- An et al. (2018) An, T., Sohn, B. W., & Imai, H. 2018, Nature Astronomy, 2, 118
- Ando et al. (2011) Ando, K. et al. 2011, PASJ, 63, 45
- Asaki et al. (2014) Asaki, Y., Imai, H., Sobolev, A. M., Parfenov, S., & Yu. 2014, ApJ, 787, 54
- Beasley et al. (2002) Beasley, A. J., Gordon, D., Peck, A. B., Petrov, L., MacMillan, D. S., Fomalont, E. B., & Ma, C. 2002, ApJS, 141, 13
- Burns et al. (2017) Burns, R. A. et al. 2017, MNRAS, 467, 2367
- Burns et al. (2016) Burns, R. A., Handa, T., Nagayama, T., Sunada, K., & Omodaka, T. 2016, MNRAS, 460, 283
- Burns et al. (2015) Burns, R. A., Imai, H., Handa, T., Omodaka, T., Nakagawa, A., Nagayama, T., & Ueno, Y. 2015, MNRAS, 453, 3163
- Burns et al. (2014a) Burns, R. A., Nagayama, T., Handa, T., Omodaka, T., Nakagawa, A., Nakanishi, H., Hayashi, M., & Shizugami, M. 2014a, ApJ, 797, 39
- Burns et al. (2014b) Burns, R. A. et al. 2014b, PASJ, 66, 102
- Chibueze et al. (2017) Chibueze, J. O., Hamabata, H., Nagayama, T., Omodaka, T., Handa, T., Sunada, K., Nakano, M., & Ueno, Y. 2017, MNRAS, 466, 4530
- Chibueze et al. (2016) Chibueze, J. O. et al. 2016, MNRAS, 460, 1839
- Chibueze et al. (2014a) Chibueze, J. O. et al. 2014a, ApJ, 784, 114
- Chibueze et al. (2014b) Chibueze, J. O. et al. 2014b, PASJ, 66, 104
- Chibueze et al. (2019) Chibueze, J. O. et al. 2019, PASJ, 71, 92
- Chibueze et al. (2020) Chibueze, J. O. et al. 2020, submitted to PASJ
- Chikada et al. (1991) Chikada, Y., Kawaguchi, N., Inoue, M., Morimoto, M., Kobayashi, H., & Mattori, S. 1991, Frontiers of VLBI, 79
- Choi et al. (2014) Choi, Y. K., Hachisuka, K., Reid, M. J., Xu, Y., Brunthaler, A., Menten, K. M., & Dame, T. M. 2014, ApJ, 790, 99
- Choi et al. (2008) Choi, Y. K. et al. 2008, PASJ, 60, 1007
- Do et al. (2019) Do, T. et al. 2019, Science, 365, 664
- Dzib et al. (2016) Dzib, S. A., Ortiz-León, G. N., Loinard, L., Mioduszewski, A. J., Rodríguez, L. F., Torres, R. M., Deller, A. 2016, ApJ, 826, 201
- Dzib et al. (2018) Dzib, S. A. et al. 2018, A&A, 614, A20
- Gaia Collaboration et al. (2018) Gaia Collaboration et al. 2018, A&A, 616, A1
- Gravity Collaboration et al. (2019) Gravity Collaboration et al. 2019, A&A, 625, L10
- Green et al. (2015) Green, J., Van Langevelde, H. J., Brunthaler, A., Ellingsen, S., Imai, H., Vlemmings, W., Reid, M., & Richards, A. 2015, Advancing Astrophysics with the Square Kilometre Array (AASKA14), 119
- Hachisuka et al. (2009) Hachisuka, K., Brunthaler, A., Menten, K. M., Reid, M. J., Hagiwara, Y., & Mochizuki, N. 2009, ApJ, 696, 1981
- Hachisuka et al. (2006) Hachisuka, K. et al. 2006, ApJ, 645, 337
- Hachisuka et al. (2015) Hachisuka, K., Choi, Y. K., Reid, M. J., Brunthaler, A., Menten, K. M., Sanna, A., & Dame, T. M. 2015, ApJ, 800, 2
- Hirota et al. (2007) Hirota, T. et al. 2007, PASJ, 59, 897
- Hirota et al. (2008a) Hirota, T. et al. 2008a, PASJ, 60, 37
- Hirota et al. (2008b) Hirota, T. et al. 2008b, PASJ, 60, 961
- Hirota et al. (2011) Hirota, T., Honma, M., Imai, H., Sunada, K., Ueno, Y., Kobayashi, H., & Kawaguchi, N. 2011, PASJ, 63, 1
- Honma et al. (2007) Honma, M. et al. 2007, PASJ, 59, 889
- Honma et al. (2008a) Honma, M. et al. 2008a, PASJ, 60, 935
- Honma et al. (2012) Honma, M. et al. 2012, PASJ, 64, 136
- Honma et al. (2011) Honma, M., Hirota, T., Kan-Ya, Y., Kawaguchi, N., Kobayashi, H., Kurayama, T., & Sato, K. 2011, PASJ, 63, 17
- Honma et al. (2010) Honma, M. et al. 2010, Publications of the National Astronomical Observatory of Japan, 13, 57
- Honma et al. (2015) Honma, M., Nagayama, T., & Sakai, N. 2015, PASJ, 67, 70
- Honma et al. (2008b) Honma, M., Tamura, Y., & Reid, M. J. 2008b, PASJ, 60, 951
- Iguchi et al. (2005) Iguchi, S., Kurayama, T., Kawaguchi, N., & Kawakami, K. 2005, PASJ, 57, 259
- Imai et al. (2013) Imai, H., Kurayama, T., Honma, M., & Miyaji, T. 2013, PASJ, 65, 28
- Imai et al. (2007) Imai, H. et al. 2007, PASJ, 59, 1107
- Imai et al. (2012) Imai, H., Sakai, N., Nakanishi, H., Sakanoue, H., Honma, M., & Miyaji, T. 2012, PASJ, 64, 142
- Imai et al. (2011) Imai, H., Tafoya, D., Honma, M., Hirota, T., & Miyaji, T. 2011, PASJ, 63, 81
- Iwata et al. (2017) Iwata, Y., Kato, H., Sakai, D., & Oka, T. 2017, ApJ, 840, 18
- Jike et al. (2009) Jike, T., Manabe, S., & Tamura, Y. 2009, Journal of the Geodetic Society of Japan, 55, 369
- Jike et al. (2018) Jike, T., Manabe, S., & Tamura, Y. 2018, Journal of the Geodetic Society of Japan, 63, 193
- Kamezaki et al. (2014a) Kamezaki, T. et al. 2014a, ApJS, 211, 18
- Kamezaki et al. (2014b) Kamezaki, T., Kurayama, T., Nakagawa, A., Handa, T., Omodaka, T., Nagayama, T., Kobayashi, H., & Shizugami, M. 2014b, PASJ, 66, 107
- Kamezaki et al. (2016a) Kamezaki, T. et al. 2016a, PASJ, 68, 71
- Kamezaki et al. (2016b) Kamezaki, T., Nakagawa, A., Omodaka, T., Inoue, K.-i., Chibueze, J. O., Nagayama, T., Ueno, Y., & Matsunaga, N. 2016b, PASJ, 68, 75
- Kamezaki et al. (2012) Kamezaki, T. et al. 2012, PASJ, 64, 7
- Kamohara et al. (2010) Kamohara, R. et al. 2010, A&A, 510, A69
- Kerr, & Lynden-Bell (1986) Kerr, F. J., & Lynden-Bell, D. 1986, MNRAS, 221, 1023
- Kim et al. (2008) Kim, M. K. et al. 2008, PASJ, 60, 991
- Kovalevsky (1998) Kovalevsky, J. 1998, ARA&A, 36, 99
- Koide et al. (2019) Koide, N. et al. 2019, PASJ, 71, 113
- Kounkel et al. (2017) Kounkel, M. et al. 2017, ApJ, 834, 142
- Krishnan et al. (2015) Krishnan, V. et al. 2015, ApJ, 805, 129
- Krishnan et al. (2017) Krishnan, V., Ellingsen, S. P., Reid, M. J., Bignall, H. E., McCallum, J., Phillips, C. J., Reynolds, C., Stevens, J. 2017, MNRAS, 465, 1095
- Kurayama et al. (2011) Kurayama, T., Nakagawa, A., Sawada-Satoh, S., Sato, K., Honma, M., Sunada, K., Hirota, T., & Imai, H. 2011, PASJ, 63, 513
- Kusuno et al. (2013) Kusuno, K., Asaki, Y., Imai, H., & Oyama, T. 2013, ApJ, 774, 107
- Loinard et al. (2008) Loinard, L., Torres, R. M., Mioduszewski, A. J., & Rodríguez, L. F. 2008, ApJ, 675, L29
- Maíz Apellániz (2019) Maíz Apellániz, J. 2019, A&A, 630, A119
- Manabe et al. (1991) Manabe, S., Yokoyama, K., & Sakai, S. 1991, Earth orientation parameters and celestial and terrestrial reference frames of NAOMIZ analysis, IERS Technical Note 8, 61
- Matsumoto et al. (2011) Matsumoto, N. et al. 2011, PASJ, 63, 1345
- Matsuno et al. (2020) Matsuno, M. et al. 2020, submitted to PASJ
- Melis, et al. (2014) Melis C., Reid M. J., Mioduszewski A. J., Stauffer J. R., & Bower G. C. 2014, Science, 345, 1029
- Menten et al. (2007) Menten, K. M., Reid, M. J., Forbrich, J., & Brunthaler, A. 2007, A&A, 474, 515
- Min et al. (2014) Min, C., Matsumoto, N., Kim, M. K., Hirota, T., Shibata, K. M., Cho, S.-H., Shizugami, M., & Honma, M. 2014, PASJ, 66, 38
- Morita et al. (2020) Morita, A. et al. 2020, in preparation
- Moscadelli et al. (2011) Moscadelli, L., Cesaroni, R., Rioja, M. J., Dodson, R., & Reid, M. J. 2011, A&A, 526, A66
- Motogi et al. (2011) Motogi, K., Sorai, K., Habe, A., Honma, M., Kobayashi, H., & Sato, K. 2011, PASJ, 63, 31
- Motogi et al. (2016) Motogi, K. et al. 2016, PASJ, 68, 69
- Müller et al. (2001) Müller, H. S. P., Thorwirth, S., Roth, D. A.,& Winnewisser, G. 2001, A&A, 370, L49
- Nagayama et al. (2015a) Nagayama, T. et al. 2015a, PASJ, 67, 65
- Nagayama et al. (2015b) Nagayama, T. et al. 2015b, PASJ, 67, 66
- Nagayama et al. (2020a) Nagayama, T. et al. 2020a, PASJ, submitted to PASJ
- Nagayama et al. (2020b) Nagayama, T. et al. 2020b, PASJ, submitted to PASJ
- Nagayama et al. (2011a) Nagayama, T., Omodaka, T., Handa, T., Honma, M., Kobayashi, H., Kawaguchi, N., & Ueno, Y. 2011a, PASJ, 63, 719
- Nagayama et al. (2011b) Nagayama, T., Omodaka, T., Nakagawa, A., Handa, T., Honma, M., Kobayashi, H., Kawaguchi, N., & Miyaji, T. 2011b, PASJ, 63, 23
- Nakagawa et al. (2016) Nakagawa, A., Kurayama, T., Matsui, M., Omodaka, T., Honma, M., Shibata, K. M., Sato, K., & Jike, T. 2016, PASJ, 68, 78
- Nakagawa et al. (2014) Nakagawa, A. et al. 2014, PASJ, 66, 101
- Nakagawa et al. (2008) Nakagawa, A. et al. 2008, PASJ, 60, 1013
- Nakagawa et al. (2020) Nakagawa, A. et al. 2020, in preparation
- Nakanishi et al. (2015) Nakanishi, H. et al. 2015, PASJ, 67, 68
- Nakanishi et al. (2020) Nakanishi, H. et al. 2020, in preparation
- Niinuma et al. (2011) Niinuma, K. et al. 2011, PASJ, 63, 9
- Nyu et al. (2011) Nyu, D. et al. 2011, PASJ, 63, 63
- Ogbodo et al. (2017) Ogbodo, C. S. et al. 2017, MNRAS, 469, 4788
- Oh et al. (2010) Oh, C. S., Kobayashi, H., Honma, M., Hirota, T., Sato, K., & Ueno, Y. 2010, PASJ, 62, 101
- Omodaka et al. (2020) Omodaka, T. et al. 2020, in preparation
- Ooyama et al. (2020) Ooyama, M. et al. 2020, in preparation
- Ortiz-León et al. (2017) Ortiz-León, G. N. et al. 2017, ApJ, 834, 141
- Ortiz-León et al. (2018a) Ortiz-León, G. N. et al. 2018a, ApJ, 865, 73
- Ortiz-León et al. (2018b) Ortiz-León, G. N. et al. 2018b, ApJ, 869, L33
- Oyama et al. (2016) Oyama, T. et al. 2016, PASJ, 68, 105
- Petrov et al. (2012) Petrov, L., Honma, M., & Shibata, S. M. 2012, AJ, 143, 35
- Petrov et al. (2007) Petrov, L., Hirota, T., Honma, M., Shibata, K. M., Jike, T., & Kobayashi, H. 2007, AJ, 133, 2487
- Pickett et al. (1998) Pickett, H. M., Poynter, R. L., Cohen, E. A., Delitsky, M. L., Pearson, J. C., & Müller, H. S. P. 1998, J. Quant. Spec. Radiat. Transf., 60, 883
- Quiroga-Nuñez et al. (2019) Quiroga-Nuñez, L. H., Immer, K., van Langevelde, H. J., Reid, M. J., & Burns, R. A. 2019, A&A, 625, A70
- Reid & Honma (2014) Reid, M. J., & Honma, M. 2014a, ARA&A, 52, 339
- Reid et al. (2014b) Reid, M. J. et al. 2014b, ApJ, 783, 130
- Reid & Brunthaler (2004) Reid, M. J., & Brunthaler, A. 2004, ApJ, 616, 872
- Reid & Brunthaler (2020) Reid, M. J., & Brunthaler, A. 2020, arXiv e-prints, arXiv:2001.04386
- Reid et al. (2009a) Reid, M. J., Menten, K. M., Brunthaler, A., Zheng, X. W., Moscadelli, L., & Xu, Y. 2009a, ApJ, 693, 397
- Reid et al. (2009b) Reid, M. J. et al. 2009b, ApJ, 700, 137
- Reid et al. (2009c) Reid, M. J., Menten, K. M., Zheng, X. W., Brunthaler, A., & Xu, Y. 2009c, ApJ, 705, 1548
- Reid et al. (2019) Reid, M. J. et al. 2019, ApJ, 885, 131
- Reid et al. (1988) Reid, M. J., Schneps, M. H., Moran, J. M., Gwinn, C. R., Genzel, R., Downes, D., & Roennaeng, B. 1988, ApJ, 330, 809
- Rygl et al. (2010) Rygl, K. L. J., Brunthaler, A., Reid, M. J., Menten, K. M., van Langevelde, H. J., & Xu, Y. 2010, A&A, 511, A2
- Sakai et al. (2017) Sakai, D., Oyama, T., Nagayama, T., Honma, M., & Kobayashi, H. 2017, PASJ, 69, 64
- Sakai et al. (2020a) Sakai, D. et al. 2020a, in preparation
- Sakai et al. (2012) Sakai, N., Honma, M., Nakanishi, H., Sakanoue, H., Kurayama, T., Shibata, K. M., & Shizugami, M. 2012, PASJ, 64, 108
- Sakai et al. (2015) Sakai, N. et al. 2015, PASJ, 67, 69
- Sakai et al. (2019) Sakai, N., Reid, M. J., Menten, K. M., Brunthaler, A., & Dame, T. M. 2019, ApJ, 876, 30
- Sakai et al. (2014) Sakai, N., Sato, M., Motogi, K., Nagayama, T., Shibata, K. M., Kanaguchi, M., & Honma, M. 2014, PASJ, 66, 3
- Sakai et al. (2020b) Sakai, N. et al. 2020b, PASJ, in press
- Sakai et al. (2020c) Sakai, N. et al. 2020c, in preparation
- Sandstrom et al. (2007) Sandstrom, K. M., Peek, J. E. G., Bower, G. C., Bolatto, A. D., & Plambeck, R. L. 2007, ApJ, 667, 1161
- Sanna et al. (2017) Sanna, A., Reid, M. J., Dame, T. M., Menten, K. M., & Brunthaler, A. 2017, Science, 358, 227
- Sato et al. (2014) Sato, M. et al. 2014, ApJ, 793, 72
- Sato et al. (2008) Sato, M. et al. 2008, PASJ, 60, 975
- Sato et al. (2010) Sato, M., Hirota, T., Reid, M. J., Honma, M., Kobayashi, H., Iwadate, K., Miyaji, T., & Shibata, K. M. 2010, PASJ, 62, 287
- Schönrich et al. (2010) Schönrich, R., Binney, J., & Dehnen, W. 2010, MNRAS, 403, 1829
- Shiozaki et al. (2011) Shiozaki, S., Imai, H., Tafoya, D., Omodaka, T., Hirota, T., Honma, M., Matsui, M., & Ueno, Y. 2011, PASJ, 63, 1219
- Sudou et al. (2019) Sudou, H. et al. 2019, PASJ, 71, 16
- Tafoya et al. (2011) Tafoya, D. et al. 2011, PASJ, 63, 71
- Ulich & Haas (1976) Ulich, B. L., & Haas, R. W. 1976, ApJS, 30, 247
- Urago et al. (2020) Urago, R. et al. 2020, in preparation
- Wu et al. (2019) Wu, Y. W. et al. 2019, ApJ, 874, 94
- Wu et al. (2014) Wu, Y. W. et al. 2014, A&A, 566, A17
- Xu et al. (2019) Xu, S., Zhang, B., Reid, M. J., et al. 2019, ApJ, 875, 114
- Xu et al. (2013) Xu, Y. et al. 2013, ApJ, 769, 15
- Xu et al. (2011) Xu, Y., Moscadelli, L., Reid, M. J., Menten, K. M., Zhang, B., Zheng, X. W., & Brunthaler, A. 2011, ApJ, 733, 25
- Xu et al. (2006) Xu, Y., Reid, M. J., Zheng, X. W., & Menten, K. M. 2006, Science, 311, 54
- Yamauchi et al. (2016) Yamauchi, A., Yamashita, K., Honma, M., Sunada, K., Nakagawa, A., & Ueno, Y. 2016, PASJ, 68, 60
- Zhang et al. (2012) Zhang, B., Reid, M. J., Menten, K. M., & Zheng, X. W. 2012, ApJ, 744, 23
- Zhang et al. (2013) Zhang, B., Reid, M. J., Menten, K. M., Zheng, X. W., Brunthaler, A., Dame, T. M., & Xu, Y. 2013, ApJ, 775, 79
- Zhang et al. (2009) Zhang, B., Zheng, X. W., Reid, M. J., Menten, K. M., Xu, Y., Moscadelli, L., & Brunthaler, A. 2009, ApJ, 693, 419
- Zucker et al. (2019) Zucker, C., Speagle, J. S., Schlafly, E. F., Green, G. M., Finkbeiner, D. P., Goodman, A. A., & Alves, J. 2019, ApJ, 879, 125


lllccllrrrrrrcl
Astrometry results from VERA
RA(J2000) Dec(J2000)
NAME (h:m:s) (d:m:s) (deg) (deg)
(mas) (mas yr-1) (mas yr-1)
(km s-1) Type Reference
\endheadSY Scl 00 07 36.2476 25 29 40.028 039.91 80.04 0.75 0.03 5.57 0.04 7.32 0.12 22.0 5.0 AGB Nyu et al. (2011)
IRAS 002595625 00 28 43.5075 56 41 56.868 119.80 06.03 0.412 0.123 2.48 0.32 2.85 0.65 38.3 3.1 SFR Sakai et al. (2014)
NGC 281 00 52 24.7008 56 33 50.527 123.06 06.30 0.355 0.030 2.63 0.05 1.86 0.08 30.0 5.0 SFR Sato et al. (2008)
G125.5102.03 01 15 40.8027 64 46 40.766 125.51 02.03 0.145 0.023 1.20 0.21 0.33 0.27 57.0 9.0 SFR Koide et al. (2019),
Sakai et al. (2020b)a
W3(H2O) 02 27 04.6800 61 52 24.566 133.94 01.06 0.527 0.016 0.27 0.29 1.24 0.15 55.6 1.2 SFR Matsumoto et al. (2011),
Nagayama et al. (2020b)a
G135.2802.80 02 43 28.5825 62 57 08.390 135.28 02.80 0.124 0.011 0.45 0.20 0.09 0.16 72.9 1.6 SFR Nagayama et al. (2020a)
G137.0703.00 02 58 13.1793 62 20 32.915 137.07 03.00 0.187 0.016 0.57 0.16 0.01 0.16 50.1 0.4 SFR Nagayama et al. (2020a)
L1448C 03 25 38.8784 30 44 05.252 157.57 21.94 4.31 0.33 21.90 0.70 23.10 3.30 5.0 5.0 SFR Hirota et al. (2011)
NGC 1333 SVS13 03 29 03.7247 31 16 03.802 158.35 20.56 4.25 0.32 14.25 2.58 9.95 0.74 8.0 5.0 SFR Hirota et al. (2008a)
V637 Per 03 54 02.2577 36 32 17.926 159.10 13.20 0.94 0.02 0.61 0.43 0.90 0.37 97.8 0.9 AGB Present paper
L1482 04 30 27.4008 35 09 17.649 165.47 09.05 1.879 0.096 3.07 0.06 8.60 0.04 1.0 5.0 SFR Omodaka et al. (2020)
BX Eri 04 40 32.7762 14 12 02.710 211.48 35.33 2.116 0.105 6.77 0.35 10.79 0.25 0.3 0.1 AGB Present paper
T Lep 05 04 50.8430 21 54 16.505 222.67 32.71 3.06 0.04 14.60 0.50 35.43 0.79 27.6 5.0 AGB Nakagawa et al. (2014)
IRAS 051373919 05 17 13.7410 39 22 19.880 168.06 00.82 0.086 0.027 0.30 0.27 0.89 0.73 27.0 5.0 SFR Honma et al. (2011)
BW Cam 05 19 52.1643 63 15 54.684 143.43 20.09 0.749 0.189 7.55 1.19 19.63 0.81 42.0 0.7 AGB Present paper
IRAS 051683634 05 20 22.0700 36 37 56.630 170.66 00.25 0.532 0.053 0.23 1.07 3.14 0.28 15.5 1.9 SFR Sakai et al. (2012)
AFGL 5142 05 30 48.0173 33 47 54.568 174.20 00.07 0.467 0.010 0.32 0.27 0.22 0.47 2.0 5.0 SFR Burns et al. (2017)
Orion KL 05 35 14.5050 05 22 30.450 209.00 19.38 2.39 0.03 9.56 0.10 3.83 0.15 3.0 5.0 SFR Hirota et al. (2007),
Kim et al. (2008)a,
Nagayama et al. (2020b)
WB 673 05 38 00.3500 35 58 58.400 173.17 02.36 0.590 0.043 0.01 0.03 3.40 0.09 10.4 0.2 SFR Present paper
RW Lep 05 38 52.7260 14 02 27.180 217.78 22.30 1.62 0.16 15.80 2.10 31.20 2.10 59.0 1.0 AGB Kamezaki et al. (2014b)
L1641 S3 05 39 56.0431 07 30 27.988 211.57 19.29 2.114 0.127 11.68 0.67 7.74 0.36 6.8 4.2 SFR Present paper
S235AB MIR 05 40 53.3800 35 41 48.500 173.72 02.70 0.639 0.033 0.08 0.12 2.41 0.14 17.0 5.0 SFR Burns et al. (2015)
B35 05 44 29.2483 09 08 52.121 196.93 10.40 1.98 0.25 2.30 0.53 5.31 0.59 12.0 1.0 SFR Present paper
BX Cam 05 46 44.3251 69 58 24.408 143.43 20.09 1.73 0.03 13.48 0.14 34.30 0.18 0.0 5.0 AGB Matsuno et al. (2020)
G192.1603.81 05 58 13.5300 16 31 58.900 192.16 03.81 0.66 0.04 0.69 0.15 1.57 0.15 5.7 5.0 SFR Shiozaki et al. (2011)
IRAS 060582138 06 08 53.4938 21 38 30.741 188.94 00.88 0.569 0.034 1.06 0.18 2.77 0.34 3.0 5.0 SFR Oh et al. (2010)
IRAS 060612151 06 09 06.9746 21 50 41.405 188.79 01.03 0.496 0.031 0.10 0.10 3.91 0.07 1.6 0.2 SFR Niinuma et al. (2011)
HH 12-15 06 10 50.1400 06 11 45.600 213.88 11.84 1.61 0.36 0.36 1.68 3.17 0.47 11.3 2.0 SFR Present paper
S255 IR-SMA1 06 12 54.0064 17 59 22.959 192.60 00.05 0.563 0.036 0.13 0.20 0.06 0.27 5.3 5.0 SFR Burns et al. (2016)
S269 06 14 37.0800 13 49 36.700 196.45 01.67 0.189 0.008 0.42 0.20 0.12 0.20 18.0 5.0 SFR Honma et al. (2007)a,
Asaki et al. (2014)
G200.0801.63 06 21 47.5742 10 39 22.811 200.08 01.63 0.200 0.017 0.32 0.14 0.14 0.16 36.3 0.6 SFR Nagayama et al. (2020a)
U Lyn 06 40 46.4853 59 52 01.490 155.66 21.94 1.27 0.06 0.80 0.57 6.00 0.56 13.0 3.0 AGB Kamezaki et al. (2016a)
NGC 2264 06 41 09.8600 09 29 14.700 203.32 02.05 1.356 0.098 1.08 0.58 5.92 3.06 7.0 3.0 SFR Kamezaki et al. (2014a)
WB 886 06 47 13.3000 00 26 05.920 212.06 00.74 0.349 0.052 0.40 0.94 0.37 0.33 45.0 3.0 SFR Nakanishi et al. (2020)
NSV 17351 07 07 49.3869 10 44 05.998 224.34 01.29 0.247 0.010 1.19 0.11 1.30 0.19 50.1 1.9 AGB Morita et al. (2020)
VY CMa 07 22 58.3291 25 46 03.141 239.35 05.06 0.88 0.08 2.09 0.16 1.02 0.61 20.0 5.0 RSG Choi et al. (2008)
OZ Gem 07 33 57.7500 30 30 37.799 188.80 21.90 0.806 0.039 1.97 0.32 8.69 0.21 8.7 1.4 AGB Urago et al. (2020)
QX Pup 07 42 16.9470 14 42 50.200 231.84 04.22 0.61 0.03 4.76 0.37 0.94 0.62 33.0 5.0 AGB Ooyama et al. (2020)
IRAS 074272400 07 44 51.9200 24 07 41.500 240.31 00.07 0.185 0.027 1.79 0.32 2.60 0.17 66.4 5.0 SFR Sakai et al. (2015)
HU Pup 07 55 40.1843 28 38 54.608 245.44 00.15 0.308 0.042 1.16 0.15 3.69 0.20 43.9 0.6 AGB Present paper
R Cnc 08 16 33.8243 11 43 34.518 211.75 24.14 3.84 0.29 1.24 0.34 11.57 0.97 16.9 5.0 AGB Present paper
X Hya 09 35 30.2650 14 41 28.639 248.15 26.70 2.07 0.05 51.37 0.97 15.02 1.47 27.3 5.0 AGB Present paper
R UMa 10 44 38.4283 68 46 32.344 138.36 44.36 1.97 0.05 40.77 0.39 24.75 0.38 40.5 1.0 AGB Nakagawa et al. (2016)
W Leo 10 53 37.4325 13 42 54.367 233.02 59.43 1.03 0.02 6.84 0.09 8.65 0.08 46.7 0.2 AGB Present paper
HS UMa 11 35 30.6878 34 52 04.006 182.78 72.02 2.816 0.095 11.48 0.17 10.86 0.65 1.6 0.3 AGB Present paper
S Crt 11 52 45.9697 07 35 48.096 278.59 52.48 2.33 0.13 3.17 0.22 5.41 0.22 37.9 5.0 AGB Nakagawa et al. (2008)
R Hya 13 29 42.7819 23 16 52.775 314.22 38.75 7.93 0.18 53.79 1.05 16.15 1.83 8.5 5.0 AGB Present paper
RX Boo 14 24 11.6206 25 42 12.909 034.28 69.21 7.31 0.50 24.55 1.06 49.67 2.38 1.0 5.0 AGB Kamezaki et al. (2012)
FV Boo 15 08 25.7530 09 36 18.390 011.03 53.27 0.97 0.06 6.81 0.14 1.01 0.12 7.5 1.0 AGB Kamezaki et al. (2016b)
Y Lib 15 11 41.2990 06 00 41.462 353.83 42.59 0.855 0.050 10.15 2.39 15.02 4.26 14.4 1.1 AGB Chibueze et al. (2019)
S Ser 15 21 39.5334 14 18 53.107 020.50 52.79 1.25 0.04 2.56 1.42 5.20 2.31 25.1 5.0 AGB Present paper
IRAS 162932422 16 32 22.8500 24 28 36.400 353.94 15.84 5.6 1.5 20.60 0.70 32.40 2.00 3.0 5.0 SFR Imai et al. (2007)
NGC 6334I(N) 17 20 55.1920 35 45 03.770 351.44 00.65 0.789 0.161 2.88 0.30 3.23 0.39 2.8 0.5 SFR Chibueze et al. (2014a)
G353.2700.64 17 26 01.5883 34 15 14.903 353.27 00.64 0.59 0.06 0.47 0.07 0.99 1.04 5.0 5.0 SFR Motogi et al. (2016)
G359.6200.25 17 45 39.0908 29 20 26.294 359.62 00.25 0.33 0.14 1.31 0.33 2.41 0.87 80.0 5.0 SFR Iwata et al. (2017)
Sgr B2 17 47 20.1817 28 23 03.889 000.67 00.03 0.133 0.038 1.83 0.21 3.70 0.09 62.0 5.0 SFR Sakai et al. (2020a)
Sgr D 17 48 48.5450 28 01 26.290 001.15 00.12 0.423 0.083 0.76 0.15 2.88 0.34 18.0 5.0 SFR Sakai et al. (2017)
G005.8800.39 18 00 30.3100 24 04 04.500 005.88 00.39 0.78 0.05 0.17 0.60 0.95 0.48 9.0 3.0 SFR Motogi et al. (2011)
G007.4700.06 18 02 13.1790 22 27 58.960 007.47 00.06 — — 2.42 0.09 4.39 0.08 15.0 5.0 SFR Yamauchi et al. (2016)b
G014.3300.64 18 18 54.6532 16 47 50.077 014.33 00.64 0.893 0.101 0.95 2.00 2.50 2.00 22.0 5.0 SFR Sato et al. (2010)
M17 18 20 23.0160 16 11 48.030 015.03 00.67 0.491 0.041 0.51 0.21 2.04 0.21 20.0 5.0 SFR Chibueze et al. (2016)
G021.8800.02 18 31 01.7490 09 49 01.130 021.88 00.01 — — 3.30 0.06 5.33 0.22 26.9 0.4 SFR Present paperb
IRAS 182860959 18 31 22.9340 09 57 21.700 021.80 00.13 0.277 0.041 3.20 0.30 7.20 0.20 60.0 5.0 AGB Imai et al. (2013)
G034.3900.22 18 53 18.7700 01 24 08.800 034.39 00.22 0.643 0.049 0.25 0.80 — — 58.0 5.0 SFR Kurayama et al. (2011)b
S76E 18 56 11.4413 07 53 17.608 040.50 02.54 0.521 0.024 0.89 0.34 2.27 0.56 31.9 1.7 SFR Chibueze et al. (2017)
G037.5000.53 18 57 53.3876 04 18 17.394 037.50 00.53 0.091 0.016 2.74 0.18 5.49 0.10 10.7 2.6 SFR Nagayama et al. (2020a)
G037.8200.41 18 58 53.8800 04 32 15.004 037.82 00.41 0.089 0.020 2.73 0.12 5.53 0.12 17.5 0.8 SFR Nagayama et al. (2020a)
W48A 19 01 45.5423 01 13 32.573 035.20 01.74 0.433 0.026 0.05 0.81 3.51 0.38 41.9 1.4 SFR Chibueze et al. (2020)
G044.3100.04 19 12 15.7930 10 07 53.085 044.31 00.04 0.192 0.031 3.36 0.05 6.92 0.06 57.8 0.5 SFR Present paper
G048.6000.02 19 20 31.1772 13 55 25.257 048.60 00.02 0.199 0.007 2.76 0.04 5.28 0.11 19.0 1.0 SFR Nagayama et al. (2011a)
G048.9900.30 19 22 26.1348 14 06 39.133 048.99 00.30 0.178 0.017 2.16 0.09 5.87 0.17 66.3 0.3 SFR Nagayama et al. (2015a)
G049.1900.33 19 22 57.7705 14 16 09.969 049.19 00.33 0.211 0.016 3.21 0.07 5.08 0.25 69.9 0.5 SFR Nagayama et al. (2015a)
IRAS 192131723 19 23 37.3229 17 29 10.479 052.10 01.04 0.251 0.036 2.53 0.04 6.07 0.05 41.7 5.0 SFR Oh et al. (2010)
K3-35 19 27 44.0230 21 30 03.440 056.10 02.09 0.260 0.040 3.34 0.10 5.93 0.07 26.0 5.0 AGB Tafoya et al. (2011)
IRAS 193121950 19 33 24.2430 19 56 55.650 055.37 00.19 0.263 0.047 2.61 0.47 6.73 0.14 36.0 1.0 SFR Imai et al. (2011)
G061.4800.10 19 46 47.9175 25 12 52.698 061.48 00.10 0.454 0.022 1.31 0.16 6.39 0.34 41.7 6.2 SFR Present paper
SY Aql 20 07 05.4083 12 57 06.219 053.37 10.31 1.10 0.07 12.26 0.11 15.93 0.22 44.8 5.0 AGB Present paper
IRAS 200563350 20 07 31.2586 33 59 41.477 071.31 00.83 0.213 0.026 2.62 0.33 5.65 0.52 9.4 5.0 SFR Burns et al. (2014a)
ON1 20 10 09.2045 31 31 36.101 069.54 00.97 0.404 0.017 3.10 0.18 4.70 0.24 12.0 1.0 SFR Nagayama et al. (2011b)
IRAS 201264104 20 14 26.0218 41 13 32.674 078.12 03.63 0.750 0.092 4.15 0.51 4.07 0.51 3.5 4.0 SFR Nagayama et al. (2015b)
IRAS 201433634 20 16 13.3617 36 43 33.920 074.57 00.85 0.367 0.037 2.99 0.16 4.37 0.43 1.0 1.0 SFR Burns et al. (2014b)
ON2N 20 21 44.0123 37 26 37.484 075.78 00.34 0.261 0.009 2.79 0.13 4.66 0.17 0.0 1.0 SFR Ando et al. (2011)
IRAS 202313430 20 25 07.8013 34 50 34.733 074.04 01.71 0.611 0.022 3.79 0.18 4.88 0.25 6.0 5.0 SFR Ogbodo et al. (2017)
IRAS 202554032 20 27 20.2734 40 42 34.648 079.09 01.33 0.118 0.035 2.49 0.13 3.36 0.23 18.2 5.0 SFR Sakai et al. (2020c)
G080.7000.70 20 35 09.1650 41 38 20.260 080.70 00.70 0.258 0.022 3.18 0.09 5.09 0.07 2.3 0.7 SFR Present paper
G095.0503.97 21 15 55.6798 54 43 31.328 095.05 03.97 0.108 0.023 2.44 0.21 2.63 0.17 87.0 5.0 SFR Sakai et al. (2020b)a,
Nakanishi et al. (2020)
G097.5303.18 21 32 12.4400 55 53 49.600 097.53 03.18 0.177 0.028 2.64 0.20 2.38 0.22 73.0 5.0 SFR Sakai et al. (2020b)a,
Nakanishi et al. (2020)
IRAS 213795106 21 39 40.5500 51 20 34.000 095.29 00.93 0.262 0.031 2.74 0.08 2.87 0.18 42.3 0.2 SFR Nakanishi et al. (2015)
AFGL 2789 21 39 58.2717 50 14 21.014 094.60 01.79 0.326 0.031 2.20 0.08 3.77 0.15 44.0 5.0 SFR Oh et al. (2010)
G102.3503.64 21 57 25.1841 59 21 56.614 102.35 03.64 0.154 0.021 2.53 0.33 2.14 0.33 88.0 5.0 SFR Sakai et al. (2020b)a,
Nakanishi et al. (2020)
SV Peg 22 05 42.0850 35 20 54.536 088.72 16.29 3.00 0.06 11.59 0.54 8.63 0.44 3.9 5.0 AGB Sudou et al. (2019)
S140 22 19 17.4657 63 18 39.851 106.79 05.31 1.154 0.069 6.16 0.12 4.74 0.11 6.1 5.0 SFR Present paper
IRAS 221986336 22 21 26.7279 63 51 37.924 107.29 05.63 1.309 0.047 2.47 1.40 0.26 1.40 11.0 5.0 SFR Hirota et al. (2008b)
IRAS 224806002 22 49 58.8760 60 17 56.650 108.43 00.89 0.400 0.025 2.58 0.33 1.91 0.17 50.8 3.5 SFR Imai et al. (2012)
IRAS 225556213 22 57 29.8090 62 29 46.850 110.20 02.48 0.314 0.070 2.04 0.05 0.66 0.06 63.0 1.0 SFR Chibueze et al. (2014b)
IRAS 230045642 23 02 32.0800 56 57 51.400 108.47 02.81 0.309 0.010 2.45 1.00 3.00 0.70 54.0 5.0 SFR Nakanishi et al. (2020)
R Peg 23 06 39.1652 10 32 36.078 085.41 44.56 2.76 0.28 3.60 1.53 6.44 0.92 22.5 5.0 AGB Present paper
R Aqr 23 43 49.4616 15 17 04.202 066.52 70.33 4.59 0.24 37.13 0.47 28.62 0.44 21.5 5.0 AGB Kamohara et al. (2010),
Min et al. (2014)a
PZ Cas 23 44 03.2816 61 47 22.187 115.06 00.05 0.356 0.026 3.70 0.20 2.00 0.30 36.2 0.7 RSG Kusuno et al. (2013)
: If there are multiple references, the data with smaller parallax errors noted with a is employed.
: Their parallax and/or proper motions cannot be determined.
Parallaxes from VERA and VLBA/EVN and their differences References for Name (mas) (mas) (mas) VLBA/EVN NGC 281/NGC 281-W 0.3550.030 0.4210.022 Rygl et al. (2010) W3(H2O)/W3(OH) 0.5270.016 0.5120.010 Xu et al. (2006)a, Hachisuka et al. (2006) G135.2802.80 0.1240.011 0.1670.006 Hachisuka et al. (2009) IRAS 051373919 0.0860.027 0.2010.024 Hachisuka et al. (2015) Orion KL 2.390.03 2.4150.040 Menten et al. (2007) IRAS 060582138 0.5690.034 0.4760.006 Reid et al. (2009a)a, Sakai et al. (2019) HH 12-15 1.610.36 1.120.05 Dzib et al. (2016) S255 IR-SMA1 0.5630.036 0.6280.027 Rygl et al. (2010) S269 0.1890.008 0.2410.012 Quiroga-Nuñez et al. (2019) VY CMa 0.880.08 0.830.08 Zhang et al. (2012) IRAS 074272400 0.1850.027 0.1880.016 Choi et al. (2014) IRAS 162932422 5.61.5 7.11.3 Dzib et al. (2018) NGC 6334I(N) 0.7890.161 0.7440.076 Wu et al. (2014) G359.6200.25 0.330.14 0.3750.021 Reid et al. (2019) Sgr B2 0.1330.038 0.1290.012 Reid et al. (2009c) Sgr D 0.4230.083 0.1940.161 Reid et al. (2019) G005.8800.39 0.780.05 0.3340.020 Sato et al. (2014) M17 0.4910.041 0.5050.033 Xu et al. (2011) W48A 0.4330.026 0.3060.045 Zhang et al. (2009) G048.6000.02 0.1990.007 0.0930.005 Zhang et al. (2013) G049.1900.33 0.2110.016 0.1920.009 Wu et al. (2014) IRAS 192131723 0.2510.036 0.1620.013 Wu et al. (2019) ON1 0.4040.017 0.4250.036 Rygl et al. (2010), Xu et al. (2013)a IRAS 201264104 0.7500.092 0.610.02 Moscadelli et al. (2011) IRAS 202313430 0.6110.022 0.6290.017 Xu et al. (2013) G097.5303.18 0.1770.028 0.1330.017 Hachisuka et al. (2015) IRAS 213795106 0.2620.031 0.2060.007 Choi et al. (2014) AFGL 2789 0.3260.031 0.2530.024 Choi et al. (2014)a, Sakai et al. (2019) If there are multiple references, we refer to papers labeled with reporting higher accuracy parallaxes.
Comparison of Galactic center distance Method Reference (kpc) VLBI astrometry of 188 maser sources Present work VLBI astrometry of 147 maser sources Reid et al. (2019) 8.150.15 Orbital motion of S2 around Sgr A∗ Gravity Collaboration et al. (2019) Orbital motions of S0-2 around Sgr A∗ Do et al. (2019)