Impact of an Active Sgr A* on the Synthesis of Water and Organic Molecules Throughout the Milky Way
Abstract
Sgr A*, the supermassive black hole (SMBH) in our Galaxy, is dormant today, but it should have gone through multiple gas-accretion episodes in the past billions of years to grow to its current mass of . Each episode temporarily ignites the SMBH and turns the Galactic Center into an active galactic nucleus (AGN). Recently, we showed that the AGN could produce large amount of hard X-rays that can penetrate the dense interstellar medium in the Galactic plane. Here we further study the impact of the X-rays on the molecular chemistry in our Galaxy. We use a chemical reaction network to simulate the evolution of several molecular species including \ceH2O, \ceCH3OH, and \ceH2CO, both in the gas phase and on the surface of dust grains. We find that the X-ray irradiation could significantly enhance the abundances of these species. The effect is the most significant in those young, high-density molecular clouds, and could be prominent at a Galactic distance of kpc or smaller. The imprint in the chemical abundance is visible even several million years after the AGN turns off.
1 Introduction
Supermassive black holes (SMBHs) are ubiquitous in the centers of massive galaxies (Kormendy & Ho, 2013). In theory, a SMBH grows to its current mass mainly through multiple episodes of gas accretion (Volonteri, 2010). In each accretion phase a significant fraction of the gravitational energy of the gas is released in the form of radiation, and the galaxy center consequently becomes an active galactic nucleus (AGN, Soltan, 1982). Analysis of the luminosity function of bright AGNs indicates that the accretion episodes may add up to about of the lifetime of a galaxy (Hopkins & Hernquist, 2009; Shankar et al., 2009). The SMBHs in the mass range of on average are more active in the sense that they become AGNs every years while each active phase only lasts years (Hopkins et al., 2006).
The center of the Milky Way (MW) also harbors a SMBH. It coincides with the bright radio source Sagittarius A* (Sgr A*) and the mass is estimated to be (Genzel et al., 2010). This black hole (BH) is dormant today, but in the past it should have been active according to the close relationship between SMBH growth and AGN activity (Mezger et al., 1996). One interesting discovery in the last decade is that Sgr A* may be an AGN just several million years (Myrs) ago. This picture is supported by a series of findings, including the Fermi bubble (Su et al., 2010), the bright emission of H lines in the Magellanic Stream (Bland-Hawthorn et al., 2013), and the young stellar disk around Sgr A* which is reminiscent of a relic accretion disk (see Chen & Amaro-Seoane, 2015, for a review). The peak luminosity of that recent AGN is unclear and the current estimations fall in a broad range of of the Eddington limit (Nayakshin & Cuadra, 2005; Bland-Hawthorn et al., 2013). Such a high level of activity is not completely unexpected given the aforementioned frequent activity of low-mass BHs.
Not many works have explored the impact of an active Sgr A* on the habitability of the MW. Early studies identified X-ray and cosmic rays as a potential threat to lives but they lacked a theoretical framework to quantify the damage (Clarke, 1981; Laviolette, 1987; Gonzalez, 2005). Amaro-Seoane & Chen (2019, Paper I) adopted an empirical AGN spectral energy distribution (SED) and calculated the extinction of light in the Galactic plane. They found that hard X-rays ( keV) could reach Earth unattenuated and the corresponding flux is comparable to an X-class solar flare. They also suspected that the high X-ray irradiation may have a noticeable impact on the molecular chemistry in the MW. Other works neglected the attenuation of light and focused on the evaporation of planet atmosphere during the AGN irradiation (Balbi & Tombesi, 2017; Chen et al., 2018; Forbes & Loeb, 2018; Wisłocka et al., 2019). Their general conclusion is that mass loss is significant only within a distance of kpc from Sgr A*. More recently, Lingam et al. (2019) explored possible beneficial effects associated with the AGN irradiation, such as a prebiotic synthesis of the building blocks of biomolecule and a powering of photosynthesis on free-floating planets. Based on the estimation of the UV flux, they reached a similar conclusion that only in the central kpc of the MW are these effects important.
In this work, we continue our early study of the impact of an active Sgr A* on the habitability of the MW. We focus on hard X-ray irradiation because, unlike optical and UV, hard X-ray photons are not attenuated by the gas in the Galactic plane and hence could reach large distances (see Paper I). It is known, from studying the molecular clouds in star-forming regions, that hard X-rays could enhance the abundance of organic molecules such as \ceCN, C2H, HCN by orders of magnitude (Krolik & Kallman, 1983; Lepp & Dalgarno, 1996). The main reason is that X-rays, by ionizing atoms and molecules, create energetic electrons (Shull & van Steenberg, 1985; Maloney et al., 1996), which, by further interacting with the atoms and molecules, produce reactive ions and radicals (Herbst & Klemperer, 1973; Herbst & van Dishoeck, 2009a). Ions and radicals, compared to neutral species, react more quickly to produce complex molecules (Herbst & van Dishoeck, 2009a; Wakelam et al., 2010).
Because of the close relationship between X-ray irradiation and the synthesis of organic molecules, we expect an imprint of the recent active Sgr A* in the abundance of complex molecules in the MW. This is a reasonable expectation also because abnormal molecular abundances have been detected in external galaxies with AGNs (Usero et al., 2004). For example, the column densities of \ceH2O and some organic species such as \ceHCN, \ceHCO+, and \ceCH3OH are particularly high in AGNs (González-Alfonso et al., 2010; Davies et al., 2012; Imanishi & Nakanishi, 2014; Takano et al., 2014; Harada et al., 2018) compared to those in MW clouds (see below). The canonical explanation of this enhancement is that the AGN produces an X-ray dominated region (XDR) within a distance of pc (Meijerink & Spaans, 2005; Meijerink et al., 2007; Viti et al., 2014; Izumi et al., 2015). At such a close distance, the X-ray flux could be as high as , which exceeds the UV radiation produced by the starburst in a galactic nucleus (typically , e.g., García-Burillo et al., 2010; Izumi et al., 2015). As a result, the molecular clouds in this region are ionized mainly by X-rays and heated to a temperature of K. Under these conditions, the synthesis of \ceH2O and organic molecules can be enhanced. Besides X-ray irradiation, mechanical heating due wind or jet also plays an important role in the enhancement of organic molecules, such as \ceHCN (García-Burillo et al., 2014; Izumi et al., 2015; Martín et al., 2015).
Although these previous studies revealed a positive correlation between X-ray irradiation and the abundances of water and organic molecules, we cannot draw directly the conclusion that the past activities of Sgr A* have had a positive impact on the production of water and organic molecules in the MW. The reasons are as follows. (i) We are interested in the molecular clouds throughout the MW, with the distance from the Galactic Center ranging from hundreds of parsecs to ten kpc. In this distance range, the X-ray flux impinging on the clouds is not as strong as those shown above in AGNs. For example, in Paper I we showed that at the location of the solar system, which is kpc from the Galactic Center, the X-ray flux during the active phase of Sgr A* is a few times . Such a flux is not much higher than the UV-background radiation in the Galactic plane Draine (1978). Therefore, our molecular clouds are not in the XDR. In fact, neither the UV background nor the cosmic rays can be neglected in the chemistry model of these clouds. (ii) When the X-ray flux is as low as , the molecular clouds would not be significantly heated by the X-ray ionization and could remain cold ( K) (Meijerink et al., 2007). In such a “cold cloud”, the dominant chemical reactions and the reaction rates differ from those in an XDR (Herbst & van Dishoeck, 2009a). It is worth noting that cold clouds represent the initial conditions for the formation of low-mass stars, such as our Sun, and may determine the early chemical composition of solar-like systems. Therefore, it is important to understand the potential impact of the X-ray irradiation on the synthesis of water and organic molecules in them.
In cold clouds, several molecules are synthesized at a relatively early stage, some of which are the building blocks of more complex, larger molecules. Among these “zeroth-generation” species, water (\ceH2O), methanol (\ceCH3OH), and formaldehyde (\ceH2CO) are commonly found in the molecular clouds of the MW (Herbst & van Dishoeck, 2009a). Therefore, they are particularly interesting to our study. (i) Water is an important molecule involved in the processes leading to the origin of life. It can be synthesized in gas as well as on the surface of dust grains. In cold clouds, the water vapor abundance (relative to \ceH2) is normally (Snell et al., 2000), while the surface abundance of water ice is much higher, about of \ceH2 (Bergin & Tafalla, 2007). Around AGNs, the abundance of water vapor can be as high as (González-Alfonso et al., 2010), confirming the positive effect of X-ray irradiation on the synthesis of water molecules. (ii) Methanol (\ceCH3OH) is one of the most common organic molecules detected in cold clouds (Herbst & van Dishoeck, 2009b). Its abundance varies from and below in the gas phase ( K) to as high as in ice (Herbst & van Dishoeck, 2009b). In AGNs, the gas abundance is typically (García-Burillo et al., 2010; Nakajima et al., 2015; Harada et al., 2018). These \ceCH3OH in XDRs may be produced on grains and then released into the gas due to shock. (iii) Formaldehyde (\ceH2CO) is often detected at the surface of a cold cloud. This species may be produced by grain processes deep in the cores of the cloud and later brought to the cloud surface by turbulence (Federman & Allen, 1991). In cold clouds, the typical gas abundance is (Carey et al., 1998), but in XDRs the abundance can be orders of magnitude higher (Harada et al., 2015, 2018).
The chemical process which lead to the formation of large, organic molecules in the MW is still under intensive investigation, and the role of the X-rays from Sgr A* is unclear. As a first step towards understanding their possible relationship, we study in this work the synthesis of water and the “zeroth-generation” organic molecules in cold clouds. We pay particular attention to \ceCH3OH and \ceH2CO, for the reasons given above, but we also study several other organic molecules, such as \ceHCN, \ceHCO+, which are known to be enhanced in XDRs (Kohno et al., 2003; Usero et al., 2004; Davies et al., 2012; Imanishi & Nakanishi, 2014; Viti et al., 2014; Martín et al., 2015).
This paper is organized as follows. In §2 we calculate the X-ray irradiation spectra at different distances from Sgr A*, and we also specify our X-ray chemical model, especially the processes associated with \ceH2O, \ceCH3OH, and \ceH2CO . In §3 we describe our simulation of the molecular chemistry induced by X-ray irradiation. The results are presented in §4, where we show the dependence of the abundance of different molecules on the distance, column density, and lifetime of a molecular cloud. A possible diagnostics is provided in §5 for future observational test of our theoretical results. We discuss the caveats of our current model in §6 and finally summarize our conclusions in §7.
2 X-ray Chemistry in Molecular Clouds
2.1 X-ray Source
To calculate the X-ray flux during the AGN phase of Sgr A*, we use a numerical model which is described in detail in Liu et al. (2016). This model computes the SED of an accretion disk based on three parameters, the Eddington ratio defined as where is the bolometric luminosity of the disk, the X-ray spectral index , and the magnetic parameter which characterizes the relative importance between the sum of the gas and radiative pressure and the magnetic pressure. In this model, hard X-rays are produced by a hot corona screening the disk. The solid curves in Figure 1 show the output SED as a function of the Eddington ratio. In the calculation we assume that , and the BH mass is . We find that when , the X-ray flux above keV is more or less constant, at a level of a few times . This result from numerical simulation is consistent with our analytical estimation in Paper I. When , we find that the luminosity of hard X-ray falls linearly with decreasing Eddington ratio.
Soft photons are subject to extinction as they propagate in the Galactic plane. To quantify it, we adopt the empirical density profile of the atomic hydrogen and molecular hydrogen in the MW (McMillan, 2017), and we use the software Xspec111https://heasarc.gsfc.nasa.gov/xanadu/xspec/ to calculate the extinction. Since most molecular clouds are inside the Galactic plane, we only consider the horizontal (in-plane) gas distribution. The corresponding column density at a Galactic distance of is
| (1) |
The residual SEDs at kpc, for example, are shown in Figure 1 as the dot-dashed curves. We can see that the optical and UV radiation is completely absorbed. For this reason, in our chemistry model we focus on the effects induced by X-rays.
2.2 X-ray Ionization
It is mainly through ionization that X-ray irradiation could affect the chemistry inside a molecular cloud (Maloney et al., 1996). Other effects, such as Coulomb heating, are less important in an environment where the ionization fraction is relatively low. In our model we consider two types of ionization.
Primary ionization, also known as the direct photoionization, is caused by an X-ray photon striking an atom (e.g. Latif et al., 2015). The primary ionization rate for a given species can be calculated with
| (2) |
where is the monochromatic X-ray flux incident on the surface of a molecular cloud, is the photoionization cross section given a photon energy of (Verner et al., 1996), is the optical depth defined as
| (3) |
and is the column density of a species. In calculating the optical depth, we have taken into account the fact that \ceH (mostly in molecular hydrogen) and \ceHe contribute to most of the opacity.
The photoelectrons released in primary ionization could further collide with other atoms and cause secondary ionization (Maloney et al., 1996; Stäuber et al., 2005). In principle, the secondary ionization rate can be calculated with
| (4) |
where is the number of secondary ionization events produced by each photoelectron in average. If the energy of the photoelectron is , this number can be calculated with
| (5) |
where is the fraction of the photoelectron’s energy which goes into secondary ionization, is the ionization threshold of an atom, and is the mean energy needed to produce an ion-electron pair. In practice, we simplify the calculation by adopting the ionization rates presented in Shull & van Steenberg (1985). These rates are derived from a Monte Carlo simulation of the secondary ionization of \ceH and \ceHe atoms over a wide range of electron fraction () and photoelectron energy (from eV to several keV).
Although we have two types of ionization in our model, the secondary ionization rate predominates. For example, if we consider a typical value of for a cold ( K) molecular cloud, approximately of the energy of primary photoelectrons goes into secondary ionization. Since the ground state of neutral \ceH has a ionization threshold , using and , we find that for a typical primary photoelectron with keV, the number for secondary ionization events it will cause is .
For \ceH2, \ceH and \ceHe, we consider both primary and secondary ionization. For heavy elements (\ceC, N, O, etc.) and molecules (\ceCO, CO2, etc.), we consider only the secondary ionization for simplicity. We assume that the ionizing electrons are mainly from the three most abundant neutral species, i.e., \ceH2, \ceH and \ceHe. Then the ionization rate of heavy elements and molecules can be derived from
| (6) |
where is the electron-impact cross section at energy (Maloney et al., 1996; Ádámkovics et al., 2011). We note that heavy elements are usually bound in molecules, but the current derivation of assumes that the cross section is unaffected by the molecular binding energy. Moreover, we notice that the ratio of the cross sections, which appears in the last equation, is insensitive to (Maloney et al., 1996). For this reason, we use the cross sections at , which is the typical energy of the secondary electrons.
For completeness, we also consider the destruction of \ceH2 and several other molecules caused by photoionization. For example, photoionization of \ceH2 can have two possible outcomes, pure ionization and dissociation, which can be expressed as
We take the branching ratio suggested by Krolik & Kallman (1983), that the fraction of pure ionization is approximately and that for dissociation is . For other atomic and molecular reactants, we adopt the same products from the OSU chemical database osu_01_2007222https://faculty.virginia.edu/.archived/ericherb/research.html, as well as the corresponding branching ratios for cosmic-ray ionization and dissociation. We choose this database because it was used by Wakelam & Herbst (2008) to explained the molecular abundances observed in the cold dense cores in the MW. These cores represent the intial conditions of the moeluclar clouds of our own interest. To be able to reproduce the results in Wakelam & Herbst (2008), we did not choose the latest chemical database provided by the OSU group. The later updates included more anions, which are more important for the formation of long carbon cahins (Herbst & van Dishoeck, 2009a).
2.3 Grain Processes
The surface of a dust particle (grain) is an important place for the synthesis of complex molecules. A grain accretes from the surrounding gas many molecular species to its surface, where these molecules can interact more frequently and the chemical reactions such as hydrogenation can proceed more efficiently. Since we are interested in the synthesis of \ceH2O, \ceCH3OH, and \ceH2CO (see §1), we include in our model the surface reactions containing the species made of \ceH, C, N, O. Only those species with no more than two \ceC atoms are selected since we do not study long-carbon-chain species in this work. Table 1 in A shows the relevant reactions, which are selected from the network presented in Hasegawa et al. (1992). The last column shows the activation energies for those reactions with high energy barriers. This network is sufficient to simulate the species we are interested in. The reaction parameters in this network are still frequently used today, although there are works which extend the reaction mechanisms so that the desorption energy may depend on the fraction of surface coverage by molecules (Garrod & Pauly, 2011) and that the molecules in ice mantle could react with each other (Chang & Herbst, 2014). More recent grain-surface chemical networks (e.g., Garrod et al., 2008) are usually concerned with the formation of more complex organic molecules, which is not the focus of the current work. On one hand, the abundances of those very complex molecules are usually low, so that including them in our network should have a negligible effect on the species studied in this paper. On the other, it may be interesting to ask to what extent those more complex molecules are affected by the mechanisms discussed in the current paper, which may be a topic for future investigation.
We calculate the accretion rate of molecules onto dust grains following the method developed in Hasegawa et al. (1992). We consider accretion, via weak van der Waals forces (physisorption), onto “classic” dust grains, which have a fixed radius , a density of g/cm3, and sites for adsorption (the number of molecules that can be absorbed to and held on a dust grain). The dust temperature is assumed to be the same as the gas temperature K, following the assumption in Hasegawa et al. (1992). This is a reasonable approximation for the clouds at kpc but may be too crude for those at kpc. This is because within kpc from the AGN, the X-ray flux significantly exceeds so that heating due to ionization cannot be neglected given our cloud density of (Meijerink et al., 2007). Moreover, we did not consider the difference between the gas and dust temperatures because the difference is small due to the efficient gas-dust coupling at a high density of (Goldsmith, 2001). Moreover, the reaction rates are insensitive to small temperature changes (at least in the range of temperature of our interest). For the gas-to-dust ratio in mass, we adopt the standard value of . We assume that the velocities of the gas species obey Maxwell distribution. For any species that strikes a dust grain, a sticking probability of is assumed.
For the desorption of molecules, we consider three channels, namely, thermal desorption, cosmic-ray desorption, and photo-desorption. (i) Given the adsorption energy and dust temperature , the thermal evaporation rate can be calculated with (Hasegawa et al., 1992), where is the Boltzmann constant. The value of for each species is from Allen & Robinson (1977) and Hasegawa & Herbst (1993). We note that although thermal evaporation is common, the rate is negligible for any species heavier than \ceHe because of the low temperature in our molecular clouds. (ii) The cosmic-ray induced desorption rates are calculated as in (Hasegawa & Herbst, 1993). Every time a cosmic-ray particle strikes a dust grain, the dust temperature is assumed to rise to K immediately and then drop via thermal desorption. (iii) Photo-desorption can be induced by either UV or X-ray photons. For UV-induced desorption, we assume a rate of molecule per grain per incident UV photon for any species in our grain-surface network (also see Visser et al., 2011). Since UV-induced desorption depends strongly on the visual extinction, which is a function of the optical depths of a molecular cloud, we will study in §4.3 the dependence of the rate on the column density of the molecular cloud. The X-ray desorption processes are more complex (see Jiménez-Escobar et al., 2018 for a brief review) and not as well understood both in theory and in experiment. However, X-ray photons are more penetrative than UV photons, so that the interaction happens deeper inside the bulk of a grain and hence does not as often lead to desorption. Therefore, the X-ray desorption is less significant compared to UV photo-desorption and we neglect it in our model.
3 Simulation
We solve the evolution of the chemical network using the public package KROME333http://kromepackage.org/ (Grassi et al., 2014). The initial conditions are as follows. Our molecular cloud has a gas temperature of and a density of . The initial abundances of elements are taken from the EA2 model in Wakelam & Herbst (2008), which is based on the high-metal environment observed in the diffuse cloud of Ophiuchi and is modified based on recent observations of cold cores. For the species at different depths of a molecular cloud, we assume that they follow the same initial abundances.
In our model, even when there is no X-ray irradiation, we include a low level of ionization caused by cosmic rays. The corresponding ionization rate is s-1 per hydrogen atom (Wakelam & Herbst, 2008). We also include a generic UV background according to Draine (1978). Given the UV flux, we calculate the photo-ionization and photo-desorption rates following the scheme presented in §2.
To simulate the impact of the AGN, we turn on X-ray chemistry in the network according to the method described in §2.2 and §2.3. The X-ray SED is calculated assuming a fiducial Eddington ratio of . The extinction of optical, UV, and soft-X-ray photons by the Galactic plane is taken into account following §2.1. Since hard X-rays have relatively low extinction in the Galactic plane, the flux decreases with the distance approximately as . The corresponding values are at . The duration of the X-ray irradiation is set to years, to be consistent with the empirical evidence (§1). After that, we turn off the X-ray and let the network evolve for another years. By the end of the simulation, we investigate the abundance of the molecular species at different Galactic distances to look for possible imprints of an AGN. In our fiducial model we use kpc (§4.1). We also run simulations using kpc for comparison (§4.2).
We notice that as the system evolves, the chemical abundance is no longer uniformly distributed inside a molecular cloud because the extinction of UV and X-ray radiation varies at different depth of the cloud. The depth can be characterized by the column density of hydrogen, , which is related to as . Therefore, to understand the abundance of molecular species at different depth in a cloud, we run simulations using different . Given the value of , the extinction of X-ray inside the cloud is calculated using optical depth defined in Equation (3). For the extinction of UV photons, we use the empirical relationship
| (7) |
which is caused mainly by dust (Draine, 2011). For reference, the typical visual extinction is 8 mag in a dense molecular cloud and could increase to 15 mag in dense cores (Tielens, 2010). In our fiducial model, we set cm-2 and the corresponding is . We also experiment with and cm-2 for comparison and the results are shown in §4.3.
We also note that in our fiducial model the initial chemical abundance is out of equilibrium, in the sense that without X-ray irradiation the abundance would still evolve relatively quickly, on a timescale of years. Nevertheless, we choose this initial condition because it agrees better with the observed abundance in several molecular clouds (e.g. Wakelam & Herbst, 2008; Quan & Herbst, 2007). For old molecular clouds ( years), the chemical abundance could significantly deviate from our initial condition. To account for this possibility, we run additional simulations in which we evolve our network for years before we turn on the X-ray irradiation. The results are presented in §4.4.
4 Results
4.1 Fiducial Model
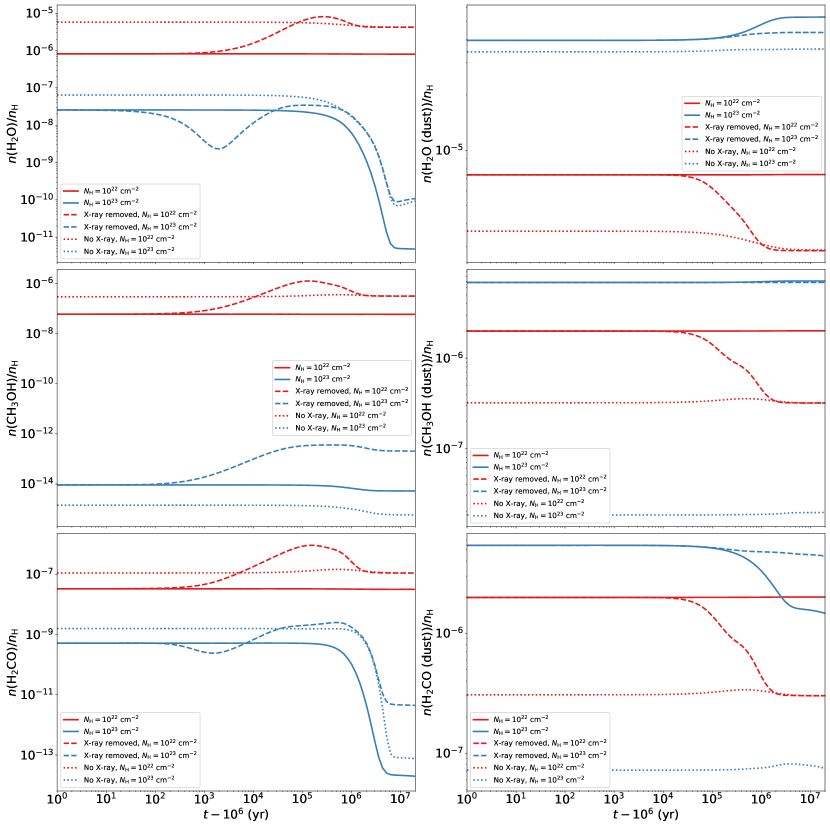
In our fiducial model, the Eddington ratio of the AGN is . The molecular cloud is at a Galactic distance of kpc and has a column density of cm-2 (). The results for the chemical evolution are shown in Figures 2 and 3. In general, the abundances of molecules on the dust grain surface are several orders of magnitude higher than their gas-phase counterparts. This is mainly because at low temperatures ( K) molecules stay on the surface of dust grains, and the grain surface acts as a reaction container and a catalyst leading to much more efficient formation of \ceH2O, \ceCH3OH, etc.
For \ceH2O (Fig. 2), on the grain surface (lower panels), even without X-rays (the black dot-dashed curves) the abundance keeps growing during the first years and afterwards saturates. The increase is caused mainly by two surface reactions, (i) \ceH2 + OH -¿ H2O + H and (ii) \ceH + OH -¿ H2O. The first reaction usually predominates because of the high abundance of \ceH2, even though the activation energy is high (Hasegawa et al., 1992). The second one has a much lower energy barrier but the rate is limited by the low concentration of atomic \ceH at the grain surface. The saturation of the water surface abundance in the late stage is due to a balance between the photo-evaporation and the formation processes.
If we start X-ray irradiation at the very beginning (green solid curves), the \ceH2O surface abundance increases faster and in the end slightly exceeds that in the case without X-ray. We find that the first reaction is not significantly affected by the X-ray irradiation, because the \ceH2 surface abundance only slightly decreases. On the contrary, the second reaction becomes faster because the atomic hydrogen abundance increases significantly due to the X-ray dissociation of \ceH2. After we remove the X-ray irradiation at the end of years (green dashed curve), the surface abundance of \ceH2O stays more or less constant. The value is slightly lower than that in the case of X-ray irradiation because atomic \ceH quickly recombine to form \ceH2, thus the rate of the second reaction drops.
For the gas phase (the upper panels of Fig. 2), when there is no X-ray, the abundance of \ceH2O first increases until a plateau is reached around the time of years. During this period, ionization leads to the formation of \ceH3+, which is a highly reactive species that can quickly produce \ceOH+, \ceH2O+, and \ceH3O+ (Krolik & Kallman, 1983). Gaseous water is synthesized mainly by the recombination of \ceH3O+ with electrons. Around the time of years, the abundance of gas \ceH2O starts to decrease because the materials such as \ceOH+, \ceH2O+, and \ceH3O+ run out following the exhaustion of \ceO, so that the formation of \ceH2O slows down. The final gaseous abundance is limited mainly by the interaction with atomic cations, such as \ceSi+ through the ion-neutral reaction \ceSi+ + H2O -¿ HSiO+ + H.
When X-ray irradiation is turned on, the behavior of the water abundance in the gas phase in similar to that on the grain surface. However, both the rise and fall of the \ceH2O abundance are more prominent, which leads to a higher plateau around yr and a lower abundance at about yr. The sharper evolution is caused by the higher cation density during the X-ray ionization, such as \ceH3+, OH+, H2O+, during the early formation stage of \ceH2O, as well as the higher abundance of \ceSi+ during the later stage of \ceH2O destruction. After we remove the X-rays, the abundance of \ceH2O first decreases but within about years recovers the value which is seen in the case of no X-ray irradiation. The recovery is caused by the dissociative recombination, \ceH3O+ + e- -¿ H2O + H, as well as the photo-evaporation from the grain surface.
For \ceCH3OH, the evolution of the abundance after the first yr is shown in the two upper panels of Figure 3. We do not show the evolution in the first years because it is a monotonic increase. Also, we are more interested in the molecular abundances millions of years after the AGN turns off. At the grain surface (right panel), when there is no X-ray irradiation, the abundance is almost constant over years of evolution. The dominant synthesis process is hydrogenation, via \ceCO -¿ HOC -¿ CHOH -¿ CH2OH -¿ CH3OH. When X-ray irradiation is turned on, the abundance of \ceCH3OH becomes more than two orders of magnitude higher. The increase is caused by a faster hydrogenation process, as the result of a larger atomic-hydrogen abundance due to the X-ray disassociation. Even after we remove the X-ray, the \ceCH3OH surface abundance stays nearly the same. This is because in our model there is no chemical reaction at the grain surface for \ceCH3OH destruction (also see Hasegawa et al., 1992) and also the photo-evaporation of \ceCH3OH is inefficient.
In the gas phase (upper-left panel), without X-ray irradiation, the abundance of \ceCH3OH stays constant for about years and afterwards slightly declines. Gaseous \ceCH3OH mainly comes from the grain surface, and the later decline is caused by the reactions with cations, e.g., \ceCH3OH + He+ -¿ OH+ + CH3 + He / OH + CH3+ + He. With X-rays and for the particular Galactic distance of our choice, i.e., kpc, the abundance of \ceCH3OH increases by about one order of magnitude relative to that in the case without X-rays. The increase is closely related to the enhancement of the \ceCH3OH abundance on dust grains. After we remove the X-rays, the abundance increases even more because cations recombine and the destruction of \ceCH3OH slows down.
For \ceH2CO, the results are shown in the lower two panels of Figure 3. Unlike \ceCH3OH which forms only at the grain surface, \ceH2CO can form both on the surface of grains, mainly through hydrogenation \ceCO -¿ HCO -¿ H2CO, and in gas phase, via \ceCH3 + O -¿ H2CO + H. Moreover, There is also one pathway for \ceH2CO on the grain surface to dissociate, \ceH2CO + H -¿ HCO + H2. The \ceO atom can then be transferred to species like \ceCO2 through reaction \ceO + HCO -¿ CO2 + H. Although the activation energy of this dissociation is high, the reaction rate is still orders of magnitude higher than photo-evaporation.
With these differences in mind, we can understand the behavior of \ceH2CO at the grain surface (lower-right panel). During the X-ray irradiation, the formation rate is first enhanced due to a higher hydrogenation rate. In the last several million years of our simulation the abundance of \ceH2CO significantly decreases, because the disassociation process becomes important and \ceO atoms are slowly transferred to species like \ceCO2. After we remove the X-ray irradiation, the decrease of the surface abundance of \ceH2CO becomes slower because the surface abundance of \ceH falls substantially. Because the formation (hydrogenation) of \ceH2CO is also proportional to the surface abundance of \ceH, we do not see an increase of \ceH2CO after we remove the X-ray irradiation.
In the gas (lower-left panel), even without X-rays, the abundance of \ceH2CO drops by almost four orders of magnitude by the end of the years of evolution. The drop is mainly caused by the exhaustion of \ceCH3 and \ceO, so that the rate of the reaction \ceCH3 + O -¿ H2CO + H significantly decrease by the end of our simulation. With X-rays, the abundance decreases relative to that in the case without X-ray irradiation, by a factor of a few. The drop is due to the higher abundance of cations. In this case, the destructive reactions, such as \ceH2CO + S+ -¿ HCO+ + HS, become more efficient. When we remove the X-rays, the \ceH2CO abundance first recovers the value in the case of no X-ray irradiation and in about years significantly decreases due to the exhaustion of \ceCH3. Finally, the abundance balances at a value which is higher than that in the no-X-ray case, because more \ceCH3 has been produced during the episode of X-ray irradiation.
For completeness, we show in the B the evolution of the other species that are often detected in molecular clouds. In general, we also find that their abundances with and without X-rays are different.
4.2 Distribution in the Galactic Disk
Since the X-ray flux decreases with increasing distance from the Galactic Center, we also explore the chemical evolution at different Galactic distances. The results are shown in Figure 4, where the column density of each cloud is still set to cm-2.
On the grain surface (right panels), when there is X-ray irradiation (solid curves), the abundance of \ceH2O keeps increasing as the Galactic distance decreases. The increase is caused by the higher abundance of atomic hydrogen as the ionization flux intensifies. For \ceCH3OH and \ceH2CO, however, the surface abundance maximizes at a Galactic distance of kpc, and further increasing or decreasing the distance would both lead to a lower abundance. The location where these two abundances peak is determined by two competing processes. On one hand, an important precursor of both species, \ceCO, can be destroyed by X-rays and hence cannot exist too close to the Galactic Center when the AGN is on. On the other, the abundance of \ceH increases towards the AGN due to X-ray disassociation. These two processes balance at about kpc and produce the highest abundance of \ceCH3OH and \ceH2CO there.
To understand the behavior of \ceH2O, \ceCH3OH, and \ceH2CO after we turn off the X-ray irradiation (dashed lines), we should first understand the evolution of \ceH2 and \ceCO. The major difference between the two species is that while the \ceH2 abundance is lowered by several percents during the X-ray irradiation, the abundance of \ceCO could be lowered by orders of magnitude depending on the Galactic distance. Therefore, after we turn off the X-rays, the abundance of \ceH2 only slightly increases in percentage, due to recombination, and recovers the equilibrium in the case of no X-rays, but the abundance of \ceCO increases more drastically. The difference in the recovery rate causes the different behavior of \ceH2O versus \ceCH3OH and \ceH2CO at the grain surface. We can see that after we turn off X-rays, the surface abundance of \ceH2O increases slightly, because there is slightly more \ceH2 for the reaction \ceH2 + OH -¿ H2O + H. For \ceCH3OH and \ceH2CO, however, there is a lot more \ceCO produced within a short period of time, especially at small Galactic distances. For example, at kpc the abundances of \ceCH3OH and \ceH2CO rise by orders of magnitude after the X-ray irradiation is turned off. One interesting result, which is shared by all the three molecular species (\ceH2O, \ceCH3OH, and \ceH2CO ) and at all the simulated Galactic distances, is that the final surface abundance after we remove X-rays is higher than the abundance in the case without X-ray irradiation.
In the gas phase (left panels), the behavior of \ceH2O, \ceCH3OH, and \ceH2CO also depends on the Galactic distance. For \ceH2O, the X-ray irradiation in general suppresses the abundance within a timescale of years, because, as we have explained in §4.1, destructive cations form in large amount but water formation on the grain surface is relatively inefficient. Moreover, the final abundance decreases with decreasing distance, because the X-ray flux is higher at smaller distance. For \ceCH3OH and \ceH2CO, destructive cations also form due to the X-ray irradiation. That is why at small Galactic distances such as and kpc, the abundances of \ceCH3OH and \ceH2CO are suppressed when the AGN is on. However, at large distances such as and kpc, the abundances are not significantly suppressed and could even exceed those in the cases without X-rays. The reason is that at these distances the X-ray flux is not as strong so that \ceCH3OH and \ceH2CO form very fast on the grain surface, which, through photo-evaporation, could also enrich the gas.
After we turn off the X-ray irradiation, the gaseous abundances of \ceH2O, \ceCH3OH, and \ceH2CO all increase within a timescale of years, regardless of the Galactic distance. The cause is mainly the recombination of cations, which in turn lowers the destruction rate. Photo-evaporation also contributes considerably. Even for \ceH2O, whose gaseous concentration is not as sensitive to the surface abundance, photo-evaporation enriches the gas species significantly after years, when the dissociative recombination has significantly slowed down. We find that at all distances, after we remove the X-rays, the final abundances of gaseous \ceH2O, \ceCH3OH, and \ceH2CO exceed those in the case without an AGN or with a constant AGN.
These results suggest that a relatively short episode ( years) of X-ray irradiation could indeed, in the following years, leave an imprint in the molecular abundances throughout the MW.
4.3 Distribution Inside Molecular Cloud
To understand the distribution of \ceH2O, \ceCH3OH, and \ceH2CO as a function of the depth inside a molecular cloud, we compute the chemical evolution assuming different column densities () for the cloud. The results are shown in Figure 5. In these calculations, the Galactic distance of the cloud is fixed at kpc.
We find that when the column density is high, i.e., (or equivalently ), the abundances (see the blue curves) are slightly, but systematically lower than those in the fiducial model. This trend can be seen both in the gas phase and on the grain surface. The main cause of this systematic change is the lower UV flux due to higher extinction. The hard X-ray flux from the AGN is only slightly attenuated inside the molecular cloud, and hence when we turn on and off the AGN the evolution of the three species is similar to the evolution in our fiducial model.
In low-extinction regions ( cm-2, , the red curves), the surface abundances (right panels) are more significantly affected by the rise of the UV irradiation. Even when there is no X-ray radiation (dotted curves), the \ceH2O abundance is lower than that in the fiducial case by one order of magnitude. On the contrary, the surface abundances of \ceH2CO and \ceCH3OH are higher than those in the fiducial model. This result is caused by two competing processes. On one hand, surface species evaporate more rapidly in the presence of a higher UV flux. On the other, the higher density of \ceH due to UV ionization/dissociation enhances the rate of hydrogenation. Since the synthesis of \ceH2O uses mainly \ceH2, not \ceH, a higher UV flux would increase the evaporation rate more than the hydrogenation one, causing the surface abundance of water to decrease. For \ceCH3OH and \ceH2CO, the hydrogenation rate is relatively higher than the evaporation rate, so that the surface abundances increase when the UV flux becomes higher.
If we turn on X-rays, the surface abundances of all the three species increase (compare the red-dotted and the red-solid curves), because of an enhancement of the \ceH density on the grain surface. However, compared to those in the high-extinction regions (blue solid curves), the surface abundances in the low-extinction regions is reduced, because of a higher evaporation rate induced by X-rays in the latter case. After we remove the X-ray irradiation, within years the abundances recover the values in the case of no X-rays. The quick recovery is closely correlated with the high reaction and evaporation rate in the low-extinction regions.
In the gas phase of the low-extinction regions (red curves in the left panels), the abundances of \ceH2O, \ceCH3OH, and \ceH2CO without X-rays are much higher than those in the high-extinction ones. After we turn on the X-ray irradiation, the abundances become lower, but are still higher than those in the high-extinction regions. The high abundances in the gas are caused mainly by the high photo-evaporation rate on the grain surface. After we turn off X-rays, the gas abundances quickly recover the values in the no-X-ray case, and hence the imprint of the X-rays disappears within about years.
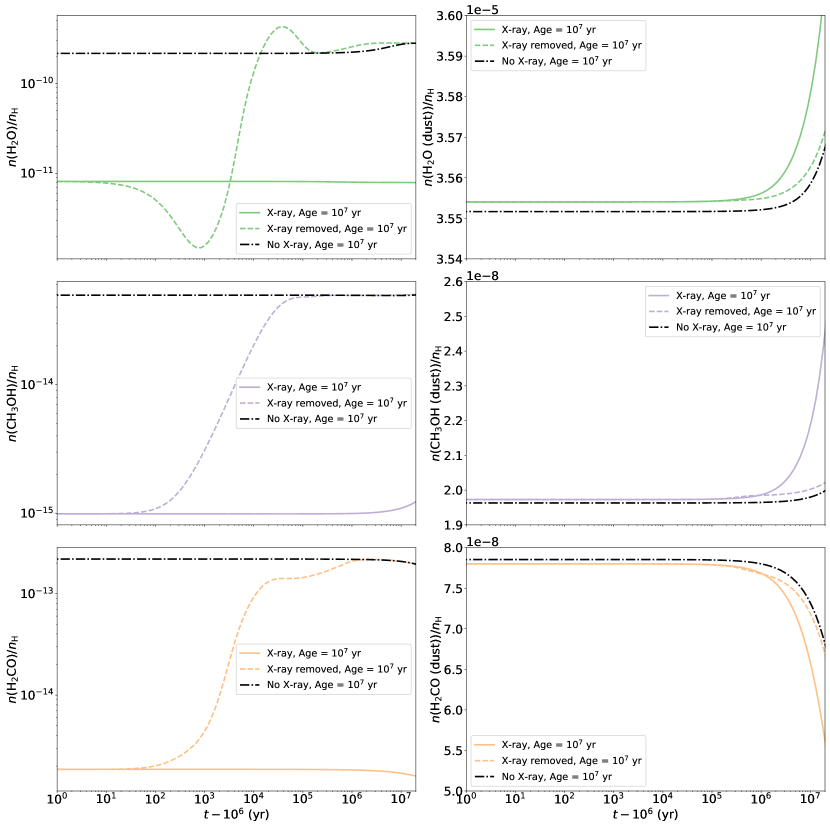
4.4 Age of Molecular Cloud
To see the response of a more evolved molecular cloud to the X-rays from the AGN, we run our chemical-reaction network without X-rays for years and take the resulting chemical abundances as our new initial condition for the later simulations. The other parameters are the same as in the fiducial model. The results are presented in Figure 6. We see that the abundances in the case without X-rays no longer significantly vary with time, both in the gas and on the grain surface, suggesting that the chemical reactions have reached an equilibrium on a timescale of years.
If we turn on X-ray irradiation after the years of isolated evolution, on the grain surface (right panels) the abundances of \ceH2O and \ceCH3OH will increase, as we have seen in the fiducial model, but the abundance of \ceH2CO decreases. The decrease is caused by the reaction \ceH2CO + H -¿ HCO + H2, which predominates in the current conditions. We notice that the variation of the abundances of \ceCH3OH and \ceH2CO after we turn on X-rays is not as prominent as that in a less evolved cloud (see our fiducial model). This difference indicates that a chemically more evolved cloud is more resilient to X-ray irradiation. After we remove the X-rays, the surface abundances return to the values in the case of no X-ray radiation, on a timescale of about years.
In the gas phase (left panels), the X-ray irradiation significantly lowers the abundances of all the three molecules. This behavior is different from that in a less-evolved could, where the \ceCH3OH abundance is enhanced by X-rays (see Fig. 3). After we remove the X-rays, the abundances rise more quickly than that in a less-evolved cloud. As a result of the quick rise, a recovery of the equilibrium state for no X-rays is seen at about years. After this time, the imprint of an AGN is lost.
5 Diagnostics
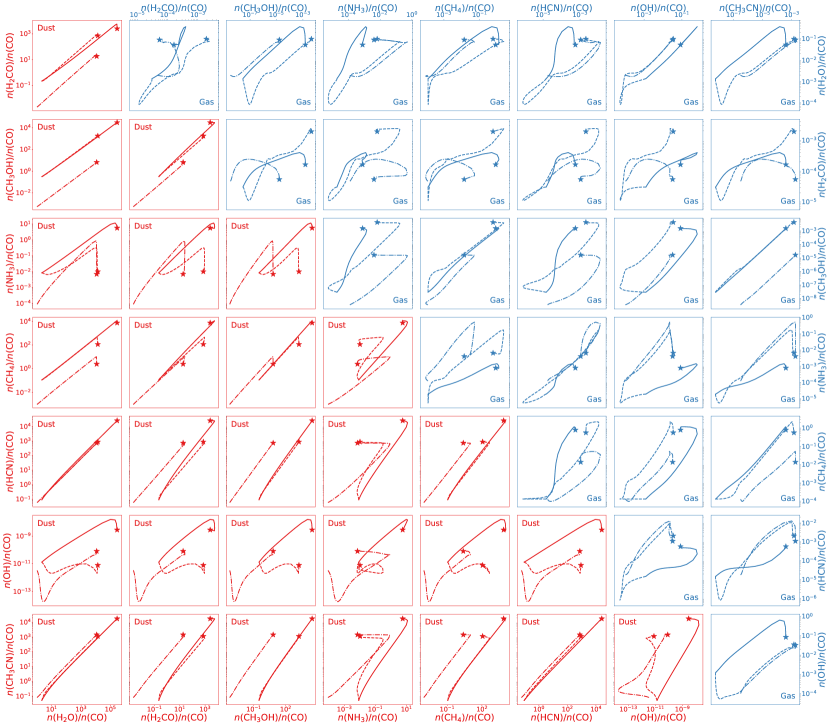
Here we provide possible diagnostics for future observations by showing in Figure 7 the abundance ratios of \ceH2O, \ceCH3OH, and \ceH2CO with respect to \ceCO. We choose \ceCO as the reference because it is the second most abundant gas molecule (after \ceH2) and relatively easy to detect in molecular clouds. Molecules on the grain surface are not directly detectable, but we plot their abundance ratios relative to the gas-phase \ceCO as well, because surface molecules could be rapidly released into the gas in certain processes which are not considered in this work, for example, by turbulence or shock (Federman & Allen, 1991; García-Burillo et al., 2010; Harada et al., 2018). We show only the results from our fiducial model. The other models generally lead to the same conclusion.
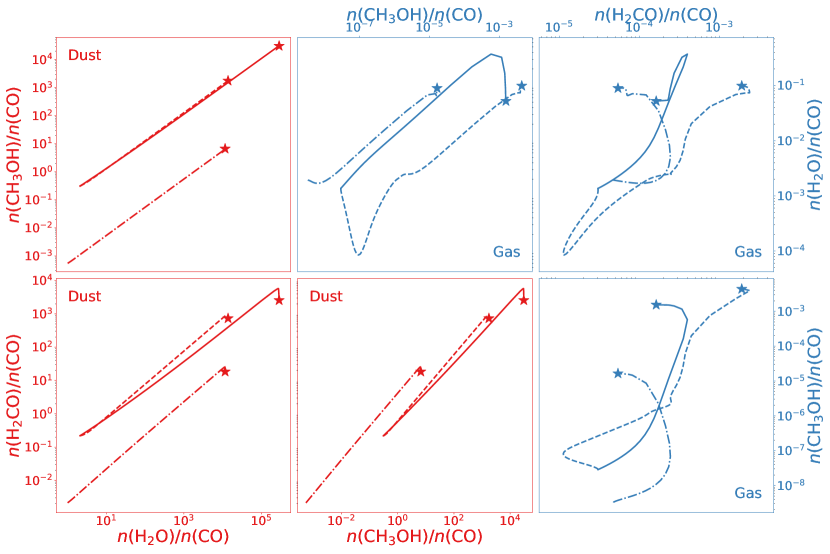
The three blue panels labeled with “Gas” in Figure 7 show the abundance ratios in the gas phase. From these diagrams, we find that by the end of our simulations (marked by the star symbols), the locations of the molecular clouds exposed to X-ray irradiation (solid and dashed curves) are well separated from those clouds without X-ray irradiation (dot-dashed curves). The divergence of the curves starts the earliest in the diagram of against . It is worth noting that at the column densities of our interest, the low-J transitions of \ceH2CO and \ceCH3OH are optically thin, therefore they are good tracers of the past activities of Sgr A*.
The three red panels labeled with “Dust” show the abundances of the \ceH2O, \ceCH3OH, and \ceH2CO on the grain surface relative to the gaseous abundance of \ceCO. The evolutionary tracks with and without X-rays, as well as the final locations of the molecular clouds, are well separated in these diagrams. This result indicates that the molecular clouds showing strong signs of turbulence or shock could provide better diagnostics of the activity of Sgr A*, because the surface molecules could have been released into the gas.
For the other neutral species simulated in this work, their diagnostics are shown in B.
6 Caveats
Besides photo-desorption (see §2.3), X-rays could also excite an electron to a sufficiently high energy so that it escapes from the grain surface (Draine, 2011). These photoelectrons from dust grains, in principle, are energetic enough to ionize the gas molecules, but we did not consider them in this work because of the uncertainty in the calculation of their number (Bakes & Tielens, 1994; Weingartner & Draine, 2001; Weingartner et al., 2006). The following estimation shows that by neglecting these photoelectrons, we could have underestimated the ionization rate of molecular gas by a factor of , and hence underestimated the effect of the AGN on the molecules in the gas phase.
Following the work of Weingartner et al. (2006) who modeled photoelectric emission from the grains exposed to extreme ultraviolet and X-ray radiation, we assume that (i) the typical dust particles are carbonaceous grains with a radius of m (cross section cm2), (ii) after each absorption of a hard-X-ray photon ( keV) the probability of a photoelectron (either primary or secondary) escaping the bulk solid is , and (iii) the photoionization cross section of hydrogen atom in ground state is cm2 at 1 keV. Moreover, we adopt the previous assumptions of a gas-to-dust ratio of (in mass) and a typical grain density of g/cm3. We find that the ratio between the number density of hydrogen atoms and that of carbonaceous grains is . Given these numbers, we find that for each X-ray photon of keV the average yield of photoelectrons from dust grains is about . The exact number depends on the sizes of grains which is not well constrained by observations. However, it is about times the yield of photoelectrons from gaseous hydrogen (see §2.1). Therefore, the effect of the photoelectrons from dust grains deserves further investigation.
The loss of photoelectrons would leave the dust grains positively charged. The X-ray induced grain charging has not been modelled in detail until recently (e.g. Ibáñez-Mejía et al., 2019). Charged grains, just like ambient electrons, can affect the temperature of free electrons through Coulomb scattering. They may also react with gaseous anions. However, both free electrons and gaseous anions are rare in the system of our interest. Therefore, we do not consider grain charging in this work.
7 Summary and Conclusion
Motivated by the observational evidence that the SMBH in the Galactic Center could be an AGN several million years ago, we studied the impact of the corresponding X-ray irradiation on the molecular chemistry in the MW. Our main results are summarized as follows.
-
1.
In our fiducial model, a molecular cloud is located at kpc from the Galactic Center and has a column density of . The X-ray irradiation from the AGN could slightly enhance the abundance of \ceH2O on the surface of dust grains and, at the same time, suppress the water abundance in the gas phase. After the AGN turns off, in the following years, the abundance on the grain surfaces remains slightly higher than that in the case without X-rays, while the abundance in the gas phase almost recovers the value of the no-X-ray case.
-
2.
For \ceCH3OH and \ceH2CO, our fiducial model shows that the abundances on the grain surface could be enhanced by one to two orders of magnitude during the X-ray irradiation. The enhancement could sustain for about years even after the AGN is turned off. In the gas phase, the abundance of \ceCH3OH is enhanced during the AGN episode by about one order of magnitude, but that of \ceH2CO is reduced slightly. Interestingly, after we turn off the X-ray irradiation, both abundances rise significantly. Therefore, by the end of the years of simulation, the final gas abundances are higher than the values in the no-X-ray case, by about two orders of magnitude.
-
3.
The exact values of the molecular abundances during and after the AGN episode depend on the distance of the molecular cloud from the Galactic Center. However, there is one feature which appears to be common at different Galactic distances. For a cloud similar to that in our fiducial model, if we irradiate it with X-ray for years and then turn off the irradiation for years, the final gas and the surface abundances are higher than the case with no X-ray irradiation. The enhancement is the most prominent at small Galactic distances, such as kpc.
-
4.
After the AGN turns off, the recovery of the molecular abundances is faster in low-extinction regions (), such as the surface of a molecular cloud or a low-column-density cloud. Therefore, the imprint of a past AGN should be easier to observe in high-column-density regions, e.g., .
-
5.
Older molecular clouds (e.g. years) recover more rapidly after the AGN turns off. Therefore, young molecular clouds are more likely to bear the chemical imprint of a past AGN.
These results suggest that the abundances of molecular species in the MW could be significantly affected and reach a new equilibrium during the past AGN activities of Sgr A*. The chemical imprint of the most recent AGN, which could have occurred several million years ago, may still be found today in those young, high-density molecular clouds residing at relatively small distances from the Galactic Center.
Appendix A Surface Reaction Network
Table 1 shows surface reactions in our model selected from the network in Hasegawa et al. (1992). The last column shows the reaction barrier.
| \ceH | \ceH | \ceH2 | 0 | |
| \ceH | \ceC | \ceCH | 0 | |
| \ceH | \ceN | \ceNH | 0 | |
| \ceH | \ceO | \ceOH | 0 | |
| \ceH | \ceCH | \ceCH2 | 0 | |
| \ceH | \ceNH | \ceNH2 | 0 | |
| \ceH | \ceOH | \ceH2O | 0 | |
| \ceH | \ceC2 | \ceC2H | 0 | |
| \ceH | \ceCN | \ceHCN | 0 | |
| \ceH | \ceCO | \ceHOC | 1000 | |
| \ceH | \ceCO | \ceHCO | 1000 | |
| \ceH | \ceNO | \ceHNO | 0 | |
| \ceH | \ceO2 | \ceO2H | 1200 | |
| \ceH | \ceN2 | \ceN2H | 1200 | |
| \ceH | \ceCH2 | \ceCH3 | 0 | |
| \ceH | \ceNH2 | \ceNH3 | 0 | |
| \ceH | \ceC2H | \ceC2H2 | 0 | |
| \ceH | \ceHOC | \ceCHOH | 0 | |
| \ceH | \ceHCO | \ceH2CO | 0 | |
| \ceH | \ceO2H | \ceH2O2 | 0 | |
| \ceH | \ceO3 | \ceO2 | \ceOH | 450 |
| \ceH | \ceC2N | \ceHCCN | 0 | |
| \ceH | \ceN2H | \ceN2H2 | 0 | |
| \ceH | \ceCH3 | \ceCH4 | 0 | |
| \ceH | \ceH2CO | \ceHCO | \ceH2 | 1850 |
| \ceH | \ceCHOH | \ceCH2OH | 0 | |
| \ceH | \ceH2O2 | \ceH2O | \ceOH | 1400 |
| \ceH | \ceN2H2 | \ceN2H | \ceH2 | 650 |
| \ceH | \ceHCCN | \ceCH2CN | 0 | |
| \ceH | \ceC2H2 | \ceC2H3 | 1210 | |
| \ceH | \ceC2H3 | \ceC2H4 | 0 | |
| \ceH | \ceCH2OH | \ceCH3OH | 0 | |
| \ceH | \ceCH2CN | \ceCH3CN | 0 | |
| \ceH | \ceC2H4 | \ceC2H5 | 750 | |
| \ceH | \ceC2H5 | \ceC2H6 | 0 | |
| \ceH2 | \ceOH | \ceH2O | \ceH | 2600 |
| \ceC | \ceC | \ceC2 | 0 | |
| \ceC | \ceN | \ceCN | 0 | |
| \ceC | \ceO | \ceCO | 0 | |
| \ceC | \ceCH | \ceC2H | 0 | |
| \ceC | \ceNH | \ceHNC | 0 | |
| \ceC | \ceOH | \ceHOC | 0 | |
| \ceC | \ceOH | \ceCO | \ceH | 0 |
| \ceC | \ceCN | \ceC2N | 0 | |
| \ceC | \ceNO | \ceOCN | 0 | |
| \ceC | \ceO2 | \ceCO | \ceO | 0 |
| \ceC | \ceCH2 | \ceC2H2 | 0 | |
| \ceC | \ceNH2 | \ceHNC | \ceH | 0 |
| \ceC | \ceOCN | \ceCO | \ceCN | 0 |
| \ceC | \ceCH3 | \ceC2H3 | 0 | |
| \ceN | \ceN | \ceN2 | 0 | |
| \ceN | \ceO | \ceNO | 0 | |
| \ceN | \ceCH | \ceHCN | 0 | |
| \ceN | \ceNH | \ceN2H | 0 | |
| \ceN | \ceC2 | \ceC2N | 0 | |
| \ceN | \ceNH2 | \ceN2H2 | 0 | |
| \ceO | \ceO | \ceO2 | 0 | |
| \ceO | \ceCH | \ceHCO | 0 | |
| \ceO | \ceNH | \ceHNO | 0 | |
| \ceO | \ceOH | \ceO2H | 0 | |
| \ceO | \ceCN | \ceOCN | 0 | |
| \ceO | \ceO2 | \ceO3 | 0 | |
| \ceO | \ceCO | \ceCO2 | 0 | |
| \ceO | \ceHCO | \ceCO2 | \ceH | 0 |
| \ceO | \ceCH2 | \ceH2CO | 0 | |
| \ceO | \ceCH3 | \ceCH2OH | 0 | |
| \ceCH | \ceCH | \ceC2H2 | 0 | |
| \ceCH | \ceOH | \ceCHOH | 0 | |
| \ceCH | \ceHNO | \ceNO | \ceCH2 | 0 |
| \ceCH | \ceCH3 | \ceC2H4 | 0 | |
| \ceOH | \ceOH | \ceH2O2 | 0 | |
| \ceOH | \ceCH2 | \ceCH2OH | 0 |
Appendix B Other Important Molecular Species
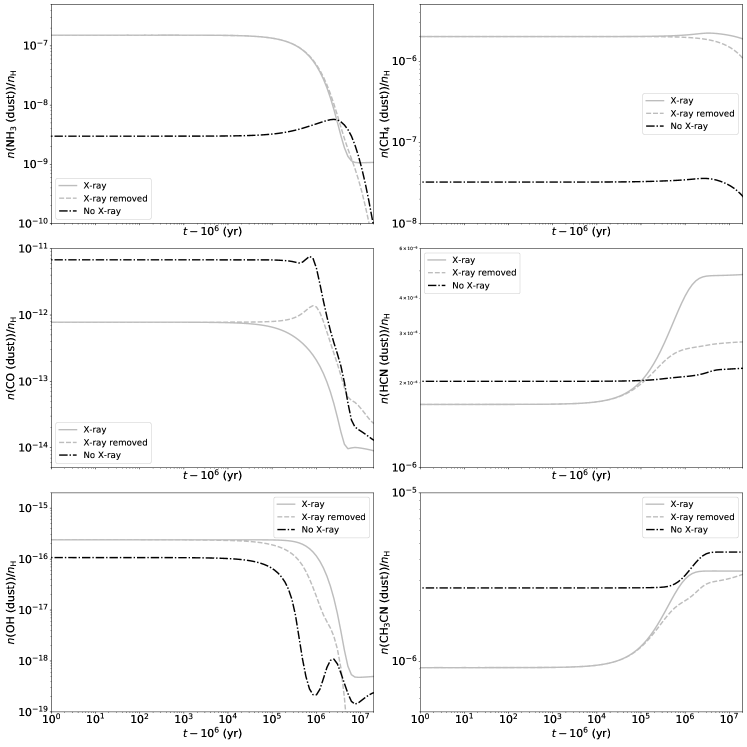
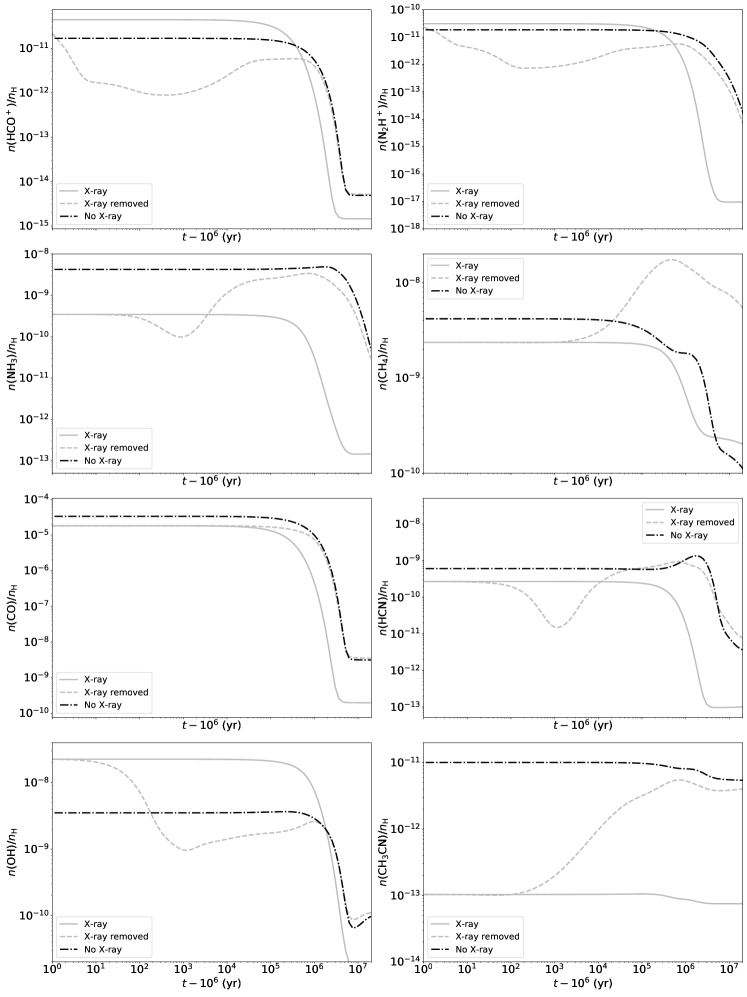
We also calculated the evolution of several other species that are often observed in molecular clouds, including two molecular ions (\ceHCO+, N2H+) and six neutral species (\ceNH3, CH4, CO, HCN, OH, CH3CN). The abundances on the grain surface and in the gas phase are shown, respectively, in Figures 8 and 9. The Calculation is conducted assuming our fiducial condition.
On the grain surface, the abundances of \ceNH3, CH4, HCN, OH are enhanced by X-rays, while those of \ceCO and \ceCH3CN slightly decrease in the presence of X-ray irradiation. In the gas phase, most of these molecular species tend to show lower concentration under X-ray irradiation. When we turn off the AGN, for most species the gas abundances quickly recover, but \ceCH4 shows a significant excess compared to the abundance in the case without X-rays. \ceHCO+ and \ceN2H+ are temporarily produced in higher efficiency in the first years of X-ray irradiation, and then the abundances decrease to values lower than those in the case without X-rays.
For completeness, we also plot in Figure 10 the diagnostics using all the neural species shown above. We find that in the gas phase (blue panels), the evolutionary tracks with and without X-ray irradiation are well separated. Therefore, we conclude that the gas abundances of the neutral molecules studied in this work could be good tracers of the past AGN in the Galactic Center. The evolutionary tracks of the dust species (red panels) are also separated, except for the pairs \ceH2CO-CH4, \ceH2O-HCN, \ceH2O-CH3CN, and \ceHCN-CH3CN.
References
- Ádámkovics et al. (2011) Ádámkovics, M., Glassgold, A. E., & Meijerink, R. 2011, ApJ, 736, 143
- Allen & Robinson (1977) Allen, M., & Robinson, G. W. 1977, ApJ, 212, 396
- Amaro-Seoane & Chen (2019) Amaro-Seoane, P., & Chen, X. 2019, J. Cosmology Astropart. Phys, 2019, 056
- Bakes & Tielens (1994) Bakes, E. L. O., & Tielens, A. G. G. M. 1994, ApJ, 427, 822
- Balbi & Tombesi (2017) Balbi, A., & Tombesi, F. 2017, Scientific Reports, 7, 16626
- Bergin & Tafalla (2007) Bergin, E. A., & Tafalla, M. 2007, ARA&A, 45, 339
- Bland-Hawthorn et al. (2013) Bland-Hawthorn, J., Maloney, P. R., Sutherland, R. S., & Madsen, G. J. 2013, ApJ, 778, 58
- Carey et al. (1998) Carey, S. J., Clark, F. O., Egan, M. P., et al. 1998, ApJ, 508, 721
- Chang & Herbst (2014) Chang, Q., & Herbst, E. 2014, ApJ, 787, 135
- Chen et al. (2018) Chen, H., Forbes, J. C., & Loeb, A. 2018, ApJ, 855, L1
- Chen & Amaro-Seoane (2015) Chen, X., & Amaro-Seoane, P. 2015, Classical and Quantum Gravity, 32, 064001
- Clarke (1981) Clarke, J. N. 1981, Icarus, 46, 94
- Davies et al. (2012) Davies, R., Mark, D., & Sternberg, A. 2012, A&A, 537, A133
- Draine (1978) Draine, B. T. 1978, ApJS, 36, 595
- Draine (2011) —. 2011, Physics of the Interstellar and Intergalactic Medium, Princeton: Princeton University Press
- Federman & Allen (1991) Federman, S. R., & Allen, M. 1991, ApJ, 375, 157
- Forbes & Loeb (2018) Forbes, J. C., & Loeb, A. 2018, MNRAS, 479, 171
- García-Burillo et al. (2014) García-Burillo, S., Combes, F., Usero, A., et al. 2014, A&A, 567, A125
- García-Burillo et al. (2010) García-Burillo, S., Usero, A., Fuente, A., et al. 2010, A&A, 519, A2
- Garrod & Pauly (2011) Garrod, R. T., & Pauly, T. 2011, ApJ, 735, 15
- Garrod et al. (2008) Garrod, R. T., Widicus Weaver, S. L., & Herbst, E. 2008, ApJ, 682, 283
- Genzel et al. (2010) Genzel, R., Eisenhauer, F., & Gillessen, S. 2010, Reviews of Modern Physics, 82, 3121
- Goldsmith (2001) Goldsmith, P. F. 2001, ApJ, 557, 736
- Gonzalez (2005) Gonzalez, G. 2005, Origins of Life and Evolution of the Biosphere, 35, 555
- González-Alfonso et al. (2010) González-Alfonso, E., Fischer, J., Isaak, K., et al. 2010, A&A, 518, L43
- Grassi et al. (2014) Grassi, T., Bovino, S., Schleicher, D. R. G., et al. 2014, MNRAS, 439, 2386
- Harada et al. (2018) Harada, N., Sakamoto, K., Martín, S., et al. 2018, ApJ, 855, 49
- Harada et al. (2015) Harada, N., Riquelme, D., Viti, S., et al. 2015, A&A, 584, A102
- Hasegawa & Herbst (1993) Hasegawa, T. I., & Herbst, E. 1993, MNRAS, 261, 83
- Hasegawa et al. (1992) Hasegawa, T. I., Herbst, E., & Leung, C. M. 1992, ApJS, 82, 167
- Herbst & Klemperer (1973) Herbst, E., & Klemperer, W. 1973, ApJ, 185, 505
- Herbst & van Dishoeck (2009a) Herbst, E., & van Dishoeck, E. F. 2009a, ARA&A, 47, 427
- Herbst & van Dishoeck (2009b) —. 2009b, ARA&A, 47, 427
- Hopkins & Hernquist (2009) Hopkins, P. F., & Hernquist, L. 2009, ApJ, 698, 1550
- Hopkins et al. (2006) Hopkins, P. F., Hernquist, L., Cox, T. J., et al. 2006, ApJS, 163, 1
- Ibáñez-Mejía et al. (2019) Ibáñez-Mejía, J. C., Walch, S., Ivlev, A. V., et al. 2019, MNRAS, 485, 1220
- Imanishi & Nakanishi (2014) Imanishi, M., & Nakanishi, K. 2014, AJ, 148, 9
- Izumi et al. (2015) Izumi, T., Kohno, K., Aalto, S., et al. 2015, ApJ, 811, 39
- Jiménez-Escobar et al. (2018) Jiménez-Escobar, A., Ciaravella, A., Cecchi-Pestellini, C., et al. 2018, ApJ, 868, 73
- Kohno et al. (2003) Kohno, K., Ishizuki, S., Matsushita, S., Vila-Vilaró, B., & Kawabe, R. 2003, PASJ, 55, L1
- Kormendy & Ho (2013) Kormendy, J., & Ho, L. C. 2013, ARA&A, 51, 511
- Krolik & Kallman (1983) Krolik, J. H., & Kallman, T. R. 1983, ApJ, 267, 610
- Latif et al. (2015) Latif, M. A., Bovino, S., Grassi, T., Schleicher, D. R. G., & Spaans, M. 2015, MNRAS, 446, 3163
- Laviolette (1987) Laviolette, P. A. 1987, Earth Moon and Planets, 37, 241
- Lepp & Dalgarno (1996) Lepp, S., & Dalgarno, A. 1996, A&A, 306, L21
- Lingam et al. (2019) Lingam, M., Ginsburg, I., & Bialy, S. 2019, ApJ, 877, 62
- Liu et al. (2016) Liu, J. Y., Qiao, E. L., & Liu, B. F. 2016, ApJ, 833, 35
- Maloney et al. (1996) Maloney, P. R., Hollenbach, D. J., & Tielens, A. G. G. M. 1996, ApJ, 466, 561
- Martín et al. (2015) Martín, S., Kohno, K., Izumi, T., et al. 2015, A&A, 573, A116
- McMillan (2017) McMillan, P. J. 2017, MNRAS, 465, 76
- Meijerink & Spaans (2005) Meijerink, R., & Spaans, M. 2005, A&A, 436, 397
- Meijerink et al. (2007) Meijerink, R., Spaans, M., & Israel, F. P. 2007, A&A, 461, 793
- Mezger et al. (1996) Mezger, P. G., Duschl, W. J., & Zylka, R. 1996, A&A Rev., 7, 289
- Nakajima et al. (2015) Nakajima, T., Takano, S., Kohno, K., et al. 2015, PASJ, 67, 8
- Nayakshin & Cuadra (2005) Nayakshin, S., & Cuadra, J. 2005, A&A, 437, 437
- Quan & Herbst (2007) Quan, D., & Herbst, E. 2007, A&A, 474, 521
- Shankar et al. (2009) Shankar, F., Weinberg, D. H., & Miralda-Escudé, J. 2009, ApJ, 690, 20
- Shull & van Steenberg (1985) Shull, J. M., & van Steenberg, M. E. 1985, ApJ, 298, 268
- Snell et al. (2000) Snell, R. L., Howe, J. E., Ashby, M. L. N., et al. 2000, ApJ, 539, L101
- Soltan (1982) Soltan, A. 1982, MNRAS, 200, 115
- Stäuber et al. (2005) Stäuber, P., Doty, S. D., van Dishoeck, E. F., & Benz, A. O. 2005, A&A, 440, 949
- Su et al. (2010) Su, M., Slatyer, T. R., & Finkbeiner, D. P. 2010, ApJ, 724, 1044
- Takano et al. (2014) Takano, S., Nakajima, T., Kohno, K., et al. 2014, PASJ, 66, 75
- Tielens (2010) Tielens, A. G. G. M. 2010, The Physics and Chemistry of the Interstellar Medium, Cambridge, UK: Cambridge University Press
- Usero et al. (2004) Usero, A., García-Burillo, S., Fuente, A., Martín-Pintado, J., & Rodríguez-Fernández, N. J. 2004, A&A, 419, 897
- Verner et al. (1996) Verner, D. A., Ferland, G. J., Korista, K. T., & Yakovlev, D. G. 1996, ApJ, 465, 487
- Visser et al. (2011) Visser, R., Doty, S. D., & van Dishoeck, E. F. 2011, A&A, 534, A132
- Viti et al. (2014) Viti, S., García-Burillo, S., Fuente, A., et al. 2014, A&A, 570, A28
- Volonteri (2010) Volonteri, M. 2010, A&A Rev., 18, 279
- Wakelam & Herbst (2008) Wakelam, V., & Herbst, E. 2008, ApJ, 680, 371
- Wakelam et al. (2010) Wakelam, V., Smith, I. W. M., Herbst, E., et al. 2010, Space Sci. Rev., 156, 13
- Weingartner & Draine (2001) Weingartner, J. C., & Draine, B. T. 2001, ApJS, 134, 263
- Weingartner et al. (2006) Weingartner, J. C., Draine, B. T., & Barr, D. K. 2006, ApJ, 645, 1188
- Wisłocka et al. (2019) Wisłocka, A. M., Kovačević, A. B., & Balbi, A. 2019, A&A, 624, A71