A Novel Survey for Young Substellar Objects with the W-band filter II. The Coolest and Lowest Mass Members of the Serpens-South Star-forming Region
Abstract
Given its relative proximity (430 pc), compact size ( 20′), young age ( 0.5 Myr) and rich number of young stellar objects, the Serpens-South star forming region is a promising site for studying young sub-stellar objects, yet the low-mass members of this region remain largely undiscovered. In this paper we report on a deep photometric survey using a custom 1.45 m filter (-band), as well as standard and near-IR filters, in order to identify candidate low-mass young brown-dwarfs in the Serpens-South region. We constructed a reddening-insensitive index () by combining , and -band photometry for survey objects, in order to identify candidate low-mass members of Serpens based on the strength of the water absorption feature at 1.45 m in the atmospheres of mid-M and later objects. We then conducted spectroscopic follow up to confirm youth and spectral type for our candidates. This is the first survey to identify the very low-mass and coolest members of Serpens-South. We identify 4 low-mass candidate Serpens members, which all display IR excess emission, indicating the likely presence of circumstellar disks around them. One of the four candidate low-mass members in our list, SERP182918-020245, exhibits and emission features, confirming its youth and ongoing magnetospheric accretion. Our new candidate members have spectral types M4 and are the coolest and lowest mass candidate members yet identified in Serpens-South.
1 Introduction
Around a dozen young, giant exoplanets have been imaged to date, with estimated masses of 5-13 MJup and ages less than 100 Myr (Bowler, 2016). These objects require extremely high contrasts to image and are difficult to characterize, given their proximity to bright host stars. Since substellar objects are significantly brighter and warmer at very young ages, i.e., less than 10 Myr (Chabrier et al., 2000), the detection of free-floating sources with a few Jupiter masses is possible by exploring nearby star-forming regions (Oasa et al. 1999; Lucas & Roche 2000). These objects are key analogues to directly imaged exoplanets and can be studied in detail, as they are not obscured by a nearby bright star. They offer the chance to study planetary mass objects in the moments of their formation, critically constraining possible formation mechanisms. Detecting and characterizing substellar and planetary mass objects in these regions not only helps to characterize the atmospheric properties of these objects, but tests substellar evolutionary models at the youngest ages.
Detecting a statistically-significant population of substellar and planetary mass objects in young star-forming regions also critically constrains the initial mass function (IMF), the distribution of stellar mass in a star forming event. The IMF is mainly determined by the star formation process itself. Constructing and characterizing the complete sample of substellar members in various star forming regions is fundamental to understand the role of environment in their formation and evolutionary processes (i.e., minimum mass, disk evolution etc). Hence by estimating the form of the IMF of a given event, theories of the star formation can be tested. Various theories predict a large range for the minimum masses of the IMF ( 1-100 MJup, Low & Lynden-Bell 1976; Larson 1992; Whitworth et al. 2007, references therein) and this topic has been highly debated over the last several decades.
There have been numerous attempts in the past to detect and characterize the substellar and planetary-mass object in nearby star forming regions at distances of 100–400 pc. These searches are mainly based on optical-infrared photometry and astrometry using wide-field surveys such as PanSTARRS1, SDSS, 2MASS, UKIDSS, Spitzer Space Telescope, WISE and GAIA (Cutri et al. 2003; Lucas et al. 2008). Follow-up spectroscopic observations in optical-IR are used to constrain the physical parameters of the candidate low-mass objects. Taurus, Perseus, IC 348, NGC 1333, and Upper-Scorpius are some of the nearby star forming regions which have been extensively surveyed by many authors down to a few Jupiter masses (e.g. Kraus et al. 2017; Esplin & Luhman 2017; Best et al. 2017; Lodieu et al. 2017; Zhang et al. 2018, many more).
The Serpens Molecular Cloud is one of the most active sites of ongoing star formation within 500 pc (see Herczeg et al. 2019; Eiroa et al. 2008 and references therein). The Serpens-South protocluster is located at the center of a well-defined filamentary cloud and is a part of the larger Serpens-Aquila rift molecular cloud complex (Bontemps et al. 2010; Gutermuth et al. 2008; André et al. 2010). Given its relative proximity ( pc, Ortiz-León et al. 2017, see also analysis of Gaia DR2 by Ortiz-León et al. 2018 and Herczeg et al. 2019), compact size ( 20′), young age ( 0.5 Myr) and rich population of young stellar objects (protostellar fraction 80-90%, Gutermuth et al. (2008)), the Serpens-South star forming region is a promising site for studying young sub-stellar objects. Since its discovery, Serpens-South has become the center of a wide range of observational analysis including near, mid, far-infrared and X-ray mappings with Spitzer,Herschel and Chandra that trace heated dust around protostars (Gutermuth et al. 2008; Bontemps et al. 2010; Povich et al. 2013; Dunham et al. 2015; Getman et al. 2017), millimeter mappings revealing cold dust (Maury et al., 2011), near-infrared polarimetry revealing the importance of global magnetic fields in the cluster formation history (Sugitani et al., 2011), molecular outflows studies (e.g., Nakamura et al. 2011; Teixeira et al. 2012; Plunkett et al. 2015a, b), and a wealth of spectral line surveys probing filamentary infall (e.g., Friesen et al. 2013; Kirk et al. 2013; Tanaka et al. 2013; Fernández-López et al. 2014; Nakamura et al. 2014).
In spite of the wealth of optical, infrared and submillimeter surveys currently available towards Serpens-South, there have been no dedicated searches reported in the literature towards its very low-mass members. The latest search for low-mass members of the region by Winston et al. (2018) using Chandra, 2MASS and Spitzer photometry identifies 66 young stellar objects for which the detection limit hardly reaches down to 0.1 M⊙ (see Fig. 2), implying that a large fraction of sub-stellar objects are still undetected in this region.
Canonical approaches to sub-stellar studies rely on photometric identification followed by spectroscopic confirmation. However, because of the non-uniform reddening of the medium ( 5-75 mag, Povich et al. (2013)), the low-mass members are difficult to distinguish from reddened background stars using traditional photometric methods. Also, optical/NIR spectroscopy is time consuming for very faint, highly extincted star forming regions such as Serpens-South. An efficient manner of searching for these young low-mass objects is to identify them via unique spectral features, in particular the 1.45 m H2O absorption band seen in the spectra of M-L-T-Y type objects. Photometry with a narrow band filter centered on the deep H2O absorption feature seen at 1.45 m in the spectra of young brown dwarfs (Late M and L type spectral types) can break the degeneracy in colors between the young brown dwarfs and reddened background stars, which have no detectable water absorption. We can combine 1.45 m imaging with and photometry to robustly estimate spectral types independent of reddening (Allers & Liu, submitted).
In this paper we report on a deep photometric survey using the 1.45 m (-band), and -bands in order to identify candidate young brown dwarfs and very low mass stars in the Serpens-South region, as well as spectroscopic follow up and confirmation of these candidates. This is the first survey to identify the very low-mass and coolest members of Serpens-South. Of the 69 candidate low-mass objects selected based on 1.45 m, and -band photometry, we obtained spectra for 7 targets. Four targets are confirmed as spectral type M4 objects hosting circumstellar disks. These objects are indeed the coolest and lowest mass members yet detected in Serpens-South star forming region.
2 OBSERVATIONS AND DATA ANALYSIS
2.1 CFHT-WIRCam , and -band data sets
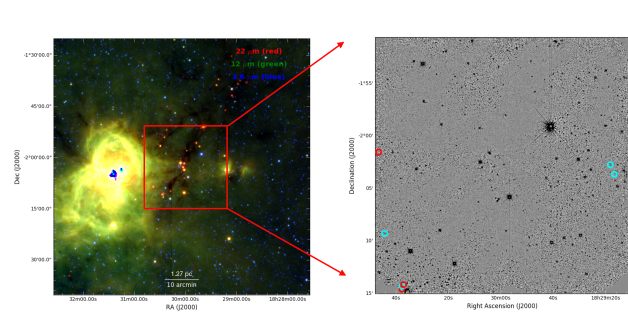
Over the last 5 years, our team has conducted a large observing program to detect and characterize the low-mass young stellar population of nearby star forming regions using the Wide Field IR Camera (WIRCam, Puget et al., 2004) at the Canada France Hawaii Telescope (CFHT) with a custom-built medium-width (6%) filter centered on a water-absorption feature at 1.45m (henceforth the -band filter). In this paper we report the results of observations on 2016 July 14-15 of the Serpens-South region using the -band filter along with the broad band WIRCam and filters. WIRCam has a field-of-view of 20′ 20′ with a sampling of 0.3 arcsecond per pixel. A single WIRCam pointing centered at RA = 18h30m03s and Dec = -02d01m58s was sufficient to cover the Serpens-South cluster. We used a 21-point dithering pattern to fill the gaps between the four detectors of WIRCam and to accurately subtract the sky background. The total integration time for , and -band filters were 1890, 1920, and 12285s, respectively. Pre-processing of the images were performed for dark frame subtraction, flat fielding, sky subtraction, bad pixel masking and astrometric calibration. After combining the individual exposures into final stacked images in each filter, the source extraction and photometry were performed by using SExtractor (Bertin & Arnouts, 1996). In order to avoid artifacts and false detections, we selected only those sources having S/N 10. Absolute photometric calibration in and bands was performed using data from the 2MASS point source catalog (Skrutskie et al., 2006). To calibrate our -band photometry, we first create a catalog of available photometry for objects in our field from the , , , , , , and catalogs. For any object in our field having available near-IR and additional (shorter or longer wavelength) broad-band photometry, we determine a best-fit, reddened template spectrum from the SpeX Spectral Library (Rayner et al., 2009; Cushing et al., 2005). We first scale the synthetic and observed photometry of the templates to match the observed and -band magnitudes and then determine the closest matching reddened template to all photometry. We then adopt a likely -band magnitude for the object in our field as the synthetic, scaled -band photometry of the best-fit template. By comparing each object’s likely -band flux (based on template fitting) to the measured flux in the CFHT -filter frame, we calculate a likely -filter zero point. We then use the median of these likely photometric zero points to calculate -band magnitudes for all of the objects in the field. The median absolute deviation of the 1033 predicted photometric zero points for our field is 0.08 mag, and the standard deviation of the mean is a mere 0.004 mag. The final catalog after combining the photometry from , and bands include photometry for 15277 sources, within an uncertainty limit of 0.1 mag.
2.2 Selection of candidate low-mass objects
To distinguish young brown dwarfs and planetary mass objects from reddened background objects, which plague surveys based on broad-band colors alone, we followed the approach of Allers & Liu (submitted) and constructed a reddening-insensitive index () by combining , and -band photometry for survey objects:
| (1) |
where the constant is expressed in terms of extinction values in each of the three bands:
| (2) |
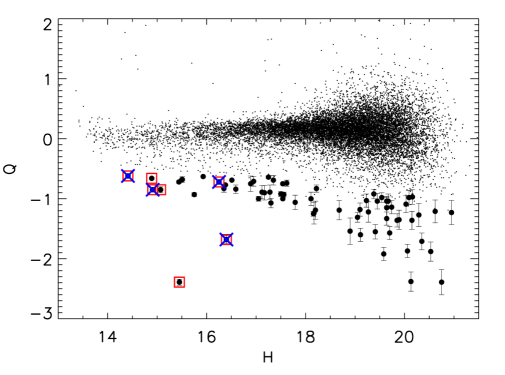
Based on synthetic photometry using a M0 spectrum from Kirkpatrick et al. (2010), we adopt e = 1.85, the appropriate value for an M0 star reddened by AV = 10 for RV = 3.1 (Allers & Liu, submitted). Our typical contaminant is a reddened background M0 star, which should have due to a lack of steam absorption in their spectra. As expected, the majority of objects detected in our field have a Q-value of 0 (Figure 3). Later spectral type objects with deepening water absorption features will have progressively more negative values of Q.
Based on synthesized , and -band photometry of young objects (Allers & Liu 2013; Muench et al. 2007, Allers & Liu, submitted) and field dwarfs (Cushing et al., 2005), low mass stars and brown dwarfs with spectral types later than M6 have values -0.6, whereas earlier spectral type contaminants will have values -0.6. The uncertainty on , is estimated from propagating the errors from partial derivatives of as a function of , and :
| (3) |
where , , and are the uncertainties on the , , and -band photometry respectively.
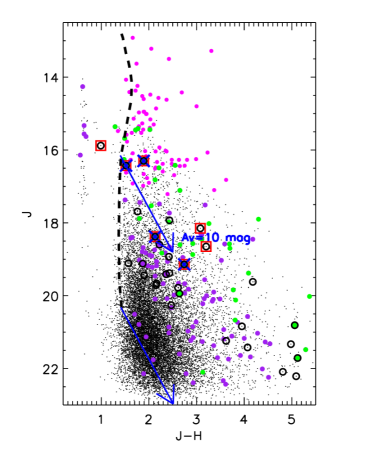
To select high-confidence candidate low mass Serpens-South members, we considered as candidates those targets with either 18 mag, Q -( 0.6 + ) or 18 mag, Q -( 0.6 + 3 ). As photometric errors are significantly larger for fainter objects (as well as the pool of reddened background stars that might act as contaminants), we applied a more stringent cut for objects with 18 mag. Thus we obtained 69 candidate low-mass objects that satisfy the above criteria. Of these, 31 sources are brighter than 18 mag in -band and have photometric uncertainties 0.1 mag in all three bands. Fig. 2 shows the vs. distribution of all the sources detected with CFHT along with the 31 low-mass candidates satisfying the above selection criteria (i.e, 18 mag and Q -( 0.6 + )). Fig. 3 shows the value distribution of above selected 69 sources with respect to -magnitude.
2.3 Follow-up spectroscopic Observations
| ID | Name | Exp. Time(s) | ||
|---|---|---|---|---|
| deg | deg | |||
| 1 | SERP183038-021437 | 277.657049 | -2.243708 | 4 180 |
| 2 | SERP183038-021419 | 277.656886 | -2.238678 | 8 180 |
| 3 | SERP183037-021411 | 277.654565 | -2.236360 | 6 120 |
| 4 | SERP183044-020918 | 277.684766 | -2.155125 | 8 90 |
| 5 | SERP182917-020340 | 277.319337 | -2.061048 | 4 180 |
| 6 | SERP182918-020245 | 277.325600 | -2.045856 | 12 180 |
| 7 | SERP183047-020133 | 277.694347 | -2.025817 | 4 90 |
We performed follow-up spectroscopic observations of 7 bright targets from the list of low-mass candidates using ARCoIRIS on the 4 m Blanco telescope at CTIO on the nights of 2016 August 19 and 2016 August 22. The spectra cover a wavelength range of 0.8 - 2.47 m at a spectral resolution of R=3500. We used a standard ABBA nodding sequence along the slit to record object and sky spectra. The log of spectroscopic observations is given in Table 1. Flat-field and argon lamps were taken immediately after each sets of target. For each target we observed a nearby A0V star for telluric correction and flux calibration.
All reductions of the data taken with ARCoIRIS were carried out with a modified version of the SPEXTOOL package version 4.1 (Vacca et al. 2003; Cushing et al. 2004; Kirkpatrick et al. 2011). The individual extracted and wavelength-calibrated spectra from a given sequence of observations, each with their own A0 standard, were then scaled to a common median flux and were median combined using in SPEXTOOL. The combined spectra were corrected for telluric absorption and were flux-calibrated using the respective telluric standards with . All calibrated sets of observations of a given object were then median-combined to produce the final spectrum. Normalized, smoothed spectra, offset by a constant, for the 7 brighter targets in our list is shown in Fig. 4.

2.4 Multi-band data from other catalogs
| ID | Name | [1.45] | Q | ||||||||||||||
|---|---|---|---|---|---|---|---|---|---|---|---|---|---|---|---|---|---|
| 1 | SERP183038-021437 | 17.410.01 | 18.650.04 | 15.450.01 | -2.39 0.05 | ||||||||||||
| 2 | SERP183038-021419 | 17.9540.01 | 19.140.04 | 16.400.01 | -1.68 0.07 | ||||||||||||
| 3 | SERP183037-021411 | 16.450.01 | 18.150.03 | 15.070.01 | -0.85 0.05 | ||||||||||||
| 4 | SERP183044-020918 | 15.290.01 | 16.300.01 | 14.410.01 | -0.62 0.01 | ||||||||||||
| 5 | SERP182917-020340 | 17.250.01 | 18.380.01 | 16.250.01 | -0.72 0.02 | ||||||||||||
| 6 | SERP182918-020245 | 15.740.01 | 16.430.01 | 14.910.01 | -0.85 0.01 | ||||||||||||
| 7 | SERP183047-020133 | 15.470.01 | 15.880.01 | 14.890.01 | -0.66 0.01 |
| ID | Name | W1 | W2 | W3 | W4 | ||||||
|---|---|---|---|---|---|---|---|---|---|---|---|
| 1 | SERP183038-021437 | 12.907 | 13.137 | 12.180 | 11.770 | 9.249 | 7.994 | 11.93 | 11.80 | 11.59 | 11.72 |
| 2 | SERP183038-021419 | 13.910 | 14.201 | 12.830 | 11.765 | 9.529 | 7.325 | 12.04 | 11.31 | 10.79 | 10.35 |
| 3 | SERP183037-021411 | 13.186 | 13.218 | 12.580 | 12.271 | 9.939 | 7.416 | 12.25 | 12.10 | 11.91 | 12.02 |
| 4 | SERP183044-020918 | 13.156 | 13.049 | 12.200 | 11.331 | 7.464 | 4.237 | 11.94 | 11.46 | 11.01 | 10.53 |
| 5 | SERP182917-020340 | 14.643 | 12.87 | 11.90 | 11.19 | 10.44 | |||||
| 6 | SERP182918-020245 | 14.167 | 13.943 | 12.394 | 11.838 | 8.781 | 6.252 | 13.05 | 12.36 | 12.23 | 11.33 |
| 7 | SERP183047-020133 | 14.499 | 14.438 | 14.094 | 13.419 | 7.882 | 5.262 | 14.24 | 14.05 |
We identified all matches for the 7 bright targets followed up spectroscopically from the 2MASS (Cutri et al., 2003), UKIDSS (Lucas et al., 2008), Spizer and WISE catalogs. Several of our objects are too faint to have reliable 2MASS and -band photometry, thus we report only 2MASS magnitudes here. Only -band data is available in the UKIDSS catalog. Spitzer-IRAC four-band data is obtained from Kuhn et al. (2013). The WISE photometry at 3.4 (W1), 4.5 (W2), 12 (W3), and 22 m (W4) bands are obtained from the All-WISE Source Catalog (Cutri & et al., 2013). Our CFHT , , and -band photometry for the 7 targets is given in Table 2 and literature near-infrared and mid-infrared photometry from various catalogs is presented in Table 3.
3 Results and Discussion
3.1 Dereddening and spectral type estimates
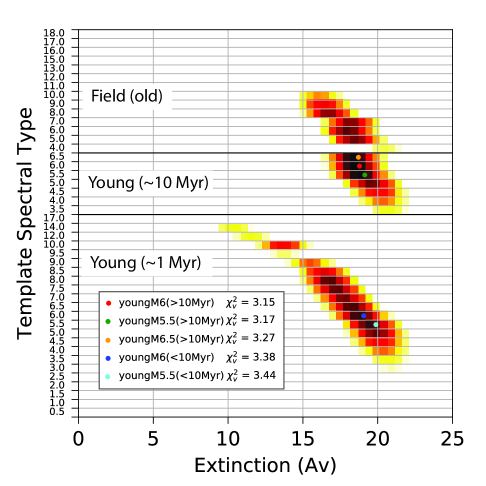
We estimate spectral types for our candidates by fitting them with ultra-cool young spectral standards from Luhman et al. (2017), as well as old, field spectral standards taken from the SpeX prism library, taking , spectral type, and age as free parameters (by utilizing separate sets of young vs. old spectral standards). Our objective is to provide a classification based on the pseudo-continuum shape rather than the individual atomic and molecular features. We calculate reduced goodness of fit values for a grid of standards at 3 ages: 1 Myr young spectral standards, somewhat older 10 Myr spectral standards, and old field spectral standards. Along this grid, spectral type ranged from M0 to L6 and we reddened templates to values ranging from 0 to 30, using the reddening law from Cardelli et al. (1989). These fits are calculated within the 1.4 - 1.8 m (-band) and 1.90 - 2.30 m (-band) spectral windows, avoiding the noisy 1.8-1.9 m range between - and - band. The J-band window is excluded from the fit because the S/N is usually low because of high extinction. To obtain a range of best matching templates and corresponding spectral types and extinction, we use maps, an example of which is shown in Figure 5, for SERP183038-021419. To generate these, a reduced value is calculated for each grid point, and then converted to a normalised probability (taking the prior that the true spectral type and lie within the ranges for these parameters that we have considered). We used the resulting maps to identify the areas of parameter space with the highest probability, and used the extent of these areas to estimate errors in spectral type and . In Figure 5, regions on the map shown in darker colors delineate the best fitting combinations of spectral type and . For this particular example, the 5 best-fitting models have spectral types of M5.5-M6.5, ages 10 Myr, and values of 17-19. However, models with spectral types between M4-M7, ages 10 Myr, and values of 17-22 provide comparably good fits, with significant degeneracy between spectral type and , hence we conservatively adopt this range of spectral types and for this object.
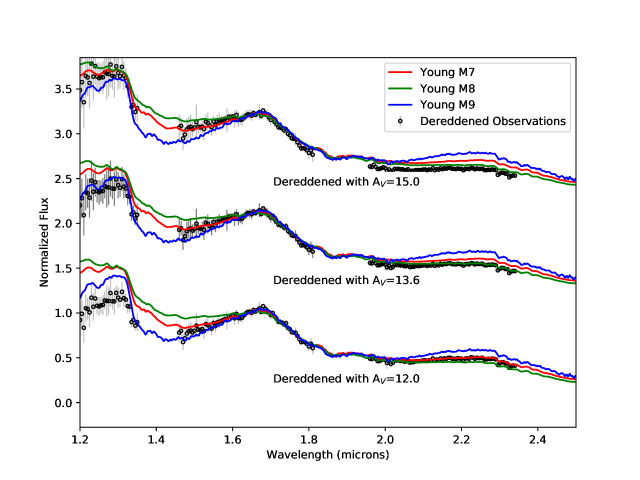
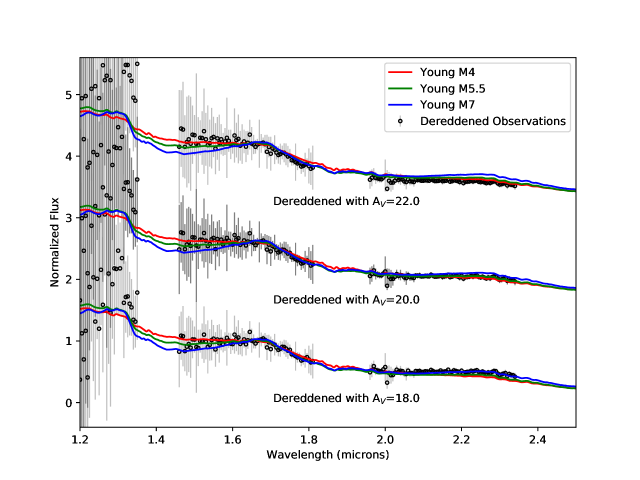
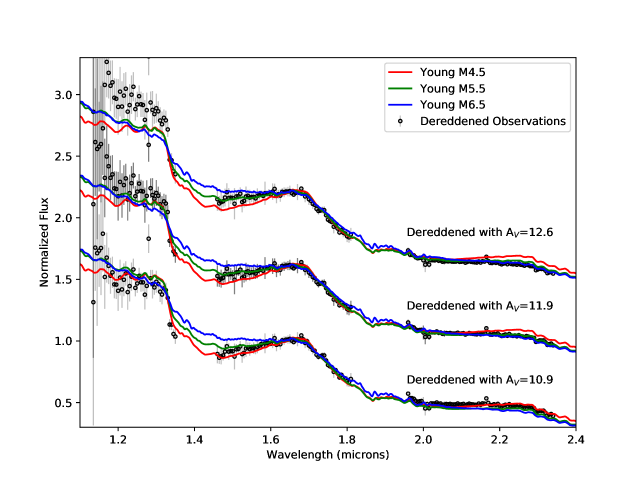
For late M and L type objects, we can distinguish between old and young objects (10 Myr) via the distinctive peaky H-band feature seen in low-surface gravity objects and the shape of the K band continuum (Lucas et al., 2001; Allers et al., 2007; Rice et al., 2010; Allers & Liu, 2013; Liu et al., 2013; Schneider et al., 2014; Gagné et al., 2014; Esplin & Luhman, 2017), however, our ArcoIRIS spectra do not have the requisite resolution to reveal other spectral indicators of low surface gravity. No clear spectral indicators distinguishing young and old M0-M4 objects are available in our spectra. Of the 7 candidate low-mass objects, four are in the spectral range M4-M9, with the latest one being an M7-M9 type, and three are likely early M type (M4) contaminants. Additionally, the four targets with spectral types , SERP183044-020918, SERP182918-020245, SERP183038-021419 and SERP182917-020340 are listed as young stellar objects in the MYStIX IR-Excess Source catalog by Povich et al. (2013), SFiNCs Xray-Infrared catalog by Getman et al. (2017) as well as in Gould Belt Survey by Dunham et al. (2015). Evidence of IR excess emission from these various catalogs confirm the youth and likely membership of our candidate low mass targets in Serpens-South. The remaining three sources do not appear in any of the above catalogs. While we cannot robustly determine age for M4 objects, given the high frequency of field early M dwarfs and lack of other evidence of youth, we do not assign Serpens membership to them. They are most likely field-age foreground objects. Figs. 6 to 9 show the normalized, dereddened spectra of four low-mass, young member candidates (see below) of Serpens-South along with their best matching standard star spectra for three sub-classes and their respective best fit values. The best fitting spectral types and extinction ranges for our four new candidate Serpens South members are listed in Table 4. Our spectral type classifications have an average uncertainty of 1-3 sub-classes.
Given the high extinction of these new cool dwarfs in Serpens-South, we also implemented spectral fitting using various other extinction laws in the literature such as Fitzpatrick 1999; Fitzpatrick & Massa 2007 and also a steeper power law with alpha=-2.1 (Stead & Hoare, 2009), to determine if choice of extinction law affects our spectral fitting results. However, these various extinction laws did not change much our recovered spectral types or best-fit values. The alpha=-2.1 law produced a 0.5 sub-type shift to later spectral type for all targets.
Our initial confirmation rate for -index selected objects in Serpens-South stands at 4 out of 7 candidates, however, all three early M contaminants lie extremely close to the edge of one of the four WIRCAM array detectors; upon re-examination of the filter images, it became clear that the Q values calculated for these objects are spuriously low due to cosmetic issues at the edge of the detector. For further spectroscopic followup (as described in Dubber et al. in prep), we have avoided following up similar spurious detections at the edge of the detector.
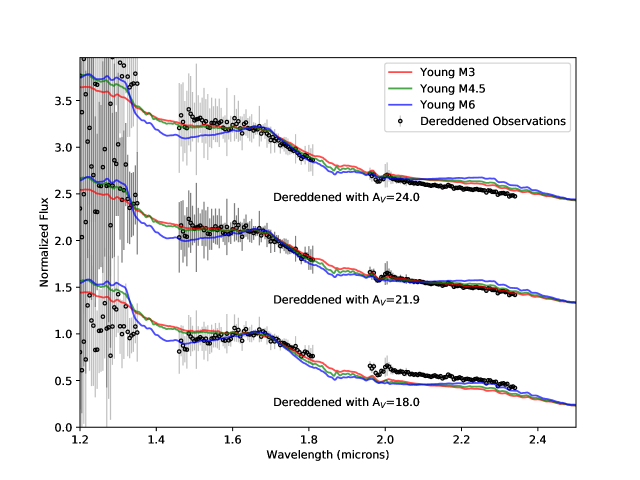
. The grey error bars show the 1-sigma uncertainty of the binned data.
. The grey error bars show the 1-sigma uncertainty of the binned data.
3.2 New candidate low-mass, young members of Serpens-South
The spectra of young objects later than M5 show a characteristic triangular peak in the H-band (Cushing et al., 2005). Of the seven dereddened spectra of candidate low-mass objects, the H-band pseudo-continuum of SERP183044-020918, SERP182917-020340 and SERP182918-020245 have a definitely peaked shape, and SERP183038-021419 shows hints of a possibly peaky H-band (see Figs. 6 to 9). This feature, where the H-band is dominated by strong water absorption bands to either side of the sharp peak located between 1.68 and 1.70 m, was first reported by Lucas et al. (2001) for very young ( 1 Myr), cool objects in the Trapezium in Orion. The triangular shaped peak is ascribed to the effects of low pressure and low gravity atmospheres typical of self-gravitational collapsing objects with 2700 K and is a consistent signature of youth (e.g., Allers et al. 2007; Rice et al. 2010; Allers & Liu 2013; Liu et al. 2013; Schneider et al. 2014; Gagné et al. 2014; Esplin & Luhman 2017). The triangular shaped H-band continuum of these four objects confirms that they are young and likely members of the Serpens-South star forming region.
3.3 New members with circumstellar disks
Serpens-South is known to have a high fraction of young stellar objects hosting circumstellar disks (Gutermuth et al. 2008; Dunham et al. 2015). The mid-IR photometry from Spitzer and WISE can be used to identify the presence of circumstellar disks around low-mass young objects (Luhman & Muench 2008; Luhman et al. 2008).
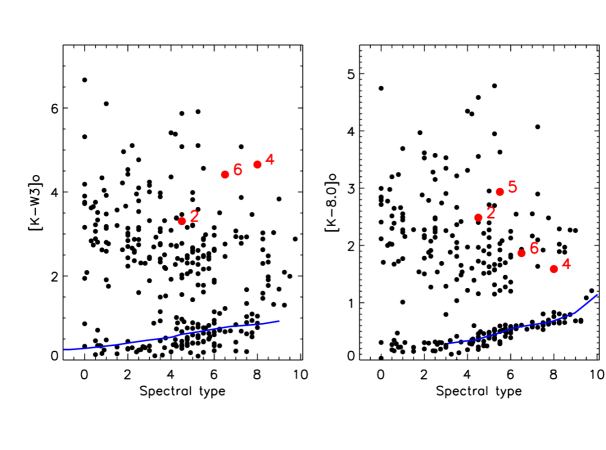
To determine whether the four candidate low-mass members of Serpens-South have color excesses from disks in the Spitzer and WISE photometry, we compared their dereddened , , and colors with the typical photospheric colors of young stellar objects given in Luhman et al. (2010) and Esplin & Luhman (2017). The reddening of these targets are obtained from the spectral fitting procedure described in section 3.1. Though the presence of disks can artificially redden the stars, we ignore this factor as it is beyond the scope of this paper. In figure 10 we compare the and colors of the low-mass members of Taurus (Luhman et al., 2017; Esplin et al., 2014) with the new members identified in Serpens-South. The dereddened colors of the low-mass candidates have a 1-2 mag excess above their typical photospheric colors given in Esplin & Luhman (2017). Similarly, the dereddened colors in [3.6 - 5.8] and [3.6 - 8.0] are significantly redder than their corresponding photospheric sequence (Esplin & Luhman, 2017) for the above four low-mass targets. The sizes of the excesses of these targets are similar to those of members of Cha I (Luhman & Muench 2008; Luhman et al. 2008) and Taurus (Esplin et al., 2014) with disks, and hence the reddened colors of four late type Serpens-South members indicate that they are likely to host disks.
The presence of circumstellar disks provides additional evidence of the youth and membership of those objects. Additionally, the above four targets, ie., SERP183044-020918, SERP182918-020245, SERP183038-021419 and SERP182917-020340 are listed as young stellar objects in the SFiNCs Xray-Infrared catalog by Getman et al. (2017) as well as in Gould Belt Survey by Dunham et al. (2015). The IR excess confirm the youth and likely membership of these candidate low mass targets in Serpens-South.
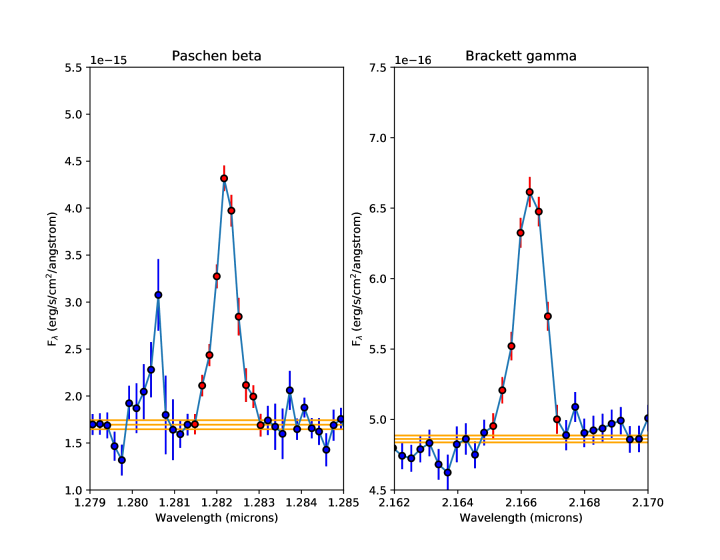
3.4 Ongoing accretion in SERP182918-020245
Magnetospheric accretion in young stellar objects produces emission lines that span from UV to IR wavelengths. These emission lines can be used to obtain an estimate of the accretion luminosity, and are also signatures of the chromospheric activity of the star. In the near-IR regime, at =1.2818 m and at 2.16 m are the major emission lines present. One of the four candidate low-mass members in our list, SERP182918-020245, exhibits and emissions (see Fig. 11) which confirms its youth and association with Serpens-South. The fluxes of the and emission lines are computed by directly integrating the flux within the Gaussian curve along these lines. We used the flux calibrated, extinction-corrected spectra for this analysis. The line luminosities of these two emission lines are computed using the relation = 4 , (Alcalá et al., 2014), where, is the distance to the target, i.e., 4369.2 pc and is the extinction corrected flux. Taking into account the range of values producing acceptable spectral fits and again adopting the Cardelli et al. (1989) reddening law, we find extinction corrected fluxes of 1.64 10-14 ergs s-1 cm-2 and 2.00 10-15 ergs s-1 cm-2 respectively for the and emission lines. We calculate the accretion luminosity of SERP182918-020245 using the versus relationships for the and emission lines given in Alcalá et al. (2014). The estimated values from these two lines are -1.720.53 and -2.110.52 respectively.
3.5 Physical parameters of the low-mass objects

In order to estimate the physical parameters of the candidate low-mass members identified in Serpens-South, we used the apparent magnitudes listed in Table 2. For bolometric corrections in and - bands, we used the values derived by Herczeg & Hillenbrand (2015) and Filippazzo et al. (2015) for young M type objects. We adopted the latest estimate on distance to the Serpens star forming region i.e., 436 9.2 pc (see section 1), which corresponds to a distance modulus of 8.2 0.04 mag. Using the extinction values in -band obtained from the best fitting template spectral types (see section 3.1) and adopting the reddening law from Cardelli et al. (1989) (ie., / = 0.282 and / = 0.112), the apparent magnitudes are corrected for reddening. For the Sun, we adopted = 4.73 mag. The luminosities thus calculated from or -band magnitudes for the four candidate low-mass objects are given in Table 4. The uncertainty in luminosity is estimated from the quadratic sum of fractional errors in distance, photometry, extinction and bolometric correction. The final uncertainty in each target is dominated by the error associated with the extinction measurement, which is relatively high towards Serpens-South (See Table 4). The corresponding effective temperature for each spectral range is obtained from Herczeg & Hillenbrand (2014). Assuming an age of 0.5 Myr for Serpens-South (Gutermuth et al., 2008), the luminosities are then compared to the 0.5 Myr isochrone from Baraffe et al. (2015) to estimate the masses of the targets. Fig. 12 shows the HR-diagram of the four low-mass members along with the isochrones and evolutionary tracks from Baraffe et al. (2015).
Two of the four low-mass targets (specifically ID numbers 4 and 6) shown in Fig. 12 appear significantly brighter than expected from evolutionary model predictions for 0.5 Myr objects. Similar trends have been observed in other star forming regions such as Taurus, Ophiuchus, Chamaeleon etc. (eg. Zhang et al. 2018; Ribas et al. 2017; Mužić et al. 2013; Herczeg & Hillenbrand 2015). However, the masses and luminosities inferred for 1 Myr objects are very uncertain and strongly model dependent. The initial radius of a young object at its birth location depends on the initial entropy and the entropy gained and lost during the main accretion phase (Stahler, 1983; Hartmann et al., 1997; Hosokawa et al., 2011). Thus, the early accretion history of young low-mass stars and brown dwarfs will affect the physical properties of objects (luminosity, radius, effective temperature etc.) in star forming regions and young clusters (although the effect of this accretion history will become negligible by ages 10 Myr). This accretion history, however, is generally not well-known for any given object, and can vary significantly from object to object in a given region. Modelling by Baraffe et al. (2017) demonstrates that accretion history produces a significant spread in luminosity on HR diagrams for a coeval population of young low-mass stars and brown dwarfs. The location of our new candidate Serpens members above the 0.5 Myr isochrone suggests that they were born with higher entropy (and thus a larger initial radius) than predicted from standard models of evolution, which do not take into account the individualized accretion history of any given object (Baraffe et al., 2015). Binarity could also be a reason for their higher luminosity beyond the model isochrones. Nonetheless, targets 2 and 5 have effective temperatures consistent with low-mass stars of mass 0.1 whereas targets 4 and 6 have effective temperatures consistent with substellar objects with mass 0.08-0.05 . These are the coolest and lowest mass members of Serpens-South star forming complex identified so far.
| ID | Name | Spectral type | Av | 111Bolometric correction from Herczeg & Hillenbrand (2015) | 222Bolometric correction from Filippazzo et al. (2015) | log | |
|---|---|---|---|---|---|---|---|
| mag | mag | mag | (K) | ||||
| 2 | SERP183038-021419 | M3-M6 | 18-24 | 1.84-2.03 | -0.890.34 | 3135275 | |
| 4 | SERP183044-020918 | M7-M9 | 12-15 | 3.070.13 | -0.67 0.09 | 2670100 | |
| 5 | SERP182917-020340 | M4-M7 | 17-22 | 1.93-2.06 | -0.780.28 | 2980210 | |
| 6 | SERP182918-020245 | M5-M8 | 10-13 | 1.99-2.06 | -0.910.17 | 2825155 |
4 Discussion
Serpens-South is a highly extincted and extremely dense region, lying right along the Galactic plane. It is an extremely challenging site to study due to the high number of reddened background contaminants with which we must contend. The W-band technique has enabled us to overcome these limitations and discover the first likely substellar members of this cluster, but the extreme extinction along this line of sight pushes the W-band technique to its limits. As noted previously, the major uncertainty driving the error in our spectral types is from the fit to AV – quite a wide range of AV values fit well. The index we have defined is also set to values appropriate for moderately extincted regions – specifically, we set the value of as appropriate for an M0 reddened with an of 10. In comparison, most of our candidate members have 15.
The Q-index that we have constructed is solely a measure of spectral type (based on the depth of water absorption features), not age – it will just as easily identify background or foreground late-M field stars as well. This renders spectroscopic followup imperative. Three out of four of our candidate new Serpens-South members show ”peaky” H band spectra, a clear indicator of the youth of these objects. All 4 candidate members have additional corroborating evidence of youth from color excesses indicating circumstellar disks. One additionally has clear accretion features in its spectrum. Thus, we are certain that our 4 candidate members are very young (2 Myr). Nonetheless, we cannot fully confirm them as members of Serpens-South. Full confirmation would require demonstrating that these candidates share common proper motions and radial velocities with Serpens-South stars (e.g. as done for closer and somewhat older moving group stars in Gagné et al., 2014). Unfortunately, at a distance of 400 parsec and with extreme extinction ranges the objects are too faint at optical wavelengths for Gaia astrometry.
5 Conclusions
Serpens-South is an active star forming complex in the solar neighborhood, yet the low-mass members of the region remain largely undiscovered, due to the high extinction towards this region. In this paper we present the preliminary results of our survey using the novel W-band filter at the WIRCam/CFHT and follow-up spectroscopic observations to identify and characterize the sub-stellar members of Serpens-South. Further spectroscopic followup of fainter candidates and a calculation of the IMF for Serpens-South will be presented in Dubber et al. in prep. After screening the probable low-mass candidates based on their W-band based Q-index, we obtained spectra for the 7 brightest targets among them. Of these, four are probable members of Serpens-South. Three of these objects have spectral types later than M4 spectral type and evidence of youth from peaky H-band pseudo-continuum spectral morphology. All four objects have IR excess emission, indicating the likely presence of circumstellar disks around them (Getman et al., 2017; Dunham et al., 2015). One of the four candidate low-mass members in our list, SERP182918-020245, exhibits and emission which confirms its youth and ongoing magnetospheric accretion. These are the coolest and lowest mass candidate members yet identified in Serpens-South.
References
- Alcalá et al. (2014) Alcalá, J. M., Natta, A., Manara, C. F., et al. 2014, A&A, 561, A2
- Allers & Liu (2013) Allers, K. N., & Liu, M. C. 2013, ApJ, 772, 79
- Allers et al. (2007) Allers, K. N., Jaffe, D. T., Luhman, K. L., et al. 2007, ApJ, 657, 511
- André et al. (2010) André, P., Men’shchikov, A., Bontemps, S., et al. 2010, A&A, 518, L102
- Baraffe et al. (2017) Baraffe, I., Elbakyan, V. G., Vorobyov, E. I., & Chabrier, G. 2017, A&A, 597, A19
- Baraffe et al. (2015) Baraffe, I., Homeier, D., Allard, F., & Chabrier, G. 2015, A&A, 577, A42
- Bertin & Arnouts (1996) Bertin, E., & Arnouts, S. 1996, A&AS, 117, 393
- Best et al. (2017) Best, W. M. J., Liu, M. C., Magnier, E. A., et al. 2017, ApJ, 837, 95
- Bontemps et al. (2010) Bontemps, S., André, P., Könyves, V., et al. 2010, A&A, 518, L85
- Bowler (2016) Bowler, B. P. 2016, PASP, 128, 102001
- Cardelli et al. (1989) Cardelli, J. A., Clayton, G. C., & Mathis, J. S. 1989, ApJ, 345, 245
- Chabrier et al. (2000) Chabrier, G., Baraffe, I., Allard, F., & Hauschildt, P. 2000, ApJ, 542, 464
- Cushing et al. (2005) Cushing, M. C., Rayner, J. T., & Vacca, W. D. 2005, ApJ, 623, 1115
- Cushing et al. (2004) Cushing, M. C., Vacca, W. D., & Rayner, J. T. 2004, PASP, 116, 362
- Cutri & et al. (2013) Cutri, R. M., & et al. 2013, VizieR Online Data Catalog, 2328
- Cutri et al. (2003) Cutri, R. M., Skrutskie, M. F., van Dyk, S., et al. 2003, VizieR Online Data Catalog, 2246
- Dunham et al. (2015) Dunham, M. M., Allen, L. E., Evans, II, N. J., et al. 2015, ApJS, 220, 11
- Eiroa et al. (2008) Eiroa, C., Djupvik, A. A., & Casali, M. M. 2008, The Serpens Molecular Cloud, ed. B. Reipurth, Vol. 5, 693
- Esplin & Luhman (2017) Esplin, T. L., & Luhman, K. L. 2017, AJ, 154, 134
- Esplin et al. (2014) Esplin, T. L., Luhman, K. L., & Mamajek, E. E. 2014, ApJ, 784, 126
- Fernández-López et al. (2014) Fernández-López, M., Arce, H. G., Looney, L., et al. 2014, ApJ, 790, L19
- Filippazzo et al. (2015) Filippazzo, J. C., Rice, E. L., Faherty, J., et al. 2015, ApJ, 810, 158
- Fitzpatrick (1999) Fitzpatrick, E. L. 1999, PASP, 111, 63
- Fitzpatrick & Massa (2007) Fitzpatrick, E. L., & Massa, D. 2007, ApJ, 663, 320
- Friesen et al. (2013) Friesen, R. K., Medeiros, L., Schnee, S., et al. 2013, MNRAS, 436, 1513
- Gagné et al. (2014) Gagné, J., Lafrenière, D., Doyon, R., Malo, L., & Artigau, É. 2014, ApJ, 783, 121
- Getman et al. (2017) Getman, K. V., Broos, P. S., Kuhn, M. A., et al. 2017, ApJS, 229, 28
- Gutermuth et al. (2008) Gutermuth, R. A., Bourke, T. L., Allen, L. E., et al. 2008, ApJ, 673, L151
- Hartmann et al. (1997) Hartmann, L., Cassen, P., & Kenyon, S. J. 1997, ApJ, 475, 770
- Herczeg & Hillenbrand (2014) Herczeg, G. J., & Hillenbrand, L. A. 2014, ApJ, 786, 97
- Herczeg & Hillenbrand (2015) —. 2015, ApJ, 808, 23
- Herczeg et al. (2019) Herczeg, G. J., Kuhn, M. A., Zhou, X., et al. 2019, arXiv e-prints, arXiv:1904.04085
- Hosokawa et al. (2011) Hosokawa, T., Offner, S. S. R., & Krumholz, M. R. 2011, ApJ, 738, 140
- Kirk et al. (2013) Kirk, H., Myers, P. C., Bourke, T. L., et al. 2013, ApJ, 766, 115
- Kirkpatrick et al. (2010) Kirkpatrick, J. D., Looper, D. L., Burgasser, A. J., et al. 2010, The Astrophysical Journal Supplement Series, 190, 100
- Kirkpatrick et al. (2011) Kirkpatrick, J. D., Cushing, M. C., Gelino, C. R., et al. 2011, ApJS, 197, 19
- Kraus et al. (2017) Kraus, A. L., Herczeg, G. J., Rizzuto, A. C., et al. 2017, ApJ, 838, 150
- Kuhn et al. (2013) Kuhn, M. A., Povich, M. S., Luhman, K. L., et al. 2013, ApJS, 209, 29
- Larson (1992) Larson, R. B. 1992, MNRAS, 256, 641
- Liu et al. (2013) Liu, M. C., Magnier, E. A., Deacon, N. R., et al. 2013, ApJ, 777, L20
- Lodieu et al. (2017) Lodieu, N., Espinoza Contreras, M., Zapatero Osorio, M. R., et al. 2017, A&A, 598, A92
- Low & Lynden-Bell (1976) Low, C., & Lynden-Bell, D. 1976, MNRAS, 176, 367
- Lucas & Roche (2000) Lucas, P. W., & Roche, P. F. 2000, MNRAS, 314, 858
- Lucas et al. (2001) Lucas, P. W., Roche, P. F., Allard, F., & Hauschildt, P. H. 2001, MNRAS, 326, 695
- Lucas et al. (2008) Lucas, P. W., Hoare, M. G., Longmore, A., et al. 2008, MNRAS, 391, 136
- Luhman et al. (2010) Luhman, K. L., Allen, P. R., Espaillat, C., Hartmann, L., & Calvet, N. 2010, ApJS, 186, 111
- Luhman et al. (2008) Luhman, K. L., Hernández, J., Downes, J. J., Hartmann, L., & Briceño, C. 2008, ApJ, 688, 362
- Luhman et al. (2017) Luhman, K. L., Mamajek, E. E., Shukla, S. J., & Loutrel, N. P. 2017, AJ, 153, 46
- Luhman & Muench (2008) Luhman, K. L., & Muench, A. A. 2008, ApJ, 684, 654
- Maury et al. (2011) Maury, A. J., André, P., Men’shchikov, A., Könyves, V., & Bontemps, S. 2011, A&A, 535, A77
- Muench et al. (2007) Muench, A. A., Lada, C. J., Luhman, K. L., Muzerolle, J., & Young, E. 2007, AJ, 134, 411
- Mužić et al. (2013) Mužić, K., Scholz, A., Geers, V. C., et al. 2013, Mem. Soc. Astron. Italiana, 84, 931
- Nakamura et al. (2011) Nakamura, F., Sugitani, K., Shimajiri, Y., et al. 2011, ApJ, 737, 56
- Nakamura et al. (2014) Nakamura, F., Sugitani, K., Tanaka, T., et al. 2014, ApJ, 791, L23
- Oasa et al. (1999) Oasa, Y., Tamura, M., & Sugitani, K. 1999, ApJ, 526, 336
- Ortiz-León et al. (2017) Ortiz-León, G. N., Dzib, S. A., Kounkel, M. A., et al. 2017, ApJ, 834, 143
- Ortiz-León et al. (2018) Ortiz-León, G. N., Loinard, L., Dzib, S. A., et al. 2018, ApJ, 869, L33
- Plunkett et al. (2015a) Plunkett, A. L., Arce, H. G., Corder, S. A., et al. 2015a, ApJ, 803, 22
- Plunkett et al. (2015b) Plunkett, A. L., Arce, H. G., Mardones, D., et al. 2015b, Nature, 527, 70
- Povich et al. (2013) Povich, M. S., Kuhn, M. A., Getman, K. V., et al. 2013, ApJS, 209, 31
- Puget et al. (2004) Puget, P., Stadler, E., Doyon, R., et al. 2004, in Proc. SPIE, Vol. 5492, Ground-based Instrumentation for Astronomy, ed. A. F. M. Moorwood & M. Iye, 978–987
- Rayner et al. (2009) Rayner, J. T., Cushing, M. C., & Vacca, W. D. 2009, ApJS, 185, 289
- Ribas et al. (2017) Ribas, Á., Espaillat, C. C., Macías, E., et al. 2017, ApJ, 849, 63
- Rice et al. (2010) Rice, E. L., Barman, T., Mclean, I. S., Prato, L., & Kirkpatrick, J. D. 2010, ApJS, 186, 63
- Schneider et al. (2014) Schneider, A. C., Cushing, M. C., Kirkpatrick, J. D., et al. 2014, AJ, 147, 34
- Skrutskie et al. (2006) Skrutskie, M. F., Cutri, R. M., Stiening, R., et al. 2006, AJ, 131, 1163
- Stahler (1983) Stahler, S. W. 1983, ApJ, 274, 822
- Stead & Hoare (2009) Stead, J. J., & Hoare, M. G. 2009, MNRAS, 400, 731
- Sugitani et al. (2011) Sugitani, K., Nakamura, F., Watanabe, M., et al. 2011, ApJ, 734, 63
- Tanaka et al. (2013) Tanaka, T., Nakamura, F., Awazu, Y., et al. 2013, ApJ, 778, 34
- Teixeira et al. (2012) Teixeira, G. D. C., Kumar, M. S. N., Bachiller, R., & Grave, J. M. C. 2012, A&A, 543, A51
- Vacca et al. (2003) Vacca, W. D., Cushing, M. C., & Rayner, J. T. 2003, PASP, 115, 389
- Whitworth et al. (2007) Whitworth, A., Bate, M. R., Nordlund, Å., Reipurth, B., & Zinnecker, H. 2007, Protostars and Planets V, 459
- Winston et al. (2018) Winston, E., Wolk, S. J., Gutermuth, R., & Bourke, T. L. 2018, AJ, 155, 241
- Zhang et al. (2018) Zhang, Z., Liu, M. C., Best, W. M. J., et al. 2018, ApJ, 858, 41