Spatially-resolved UV diagnostics of AGN feedback: radiation pressure dominates in a prototypical quasar-driven superwind
Abstract
Galactic-scale winds driven by active galactic nuclei (AGN) are often invoked to suppress star formation in galaxy evolution models, but the mechanisms driving these outflows are hotly debated. Two key AGN feedback models are (1) radiation pressure accelerating cool gas and (2) a hot outflowing wind entraining the ISM. Highly ionized emission-line diagnostics represent a powerful means of differentiating these scenarios because of their sensitivity to the expected compression of the ISM clouds by the hot wind. Here, we report the first spatially resolved UV emission spectroscopy of a prototypical (radio-quiet) quasar-driven superwind around the obscured quasar SDSS J1356+1026 at . We observe ratios of O VI/C IV, N V/C IV, and C IV/He II that are remarkably similar for outflowing gas clouds pc and kpc from the nucleus. Such similarity is expected for clouds with AGN radiation pressure dominated dynamics. Comparing the observed line emission to models of clouds in balance with radiation pressure and/or a hot wind, we rule out the presence of a dynamically important hot wind and constrain the ratio of hot gas pressure to radiation pressure to both at pc and kpc from the nucleus. Moreover, the predictions of the radiation pressure confined cloud models that best fit observed UV line ratios are consistent with the observed diffuse X-ray spectrum. These results indicate that this AGN superwind is driven by radiation pressure or was driven by a hot wind that has since dissipated despite on-going AGN activity.
1 Introduction
Modern models of galaxy evolution often invoke powerful feedback from accreting supermassive black holes (SMBH) in galactic nuclei in order to suppress star formation in massive galaxies (for reviews, see Kormendy & Ho, 2013; Heckman & Best, 2014; Somerville & Davé, 2015). Direct observations of powerful circum-nuclear active galactic nuclei (AGN) driven winds demonstrate that SMBH feedback is in principle possible, but the physical mechanisms that couple energy and momentum from the nucleus to the interstellar medium (ISM) and surrounding halo gas are fiercely debated (e.g. Morganti, 2017; Wylezalek & Morganti, 2018). Two key models for driving effective, large-scale AGN outflows are (1) direct acceleration of cool gas through radiation pressure (e.g. Murray et al., 2005; Ishibashi & Fabian, 2015; Debuhr et al., 2011; Thompson et al., 2015) and (2) entrainment of the ISM in a hot outflowing wind generated by fast shocks near the nucleus (e.g. Faucher-Giguère & Quataert, 2012; King & Pounds, 2015). Observations that differentiate between these AGN feedback models are necessary for a more complete understanding of galaxy evolution (e.g. Krumholz et al., 2017).
Over the last decade, surveys of outflowing gas around luminous (radio-quiet) AGN demonstrate that multi-phase and kinematically disturbed outflows are nearly ubiquitous both near the nucleus ( kpc e.g. Feruglio et al., 2010; Zakamska & Greene, 2014) and on galactic scales of kpc (e.g. Greene et al., 2011, 2012; Zubovas & Nayakshin, 2012; Liu et al., 2013a, b, 2014; Harrison et al., 2014; Rupke et al., 2017; Sun et al., 2017; Fischer et al., 2018; Husemann et al., 2019; Jarvis et al., 2019). However, more in-depth follow-up observations are needed to make definitive statements about the physical conditions in the ongoing outflows, let alone the physical mechanisms that drove or continue to drive them.
Emission line ratios of highly ionized species can diagnose the physical conditions in quasar outflows. These line ratios are sensitive to the ionization level of the H II gas, which in turn depends on the dominant pressure source applied to the illuminated surface of the clouds (Stern et al., 2016). If quasar radiation pressure is the dominant pressure source then the thermal gas pressure at the ionization front roughly equals the incident radiation pressure, implying an ionization parameter of . Moreover, in radiation-pressure-dominated clouds, the H II layer has a characteristic density profile and spectral signature in highly-ionized lines (Stern et al., 2014a, b; Baskin et al., 2014a, b; Bianchi et al., 2019). If another pressure mechanism dominates – such as the hot wind – then the gas will have a higher pressure/density and thus a lower ionization state (e.g. Dopita et al., 2002; Stern et al., 2016). In addition, highly ionized lines can differentiate AGN photoionized gas (Groves et al., 2004) from shocks (Allen et al., 2008). Consequently, spectroscopy of emission lines such as O VI, N V, and C IV in the rest-UV represents a sensitive means of testing AGN feedback mechanisms and constraining the elusive hot wind phase.
Here, we present the first sensitive and spatially resolved UV spectra of a prototypical quasar-driven superwind at low redshift, SDSS J135646.10+102609.0 (SDSS J1356+1026). SDSS J1356+1026 is a radio-quiet, obscured quasar at redshift driving a prototypical superwind on galactic scales (Greene et al., 2012). The AGN has an estimated bolometric luminosity of and a black hole mass of (Sun et al., 2014). The outflow is characterized by kinematically disturbed ionized gas with double-peaked velocity structure (full width in projection, inconsistent with bound gravitational motion) observed in [O III] emission at kpc from the nucleus that can be modelled as outflowing shells (see Figure 1; Greene et al., 2012). Soft X-ray emission that is detected at the location of the extended outflow can be explained either by the presence of a hot wind or by photoionized line emission (Greene et al., 2014; Foord et al., 2020).
Throughout, we adopt a flat CDM cosmology with , , and .
2 Observations and Data Reduction
2.1 HST COS Data Reduction and Measurements
We obtained sensitive, spatially resolved FUV emission-line spectra of SDSS J1356+1026 with the Cosmic Origins Spectrograph (COS; Green et al., 2012) on board the Hubble Space Telescope (HST) both with a nuclear pointing on 2019-06-12 and 2019-06-14 (4 orbits; 10.39 sec of exposure; OBSIDs: LDHV02010, LDHV01010; PI: Johnson, PID: 15280) and an off-nuclear pointing on 2018-05-20 (1 orbit; 2.16 ksec of exposure; OBSID: LDHV03010). The off-nuclear pointing is centered at the location of the extended outflow observed in [O III], 4.8 arcsec (10.6 kpc) South and 0.6 arcsec (1.6 kpc) West of the nucleus as shown in the middle panel of Figure 1. The COS G140L grating spectra cover key high ionization lines such as the O VI 1031/1037, N V 1238/1242, C IV 1548/1550, and Si IV doublets as well as He II and the O IV] multiplet at (blended with Si IV).
We calibrated the COS spectra using the calcos pipeline version 3.3.5. Because calcos is optimized for point sources, we enlarged the spectral extraction aperture size to pixels (5.4 arcsec) from the default. Our chosen extraction aperture includes at least 98% of the total flux under the O VI, N V, and C IV lines, and the line ratios are robust to aperture size changes at the level of . We combined the extracted individual exposures for each pointing into exposure time weighted final spectra after masking bad pixels. Figure 1 shows the final nuclear and off-nuclear spectra in the top two panels on the right.
The nuclear and off-nuclear UV spectra from COS shown in Figure 1 exhibit emission in H I , O VI, H I , N V, Si IVO IV], C IV, and He II . The observed line ratios in the off-nuclear spectrum are strikingly similar to those in the nuclear spectrum. To measure the strengths of the emission lines and quantify this similarity, we fit the spectral region around each line with a linear continuum model and Gaussian emission components as shown in the zoom-in plots in Figure 1. Some features required multiple Gaussians to achieve a good fit. Due to low signal-to-noise in the Si IV+O IV] emission line for the off-nuclear spectrum, we fixed the width of the fit to that from a single Gaussian fit to the same region in the nuclear spectrum. For the same reason, we fixed the width of the Ly off-nuclear Gaussian to be the same as that of the off-nuclear O VI lines. The line measurements are summarized in Table 1 after Milky Way foreground extinction corrections based on Schlafly & Finkbeiner (2011) and Fitzpatrick & Massa (2007). The line flux uncertainties include systematic errors of 1020% based on flux measurement variations using different continuum models and non-parametric measurements. The spatial extent of the emitting gas in the dispersion direction is expected to produce spectral resolution of from 1800-1100 Å, consistent with the observed line and doublet full-width-at-half-maxima (FWHM).
2.2 HST WFC3 Imaging
To assess the morphological structure of the ionized gas around SDSS J1356+1026, we constructed an [O II] line-map using available wide and medium band HST images from WFC3+UVIS in the F438W (PI: Comerford, PID: 12754) and F621M (PI: Greene, PID:13944) filters. The F438W filter includes both continuum and line emission, predominantly from the [O II] doublet, while the F621M filter is free from strong emission lines. To create the emission line map, we started with the default image reductions from STScI and performed an astrometric alignment and flux scaling prior to image subtraction. To align and scale the images, we identified sixteen serendipitous sources residing in the common field-of-view (FOV). We then estimated the optimal translation, rotation, and flux scaling between the two images by simultaneously minimizing the residuals in subtracted cutouts around the serendipitous sources via simulated annealing. The resulting line map is shown in Figure 1.
2.3 Chandra X-ray Observations
There are three archival Chandra X-ray observations of SDSS J1356+1026 obtained with the Advanced CCD Imaging Spectrometer (ACIS) in ACIS-S mode taken on dates 2012-03-31 (ObsID:13951; FAINT mode), 2016-03-29 (ObsID:17047; VFAINT mode), and 2016-05-19 (Obsid:18826; VFAINT mode). Because of the differences in the observing setup and the sensitivity of ACIS over time, we processed each observation separately but consistently using the Chandra software packages in CIAO v4.11 with calibration files from CALDB 4.8.3 applied using chandra_repro. After removing streak events, bad pixels, pixel randomization, cosmic rays, and flares, the final Level-2 events files consist of Good Time Intervals of 19.8, 34.8, and 42.9 ks respectively.
For our analysis of the diffuse X-ray spectrum, we extracted photons and response files using the specextract package from each events file within a region bounded by the 99% flux contour from the HST [O II] image. To prevent contamination from the central AGN we masked a central circular region of radius (90 and 95% encircled energy fraction at and keV respectively). We analyzed the resulting X-ray spectra with XSPEC v12.10 using Cash (1976) statistics and required a minimum of one photon per energy bin.
| Line | Flux [] | Counts | Centroid [Å] | FWHM [] | |
|---|---|---|---|---|---|
| Nuclear | |||||
| O VI 1031.92/1037.61 | |||||
| H I | |||||
| N V 1238.82/1242.80 | |||||
| Si IV 1393.75/1402.77 + O IV] 1400 | |||||
| C IV 1548.19/1550.77 | |||||
| He II 1640.40 | |||||
| Off-Nuclear | |||||
| O VI 1031.92/1037.61 | |||||
| H I | |||||
| N V 1238.82/1242.80 | |||||
| Si IV 1393.75/1402.77 + O IV] 1400 | |||||
| C IV 1548.19/1550.77 | |||||
| He II 1640.40 |
3 Discussion
The observed emission line ratios of N V/C IV, C IV/He II, and O VI/C IV are shown in Figure 2, and are strikingly similar for the nuclear and off-nuclear observations, despite the factor of difference in ionizing flux. For example, the nuclear N V to C IV ratio of is consistent with the off-nuclear value of . This suggests that the density of the emitting clouds has the same radial dependence as the quasar radiation field, as expected if radiation pressure dominates.
To better understand the physical conditions of the emitting clouds, we compare the observed line ratios in Figure 2 to models including radiative shocks (plus photoionized precursor; Allen et al., 2008) and AGN photoionized models calculated with Cloudy version 17.01 (Ferland et al., 2017). Shocks with velocities greater than can reproduce the observed emission line ratios of [O III]/H at the nucleus and location of the off-nuclear pointing from Greene et al. (2012). However, at these velocities, the shock models significantly over-predict the observed highly ionized line ratios (e.g. O VI/C IV) as shown in Figure 2. We therefore conclude that AGN photoionization dominates over shock ionization by a large factor in the observed regions of SDSS J1356+1026, though we caution that shocks may still be present in the system (e.g. Zakamska & Greene, 2014).
3.1 Constant density models
The observed O VI/C IV ratios can be reproduced by models of AGN photoionized gas clouds with uniform density, solar metallicity, and ionization parameter of (Groves et al., 2004), implying for pc and for kpc assuming an AGN bolometric luminosity (Sun et al., 2014) and nominal distances of 100 pc and 10 kpc for the nuclear and off-nuclear pointings. Such AGN photoionized gas clouds exhibit an equilibrium temperature of K implying gas pressures of and K cm-3 for the nuclear and off-nuclear pointings respectively, less than the pressure in the incident radiation, and respectively. Consequently, neglecting the effect of radiation pressure on the structure of the ionized gas is not justified (e.g. Dopita et al. (2002)).
3.2 Hydrostatic models including AGN radiation pressure
To account for the effects of radiation pressure, we employ hydrostatic models of ionized clouds, in which the pressure at the illuminated surface is set by the thermal pressure of the ambient hot gas, , while the momentum transferred to the gas via the absorption of radiation is balanced by a thermal pressure gradient within the ionized cloud. Such models are sometimes referred to as “constant total pressure” models, since the sum of the thermal gas pressure and the remaining pressure in the absorbed radiation is constant throughout the slab.111These models are calculated in Cloudy using the “constant pressure” option, though they should not be confused with constant gas pressure models in which is held constant. Confinement on the shielded side is assumed to be provided by the neutral/molecular gas beyond the ionization front. As discussed in Dopita et al. (2002) and Stern et al. (2016), the structure of the ionized cloud depends qualitatively on whether hot gas or radiation is the dominant pressure source. If then radiation pressure is negligible and the gas pressure is roughly constant throughout the cloud with , resulting in a roughly uniform density ionized layer. In contrast if then the gas pressure increases significantly with depth into the cloud, from at the illuminated surface to near the ionization front (see fig. 1 in Stern et al. (2016)). In this case the cloud is Radiation Pressure Confined (RPC), and density and hence ionization parameter are a function of depth so that highly ionized lines arise primarily from outer layers while lower ionization lines arise from deeper layers closer to the ionization front. In RPC clouds, the predicted line ratios are independent of and exhibit unique spectral signatures. Consequently, highly ionized FUV emission line observations of AGN outflows can serve as effective barometers that enable inferences into whether radiation pressure or a hot wind determine the dynamics of the cool-warm component of AGN driven outflows.
We used Cloudy to calculate the structure of hydrostatic H II regions photoionized by AGN over a wide range of relative pressures (). Other model parameters include the dust content of the gas, gas metallicity, the ionizing spectral slope () between 1 Rydberg and 2 keV, and the distance to the unresolved nucleus pointing. For the purposes of this letter, these are nuisance parameters. We ran a grid of models with , metallicity in the range , and Milky Way ISM abundances and dust content/depletion (Draine, 2011). Because dust may be destroyed in the AGN outflow, we also consider dust-free models which are discussed in the Appendix. Our conclusions are robust to a wide range in choice of these parameters. We assume an AGN bolometric luminosity of erg s-1, and distances of pc for the nuclear pointing and a distance of kpc for the off-nuclear pointing. The predicted line ratios from the models are shown in Figure 2. Dots connected by thick lines denote the model predictions for different , for an assumed , , and a distance of 100 pc (10 kpc) for the nuclear (off-nuclear) pointing. Thin lines denote predicted line ratios for other choices of these three parameters. Because the cloud models are in the optically thick limit the size and total columns of the emitting regions are not not free parameters. Nevertheless, we ensured that the emitting cloud sizes are smaller than the COS aperture and the corresponding total hydrogen columns range from cm-2.
As , the predicted line ratios approach asymptotic values, as expected in the radiation pressure dominated limit in which the line ratios are independent of (Dopita et al., 2002; Stern et al., 2014b). In the dusty models shown in Figure 2, the uncertainty in the predicted line ratios given our assumed range of metallicity, spectral slope and cloud distance is merely dex. All observed line ratios are within dex of the predictions for radiation pressure dominated clouds for both the nuclear pointing and the off-nuclear pointing. The hot gas pressure dominated models with under-predict O VI/C IV by an order-of-magnitude and underpredict the observed N V/C IV by a factor of . The observed line ratios thus strongly disfavor the hot gas pressure dominated models.
3.3 Any hot wind is currently dynamically unimportant
The observed N V/C IV, C IV/He II, and O VI/C IV line ratios for both the nuclear and off-nuclear pointings are consistent with the hydrostatic model predictions in the radiation pressure dominated regime () as shown in Figure 2. To quantify the limit on the presence of a hot wind component from the UV spectra, Figure 3 displays the observed nuclear and off-nuclear O VI/C IV ratios compared to hydrostatic photoionization model predictions as a function of . The thickness of the colored lines denotes the uncertainty in the prediction due to the uncertainty in the nuisance parameters mentioned in the previous section. The observed line ratios for the nucleus fall within the uncertainty range for the dusty model while the off-nuclear ratios fall between the dusty and dust-free models222This suggests intermediate dust content which we will explore in future work.. In both cases, the observed line ratios require . We therefore conclude that the outflowing, UV emitting clouds on narrow-line region scales of pc and on galactic scales of kpc are not currently entrained in a dynamically important hot wind. Using the estimated radiation pressure at the fiducial distances, we place limits on the current pressure from any hot wind of and for the nuclear and off-nuclear pointings, respectively.
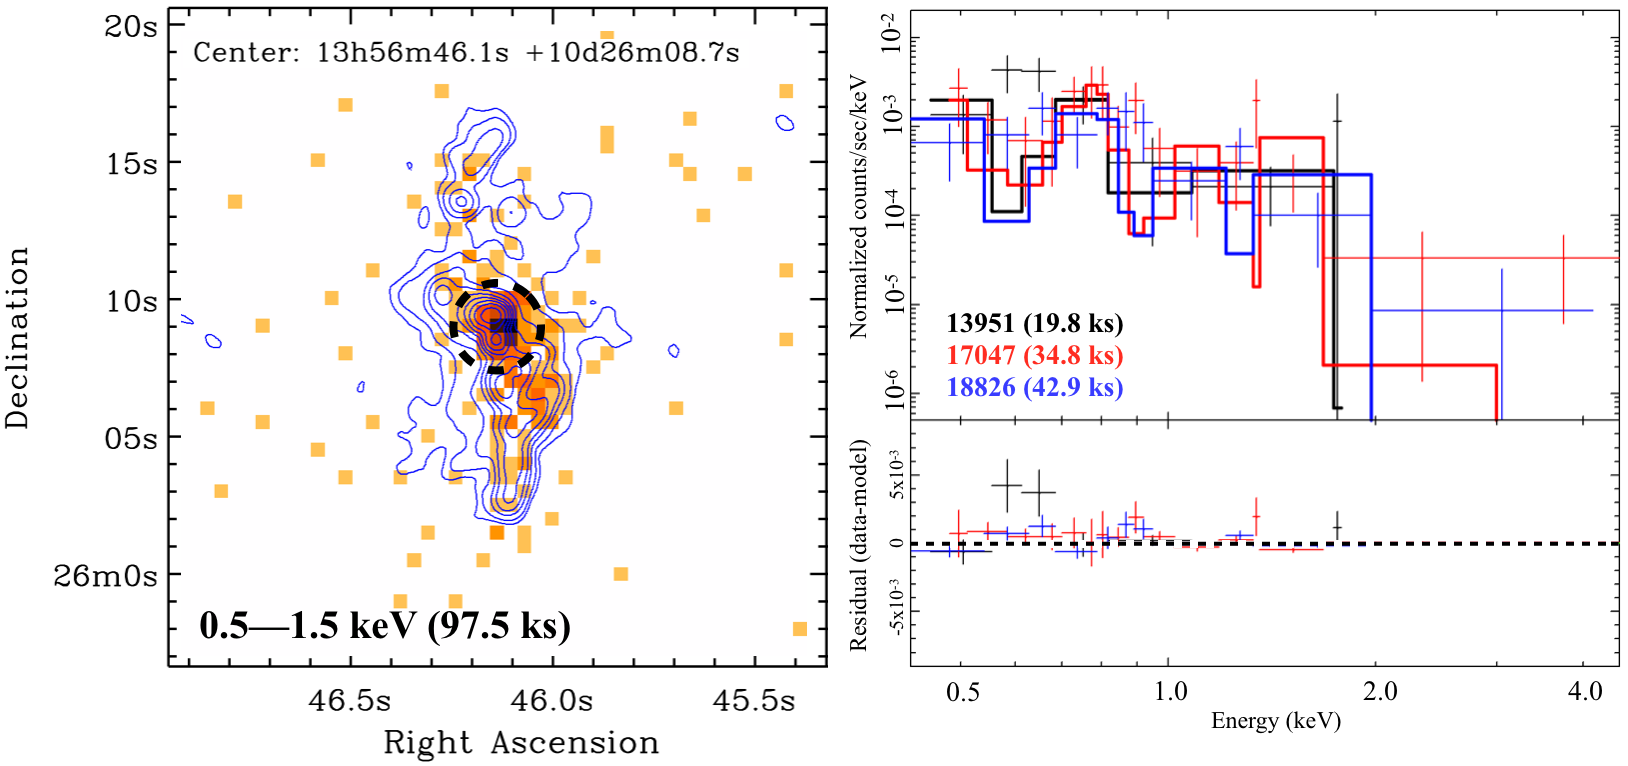
3.4 The extended X-ray emission is consistent with photoionized line emission
Chandra observations of SDSS J1356+1026 show that the extended outflow of SDSS J1356+1026 emits soft X-rays which can be explained by shocks induced by a hot wind (e.g. Choi et al., 2014; Nims et al., 2015) or by AGN photoionized line emission (e.g. Sambruna et al., 2001). The diffuse, extended X-ray emission from SDSS J1356+1026 is coincident with [O II] emission (see Figure 4), consistent with either scenario. This diffuse component is characterized by low-energy X-ray emission with keV. At harder energies, there are only 7 X-ray photons with –7 keV within the [O II] bounded region, fully consistent with the 6.50.9 counts expected from the X-ray background in that area in the three combined Chandra exposures.
To test the two scenarios for the origins of the diffuse X-ray emission, we constructed a Cloudy model of diffuse X-ray emission produced by AGN photoionized gas assuming the X-ray emitting layer is dustless since grains will be destroyed by sputtering in X-ray emitting layers, even if the lower-ionization layers which produce the UV emission are dusty (Stern et al., 2014b). This Cloudy model is consistent with the observed X-ray spectra with a Cash statistic of for degrees of freedom (Right panel in Fig. 4) with few significant residuals (lower panel). The diffuse X-ray emission may also be a consequence of shock-heating in a thermally hot plasma. Hence, we also fit the X-ray spectra with an apec model in XSPEC and find that it is equally consistent with a low best-fit metallicity of % solar, temperature of keV plasma, and no internal absorption. However, given the consistency between the observed soft X-ray spectrum and the model expectations from the radiation pressure dominated cloud emission observed in the UV, we suggest that the diffuse X-ray emission can be fully explained by photoionized line emission. Conclusively differentiating between the two X-ray scenarios will require future X-ray observatories such as Lynx (Gaskin et al., 2018).
4 Summary and conclusions
To gain insights into the physical drivers of AGN feedback on galactic scales, we performed spatially resolved UV emission spectroscopy of a prototypical quasar-driven superwind at low-. Despite the large expected difference in ionizing flux, the observed highly ionized UV line ratios on kpc scales are similar to those seen near the nucleus ( pc). This similarity is expected if radiation pressure dominates at the illuminated surface of the line-emitting clouds. Indeed, models of clouds confined by radiation pressure from the AGN self-consistently reproduce the observed UV line ratios as well as the spectral and morphological properties of observed diffuse X-ray emission.
Based on the observed highly ionized UV emission ratios, we rule out the presence of a dynamically important hot wind phase and place an upper limit on the pressure a hot wind may impart to the UV emitting clouds at kpc. This upper limit is an order-of-magnitude lower than recent estimates based on tentative detections () of the Sunyaev-Zel’dovich effect around quasars at (Hall et al., 2019; Lacy et al., 2019). This tension can be reconciled if AGN feedback varies significantly from object-to-object (e.g. due to luminosity or redshift), if the hot wind is no longer co-spatial with the UV emitting clouds, or if the hot wind has expanded adiabatically and is no longer a dominant pressure source at this stage in the evolution of SDSS J1356+1026. While a hot wind component of the outflow may therefore still exist, the observed highly ionized emission-line ratios indicate that the combined gas pressure and ram pressure from any hot gas are subdominant to the radiation pressure and hence do not confine or provide on-going acceleration to the outflowing, UV emitting clouds. The observed AGN outflow is therefore most likely the result of radiation pressure or a hot wind that accelerated the gas at earlier epochs and has since vented or cooled despite on-going AGN activity, placing novel and stringent constraints on AGN feedback models.
Appendix A Dustless Models
Dust content of clouds in RPC can change emission-line ratios not only through extinction and gas-phase depletion, but also by altering the thermodynamic properties of the clouds because the dust absorbs radiation pressure. To ensure that our conclusions are robust to dust content of the clouds we ran model grids as described in Section 3.2 but with no dust and solar relative abundances (Asplund et al., 2009). The resulting line ratio predictions are compared to the observed ones in in Figure 5. Like with the dusty models, the dustless models are most consistent with the observed ratios in the radiation pressure dominated limit, ruling out the current presence of a dynamically important hot wind.
References
- Allen et al. (2008) Allen, M. G., Groves, B. A., Dopita, M. A., Sutherland, R. S., & Kewley, L. J. 2008, ApJS, 178, 20, doi: 10.1086/589652
- Asplund et al. (2009) Asplund, M., Grevesse, N., Sauval, A. J., & Scott, P. 2009, ARA&A, 47, 481, doi: 10.1146/annurev.astro.46.060407.145222
- Baskin et al. (2014a) Baskin, A., Laor, A., & Stern, J. 2014a, MNRAS, 438, 604, doi: 10.1093/mnras/stt2230
- Baskin et al. (2014b) —. 2014b, MNRAS, 445, 3025, doi: 10.1093/mnras/stu1732
- Bianchi et al. (2019) Bianchi, S., Guainazzi, M., Laor, A., Stern, J., & Behar, E. 2019, MNRAS, 485, 416, doi: 10.1093/mnras/stz430
- Cash (1976) Cash, W. 1976, A&A, 52, 307
- Choi et al. (2014) Choi, E., Naab, T., Ostriker, J. P., Johansson, P. H., & Moster, B. P. 2014, MNRAS, 442, 440, doi: 10.1093/mnras/stu874
- Debuhr et al. (2011) Debuhr, J., Quataert, E., & Ma, C.-P. 2011, MNRAS, 412, 1341, doi: 10.1111/j.1365-2966.2010.17992.x
- Dempsey & Zakamska (2018) Dempsey, R., & Zakamska, N. L. 2018, MNRAS, 477, 4615, doi: 10.1093/mnras/sty941
- Dopita et al. (2002) Dopita, M. A., Groves, B. A., Sutherland, R. S., Binette, L., & Cecil, G. 2002, ApJ, 572, 753, doi: 10.1086/340429
- Draine (2011) Draine, B. T. 2011, Physics of the Interstellar and Intergalactic Medium
- Faucher-Giguère & Quataert (2012) Faucher-Giguère, C.-A., & Quataert, E. 2012, MNRAS, 425, 605, doi: 10.1111/j.1365-2966.2012.21512.x
- Ferland et al. (2017) Ferland, G. J., Chatzikos, M., Guzmán, F., et al. 2017, Rev. Mexicana Astron. Astrofis., 53, 385. https://arxiv.org/abs/1705.10877
- Feruglio et al. (2010) Feruglio, C., Maiolino, R., Piconcelli, E., et al. 2010, A&A, 518, L155, doi: 10.1051/0004-6361/201015164
- Fischer et al. (2018) Fischer, T. C., Kraemer, S. B., Schmitt, H. R., et al. 2018, ApJ, 856, 102, doi: 10.3847/1538-4357/aab03e
- Fitzpatrick & Massa (2007) Fitzpatrick, E. L., & Massa, D. 2007, ApJ, 663, 320, doi: 10.1086/518158
- Foord et al. (2020) Foord, A., Gültekin, K., Nevin, R., et al. 2020, arXiv e-prints, arXiv:2002.01033. https://arxiv.org/abs/2002.01033
- Gaskin et al. (2018) Gaskin, J. A., Dominguez, A., Gelmis, K., et al. 2018, in Society of Photo-Optical Instrumentation Engineers (SPIE) Conference Series, Vol. 10699, Proc. SPIE, 106990N, doi: 10.1117/12.2314149
- Green et al. (2012) Green, J. C., Froning, C. S., Osterman, S., et al. 2012, ApJ, 744, 60, doi: 10.1088/0004-637X/744/1/60
- Greene et al. (2014) Greene, J. E., Pooley, D., Zakamska, N. L., Comerford, J. M., & Sun, A.-L. 2014, ApJ, 788, 54, doi: 10.1088/0004-637X/788/1/54
- Greene et al. (2011) Greene, J. E., Zakamska, N. L., Ho, L. C., & Barth, A. J. 2011, ApJ, 732, 9, doi: 10.1088/0004-637X/732/1/9
- Greene et al. (2012) Greene, J. E., Zakamska, N. L., & Smith, P. S. 2012, ApJ, 746, 86, doi: 10.1088/0004-637X/746/1/86
- Groves et al. (2004) Groves, B. A., Dopita, M. A., & Sutherland, R. S. 2004, ApJS, 153, 75, doi: 10.1086/421114
- Hall et al. (2019) Hall, K. R., Zakamska, N. L., Addison, G. E., et al. 2019, MNRAS, 490, 2315, doi: 10.1093/mnras/stz2751
- Harrison et al. (2014) Harrison, C. M., Alexander, D. M., Mullaney, J. R., & Swinbank, A. M. 2014, Monthly Notices of the Royal Astronomical Society, 441, 3306, doi: 10.1093/mnras/stu515
- Heckman & Best (2014) Heckman, T. M., & Best, P. N. 2014, ARA&A, 52, 589, doi: 10.1146/annurev-astro-081913-035722
- Husemann et al. (2019) Husemann, B., Scharwächter, J., Davis, T. A., et al. 2019, A&A, 627, A53, doi: 10.1051/0004-6361/201935283
- Ishibashi & Fabian (2015) Ishibashi, W., & Fabian, A. C. 2015, MNRAS, 451, 93, doi: 10.1093/mnras/stv944
- Jarvis et al. (2019) Jarvis, M. E., Harrison, C. M., Thomson, A. P., et al. 2019, MNRAS, 485, 2710, doi: 10.1093/mnras/stz556
- King & Pounds (2015) King, A., & Pounds, K. 2015, ARA&A, 53, 115, doi: 10.1146/annurev-astro-082214-122316
- Kormendy & Ho (2013) Kormendy, J., & Ho, L. C. 2013, ARA&A, 51, 511, doi: 10.1146/annurev-astro-082708-101811
- Krumholz et al. (2017) Krumholz, M. R., Thompson, T. A., Ostriker, E. C., & Martin, C. L. 2017, MNRAS, 471, 4061, doi: 10.1093/mnras/stx1882
- Lacy et al. (2019) Lacy, M., Mason, B., Sarazin, C., et al. 2019, MNRAS, 483, L22, doi: 10.1093/mnrasl/sly215
- Liu et al. (2014) Liu, G., Zakamska, N. L., & Greene, J. E. 2014, MNRAS, 442, 1303, doi: 10.1093/mnras/stu974
- Liu et al. (2013a) Liu, G., Zakamska, N. L., Greene, J. E., Nesvadba, N. P. H., & Liu, X. 2013a, MNRAS, 436, 2576, doi: 10.1093/mnras/stt1755
- Liu et al. (2013b) —. 2013b, MNRAS, 430, 2327, doi: 10.1093/mnras/stt051
- Morganti (2017) Morganti, R. 2017, Frontiers in Astronomy and Space Sciences, 4, 42, doi: 10.3389/fspas.2017.00042
- Murray et al. (2005) Murray, N., Quataert, E., & Thompson, T. A. 2005, ApJ, 618, 569, doi: 10.1086/426067
- Nims et al. (2015) Nims, J., Quataert, E., & Faucher-Giguère, C.-A. 2015, MNRAS, 447, 3612, doi: 10.1093/mnras/stu2648
- Rupke et al. (2017) Rupke, D. S. N., Gültekin, K., & Veilleux, S. 2017, ApJ, 850, 40, doi: 10.3847/1538-4357/aa94d1
- Sambruna et al. (2001) Sambruna, R. M., Netzer, H., Kaspi, S., et al. 2001, ApJ, 546, L13, doi: 10.1086/318068
- Schlafly & Finkbeiner (2011) Schlafly, E. F., & Finkbeiner, D. P. 2011, ApJ, 737, 103, doi: 10.1088/0004-637X/737/2/103
- Somerville & Davé (2015) Somerville, R. S., & Davé, R. 2015, ARA&A, 53, 51, doi: 10.1146/annurev-astro-082812-140951
- Stern et al. (2014a) Stern, J., Behar, E., Laor, A., Baskin, A., & Holczer, T. 2014a, MNRAS, 445, 3011, doi: 10.1093/mnras/stu1960
- Stern et al. (2016) Stern, J., Faucher-Giguère, C.-A., Zakamska, N. L., & Hennawi, J. F. 2016, ApJ, 819, 130, doi: 10.3847/0004-637X/819/2/130
- Stern et al. (2014b) Stern, J., Laor, A., & Baskin, A. 2014b, MNRAS, 438, 901, doi: 10.1093/mnras/stt1843
- Sun et al. (2017) Sun, A.-L., Greene, J. E., & Zakamska, N. L. 2017, ApJ, 835, 222, doi: 10.3847/1538-4357/835/2/222
- Sun et al. (2014) Sun, A.-L., Greene, J. E., Zakamska, N. L., & Nesvadba, N. P. H. 2014, ApJ, 790, 160, doi: 10.1088/0004-637X/790/2/160
- Thompson et al. (2015) Thompson, T. A., Fabian, A. C., Quataert, E., & Murray, N. 2015, MNRAS, 449, 147, doi: 10.1093/mnras/stv246
- Wylezalek & Morganti (2018) Wylezalek, D., & Morganti, R. 2018, Nature Astronomy, 2, 181, doi: 10.1038/s41550-018-0409-0
- Zakamska & Greene (2014) Zakamska, N. L., & Greene, J. E. 2014, MNRAS, 442, 784, doi: 10.1093/mnras/stu842
- Zubovas & Nayakshin (2012) Zubovas, K., & Nayakshin, S. 2012, MNRAS, 424, 666, doi: 10.1111/j.1365-2966.2012.21250.x