Superconductivity of Carbon Compounds with Sodalite Structure
Abstract
We investigate the superconductivity of carbon compounds with a sodalite structure, which are similar to hydrogen compounds showing the high-temperature superconductivity. A systematic analysis by first-principles calculations is carried out, including examination of mechanical and dynamic instabilities under external pressure . These instabilities are classified on the phase diagram for the effective doping charge versus the lattice constant of the system. We also present the superconducting transition temperature as a function of for many carbon compounds and a pure carbon system with the sodalite structure. Some of them have of up to about 100 K at GPa, and the results suggest that the sodalite structure of carbon may be a key to producing phonon-mediated high- superconductivity.
Since the high-temperature superconductivity (HTS) of metallic hydrogen was predicted at an extremely high pressure,[1] much effort has been made to clarify its superconductivity and/or to find new hydrogen compounds relevant to metallic hydrogen.[2, 3, 4] In particular, hydrogen compounds with a sodalite structure, such as YH6 are predicted to have a transition temperature of over 250 K[5, 6, 7]. On the basis of these predictions, experiments[8, 9] were conducted. It was verified that the s of these superconductors are close to those obtained by first-principles calculations.
In hydrogen compound superconductors, high pressure may stabilize their characteristic structures and leads to a high phonon frequency. In experiments, it is not easy to generate high pressure of over a few hundred GPa, and HTS of hydrogen compounds can only be achieved in diamond anvil cells. It is desirable to reduce the required pressure to realize HTS.
HTS of hydrogen compounds is caused by the phonon mediated attraction and its mechanism of the superconductivity is conventional. In this case, is governed by mainly two parameters, namely, the characteristic phonon frequency of the system and the electron-phonon coupling constant . When both parameters are large, HTS can be expected. In fact, many hydrogen compounds with a sodalite structure have a large , which is larger than about 2.0.[5, 6, 7]
If the sodalite structure plays an important role in producing a large , it might be interesting to replace the hydrogen atom of the sodalite structure with another atom. A material formed by carbon atoms such as diamond is stable at atmospheric pressure and has a high phonon frequency up to 2000 K.
Therefore, one way to reduce the required pressure and to realize HTS is to replace hydrogen with carbon. In fact, boron-doped diamond has been studied as a candidate material with phonon-mediated HTS at atmospheric pressure.[10, 11]
A sodalite structure with only carbon atoms, which is an insulator with a large charge gap, has already been predicted on the basis of the density functional theory.[12] By combining it with other elements, we expect high and large as well as a hydrogen compound superconductor. In fact, it has been studied as a compound consisting of six carbon atoms and another atom, which is represented by C6, where is Li, Na, Cl, and so on.[13, 14] Despite being under atmospheric pressure, is claimed to be up to 100 K, where K and for NaC6.[13] However, the existence of C6 has not yet been experimentally demonstrated and its nature has not been clarified. In addition, recent analysis of mechanical stability shows that some C6 systems are unstable at atmospheric pressure.[14, 15]
In this work, we investigate the superconductivity of carbon compounds with sodalite structure using the first-principles calculations. Both of mechanical and dynamical instabilities are also examined by varying the pressure systematically. Using the McMillan formulation[16, 17], we show s of a pure C6 system with fictitious charge and many compounds as a function of external pressure . These results would clarify the stability and superconducting properties of C6 systems.
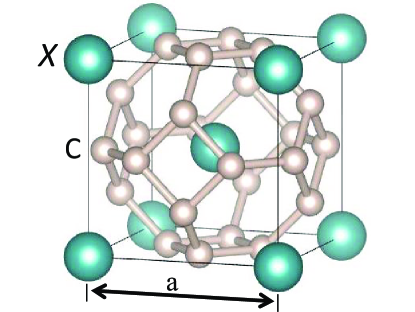
In Fig. 1, we show the structure of C6, where stands for an atom bonded to carbon atoms that form the skeleton of the sodalite structure. Calculations are performed using ’Quantum ESPRESSO’(QE), which is an integrated software program of Open-Source computer codes for electronic-structure calculations.[18] In our calculation, we mainly use a Monkhorst-Pack grid for the electronic Brillouin zone integration and a mesh for phonon calculation. The elastic constants are calculated by using ’’ which is a driver of QE routines[19].
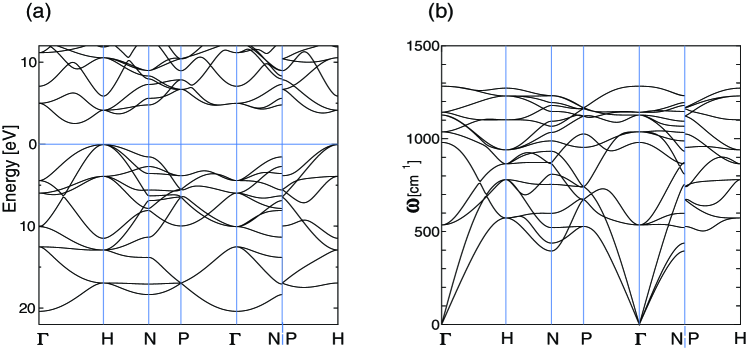
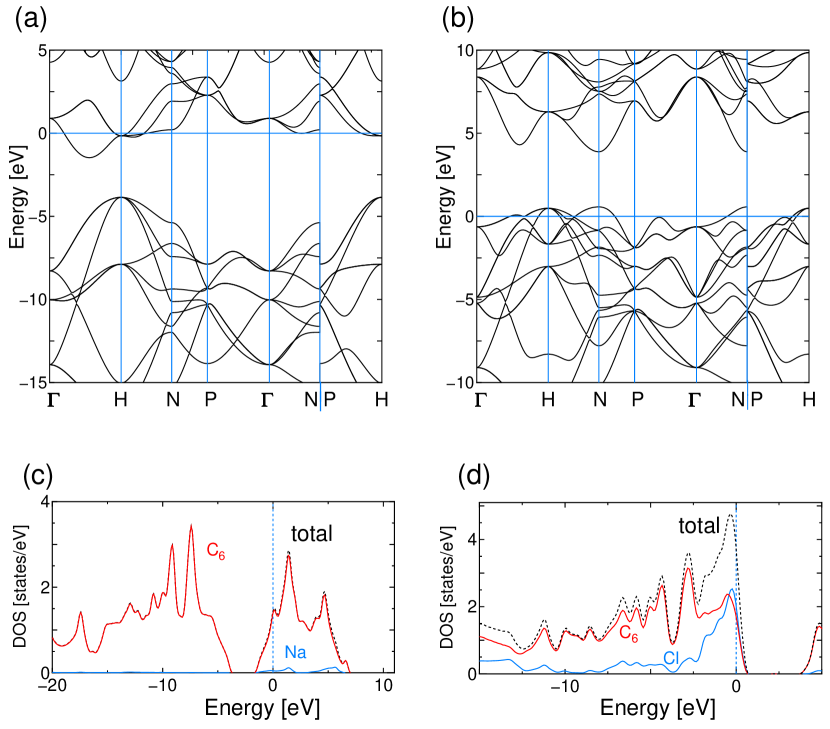
First, we consider a pure carbon system with the sodalite structure, C6. It forms the skeleton of this superconductor and may be the basis for understanding the superconductivity of C6. In Fig. 2(a), we show the band structure of an electron at GPa. It indicates that C6 is an insulator with a charge gap of about 2.5 eV, which agrees with the result of a previous work.[12]
Figure 2(b) shows that the phonon dispersion becomes positive at any point in the Brillouin zone and the system is stable against phonon excitation at GPa. It indicates that the system becomes dynamically stable. We also confirmed that the system can withstand a pressure of at least 250 GPa. To examine the relationship between the instability and electronic state of C6, we apply the rigid-band approximation[20, 21] to C6. In this method, a fictitious charge is introduced into the target system by assuming a rigid band. It changes only the Fermi energy of the system according to carrier density. It will be useful for analyzing the electronic state of C6, because the compound C6 may be considered as a system with an -atom doped into C6. For example, if is an alkali metal, it would correspond to the case of electron doping and the Fermi energy of the system is increased.
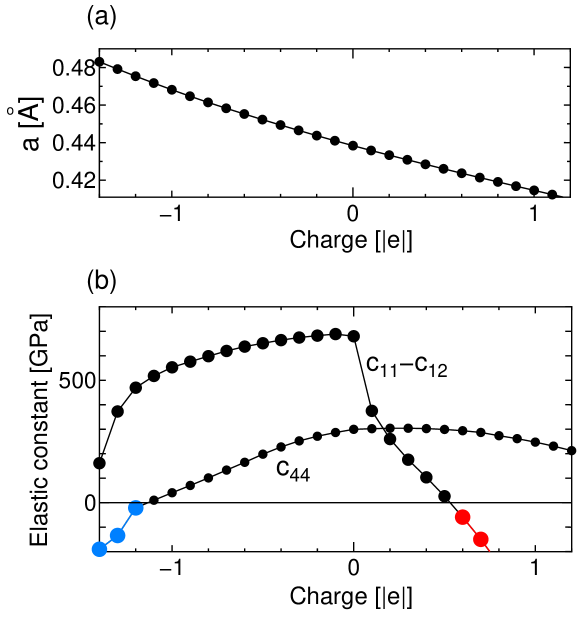
In Fig. 3(a), we show the lattice constant of C6 as a function of the fictitious charge, whose value is normalized by the absolute charge value of an electron, . The figure indicates that the electron doping increases the lattice constant of the unit cube. In other words, the effect of carrier doping may be equivalent to applying pressure to the system as a side effect. In Fig. 3(b), the difference of elastic constants and as functions of the fictitious charge are shown. It is known that conditions and lead to mechanical instability of the system.[22, 23, 24] The former means a negative Young’s modulus and the latter corresponds to negative rigidity.
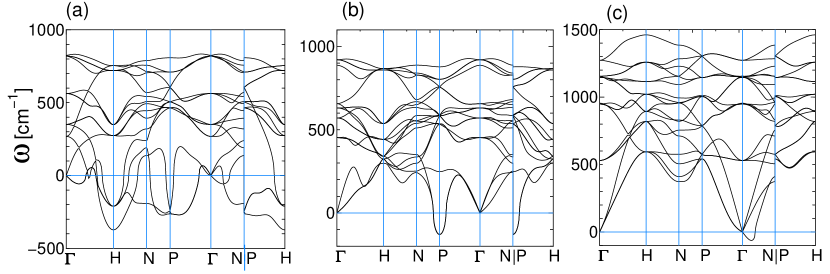
Here, we consider the relationship between mechanical and dynamical instabilities. Figures 4(a)-(c) show the phonon dispersion of C6, where the fictitious charges are set to -1.4 , -1.0 and 0.6 , respectively. In the cases of Figs. 4(a) and 4(c), the dynamical instability occurs as well as the mechanical instability, as shown Fig. 3(b). From the view point of instability, both results of the dynamical and mechanical instabilities seem to be consistent with each other. However, Fig. 4(b) shows that a negative frequency occurs at around the P-point. Therefore, when the fictitious charge is -1.0 , dynamical instability occurs although mechanical instability does not appear. This suggests that the analysis of dynamic instability provides more information than that of mechanical instability. Since the long-wavelength limit of lattice vibrations corresponds to uniform deformation of a whole system, phonon dispersion with a negative frequency at around the -point may lead to mechanical instability. However, the analysis of mechanical instability is not applicable to the analysis of instability of deformation characterized by finite wavelength such as that at the P-point. Therefore, the scope of dynamic instability is beyond that of mechanical instability.[23]
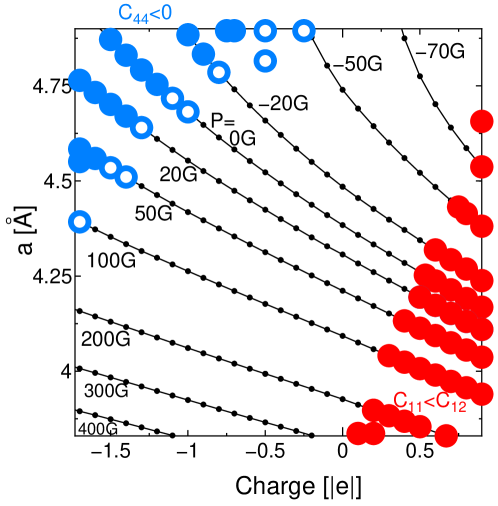
In Fig. 5, we show a phase diagram of C6. Here, the horizontal axis is the fictitious charge and the vertical axis is the lattice constant . In this figure, the lower right area with large red solid circles shows the mechanical instability characterized by the inequality . On the other hand, the upper left area with large blue solid circles shows the mechanical instability characterized by the inequality . In addition, large blue open circles represent the area indicating only dynamical instability, not mechanical instability.
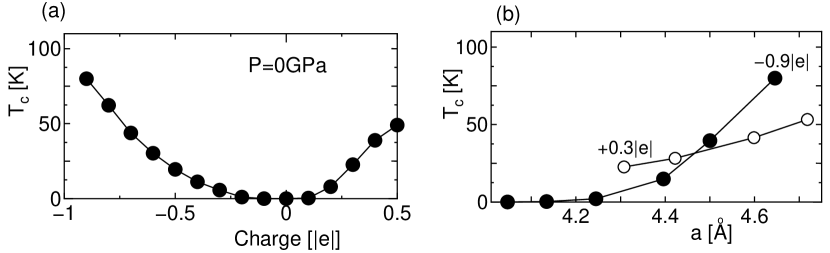
Although the doped C6 system is a fictitious model, it is interesting to calculate .[13] The result may become a good reference for considering the superconductivity of C6 systems. We show [25] as a function of the fictitious charge and the lattice constant for C6 in Fig. 6. Figure 6(a) indicates that increases with the absolute value of the fictitious charge. It also shows that reaches K at -0.9 , where is 1.94 and is 471 K. Figure 6(b) shows that increases with , and this tendency seems to be unrelated to the sign of the fictitious charge.

Next, we consider compounds of C6 combining carbon atoms and an atom. As a typical case, the results for compounds NaC6 and ClC6 are mainly shown. The optimum pressure for stabilizing the crystal structure depends on the kind of the atom in the compounds. For example, NaC6 is stable above 30 GPa, and ClC6 is stable even at 0 GPa, where is 4.43 in the former case and 4.62 in the latter case.
In Figs. 7(a) and 7(b), we show the electronic band structures of NaC6 at 30 GPa and ClC6 at 0 GPa. When the compound becomes a metal, the atom can be regarded as a dopant that brings carriers into C6. Here, NaC6 corresponds to the electron doping case and ClC6 is the hole doping case. The overall behavior of the band of NaC6 is similar to that of C6, as shown in Fig. 2(a). It suggests that the band structure is rigid against doping.
On the other hand, the band of ClC6 near is more complex than that of NaC6. It seems that carbon and Cl bands are mixed. Figures 7(c) and 7(d), show the density of states (DOS) of electrons for NaC6 and ClC6, which are displayed to correspond to each compound. They indicate that the contribution of Na to DOS at is almost zero, whereas that of Cl is large. For NaC6, the role of the Na atom is only to provide carriers to the system of C6. In the case of ClC6, the DOS of the Cl atom seems to occupy about half of the total DOS near . However, the overall behavior of DOS is roughly similar to that of NaC6. This suggests that the rigid band structure may also be valid for ClC6.
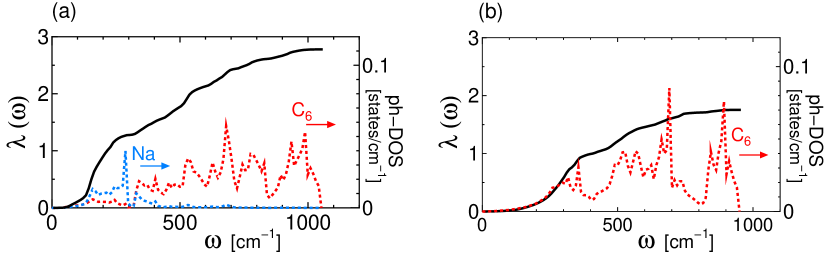
In Fig. 8, we show the electron-phonon coupling as a function of and phonon DOS for NaC6 at 30 GPa and C6 with -0.9 at 0 GPa. Here, , where is the electron-phonon spectral function. Figure 8(a) shows that the phonon spectrum is clearly divided into two parts: components of Na and C6 atoms. Furthermore, the contribution of phonons to is also divided into two parts, and the Na atom component is about half of the C6 atoms component. By comparing Figs. 8(a) and 8(b), we find that the phonon DOS are similar to each other except at low frequencies. This suggests that the presence of the Na atom does not significantly affect the phonon oscillations of the C6 structure. We obtained similar results for other compounds.
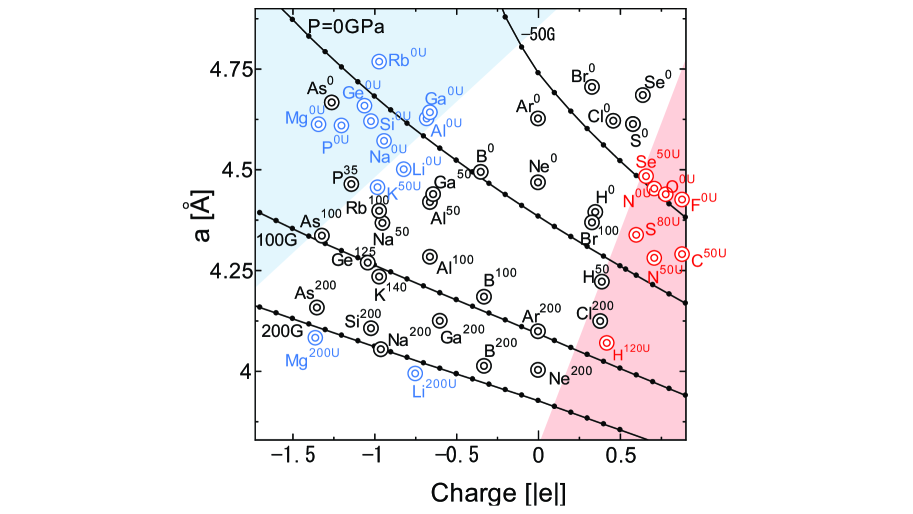
In Fig. 9, we show the phase diagram for C6, which corresponds to Fig. 5. The result is represented by a double circle with an atomic symbol. Here, the superscript of each symbol indicates the pressure in the unit of GPa, and the additional superscript ‘U‘ means its mechanical and/or dynamical instability. The horizontal axis is the value of effective charge introduced into the part of C6 and the vertical axis is lattice constant . The effective charge is calculated using the partial DOS of C6, as shown in Fig. 7(c) or 7(d). For example, by integrating the DOS from the bottom of the band to the point of , we obtain the absolute value of carriers introduced into the C6 part, which is regarded as negative charge.
In this figure, almost all C6 systems in the upper left area painted light blue are unstable[26]. Similarly, systems in the lower right area painted light red are also unstable. When pressure increases, the lattice constant decreases and the stability of heavily doped C6 near the blue area increases. On the other hand, most systems near the red area become unstable with increasing . Generally, this phase diagram is similar to that for C6 systems as shown in Fig. 5.
As shown in Figs. 6, we can expect that the necessary conditions for a higher are heavy doping and large . On the basis of such expectations, we show as a function of pressure in Fig. 10. It shows that some compounds that are located in the upper left or the upper right areas in Fig. 9 indicate relatively high-. In particular, of NaC6 and AlC6 is over 100 K at a relatively low pressure, and of ClC6 is K at 0 GPa. This result is almost consistent with a result of the previous works.[13, 14]
In summary, we investigated the mechanical and dynamical instabilities and superconductivity of C6 with a sodalite structure which is similar to a hydrogen compound showing HTS. The electronic states for the C6 structure with the fictitious charge and many compounds C6 were systematically examined by the first-principles calculations. We classified the stability and the superconductivity of C6 alone and C6 on the plane of the effective doping charge versus the lattice constant under external pressure. Although the hydrogen compounds with HTS require an extremely high pressure, the carbon compounds are stable at relatively low pressures, some even at . Electron-doped-like compounds such as NaC6 or AlC6 show of up to 100 K at GPa, and the results suggest that the sodalite structure of carbon may be a key to generating phonon-mediated HTS.
This work was supported by JSPS KAKENHI Grant Numbers JP15K05168 and JP19K03716.
References
- [1] N. W. Ashcroft, Phys. Rev. Lett. 21, 1748 (1968).
- [2] J. M. McMahon, M. A. Morales, C. Pierleoni, and D. M. Ceperley, Rev. Mod. Phys, 84, 1607 (2012).
- [3] Y. Li, J. Hao, Y. Li, and Y. Ma, J. Chem. Phys. 140, 174712 (2014).
- [4] A. P. Drozdov, P. P. Kong, V. S. Minkov, S. P. Besedin, M. A. Kuzovnikov, S. Mozaffari, L. Balicas, F. F. Balakirev, D. E. Graf, V. B. Prakapenka, E. Greenberg, D. A. Knyazev, M. Tkacz, and M. I. Eremets, Nature 569 528 (2019).
- [5] H. Wang, J. S. Tse, K. Tanaka, T. Iitaka, and Y. Ma, Proc. Natl. Acad. Sci. USA 109, 6463 (2012).
- [6] Y. Li, J. Hao, H. Liu, J. S. Tse, Y. Wang and Y. Ma, Sci. Rep. 5, 9948 (2015).
- [7] C. Heil, S. di Cataldo, G. B. Bachelet, and L. Boeri, Phys. Rev. B 99, 220502(R) (2019).
- [8] I. A. Troyan, D. V. Semenok, A. G. Kvashnin, A. G. Ivanova, V. B. Prakapenka, E. Greenberg, A. G. Gavriliuk, I. S. Lyubutin, V. V. Struzhkin, and A.R. Oganov, Adv. Mater. 33, 2006832 (2021).
- [9] P. P. Kong, V. S. Minkov, M. A. Kuzovnikov, S. P. Besedin, A. P. Drozdov, S. Mozaffari, L. Balicas, F.F. Balakirev, V. B. Prakapenka, E. Greenberg, D. A. Knyazev, and M. I. Eremets, Nat. Commun., 12 5075 (2021).
- [10] A. Kawano, H. Ishikawa, S. Iriyama, R. Okada, T. Yamaguchi, Y. Takano, and H. Kawarada, Phys. Rev. B 82, 085318 (2010).
- [11] Y. Ma, J. S. Tse, T. Cui, D. D. Klug, L. Zhang, Y. Xie, Y. Niu, and G. Zou, Phys. Rev. B 72, 014306 (2005).
- [12] A. Pokropivny and S. Volz, Phys. Status Solidi B 249, 1704 (2012).
- [13] S. Lu, H. Liu, I. I. Naumov, S. Meng, Y. Li, J. S. Tse, B. Yang, and R. J. Hemley, Phys. Rev. B 93, 104509 (2016). See also their supplemental materials.
- [14] N. S. Khan, B. R. Rano, I. M. Syed, R. S. Islam, and S. H. Naqib, Results in Physics 33, 105182 (2022).
- [15] Q. Wei, Q. Zhang, and M. Zhang, Materials 9, 726 (2016).
- [16] W. L. McMillan, Phys. Rev. 167, 331 (1968).
- [17] P. B. Allen and R. C. Dynes, Phys. Rev. B 12, 905 (1975).
- [18] P. Giannozzi, S. Baroni, N. Bonini, M. Calandra, R. Car, C. Cavazzoni, D. Ceresoli, G. L. Chiarotti, M. Cococcioni, I. Dabo, A. Dal Corso, S. Fabris, G. Fratesi, S. de Gironcoli, R. Gebauer, U. Gerstmann, C. Gougoussis, A. Kokalj, M. Lazzeri, L. Martin-Samos, N. Marzari, F. Mauri, R. Mazzarello, S. Paolini, A. Pasquarello, L. Paulatto, C. Sbraccia, S. Scandolo, G. Sclauzero, A. P. Seitsonen, A. Smogunov, P. Umari, and R. M. Wentzcovitch, J. Phys. Condens. Matter 21, 395502 (2009).
- [19] https://dalcorso.github.io/thermo_pw/
- [20] A. Subedi and L. Boeri, Phys. Rev. B 84, 020508(R) (2011).
- [21] K. Sano, M. Seo, and K. Nakamura, J. Phys. Soc. Jpn. 88, 093703 (2019).
- [22] M. Born, Math. Proc. Cambrige Philos. Soc. 36, 160 (1940).
- [23] G. Grimvall, B. Magyari-Kőpe, V. Ozoliņs̆, and K. A. Persson, Rev. Mod. Phys. 84, 945 (2012).
- [24] F. Mouhat and F. Coudert, Phys. Rev. B 90, 224104 (2014).
- [25] The transition temperature is calculated using the Allen and Dynes formulation[17] for , where the screened Coulomb potential parameter is set to as a typical value.
- [26] As shown in Fig. 9, AsC6 is stable at even in the blue area and it seems to be an exception. Furthermore, our analysis based on Fig.5 does not seem to be appropriate for C6, where is Li, Mg, or another alkaline earth metal(not shown). Probably, these elements have a significant effect on C6 in addition to the effect of doping.