The frequency of gaseous debris discs around white dwarfs
Abstract
1 – 3 per cent of white dwarfs are orbited by planetary dusty debris detectable as infrared emission in excess above the white dwarf flux. In a rare subset of these systems, a gaseous disc component is also detected via emission lines of the Ca ii 8600 Å triplet, broadened by the Keplerian velocity of the disc. We present the first statistical study of the fraction of debris discs containing detectable amounts of gas in emission at white dwarfs within a magnitude and signal-to-noise limited sample. We select 7705 single white dwarfs spectroscopically observed by the Sloan Digital Sky Survey (SDSS) and Gaia with magnitudes 19. We identify five gaseous disc hosts, all of which have been previously discovered. We calculate the occurrence rate of a white dwarf hosting a debris disc detectable via Ca ii emission lines as 0.067 per cent. This corresponds to an occurrence rate for a dusty debris disc to have an observable gaseous component in emission as 4 per cent. Given that variability is a common feature of the emission profiles of gaseous debris discs, and the recent detection of a planetesimal orbiting within the disc of SDSS J122859.93+104032.9, we propose that gaseous components are tracers for the presence of planetesimals embedded in the discs and outline a qualitative model. We also present spectroscopy of the Ca ii triplet 8600 Å region for 20 white dwarfs hosting dusty debris discs in an attempt to identify gaseous emission. We do not detect any gaseous components in these 20 systems, consistent with the occurrence rate that we calculated.
keywords:
white dwarfs – Circumstellar matter – accretion, accretion discs – line: profiles.1 Introduction
It is well established that remnant planetary systems exist around white dwarfs; betrayed by the photospheric metal contamination of a large number of these stellar remnants (Zuckerman et al., 2010; Koester et al., 2014; Hollands et al., 2017; Barstow et al., 2014; Schreiber et al., 2019). The time-scale on which material sinks through the atmosphere of a warm, hydrogen-rich (DA) white dwarf and becomes unobservable is on the order of days to years, and therefore this atmospheric pollution needs to be sustained by ongoing accretion to remain detectable (Koester, 2009; Wyatt et al., 2014). The generally accepted framework explaining the pollution of white dwarfs below 30 000 K is the tidal disruption of a planetesimal (Debes & Sigurdsson, 2002; Jura, 2003), which forms a dusty debris disc that is subsequently accreted by the white dwarf (Veras et al., 2014, 2015; Malamud & Perets, 2019a, b). The thermal infrared emission of such dusty debris discs (Graham et al., 1990) has been detected at 37 metal polluted white dwarfs as an infrared excess above the white dwarf continuum (Zuckerman & Becklin, 1987; Vanderburg et al., 2015; Rocchetto et al., 2015; Barber et al., 2016; Dennihy et al., 2016). In a subset of these systems, gaseous debris has also been observed that is co-orbital with the dust (Melis et al., 2010). This gaseous material has so far been detected in seven systems (Gänsicke et al., 2006, 2007; Gänsicke et al., 2008; Gänsicke, 2011; Farihi et al., 2012; Melis et al., 2012; Wilson et al., 2014), via the Doppler-broadened, double-peaked line emission of the Ca ii 8600 Å triplet, which results from the Keplerian rotation of a flat disc (Horne & Marsh, 1986) that is photoionised by the white dwarf (Melis et al., 2010; Kinnear, 2011; Gänsicke et al., 2019).
In addition, five white dwarfs have been found to host gas that is detected via circumstellar absorption features (Koester & Wilken, 2006; Debes et al., 2012; Gänsicke et al., 2012; Vennes & Kawka, 2013; Koester et al., 2014; Vanderburg et al., 2015; Xu et al., 2016). However, the spatial extent of the circumstellar gas has so far only been constrained for one of these five systems (WD 1145+017, Hallakoun et al. 2017; Cauley et al. 2018; Izquierdo et al. 2018; Xu et al. 2019b; Fortin-Archambault et al. 2019), which does not appear to be co-orbital with the dusty debris. The detection of circumstellar absorption features is not correlated with the presence of emission lines from gaseous disc components, suggesting the mechanisms that generates both phenomena are independent. In this work, we therefore focus on the systems showing double-peaked emission lines from a circumstellar gaseous disc, and henceforth refer to those simply as gaseous discs.
The gas producing emission co-orbits with the dust and several mechanisms to generate gaseous components have been proposed, including runaway gas production from dust sublimating at the inner edge of the debris disc (Rafikov, 2011a; Metzger et al., 2012), collisional cascades of solid material being ground into dust and gas (Kenyon & Bromley, 2017a, b), and planetesimals stirring up the disc (Manser et al., 2019). A knowledge of the occurrence rate of the gaseous components in emission to these discs will allow constraints to be placed on the formation and evolution of debris discs at white dwarfs (Rafikov, 2011a; Metzger et al., 2012), and possibly the incidence of closely orbiting planetesimals at white dwarfs (Manser et al., 2019).
Throughout the last decade sufficiently large and unbiased samples of white dwarfs have been established to determine the occurrence rate of (i) observable dust discs around, and (ii) photospheric pollution of white dwarfs, as 1 – 3 per cent and 25 – 50 per cent, respectively (Zuckerman et al., 2003; Farihi et al., 2009; Zuckerman et al., 2010; Girven et al., 2011; Koester et al., 2014; Rocchetto et al., 2015; Wilson et al., 2019; Rebassa-Mansergas et al., 2019). However, the prevalence of detectable gaseous components in emission to these debris discs is so far unconstrained. Simply taking the number of the currently known gaseous components (seven) and dusty debris discs (37) suggests an occurrence rate of 19 per cent, which is, however erroneous due to the different observational biases in the detection of the dusty and gaseous components.
In this paper we present the first statistical study of the frequency of debris discs that host gaseous emission, using a magnitude and signal-to-noise (S/N) limited Gaia/Sloan Digital Sky Survey (SDSS) sample of 7705 white dwarfs. We searched the SDSS spectroscopy for Ca ii triplet emission and determined the percentage of white dwarfs that host an observable gaseous debris disc as 0.067 per cent. This corresponds to an occurrence rate for a dusty debris disc detected as an infrared excess to also have an observable gaseous component as 4 per cent. We also present spectroscopy of the Ca ii triplet region for 20 white dwarfs known to host dusty discs, some of which have no published observations of the Ca ii triplet, and we do not detect a gaseous disc component in any of these systems.
2 Searching for gaseous debris discs in SDSS spectroscopy
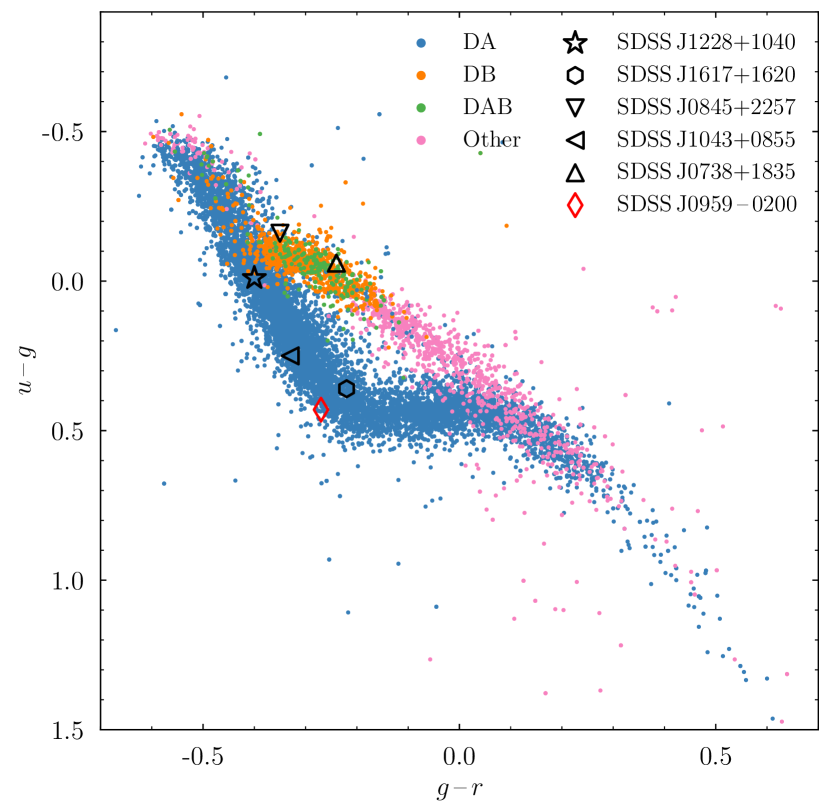
The SDSS has been taking multi-band photometry and multi-fibre spectroscopy since 2000, using a 2.5 m telescope located at the Apache Point Observatory in New Mexico (Gunn et al., 2006). Gentile Fusillo et al. (2019) published a sample of spectroscopically observed white dwarfs combining the astrometry of Gaia and the large number of spectra obtained by SDSS (Gaia Collaboration et al., 2018). We extract from this Gaia/SDSS catalogue a magnitude limited sample of single white dwarfs with 19 that contains 9374 white dwarfs with 14 040 spectra ( 38 per cent of white dwarfs in the sample have more than one spectrum). Figure 1 shows this sample of white dwarfs in the – vs. - colour-colour space.
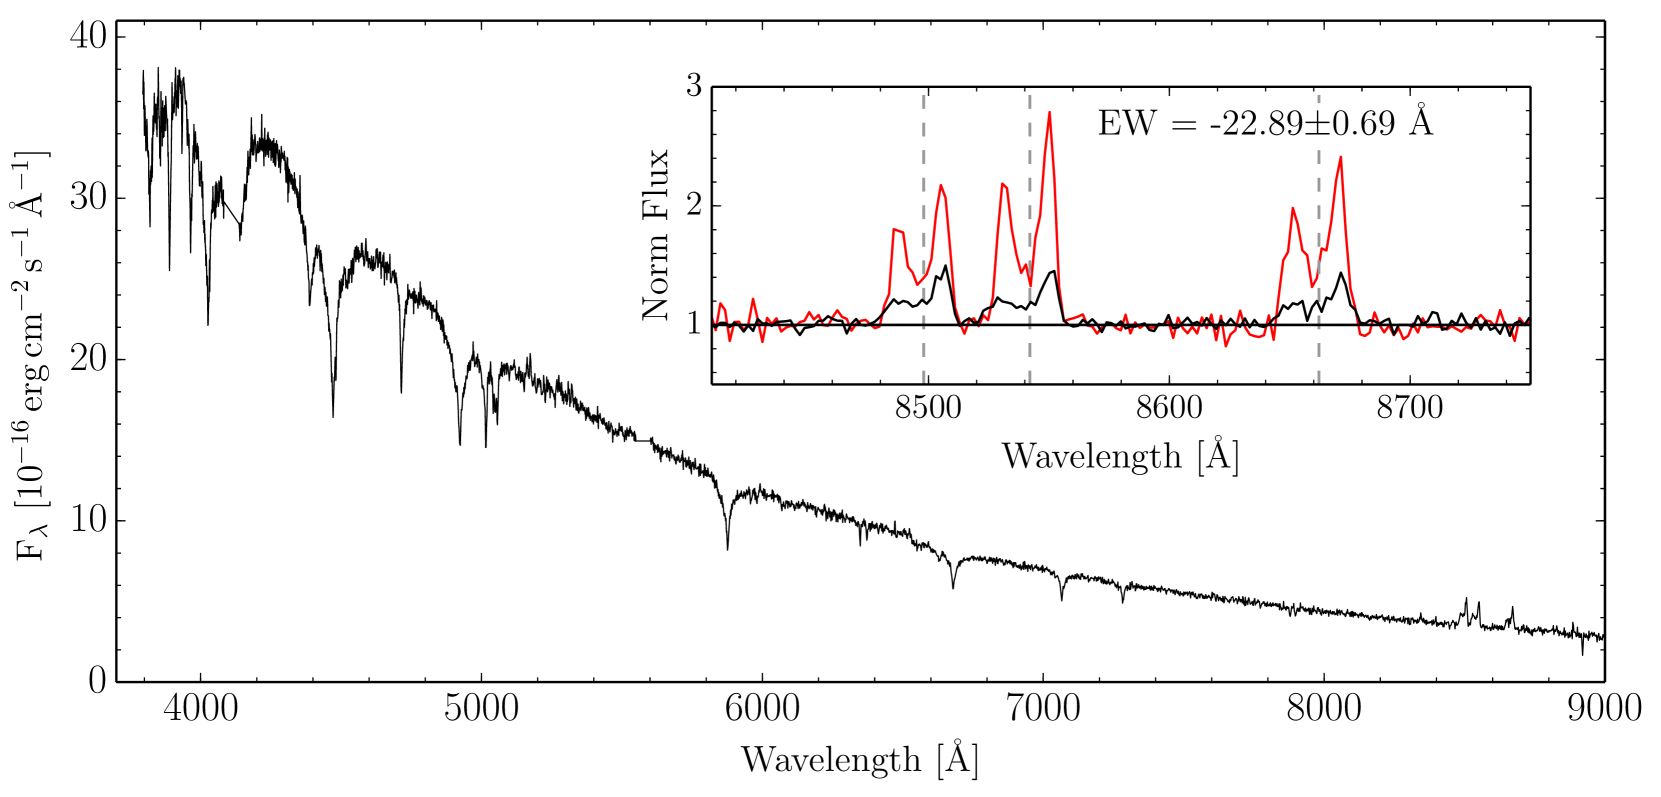
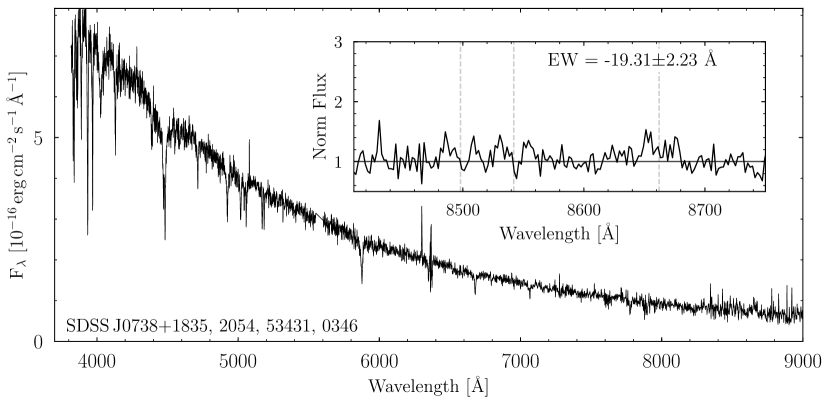
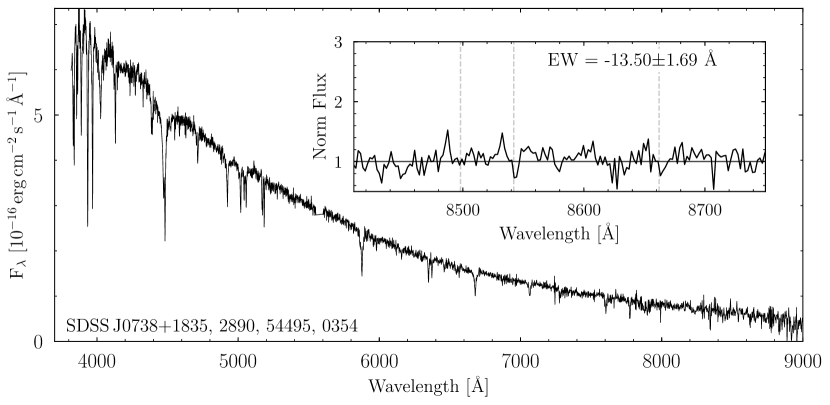
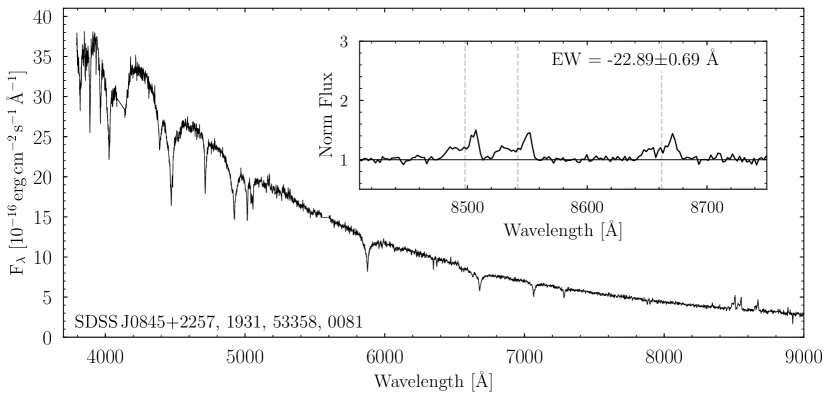
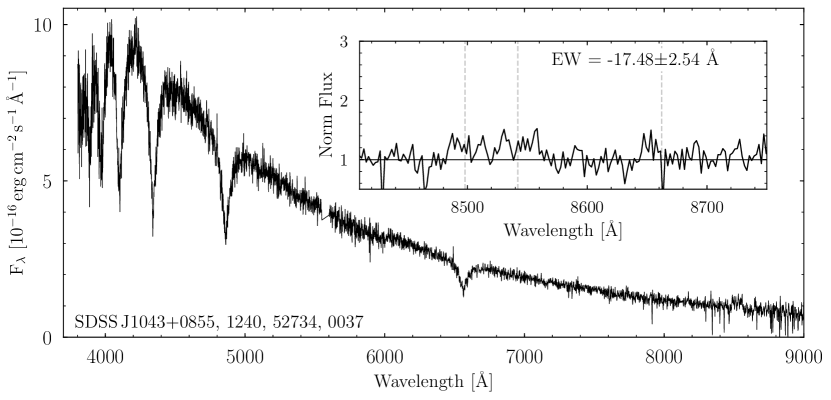
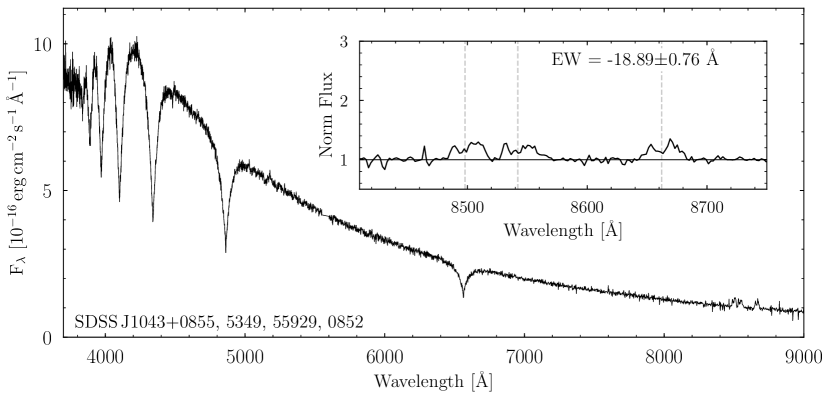
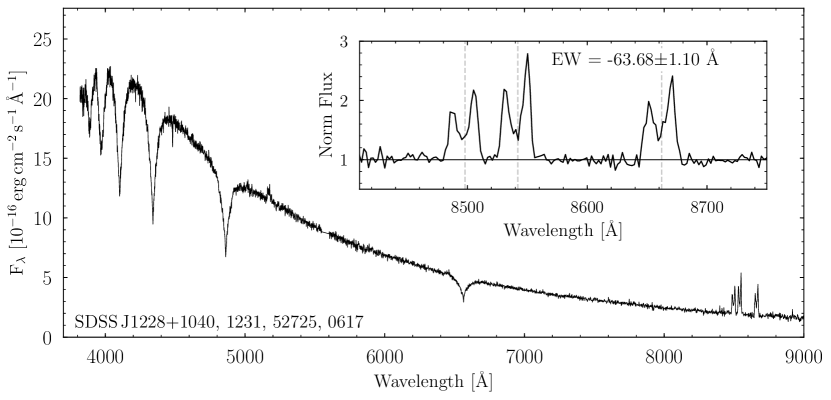
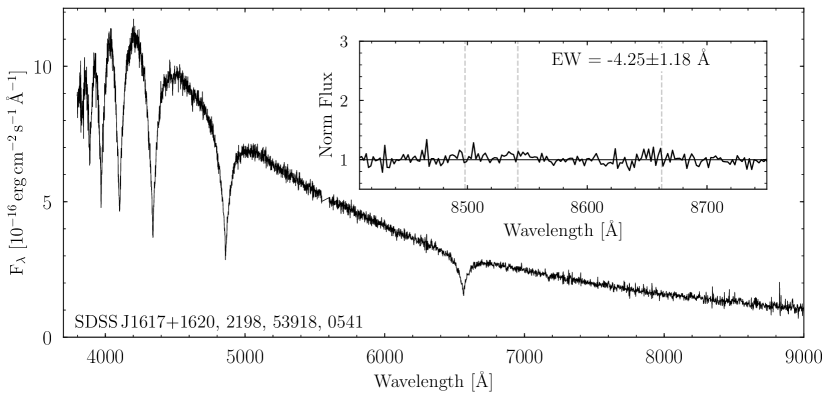
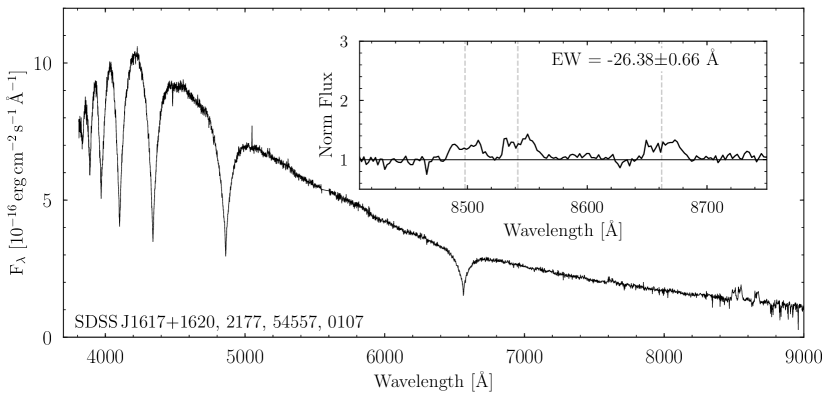
We probed for the presence of gaseous emission by calculating the equivalent width (EW, a negative value corresponds to an emission feature) of the Ca ii triplet region between 8450 Å and 8700 Å, selecting spectra that satisfy 3, where is the uncertainty on the EW measurement. While this method allows us to quantitatively inspect the sample, it is subject to poor sky subtraction and other observational artefacts which can contaminate the Ca ii triplet region. As such, we also visually inspected the continuum normalised Ca ii triplet 8600 Å region of all 14 040 spectra in our sample to probe for the presence of emission. An example spectrum is shown in Figure 2 with the Ca ii triplet region highlighted as an inset. After inspecting the entire spectroscopic sample we recovered the five known gaseous debris disc hosts in our sample222The white dwarf SDSS J1144+0529 is also present in our sample which was identified by Guo et al. (2015) as hosting a gaseous debris disc. However, follow-up spectroscopy shows the emission lines to be radial-velocity variable, implying that it is a short-period binary containing a white dwarf and a low-mass companion (Florez et al. in prep), and we therefore exclude this system from the further discussion.: SDSS J073842.57+183509.6, SDSS J084539.17+225728.0, SDSS J104341.53+085558.2, SDSS J122859.93+104032.9, and SDSS J161717.04+162022.4 (henceforth SDSS J0738+1835, SDSS J0845+2257, SDSS J1043+0855, SDSS J1228+1040, and SDSS J1617+1620 respectively), but did not find any new systems (see Figure 6 for all eight spectra of the five gaseous debris disc systems).
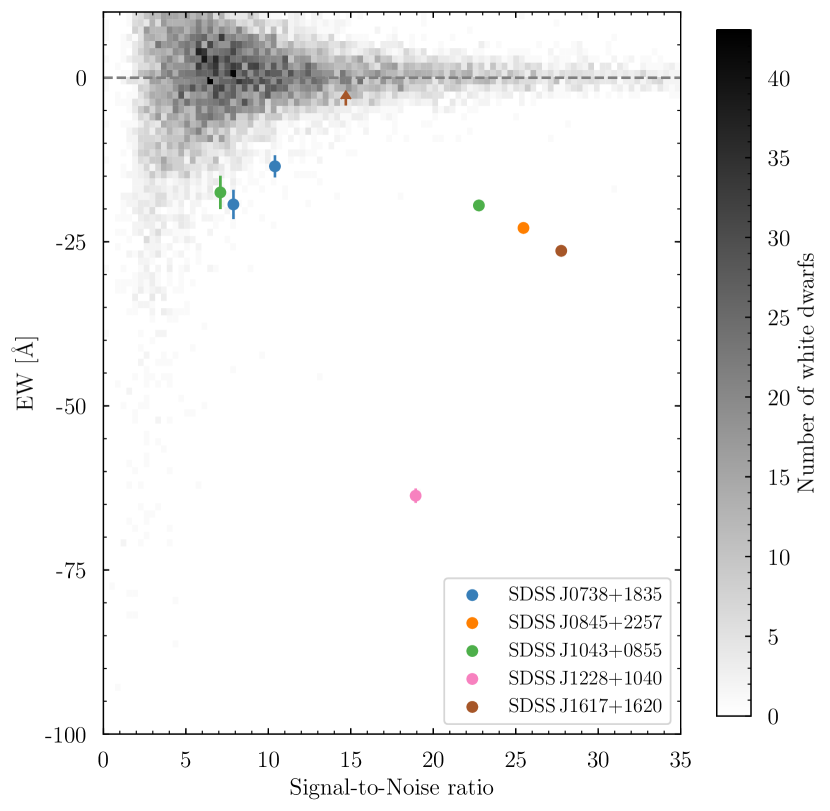
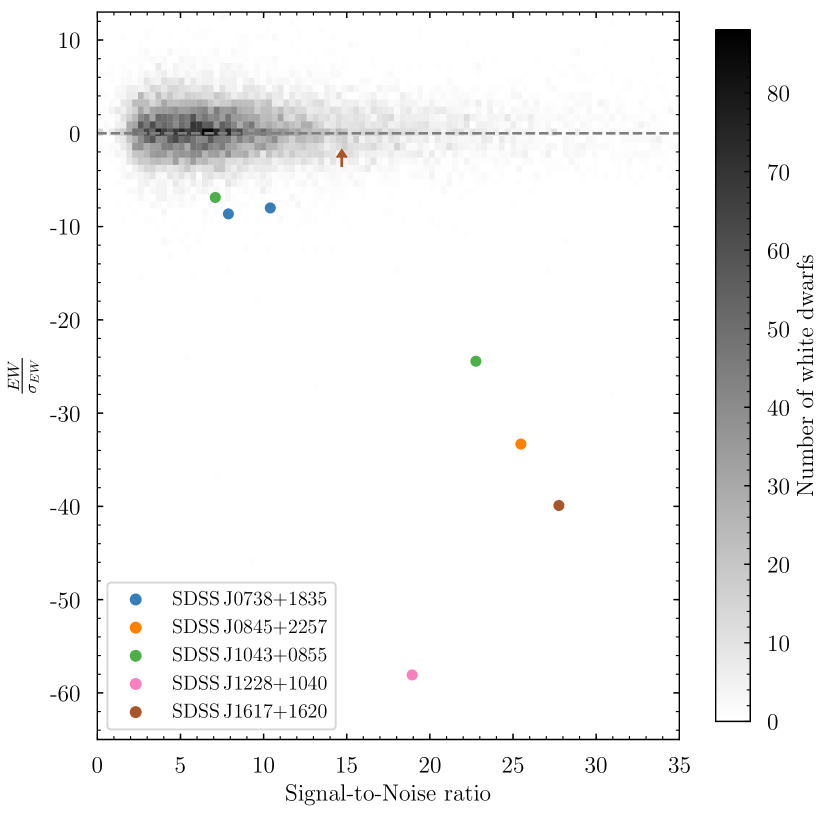
Figure 3 shows the distribution of EW and against the signal-to-noise ratio (S/N) of the Ca ii triplet region for our white dwarf sample with S/N 35. Roughly 38 per cent of the white dwarfs in our Gaia/SDSS sample have multiple spectra, and repeat observations are included in Figure 3. Measurements from spectra with detected gaseous emission are shown as filled colour circles. The non-detection of gaseous emission in one of the two spectra available for SDSS J1617+1620 is indicated by the arrow, and was the first of the two spectra obtained for this object 333SDSS J1617+1620 is the only system that shows a dramatic change in the EW of the Ca ii triplet where the SDSS spectra reveals a large increase in the EW. Subsequent follow-up observations recorded a gradual decrease in the EW of the Ca ii profile over 8 yr (for more details see Wilson et al. 2014). Variations in the morphology of the Ca ii triplet feature are seen in all other gaseous debris discs with long-term monitoring and is discussed later.. Four gaseous disc observations are clearly separated from the bulk of the white dwarf spectra: SDSS J1228+1040, SDSS J1043+0855, SDSS J0845+2257; the first three of such discs discovered (Gänsicke et al., 2006, 2007; Gänsicke et al., 2008), and SDSS J1617+1620 (Wilson et al., 2014).
The spread in EW values is extremely large at low S/N values due to noise (compare the left and right panels of Figure 3), but rapidly tightens as the S/N increases, making it trivial to identify genuine emission features such as SDSS J1228+1040. Closer to the bulk EW distribution, it becomes difficult to detect Ca ii triplet emission such as that of SDSS J0738+1835 and SDSS J1043+0855 (see Figure 6 for the EW values). We therefore chose to limit the sample used for the following statistical analysis to spectra with S/N 5, wherein if there were any additional emission features with an EW similar to the gaseous debris discs in our sample we should have detected them. Assuming that we can only detect gaseous emission in the spectra of systems above S/N 5, the number of white dwarfs in our sample reduces to 7705, which we use for the calculations in the next section.
2.1 The occurrence rate of gaseous discs at white dwarfs
We find no new gaseous discs in our magnitude and S/N limited Gaia/SDSS sample, resulting in a total of five detected gaseous components to debris discs out of 7705 systems. Using Bayes’ theorem we calculate the probability distribution, , of an occurrence rate, , of a gaseous debris disc at a white dwarf, given detections out of systems as
| (1) |
where is the binomial distribution, is the prior distribution of , and is the probability distribution of detecting gaseous disc hosts out of systems which is a constant. We assume an uninformative prior distribution known as the Jeffreys prior (Jeffreys, 1946), which for the binomial distribution is
| (2) |
where is the beta function. Substituting this prior into Equation 1 results in
| (3) |
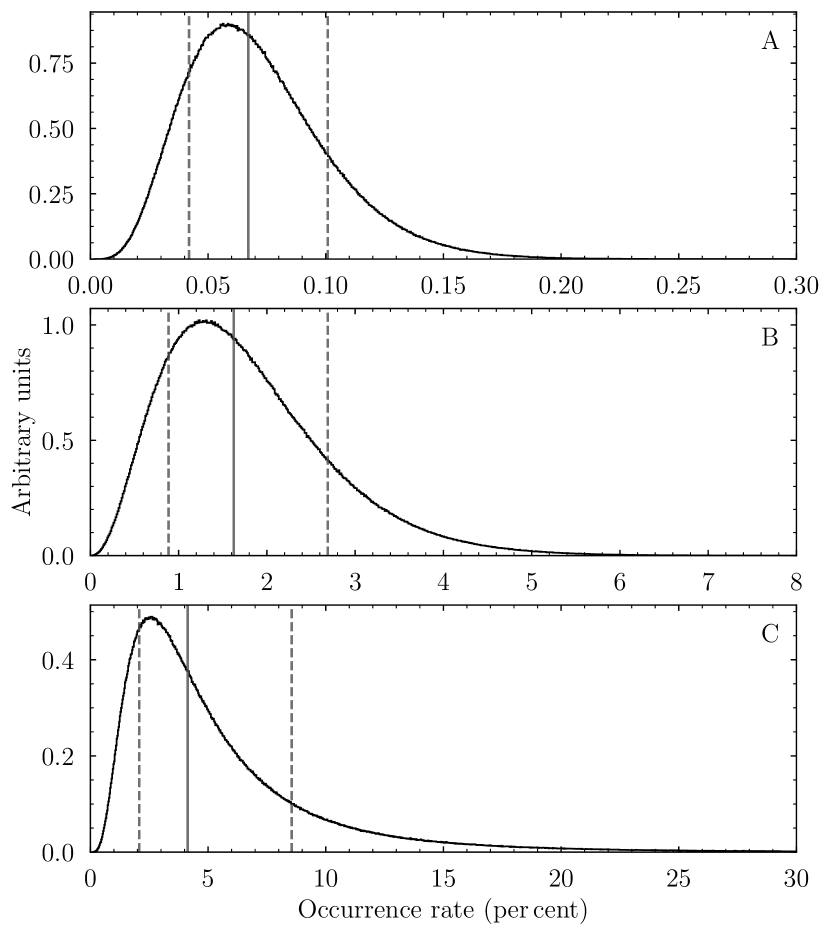
Taking the median and 1 intervals of this probability distribution (which is independent of the proportionality constant) with , and , we find that 0.067 per cent of white dwarfs host a debris disc with a detectable gaseous component (Figure 4 A). This is significantly lower than the occurrence rate of detectable dust discs around white dwarfs, which has been estimated by various studies to be 1–3 per cent (Farihi et al., 2009; Girven et al., 2011; Rocchetto et al., 2015; Wilson et al., 2019; Rebassa-Mansergas et al., 2019). For further discussion, we adopt the estimate of Wilson et al. (2019), 1.5 per cent, calculated using an unbiased sample of 195 white dwarfs observed with Spitzer containing three dusty debris discs. We note, however, that using Equation 3 with and , we obtain a slightly different occurrence rate of 1.6 per cent, and the probability distribution of this occurrence rate is shown in Figure 4 B. These two occurrence rates of dusty debris discs at white dwarfs are in agreement, and the difference results from the choice of the prior distribution. We use the result calculated in this manuscript in our next steps for internal consistency within our analysis. If we assume that systems with a gaseous component in emission are a subset of the systems that host dusty debris, then the ratio of the two distributions representing the dusty (Figure 4 A) and the gaseous (Figure 4 B) provides the probability distribution for the occurrence rate of a debris disc to host a gaseous component in emission (Figure 4 C). By taking the median value and 1 intervals of the distribution in Figure 4 C, we determine that 4 per cent of dusty debris discs should also host a detectable gaseous component. This value is a factor of a few smaller than the value of 19 per cent, which is obtained from simply taking the ratio of known gas (7) to dust ( 37) discs around metal polluted white dwarfs. This is due to the fact that all five stars in our sample that have Ca ii triplet emission were discovered from their SDSS spectra, and their infrared emission was only detected after the identification of the gaseous discs in targeted, deep Spitzer observations (Brinkworth et al., 2009; Dufour et al., 2010; Brinkworth et al., 2012).
3 Observations of debris discs
An independent assessment of the fraction of dusty debris discs also having a gaseous component can be obtained from inspecting the known sample of white dwarfs with circumstellar dust discs detected by an infrared excess, and corroborated by the detection of photospheric metal contamination. This requires red spectroscopy covering the Ca ii 8600 Å triplet region, probing for emission lines. Table 1 lists 37 white dwarf systems where a dusty debris disc has been confirmed. For completeness, we also list five candidate debris disc systems, however we do not include those in the statistical analysis. This sample includes five white dwarfs that were observed by Spitzer only because they were identified to have Ca ii triplet emission (see Table 1); a clear indicator for the presence of a disc. Without the detection of a gaseous disc, based on optical spectroscopy, these systems would have not been observed with Spitzer (i.e. these observations were obtained after already knowing that these systems harbour a debris disc). These observations are clearly biased, and we therefore remove these five gaseous debris discs from our sample, reducing the number of systems included to 32. White dwarfs being blue objects with, usually, no features of interest red-ward of H, it is unsurprising that only 17 of the remaining 32 confirmed dusty debris discs around metal polluted white dwarfs have published spectroscopy covering the Ca ii triplet region.
| WD | Alternate name | Telescope/Instrument | Date | Exposure time [s] | Gaseous emission | Ref. |
| 0010+280 | PG 0010+281 | No | 1, 2, 3 | |||
| 0106–328 | HE 0106–3253 | SOAR/GHTS | 2017 - 08 - 26 | 2400 | No | 4, 5 |
| 0110–565 | HE 0110–5630 | SOAR/GHTS | 2017 - 08 - 26 | 2400 | No | 5, 6 |
| 0146+187 | GD 16 | WHT/ISIS | 2011 - 12 - 07 | 4500 | No | 7, 8 |
| 0300–013 | GD 40 | WHT/ISIS | 2011 - 12 - 07 | 6600 | No | 5, 9 |
| 0307+077 | HS 0307+0746 | WHT/ISIS | 2011 - 12 - 06 | 4500 | No | 4 |
| 0408–041 | GD 56 | WHT/ISIS | 2011 - 12 - 07 | 4200 | No | 9 |
| 0420+520 | KPD 0420+5203 | Unknown | 1 | |||
| 0435+410 | GD 61 | WHT/ISIS | 2011 - 12 - 07 | 2700 | No | 6 |
| 0735+187 | SDSS J0738+1835 | Yes | 10, 11 | |||
| 0842+231 | SDSS J0845+2257 | Yes | 12, 13 | |||
| - | EC 05365–4749 | SOAR/GHTS | 2017 - 08 - 26 | 3000 | No | 14 |
| 0843+516 | PG 0843+517 | WHT/ISIS | 2011 - 12 - 06 | 3600 | No | 15 |
| 0956–017 | SDSS J0959-0200 | Yes | 16, 17 | |||
| 1015+161 | PG 1015+161 | WHT/ISIS | 2011 - 12 - 08 | 3000 | No | 9 |
| 1018+410 | PG 1018+411 | No | 17, 18 | |||
| 1041+091 | SDSS J1043+0855 | Yes | 13, 19 | |||
| 1116+026 | GD 133 | WHT/ISIS | 2011 - 12 - 07 | 2700 | No | 9 |
| 1145+017 | LBQS 1145+0145 | No | 20, 21 | |||
| 1150–153 | EC 11507–1519 | WHT/ISIS | 2011 - 12 - 07 | 3600 | No | 22 |
| 1219+130 | SDSS J1219+1244 | No | 16, 23 | |||
| 1225–079 | PG 1225–079 | No | 3, 24 | |||
| 1226+110 | SDSS J1228+1040 | Yes | 25, 26 | |||
| 1349–230 | HE 1349–2305 | Yes | 5, 27 | |||
| 1455+298 | G 166-58 | WHT/ISIS | 2017 - 06 - 28 | 1800 | No | 28 |
| 1457–086 | PG 1457–086 | WHT/ISIS | 2010 - 07 - 24 | 2700 | No | 7 |
| 1541+650 | PG 1541+651 | WHT/ISIS | 2017 - 04 - 02 | 1800 | No | 29 |
| 1551+175 | KUV 15519+1730 | No | 18, 30 | |||
| 1554+094 | SDSS J1557+0916 | No | 14, 23 | |||
| 1615+164 | SDSS J1617+1620 | Yes | 10, 13 | |||
| 1729+371 | GD 362 | WHT/ISIS | 2006 - 07 - 01 | 900 | No | 31 |
| 1929+011 | GALEX J1931+0117 | No | 32, 33 | |||
| 2115–560 | LAWD 84 | No | 6, 34 | |||
| 2132+096 | HS 2132+0941 | WHT/ISIS | 2016 - 10 - 29 | 1800 | No | 32 |
| 2207+121 | SDSS J2209+1223 | No | 14, 18 | |||
| 2221–165 | HE 2221–1630 | WHT/ISIS | 2017 - 06 - 28 | 1800 | No | 4 |
| 2326+049 | G 29-38 | WHT/ISIS | 2016 - 10 - 29 | 1800 | No | 35 |
| 0145+234 | Mrk 362 | Unknown | 36 | |||
| - | LSPM J0207+3331 | Unknown | 30 | |||
| 0246+734 | EGGR 474 | No | 32 | |||
| 0950–572 | NLTT 22825 | Unknown | 1 | |||
| 2328+107 | PG 2328+108 | WHT/ISIS | 2016 - 10 - 29 | 1800 | No | 37 |
These systems already have published spectra covering the Ca ii triplet region.
Gaseous Ca ii triplet emission from the discs in our sample were identified prior to the detection of an infrared excess.
System falls in the SDSS footprint, but does not have SDSS spectroscopy.
References:
(1) Barber et al. (2016)
(2) Xu et al. (2015)
(3) Xu et al. (2019a)
(4) Farihi et al. (2010)
(5) Dennihy et al. (2017)
(6) Girven
et al. (2012)
(7) Farihi
et al. (2009)
(8) Gentile Fusillo
et al. (2017)
(9) Jura
et al. (2007b)
(10) Gänsicke (2011)
(11) Dufour
et al. (2010)
(12) Gänsicke
et al. (2008)
(13) Brinkworth
et al. (2012)
(14) Dennihy et al. (2016)
(15) Xu &
Jura (2012)
(16) Girven et al. (2011)
(17) Farihi et al. (2012)
(18) Gentile Fusillo et al. (2015)
(19) Gänsicke et al. (2007)
(20) Vanderburg
et al. (2015)
(21) Xu
et al. (2016)
(22) Jura
et al. (2009)
(23) Zuckerman et al. (2003)
(24) Klein et al. (2011)
(25) Gänsicke et al. (2006)
(26) Brinkworth et al. (2009)
(27) Melis
et al. (2012)
(28) Farihi
et al. (2008)
(29) Barber et al. (2012)
(30) Debes
et al. (2019)
(31) Jura et al. (2007a)
(32) Bergfors et al. (2014)
(33) Vennes
et al. (2010)
(34) Swan
et al. (2019b)
(35) Zuckerman &
Becklin (1987)
(36) Wang
et al. (2019)
(37) Rocchetto et al. (2015)
To rectify this, we obtained spectroscopy of 20 white dwarfs with an infrared excess (five of which had been previously observed) using the Intermediate dispersion Spectrograph and Imaging System (ISIS) on the William Herschel telescope (WHT), and the Goodman High Throughput Spectrograph (GHTS) on the Southern Astrophysical Research Telescope (SOAR). The details of the observations are listed in Table 1. The WHT spectra were reduced using standard spectroscopic techniques, i.e. bias-subtraction, flat-fielding, sky-subtraction, and optimal-extraction of the 1D spectra. These were achieved using the kappa, figaro, and pamela packages within the starlink software distribution. The resulting 1D spectra were then wavelength calibrated (CuNe+CuAr arc-lamps) and flux calibrated using molly444Molly software can be found at http://deneb.astro.warwick.ac.uk/phsaap/software/molly/html/INDEX.html. SOAR spectroscopic data were reduced using iraf’s noao package. The frames were first bias-subtracted, and flattened with a quartz lamp flat. We subtracted the background and extracted the spectra with the apall task, and finally performed wavelength calibration with a CuHeAr lamp spectrum extracted with the same aperture. The normalised spectra of the Ca ii region are shown in Figure 5. None of the 20 white dwarfs we observed show the characteristic Ca ii emission profiles in the 8600 Å region. We note that WD 0146+187, WD 0435+410, WD 1729+371, and WD 2326+049 do show photospheric Ca ii triplet absorption due the metal pollution of the white dwarf atmosphere.
Including our observations WD 0420+520 is the only confirmed planetary debris disc system without a published spectrum of the Ca ii triplet, and we therefore remove it from our sample leaving 31 systems. Our sample contains white dwarfs that have both (i) been initially identified as having a dusty disc, and (ii) follow-up spectroscopy of the Ca ii triplet region, which we use to calculate an independent measure of the occurrence rate of observable gaseous components to debris discs (see Table 1). The sample contains two gaseous debris discs; SDSS J0959–0200 and HE 1349–2305, and using Eqn. 3 with and , we determine an occurrence rate of a detectable gaseous component in emission among dusty debris discs as 7 per cent which it is consistent with the occurrence rate we determined in Section 2.1 of 4 per cent.
4 Discussion
The majority of gaseous components to debris discs with long-term monitoring show similar morphological variations of their line profiles on time-scales of years to decades (Wilson et al., 2015; Manser et al., 2016a; Manser et al., 2016b; Dennihy et al., 2018). The line profile variations of the gaseous disc at SDSS J1228+1040 have been interpreted as arising from a fixed, eccentric intensity pattern that slowly precesses with a period of 27 yr (Manser et al., 2016a). Short cadence observations of the Ca ii triplet at SDSS J1228+1040 also show 3 – 4 per cent variability in the strength of emission on a 2 hr period generated by a planetesimal with high internal strength orbiting within the Roche radius (Manser et al., 2019). In contrast, the emission from the disc at HE 1349–2305 precesses on a significantly shorter time-scale of 1.4 yr (Dennihy et al., 2018). The Ca ii triplet emission from SDSS J0845+2257 and SDSS J1043+0855 show similar morphological variations on a roughly decadal time-scale thought to be produced by apsidal precession, although they have not yet been shown to be periodic (Gänsicke et al., 2008; Wilson et al., 2015; Manser et al., 2016b).
The order-of-magnitude difference between the time-scales of variability seen at these systems is not yet understood, but their similar behaviour points to a common underlying mechanism. The gas emission profiles allow constraints to be placed on the radial extent of the gaseous debris, which show that they are all co-orbital with the dusty debris in the disc (Brinkworth et al., 2009; Melis et al., 2010).
Several models have been proposed to explain the presence of a gaseous component to debris discs that is co-orbital with the dusty component. Rafikov (2011a) and Metzger et al. (2012) proposed that the production of gas at the sublimation radius will lead to gas spreading both inwards towards the white dwarf and outwards into the debris disc due to angular momentum exchange. The outward moving gas will cause the dust particles in the disc to experience aerodynamic drag, which enhances the rate at which dust particles are fed past the sublimation radius. This leads to a runaway process where large amounts of gas are produced and the accretion rate onto the white dwarf increases by orders of magnitude. However, an important problem with this model is that gas which is co-orbital with dust should condense back into dust and therefore be depleted over several hundred orbital time-scales (Metzger et al., 2012). Consequently, without a mechanism that maintains sufficient amounts of material streaming radially outwards in the gaseous phase, a runaway process cannot be achieved.
Kenyon & Bromley (2017b) outline a model where a collisional cascade of solid material vaporised within the Roche limit of a white dwarf can feed a gaseous component of a debris disc (see also Kenyon & Bromley 2017a). This model can explain the presence of gaseous material co-orbital with dusty debris, in addition to the accretion rates observed at white dwarfs with debris discs, but it cannot elucidate why we only detect gas in a subset of debris discs.
No process has been proposed that explains the combined rarity, eccentricity, and (periodic in two cases) variability seen in most of the gaseous components of debris discs. We hypothesise here that these components are generated by collisions induced by a planetesimal on a close-in eccentric orbit around the white dwarf (Jura, 2008; Farihi et al., 2009; Manser et al., 2019). It is possible that the planetesimal is also perturbing dust out of a flat disc geometry, where the dust is no longer shielded within the disc, is subject to sublimation by direct irradiation from the white dwarf (Rafikov & Garmilla, 2012). This process could also lead to variations in the infrared luminosity of the dusty component of debris discs around white dwarfs through dust production and destruction (e.g. see Farihi et al. 2018 for an in-depth discussion). Such infrared luminosity variations have been seen at a number of debris discs around white dwarfs (Xu & Jura, 2014; Farihi et al., 2018; Swan et al., 2019a; Wang et al., 2019), including SDSS J1228+1040 (Xu et al., 2018).
In our qualitative model, the planetesimal produces gas that initially traces the orbit of the planetesimal. This gas is built up, and begins to circularise and to spread radially, forming the disc detected in the metallic emission lines (Figure 2). Eventually this gas condenses back into dust. This requires that the condensation time-scale is (1) similar to the circularisation time-scale, and (2) significantly shorter than the viscous spreading time-scale. Whereas the viscous time-scale is thought to be on the order of years to decades (Shakura & Sunyaev, 1973; Rafikov, 2011b; Wilson et al., 2014), further work is needed to constrain the circularisation time-scale for these discs.
The framework outlined above explains observational features of gaseous debris discs and remnant planetary systems around white dwarfs:
(i) The rarity of gaseous debris discs could be explained by the presence of a planetesimal that is actively disrupting the disc. The occurrence rate we calculate in this paper would imply directly a lower limit on the occurrence rate of planetesimals orbiting within debris discs around white dwarfs. In debris discs without a planetesimal generating a significant source of gaseous material, any gas should condense into dust and no gaseous component would be detected.
(ii) There is no observed correlation between the presence of a gaseous component to a debris disc and the accretion rate of metals onto the disc-hosting white dwarf (see fig. 10 of Farihi 2016 and table 2 of Manser et al. 2016b). This is easily explained by the gaseous component of the disc recondensing into dust before it has enough time to viscously spread and accrete onto the white dwarf.
(iii) Manser et al. (2019) show in their fig. S2 that the EW of the Ca ii triplet profiles can vary as much as 20 per cent over a few weeks to months. This time-scale is equivalent to a few hundred orbital time-scales (similar to the estimates of the condensation time-scale, Metzger et al. 2012), and could be explained by a change in the rate at which the planetesimal is generating gas through dust destruction and disc warping leading to sublimation. The majority of Ca ii triplet observations were obtained on yearly time-scales, and more frequent monitoring of the Ca ii triplet emission profiles and their EW is required to establish in detail the extent of this weekly to monthly variability.
(iv) The observed eccentricity and precession of the gaseous debris discs (Manser et al., 2016a; Dennihy et al., 2018) could be induced by a planetesimal on an eccentric orbit. Miranda & Rafikov (2018) show that an eccentric gas disc will precess on a fixed period, but suggest that a method to excite the eccentricity must exist in these systems. In our scenario, the precession of the gaseous debris disc component naturally arises from the effect of general relativity on the eccentric orbit of the planetesimal (Manser et al., 2019). The precession periods determined in SDSS J1228+1040 and HE 1349–2305 differing by an order of magnitude would then reflect different orbital configurations of the planetesimals in these systems. One way to probe for the eccentricity and precession of the orbit of a planetesimal is to search for changes in the radial velocity trail of the gas it generates (see fig. 1 C & F of Manser et al. (2019)). Whereas the radial velocity variation of a test mass on a circular orbit will follow a sine wave, that of an eccentric orbit depends on the eccentricity of the orbit as well as the angle, , between the semi-major axis of the orbit and the line of sight from the observer to the system. If the planetesimal is apsidally precessing due to general relativity, then will vary periodically with the precession period, which is an observationally verifyable prediction of our hypothesis.
5 Conclusions
We have determined the occurrence rate of gaseous debris discs in emission around white dwarfs as 0.067 per cent using a magnitude and S/N limited sample of white dwarfs observed by SDSS and Gaia. This rate is significantly smaller than the ratio of observed debris discs with and without a gaseous component in emission due to different observational biases in the detection of emission lines from the gas and broad-band infrared emission from the dust. We also present the non-detection of Ca ii triplet emission at 20 dusty debris disc hosts. The forthcoming dedicated multi-object spectroscopic surveys (DESI, DESI Collaboration et al. 2016a, b, WEAVE, Dalton et al. 2012, 2016, 4MOST, de Jong et al. 2016, and SDSS-V, Kollmeier et al. 2017) are expected to increase the number of known gaseous discs by a factor 5 over the next decade. This much enlarged sample will provide detailed insight into the orbital properties of planetesimals closely orbiting white dwarfs, and into the mechanisms generating the detected gas.
Acknowledgements
We thank the anonymous referee for their useful comments and meticulous reading of the manuscript. C.J.M. and B.T.G. were supported by the UK STFC grant ST/P000495. I.P. was supported by Capes-Brazil under grant 88881.134990/2016-01. Based on observations obtained at the Southern Astrophysical Research (SOAR) telescope, which is a joint project of the Ministério da Ciência, Tecnologia, Inovações e Comunicações (MCTIC) do Brasil, the U.S. National Optical Astronomy Observatory (NOAO), the University of North Carolina at Chapel Hill (UNC), and Michigan State University (MSU). This work has made use of observations from the SDSS-III, funding for which has been provided by the Alfred P. Sloan Foundation, the Participating Institutions, the National Science Foundation, and the U.S. Department of Energy Office of Science. The SDSS-III web site is http://www.sdss3.org/. Based on observations made with the WHT operated on the island of La Palma by the Isaac Newton Group in the Spanish Observatorio del Roque de los Muchachos of the Instituto de Astrofísica de Canarias.
References
- Barber et al. (2012) Barber S. D., Patterson A. J., Kilic M., Leggett S. K., Dufour P., Bloom J. S., Starr D. L., 2012, ApJ, 760, 26
- Barber et al. (2016) Barber S. D., Belardi C., Kilic M., Gianninas A., 2016, MNRAS, 459, 1415
- Barstow et al. (2014) Barstow M. A., Barstow J. K., Casewell S. L., Holberg J. B., Hubeny I., 2014, MNRAS, 440, 1607
- Bergfors et al. (2014) Bergfors C., Farihi J., Dufour P., Rocchetto M., 2014, MNRAS, 444, 2147
- Brinkworth et al. (2009) Brinkworth C. S., Gänsicke B. T., Marsh T. R., Hoard D. W., Tappert C., 2009, ApJ, 696, 1402
- Brinkworth et al. (2012) Brinkworth C. S., Gänsicke B. T., Girven J. M., Hoard D. W., Marsh T. R., Parsons S. G., Koester D., 2012, ApJ, 750, 86
- Cauley et al. (2018) Cauley P. W., Farihi J., Redfield S., Bachman S., Parsons S. G., Gänsicke B. T., 2018, ApJ, 852, L22
- DESI Collaboration et al. (2016a) DESI Collaboration et al., 2016a, preprint, (arXiv:1611.00036)
- DESI Collaboration et al. (2016b) DESI Collaboration et al., 2016b, preprint, (arXiv:1611.00037)
- Dalton et al. (2012) Dalton G., et al., 2012, in Ground-based and Airborne Instrumentation for Astronomy IV. p. 84460P, doi:10.1117/12.925950
- Dalton et al. (2016) Dalton G., et al., 2016, in Ground-based and Airborne Instrumentation for Astronomy VI. p. 99081G, doi:10.1117/12.2231078
- Debes & Sigurdsson (2002) Debes J. H., Sigurdsson S., 2002, ApJ, 572, 556
- Debes et al. (2012) Debes J. H., Kilic M., Faedi F., Shkolnik E. L., Lopez-Morales M., Weinberger A. J., Slesnick C., West R. G., 2012, ApJ, 754, 59
- Debes et al. (2019) Debes J. H., et al., 2019, ApJ, 872, L25
- Dennihy et al. (2016) Dennihy E., Debes J. H., Dunlap B. H., Dufour P., Teske J. K., Clemens J. C., 2016, ApJ, 831, 31
- Dennihy et al. (2017) Dennihy E., Clemens J. C., Debes J. H., Dunlap B. H., Kilkenny D., O’Brien P. C., Fuchs J. T., 2017, ApJ, 849, 77
- Dennihy et al. (2018) Dennihy E., Clemens J. C., Dunlap B. H., Fanale S. M., Fuchs J. T., Hermes J. J., 2018, ApJ, 854, 40
- Dufour et al. (2010) Dufour P., Kilic M., Fontaine G., Bergeron P., Lachapelle F., Kleinman S. J., Leggett S. K., 2010, ApJ, 719, 803
- Farihi (2016) Farihi J., 2016, New Astronomy Reviews, 71, 9
- Farihi et al. (2008) Farihi J., Zuckerman B., Becklin E. E., 2008, ApJ, 674, 431
- Farihi et al. (2009) Farihi J., Jura M., Zuckerman B., 2009, ApJ, 694, 805
- Farihi et al. (2010) Farihi J., Jura M., Lee J., Zuckerman B., 2010, ApJ, 714, 1386
- Farihi et al. (2012) Farihi J., Gänsicke B. T., Steele P. R., Girven J., Burleigh M. R., Breedt E., Koester D., 2012, MNRAS, 421, 1635
- Farihi et al. (2018) Farihi J., et al., 2018, MNRAS,
- Fortin-Archambault et al. (2019) Fortin-Archambault M., Dufour P., Xu S., 2019, arXiv e-prints, p. arXiv:1911.05690
- Gaia Collaboration et al. (2018) Gaia Collaboration et al., 2018, A&A, 616, A1
- Gänsicke (2011) Gänsicke B. T., 2011, in Schuh S., Drechsel H., Heber U., eds, American Institute of Physics Conference Series Vol. 1331, American Institute of Physics Conference Series. pp 211–214 (arXiv:1101.3946), doi:10.1063/1.3556202
- Gänsicke et al. (2006) Gänsicke B. T., Marsh T. R., Southworth J., Rebassa-Mansergas A., 2006, Science, 314, 1908
- Gänsicke et al. (2007) Gänsicke B. T., Marsh T. R., Southworth J., 2007, MNRAS, 380, L35
- Gänsicke et al. (2008) Gänsicke B. T., Koester D., Marsh T. R., Rebassa-Mansergas A., Southworth J., 2008, MNRAS, 391, L103
- Gänsicke et al. (2012) Gänsicke B. T., Koester D., Farihi J., Girven J., Parsons S. G., Breedt E., 2012, MNRAS, 424, 333
- Gänsicke et al. (2019) Gänsicke B. T., Schreiber M. R., Toloza O., Fusillo N. P. G., Koester D., Manser C. J., 2019, Nature, 576, 61
- Gentile Fusillo et al. (2015) Gentile Fusillo N. P., Gänsicke B. T., Greiss S., 2015, MNRAS, 448, 2260
- Gentile Fusillo et al. (2017) Gentile Fusillo N. P., Gänsicke B. T., Farihi J., Koester D., Schreiber M. R., Pala A. F., 2017, MNRAS, 468, 971
- Gentile Fusillo et al. (2019) Gentile Fusillo N. P., et al., 2019, MNRAS, 482, 4570
- Girven et al. (2011) Girven J., Gänsicke B. T., Steeghs D., Koester D., 2011, MNRAS, 417, 1210
- Girven et al. (2012) Girven J., Brinkworth C. S., Farihi J., Gänsicke B. T., Hoard D. W., Marsh T. R., Koester D., 2012, ApJ, 749, 154
- Graham et al. (1990) Graham J. R., Matthews K., Neugebauer G., Soifer B. T., 1990, ApJ, 357, 216
- Gunn et al. (2006) Gunn J. E., et al., 2006, AJ, 131, 2332
- Guo et al. (2015) Guo J., Tziamtzis A., Wang Z., Liu J., Zhao J., Wang S., 2015, ApJ Lett., 810, L17
- Hallakoun et al. (2017) Hallakoun N., et al., 2017, MNRAS, 469, 3213
- Hollands et al. (2017) Hollands M. A., Koester D., Alekseev V., Herbert E. L., Gänsicke B. T., 2017, MNRAS, 467, 4970
- Hollands et al. (2018) Hollands M. A., Gänsicke B. T., Koester D., 2018, MNRAS, 477, 93
- Horne & Marsh (1986) Horne K., Marsh T. R., 1986, MNRAS, 218, 761
- Izquierdo et al. (2018) Izquierdo P., et al., 2018, MNRAS, 481, 703
- Jeffreys (1946) Jeffreys H., 1946, Proceedings of the Royal Society of London Series A, 186, 453
- Jura (2003) Jura M., 2003, ApJ Lett., 584, L91
- Jura (2008) Jura M., 2008, AJ, 135, 1785
- Jura et al. (2007a) Jura M., Farihi J., Zuckerman B., Becklin E. E., 2007a, AJ, 133, 1927
- Jura et al. (2007b) Jura M., Farihi J., Zuckerman B., 2007b, ApJ, 663, 1285
- Jura et al. (2009) Jura M., Farihi J., Zuckerman B., 2009, AJ, 137, 3191
- Kenyon & Bromley (2017a) Kenyon S. J., Bromley B. C., 2017a, ApJ, 844, 116
- Kenyon & Bromley (2017b) Kenyon S. J., Bromley B. C., 2017b, ApJ, 850, 50
- Kinnear (2011) Kinnear T., 2011, Master’s thesis, University of Warwick
- Klein et al. (2011) Klein B., Jura M., Koester D., Zuckerman B., 2011, ApJ, 741, 64
- Koester (2009) Koester D., 2009, A&A, 498, 517
- Koester & Wilken (2006) Koester D., Wilken D., 2006, A&A, 453, 1051
- Koester et al. (2011) Koester D., Girven J., Gänsicke B. T., Dufour P., 2011, aa, 530, A114
- Koester et al. (2014) Koester D., Gänsicke B. T., Farihi J., 2014, A&A, 566, A34
- Kollmeier et al. (2017) Kollmeier J. A., et al., 2017, preprint, (arXiv:1711.03234)
- Malamud & Perets (2019a) Malamud U., Perets H., 2019a, arXiv e-prints, p. arXiv:1911.12068
- Malamud & Perets (2019b) Malamud U., Perets H., 2019b, arXiv e-prints, p. arXiv:1911.12184
- Manser et al. (2016a) Manser C. J., et al., 2016a, MNRAS, 455, 4467
- Manser et al. (2016b) Manser C. J., Gänsicke B. T., Koester D., Marsh T. R., Southworth J., 2016b, MNRAS, 462, 1461
- Manser et al. (2019) Manser C. J., et al., 2019, Science, 364, 66
- Melis et al. (2010) Melis C., Jura M., Albert L., Klein B., Zuckerman B., 2010, ApJ, 722, 1078
- Melis et al. (2012) Melis C., et al., 2012, ApJ Lett., 751, L4
- Metzger et al. (2012) Metzger B. D., Rafikov R. R., Bochkarev K. V., 2012, MNRAS, 423, 505
- Miranda & Rafikov (2018) Miranda R., Rafikov R. R., 2018, ApJ, 857, 135
- Rafikov (2011a) Rafikov R. R., 2011a, MNRAS, 416, L55
- Rafikov (2011b) Rafikov R. R., 2011b, ApJ Lett., 732, L3
- Rafikov & Garmilla (2012) Rafikov R. R., Garmilla J. A., 2012, ApJ, 760, 123
- Rebassa-Mansergas et al. (2019) Rebassa-Mansergas A., Solano E., Xu S., Rodrigo C., Jiménez-Esteban F. M., Torres S., 2019, MNRAS, 489, 3990
- Rocchetto et al. (2015) Rocchetto M., Farihi J., Gänsicke B. T., Bergfors C., 2015, MNRAS, 449, 574
- Schreiber et al. (2019) Schreiber M. R., Gänsicke B. T., Toloza O., Hernandez M.-S., Lagos F., 2019, ApJ, 887, L4
- Shakura & Sunyaev (1973) Shakura N. I., Sunyaev R. A., 1973, A&A, 24, 337
- Swan et al. (2019a) Swan A., Farihi J., Wilson T. G., 2019a, MNRAS, 484, L109
- Swan et al. (2019b) Swan A., Farihi J., Koester D., Holland s M., Parsons S., Cauley P. W., Redfield S., Gänsicke B. T., 2019b, MNRAS, 490, 202
- Vanderburg et al. (2015) Vanderburg A., et al., 2015, Nat, 526, 546
- Vennes & Kawka (2013) Vennes S., Kawka A., 2013, ApJ, 779, 70
- Vennes et al. (2010) Vennes S., Kawka A., Németh P., 2010, MNRAS, 404, L40
- Veras et al. (2014) Veras D., Leinhardt Z. M., Bonsor A., Gänsicke B. T., 2014, MNRAS, 445, 2244
- Veras et al. (2015) Veras D., Leinhardt Z. M., Eggl S., Gänsicke B. T., 2015, MNRAS, 451, 3453
- Wang et al. (2019) Wang T.-G., et al., 2019, arXiv e-prints, p. arXiv:1910.04314
- Wilson et al. (2014) Wilson D. J., Gänsicke B. T., Koester D., Raddi R., Breedt E., Southworth J., Parsons S. G., 2014, MNRAS, 445, 1878
- Wilson et al. (2015) Wilson D. J., Gänsicke B. T., Koester D., Toloza O., Pala A. F., Breedt E., Parsons S. G., 2015, MNRAS, 451, 3237
- Wilson et al. (2019) Wilson T. G., Farihi J., Gänsicke B. T., Swan A., 2019, MNRAS, p. 1000
- Wyatt et al. (2014) Wyatt M. C., Farihi J., Pringle J. E., Bonsor A., 2014, MNRAS, 439, 3371
- Xu & Jura (2012) Xu S., Jura M., 2012, ApJ, 745, 88
- Xu & Jura (2014) Xu S., Jura M., 2014, ApJ Lett., 792, L39
- Xu et al. (2015) Xu S., Jura M., Pantoja B., Klein B., Zuckerman B., Su K. Y. L., Meng H. Y. A., 2015, ApJ Lett., 806, L5
- Xu et al. (2016) Xu S., Jura M., Dufour P., Zuckerman B., 2016, ApJ Lett., 816, L22
- Xu et al. (2018) Xu S., et al., 2018, preprint, (arXiv:1808.09426)
- Xu et al. (2019a) Xu S., Dufour P., Klein B., Melis C., Monson N. N., Zuckerman B., Young E. D., Jura M. A., 2019a, arXiv e-prints, p. arXiv:1910.07197
- Xu et al. (2019b) Xu S., et al., 2019b, AJ, 157, 255
- Zuckerman & Becklin (1987) Zuckerman B., Becklin E. E., 1987, Nat, 330, 138
- Zuckerman et al. (2003) Zuckerman B., Koester D., Reid I. N., Hünsch M., 2003, ApJ, 596, 477
- Zuckerman et al. (2010) Zuckerman B., Melis C., Klein B., Koester D., Jura M., 2010, ApJ, 722, 725
- de Jong et al. (2016) de Jong R. S., et al., 2016, in Ground-based and Airborne Instrumentation for Astronomy VI. p. 99081O, doi:10.1117/12.2232832
Appendix A SDSS spectroscopy of gaseous debris discs