Ricochets on Asteroids: Experimental study of low velocity grazing impacts into granular media
Abstract
Spin off events and impacts can eject boulders from an asteroid surface and rubble pile asteroids can accumulate from debris following a collision between large asteroids. These processes produce a population of gravitational bound objects in orbit that can impact an asteroid surface at low velocity and with a distribution of impact angles. We present laboratory experiments of low velocity spherical projectiles into a fine granular medium, sand. We delineate velocity and impact angles giving ricochets, those giving projectiles that roll-out from the impact crater and those that stop within their impact crater. With high speed camera images and fluorescent markers on the projectiles we track spin and projectile trajectories during impact. We find that the projectile only reaches a rolling without slipping condition well after the marble has reached peak penetration depth. The required friction coefficient during the penetration phase of impact is 4-5 times lower than that of the sand suggesting that the sand is fluidized near the projectile surface during penetration. We find that the critical grazing impact critical angle dividing ricochets from roll-outs, increases with increasing impact velocity. The critical angles for ricochet and for roll-out as a function of velocity can be matched by an empirical model during the rebound phase that balances a lift force against gravity. We estimate constraints on projectile radius, velocity and impact angle that would allow projectiles on asteroids to ricochet or roll away from impact, finally coming to rest distant from their initial impact sites.
keywords:
1 Introduction
Impact crater ejecta curtains (e.g., Asphaug and Melosh 1993; Thomas et al. 2001; Durda et al. 2012), seismicity associated with impacts (e.g. Wright et al. 2020), and mass loss associated with spin-off events (e.g., Holsapple 2010; Hirabayashi et al. 2015) are processes that would eject a population of rocks and boulders from an asteroid surface. Eventually, this material would be ejected from the asteroid’s vicinity or it would return to hit the asteroid surface. A rubble pile asteroid can be formed following a disruptive collision of two large bodies, including a phase of re-accumulation from previously disrupted but gravitationally bound material (Michel and Richardson, 2013; Walsh, 2018; Walsh et al., 2019). Late stages of re-accumulation involves low velocity impacts onto the asteroid surface. Impacts with objects in the main asteroid belt have a mean relative velocity of km/s (Bottke et al., 1994). In comparison, a gravitational bound object would impact the asteroid surface at much lower velocity, less than the escape velocity which is cm/s for an 500 m diameter object such as Asteroid 101995 Bennu (Scheeres et al., 2019). These would be low velocity impacts into surface regolith or rubble at low gravitational acceleration and would include encounters at low or at grazing incidence angle because the projectiles were previously in orbit. Due to its orbital angular momentum, this would also be true of most material that was thrown off the asteroid during spin-off events. Boulders ejected during crater formation can also contribute to the population of objects returning to hit the surface at low velocity and grazing incidence angle (Durda et al., 2012).
Experiments of low velocity and normal impacts into granular media at low surface gravity from drop towers include those by Goldman and Umbanhowar (2008); Sunday et al. (2016); Murdoch et al. (2017) and in aircraft those by Brisset et al. (2018). These experiments studied normal impacts, those perpendicular to the impact surface, and so did not study the sensitivity of the projectile deceleration profile and penetration depth to impact angle. The deceleration of the projectile is due to interaction within the impacted surface. However debris that is orbiting an asteroid, that later hits the asteroid surface, would be unlikely to only have high or nearly normal impact angles. Grazing impacts of spherical projectiles on sand or water are more likely to bounce or ricochet (e.g., Birkhoff et al. 1944; Soliman et al. 1976; Daneshi and Johnson 1977; Bai and Johnson 1981). Simulations by Maurel et al. (2018) show that this is also true for non-spherical, low velocity projectiles, such as a lander, in low surface gravity.
Images of asteroids 101995 Bennu and 162173 Ryugu show large (10–50 m) boulders that look as if they were perched on the surface (Sugita et al., 2019; Walsh et al., 2019). See Figure 1 for a boulder that might unstable if perturbed by large amplitude vibrations. Possible explanations for boulders on the surface of a rubble pile asteroids include the Brazil nut effect (e.g., Matsumura et al. 2014), which drives previous buried boulders to the surface, and boulder stranding that occurs during landing of ejecta that is launched by an impact generated pressure pulse (Wright et al., 2020). Some of the surface boulders on Bennu are so large they probably instead landed on the surface during accumulation following a disruptive large collision of larger asteroids (Walsh et al., 2019). A population of large boulders ( m diameter) littering asteroid 433 Eros’ equatorial region, is attributed to ejecta from the impact event that formed the Shoemaker crater (Thomas et al., 2001).
A low velocity boulder projectile with a shallow or grazing impact angle might bounce off the surface, landing distant from the site of first impact and from any depression in the surface resulting from material ejected during its first impact. Boulders that were ejected by an impact can leave oblong tracks or secondary craters where they bounce off the surface. Examples of such tracks and associated 2, 25 and 40 m diameter boulders on asteroid 433 Eros suggest that the boulders were emplaced at the termination of their trajectories (Sullivan et al., 2002; Durda et al., 2012). We consider ricochets of low velocity impactors as a way to account for protruding boulders on the surfaces of asteroids such as Eros, Bennu and Ryugu. While Bennu and Ryugu might lack surface regions comprised primarily of fine grained material, other asteroids such as 433 Eros (Veverka et al., 2001; Cheng et al., 2002), 25143 Itokawa (Miyamoto et al., 2017) and the moon exhibit smooth regions covered in regolith. The dynamics of low velocity grazing impacts into granular media is also relevant to interpretation of the surfaces of these bodies and for the design of landers that may be going to them. For a review of granular media in solar system bodies see Hestroffer et al. (2019).
Deployed from the European Space Agency’s Rosetta spacecraft, the Philae lander’s anchoring harpoons failed to fire when approaching comet 67P/Churyumov-Gerasimenko. The lander rebounded twice from the comet surface prior to coming to rest roughly 1 km away from the intended landing site (Biele et al., 2015). The first touchdown was at a relative velocity of 1 m/s (and near the local escape velocity) and about from normal. The normal velocity component was damped and the outgoing velocity was about 1/3 of the incoming relative velocity. The lander itself contains a damping element which was depressed during this touchdown. Interpretation of the vertical acceleration profile suggest that the lander hit a granular surface with a compressive strength of order a few kPa (Biele et al., 2015).
Hyabusa2 is a sample return mission to asteroid Ryugu that contains a 10kg lander called MASCOT (Mobile ASteroid SCOuT; Ho et al. 2016). The soft sphere rubble pile simulations by Maurel et al. (2018) showed that simulated low velocity impacts (19 cm/s) of MASCOT onto Ryugu’s surface with lower (closer to grazing) impact angles were more likely to bounce and had higher effective coefficients of restitution than normal impacts. The Philae and MASCOT landers illustrate that the understanding of low velocity surface-lander interactions is critical for missions with lander components and influences lander deployment and sample return strategies.
Phenomenological models have been proposed to account for experimental measurements of penetration depth of spherical projectiles impacting granular materials in a gravitational field at normal incidence (e.g., Uehara et al. 2003; Tsimring and Volfson 2005; Ambroso et al. 2005; Katsuragi and Durian 2007; Goldman and Umbanhowar 2008; Katsuragi and Durian 2013; Murdoch et al. 2017). For normal impacts (e.g., Uehara et al. 2003; Tsimring and Volfson 2005; Ambroso et al. 2005; Goldman and Umbanhowar 2008; Katsuragi and Durian 2013; Murdoch et al. 2017) and recent oblique impact experiments (Bester et al., 2019). Most of these experimental studies have modeled the granular medium with an empirical force law that includes a hydrodynamic drag term proportional to the square of the velocity, which dominates at higher velocity and so at deeper penetration, and a term which accounts for a depth dependent static resistance force, which dominates at lower speeds and shallow penetration depths. However, a higher velocity projectile at grazing incidence may not penetrate deeply and would still feel a hydrodynamic-like drag. Horizontal motion in granular media can cause lift (Ding et al., 2011; Potiguar and Ding, 2013). Thus the empirical models primarily developed for normal impacts need to be modified in order to account for impacts at grazing angles.
Phenomenological models for ricochet in sand or water (Birkhoff et al., 1944; Johnson and Reid, 1975; Daneshi and Johnson, 1977; Soliman et al., 1976; Bai and Johnson, 1981) predict a velocity dependent critical angle for ricochet. However, these early models assume low angles of impact and nearly horizontal and constant velocity during the encounter between projectile and substrate and neglect spin. The lift was based on a hydrodynamic pressure exerted on the submerged projectile surface and may not be consistent with more recent empirical force models or experimental measurements. Models consistent with a broader range of phenomena, including ricochets and oblique impacts, would be helpful for understanding processes taking place in low gravity environments.
2 Laboratory Experiments of Projectiles Impacting Similar Density Granular Material
We carry out experiments of spherical projectiles into sand. We restrict the density of our projectiles to similar materials and densities as the solids in our substrate material so as to be similar to natural low velocity impacts on asteroids. Prior to this study we had explored non-spherical projectiles (pebbles) into coarser substrates (gravel), however we found that experiments were often not easily reproducible. This was likely due to the complex projectile shapes, their spin and phase of impact with respect to rotation, and irregularities in the substrate. We have reduced the degrees of freedom so as to try to understand simpler systems as a first approximation. The projectiles we discuss here are spheres and the granular substrate is comprised of particles that are much smaller than the projectile.
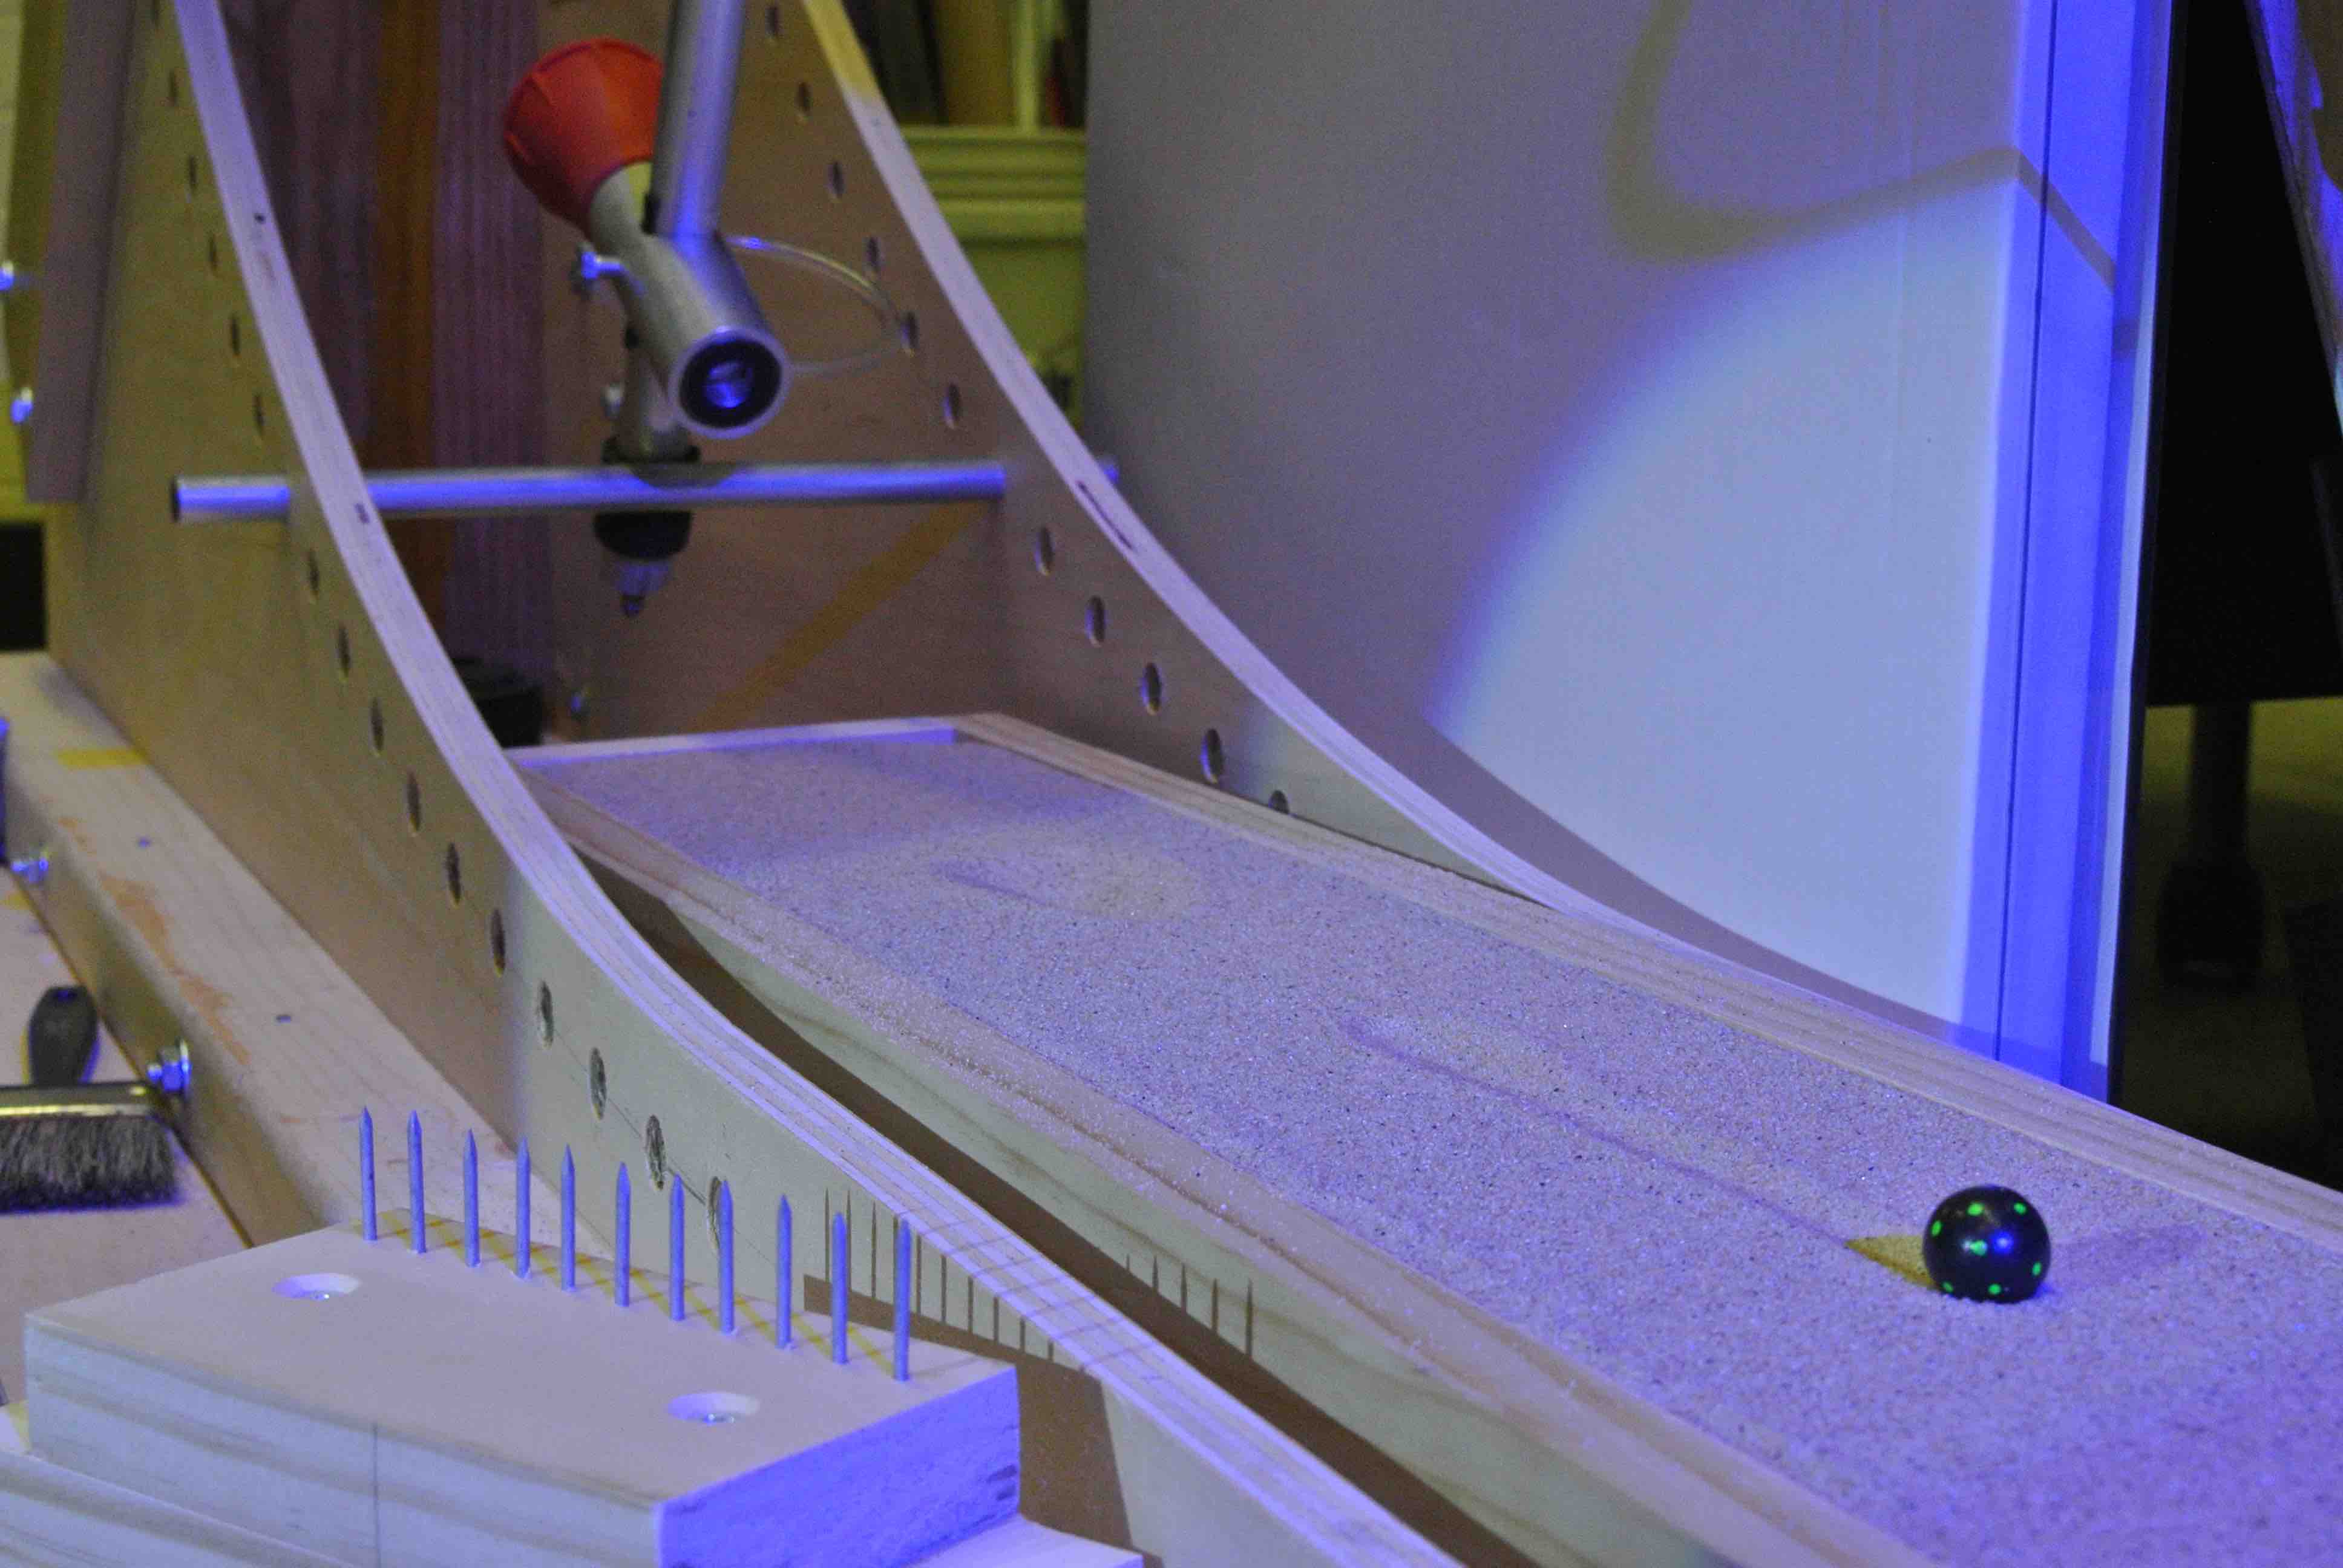
Our granular substrate is dry playground sand. As irregularities in a fine medium are less likely to affect the projectile trajectory, and craters are easier to see in a fine medium, we chose fine sand to facilitate measurement of projectile stopping times,crater depths and morphology. The sand substrate had a depth of 6.3 cm and was passed through a sieve, giving only particles less than 0.5 mm in diameter. Density of our sand is g/cm3. The porosity of our sand was 0.4. We measured the porosity by filling a volume of sand with water until the voids were filled and taking the ratio of the volumes. Prior to each impact the substrate is raked and then scraped flat. It is not pressed or compacted. The rake consists of a linear row of 2 cm long nails. The separation between each pair of neighboring nails is 1 cm. The rake and a close up view of the sand tray is shown in Figure 4. The low packing fraction of the sand and shallow penetration regime of our impacts suggests that interstitial air would not have a strong affect the impact dynamics (see Royer et al. 2011).
We use a small spherical projectile. The glass marble projectile we used for most experiments has a mass of 5.57 g, a diameter of 16.15 mm and a density of 2.5 g cm-3. This density is within the scatter of different types of quartz and glasses.
It is useful to define a dimensionless number that will scale our laboratory experiments on Earth to an asteroid setting. We chose a dimensionless number known as the Froude number
| (1) |
with the projectile radius. The Froude number is related to the dimensionless number, , used to describe impact crater scaling relations (Housen and Holsapple, 2003); . A small size in the lab is convenient as a cm radius projectile at an impact speed of m/s has dimensionless Froude number that is similar to that of a meter radius projectile at an impact speed similar to the escape velocity cm/s on a small asteroid like Bennu with effective gravity g.
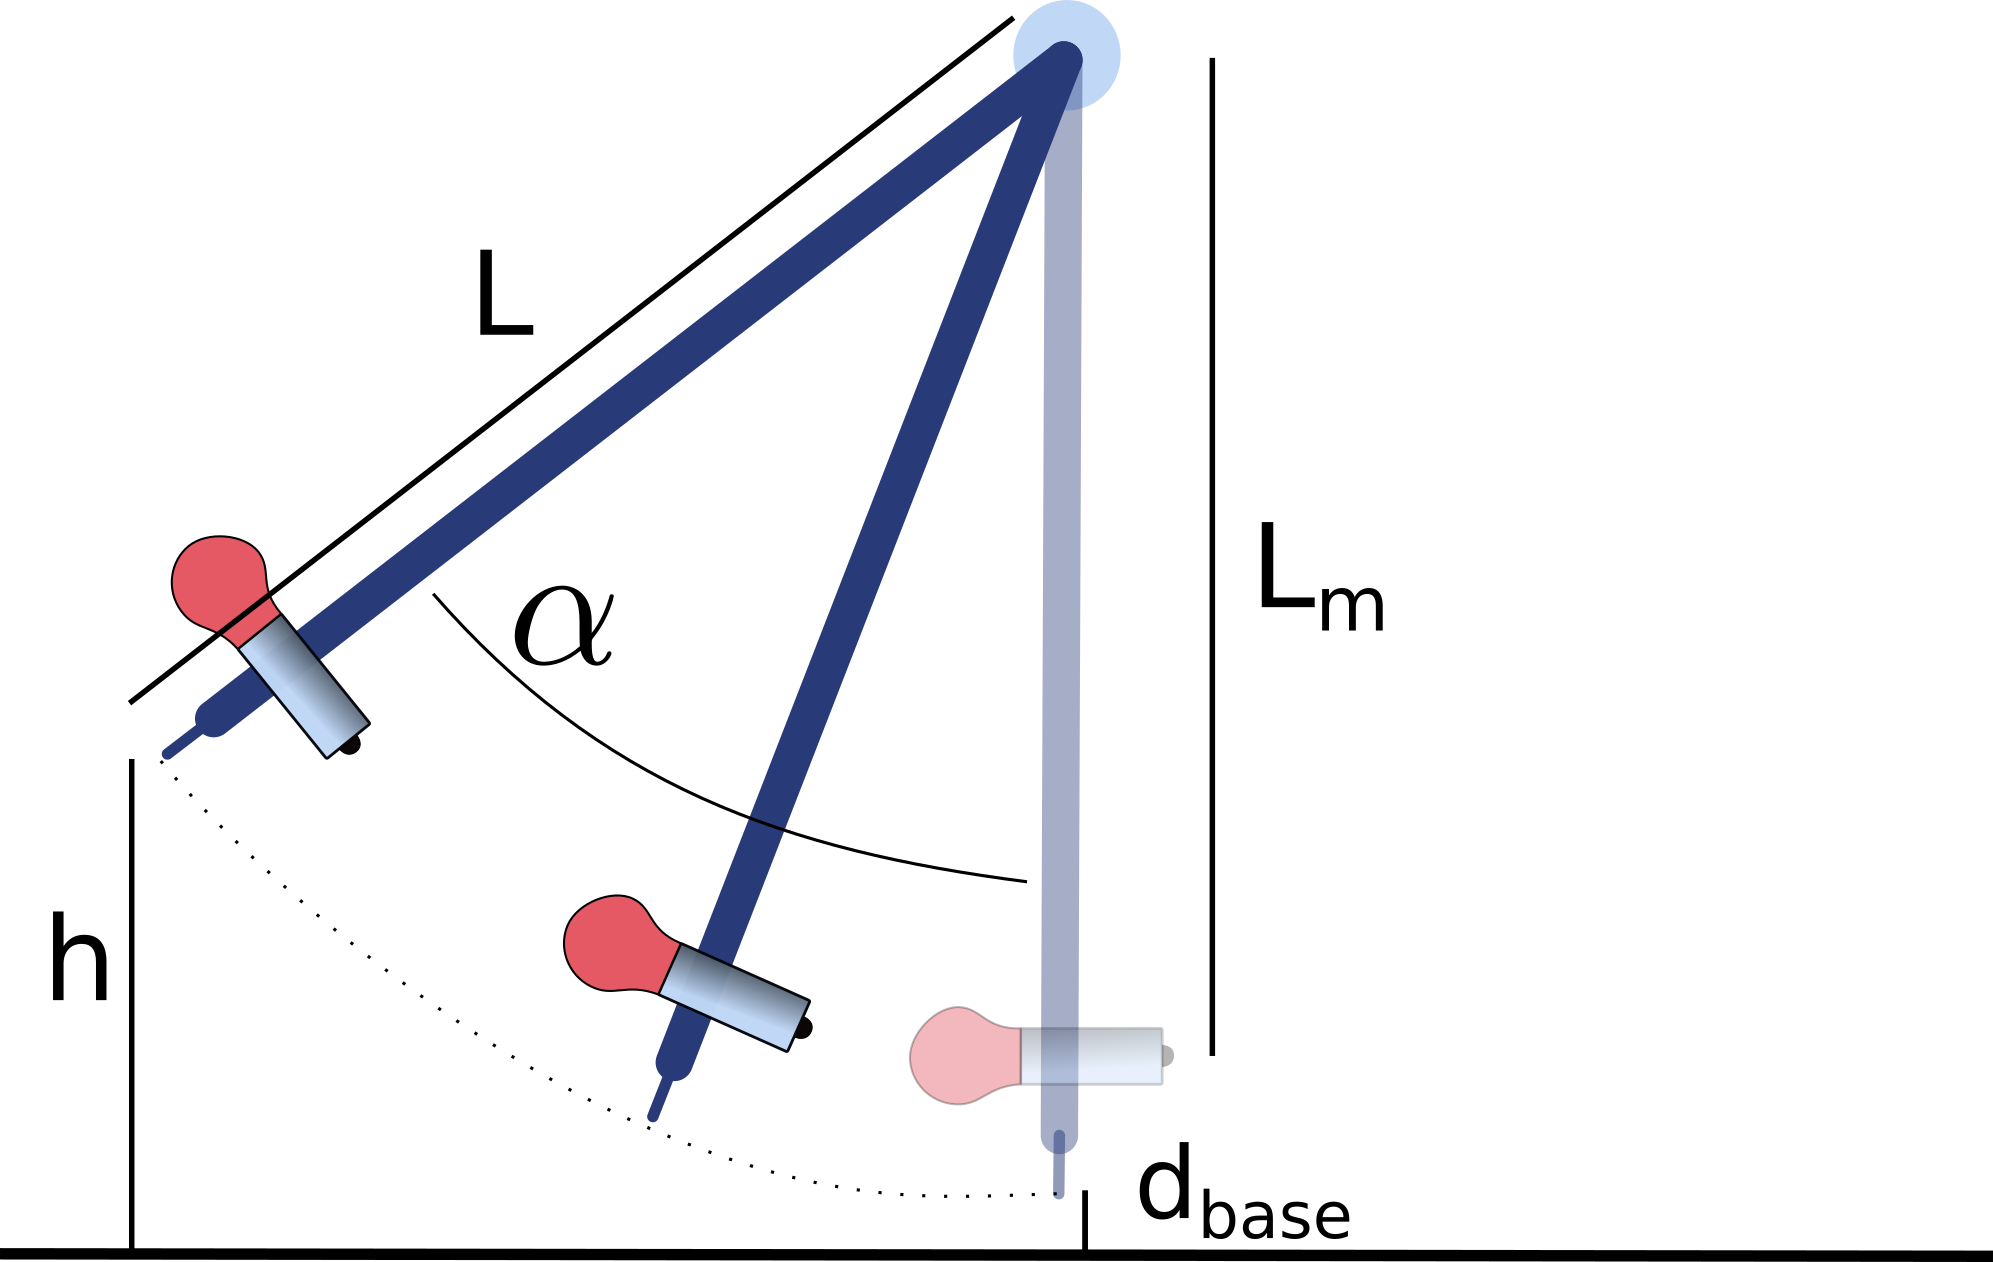
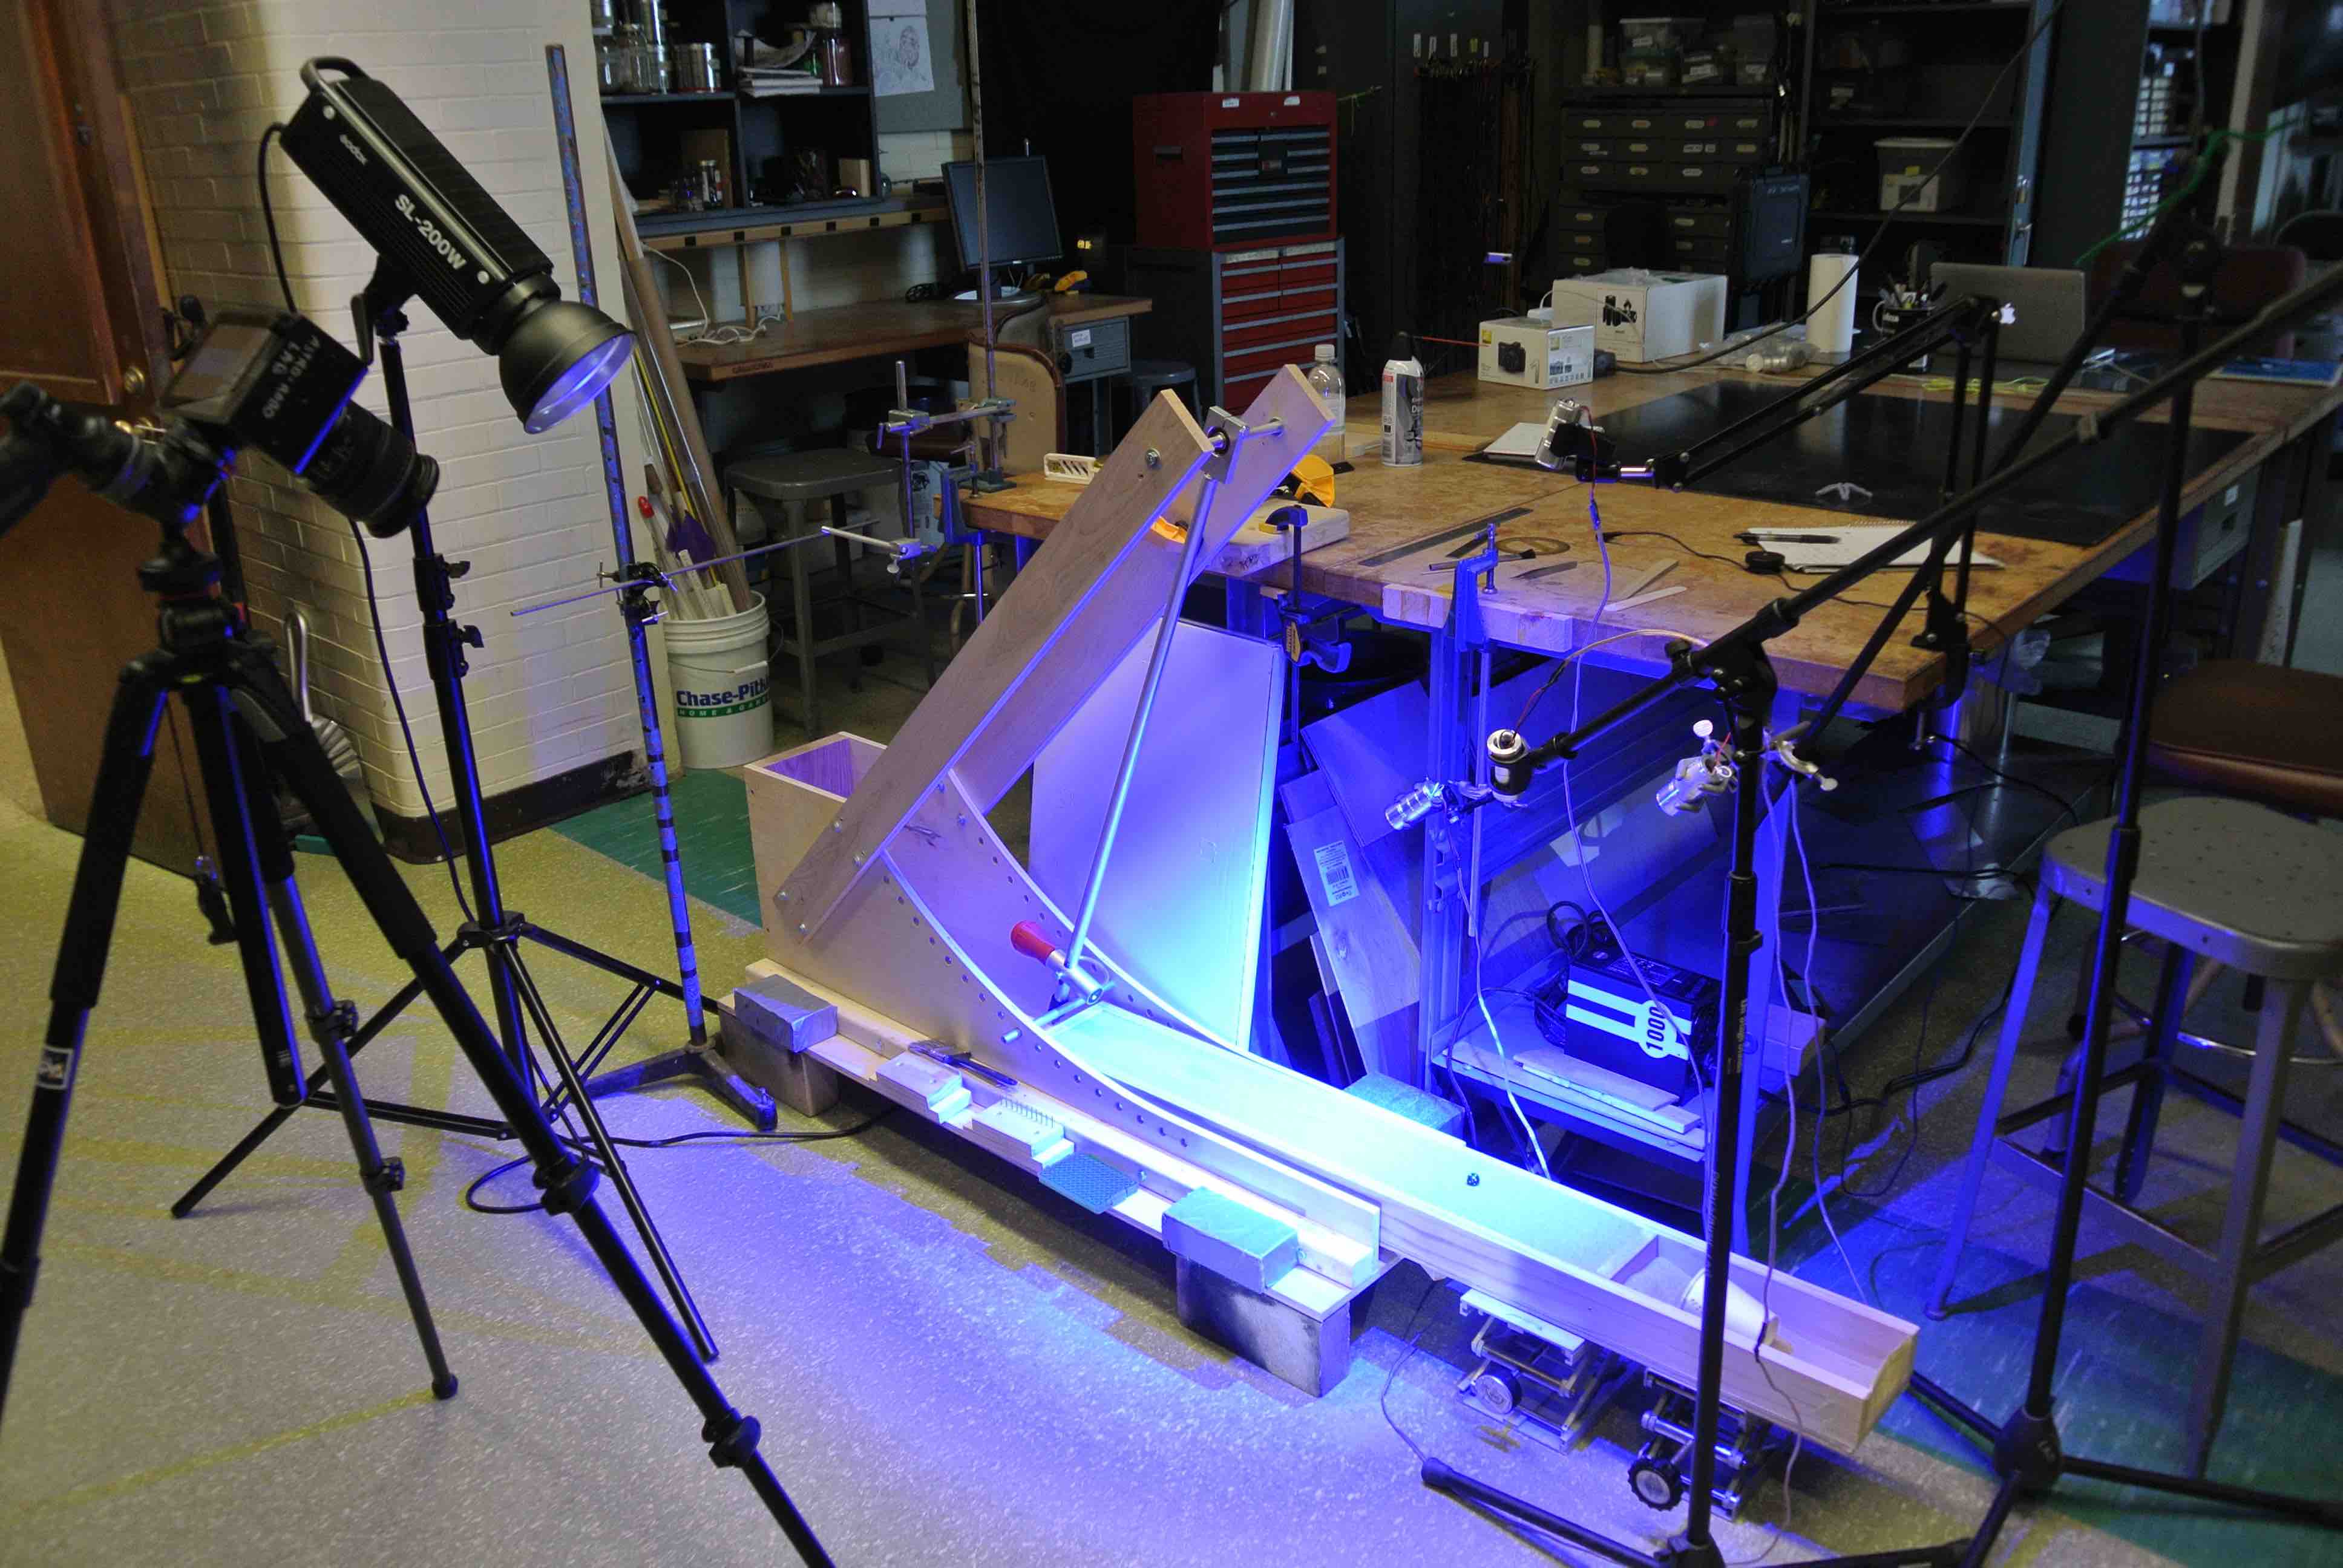
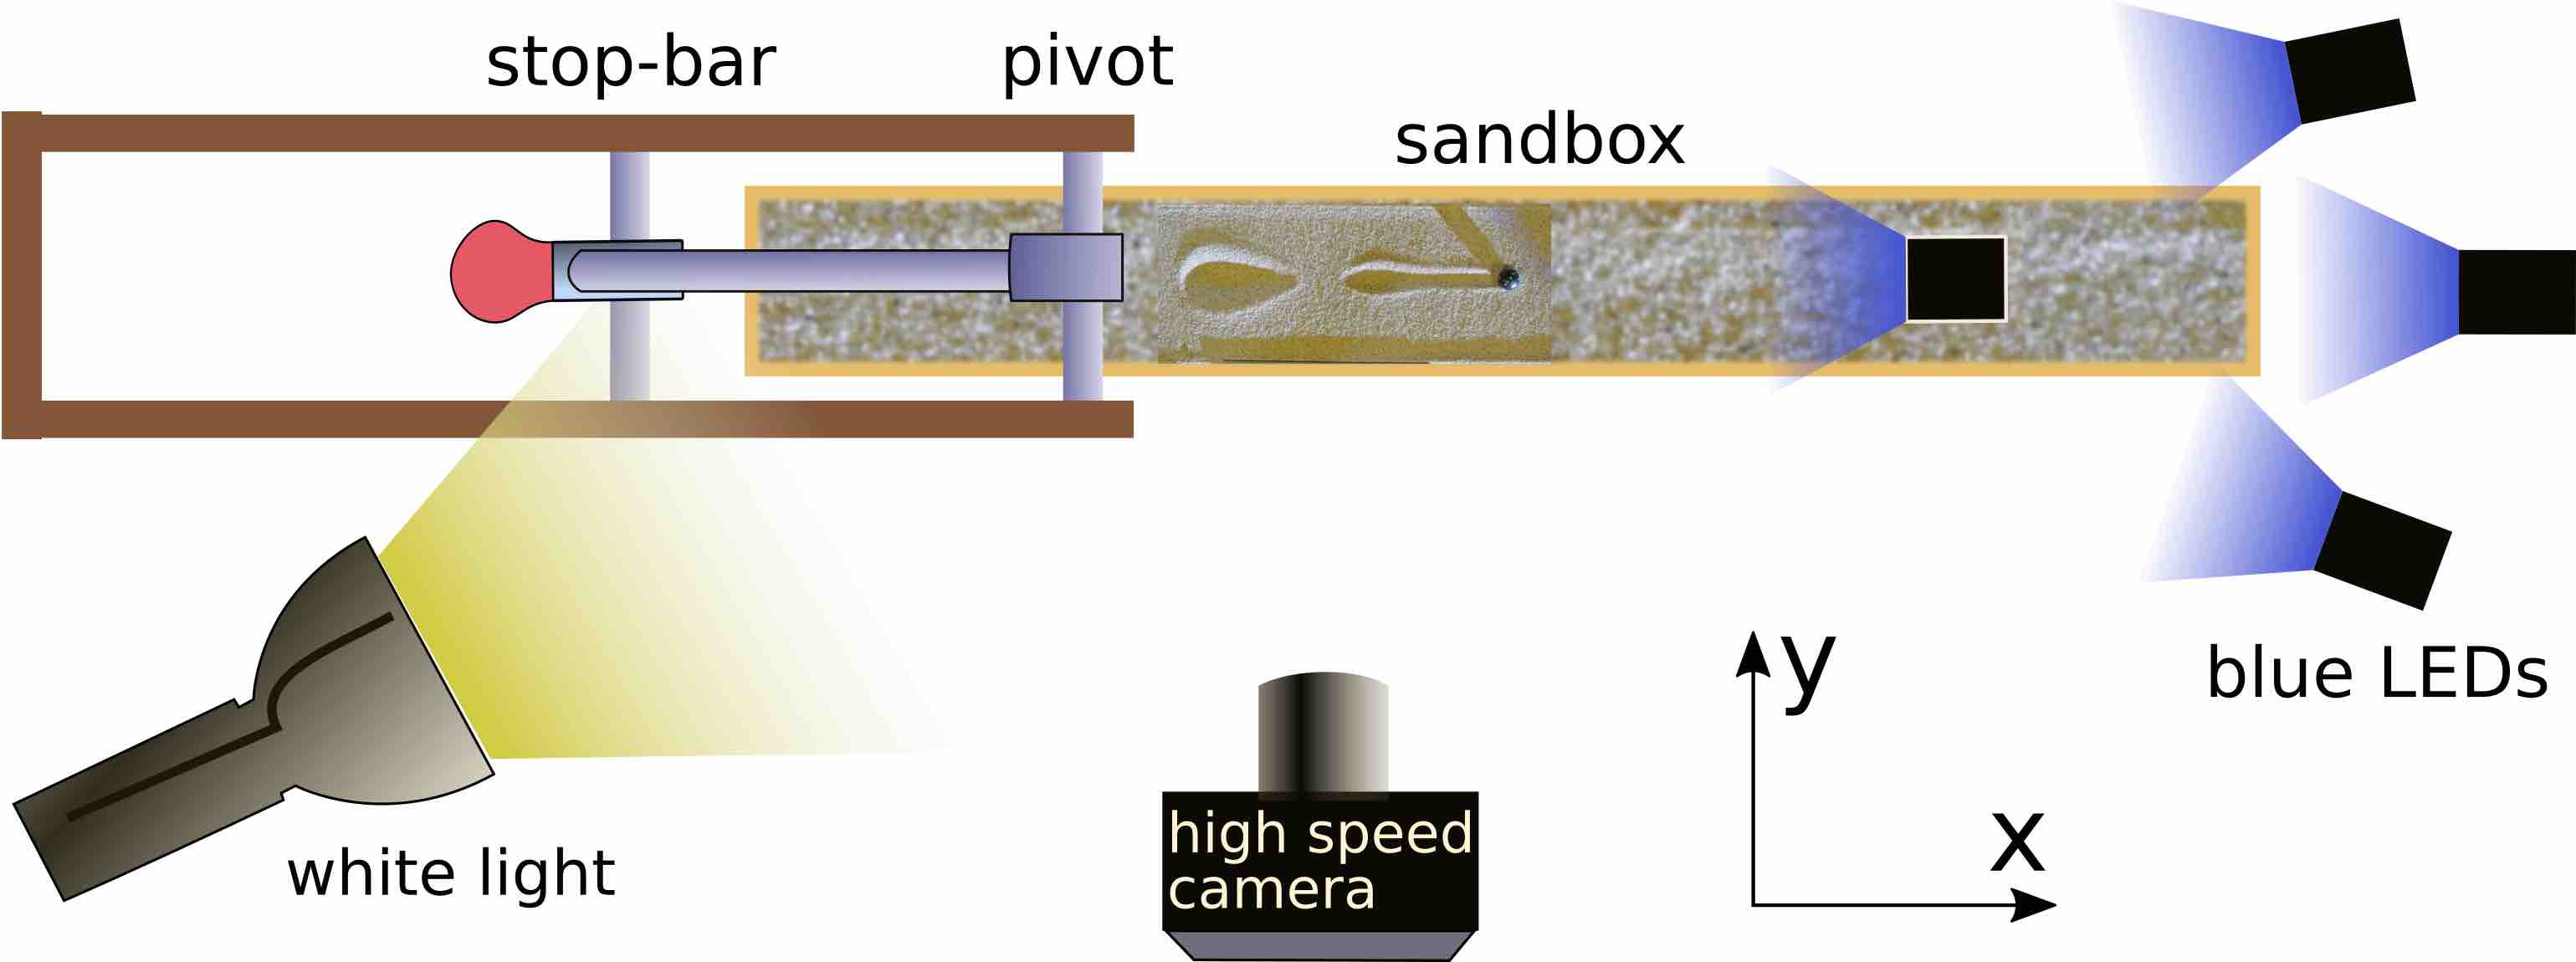
We desire a way to launch projectiles that minimizes initial spin, allows us to adjust impact velocity and impact angle and gives reproducible craters and outcomes (ricochet or not). After trying a rail gun, we settled on a pendulum launcher because it gave us low projectile spin and more repeatable impact velocities and angles. The pendulum is raised to a set height and then drops due to gravity until it hits a horizontal stop-bar. The location of the bar that stops the pendulum as it swings down sets the projectile impact angle. Our pendulum setup is illustrated in Figure 2. A photograph of the experimental setup is shown in Figure 3 and a close up view in Figure 4. An illustration of the sandbox, camera and lighting as viewed from above is shown in Figure 5.
Prior to letting the pendulum drop, the marble is held up against a thin rubber washer. A red turkey baster handle is used to apply light suction to the marble to hold it in place. A light tap on the pendulum is enough to break the suction and eject the marble. Because the required tap is light, the marble suffers only a small reduction in velocity during ejection. The marble is ejected with some backspin (angular rotation rate rad s-1), that is usually well below the size of the horizontal velocity component divided by marble radius ( 100 to 300 rad s-1). Backspin is larger than expected from the pendulum swing which would be rad s-1. is the velocity of the marble when ejected from launcher, and is the radial distance from the pivot to the ejection point. The backspin must be caused by uneven friction or suction when the marble exits its holder. Measurements for the marble spin are discussed in more detail in section 3.1.
Craters in our sandbox were increasingly reproducible after mechanical vibrations were reduced. The pendulum rod is a hollow aluminum pipe, replacing a narrower and heavier steel rod that flexed upon impact. The aluminum rod still flexes some on impact and this might be the cause of the ejected marble’s backspin. The pendulum pivot is clamped to a lab table to prevent bounces and vibration during the impact between pendulum and horizontal stop-bar. We adjusted the angle of the marble holder so that the marble is ejected in the same plane of the pendulum. The connection between marble holder and pendulum rod was shimmed and tightened so that it did not rotate. We added super glue to the the thread at the top of the pendulum rod to prevent it from turning. Prior to each impact experiment, we checked that the sand tray is leveled in directions parallel and perpendicular to the marble launcher using a bubble level.
The pendulum itself is cm long, but the radial distance from pivot to marble ejection point is cm long. Due to its extended mass distribution, the pendulum is a compound pendulum. We measured the moment of inertia of the pendulum from its period of small oscillations ( s) and its center of mass radius from the pivot, cm using the relation
| (2) |
where and are the mass and moment of inertia (about the pivot point) of the pendulum. Measurements of the pendulum are listed in Table 1. The inside dimensions of the sandbox are 87.5 cm long, 11.5 cm wide and 6.3 cm deep.
2.1 Delineating ricochets from roll-outs and stops
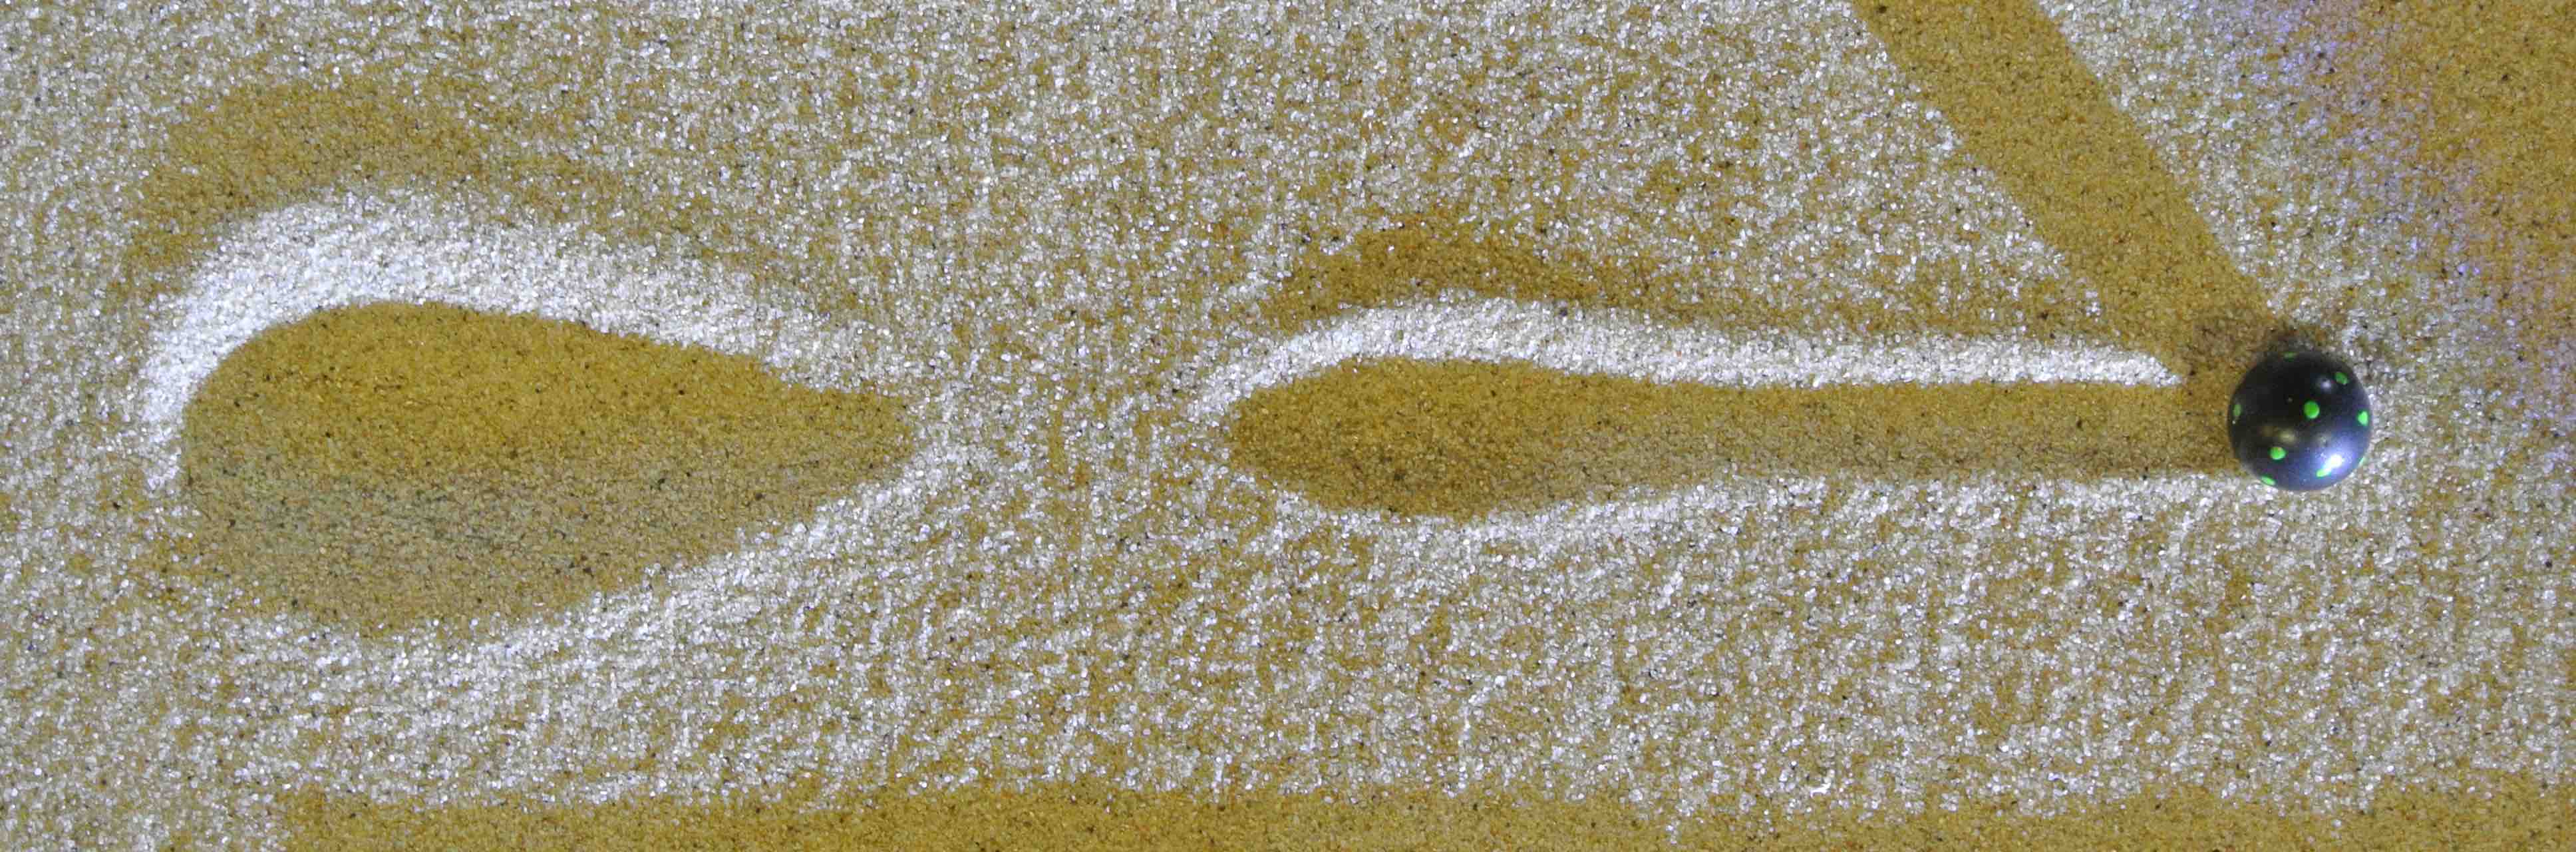
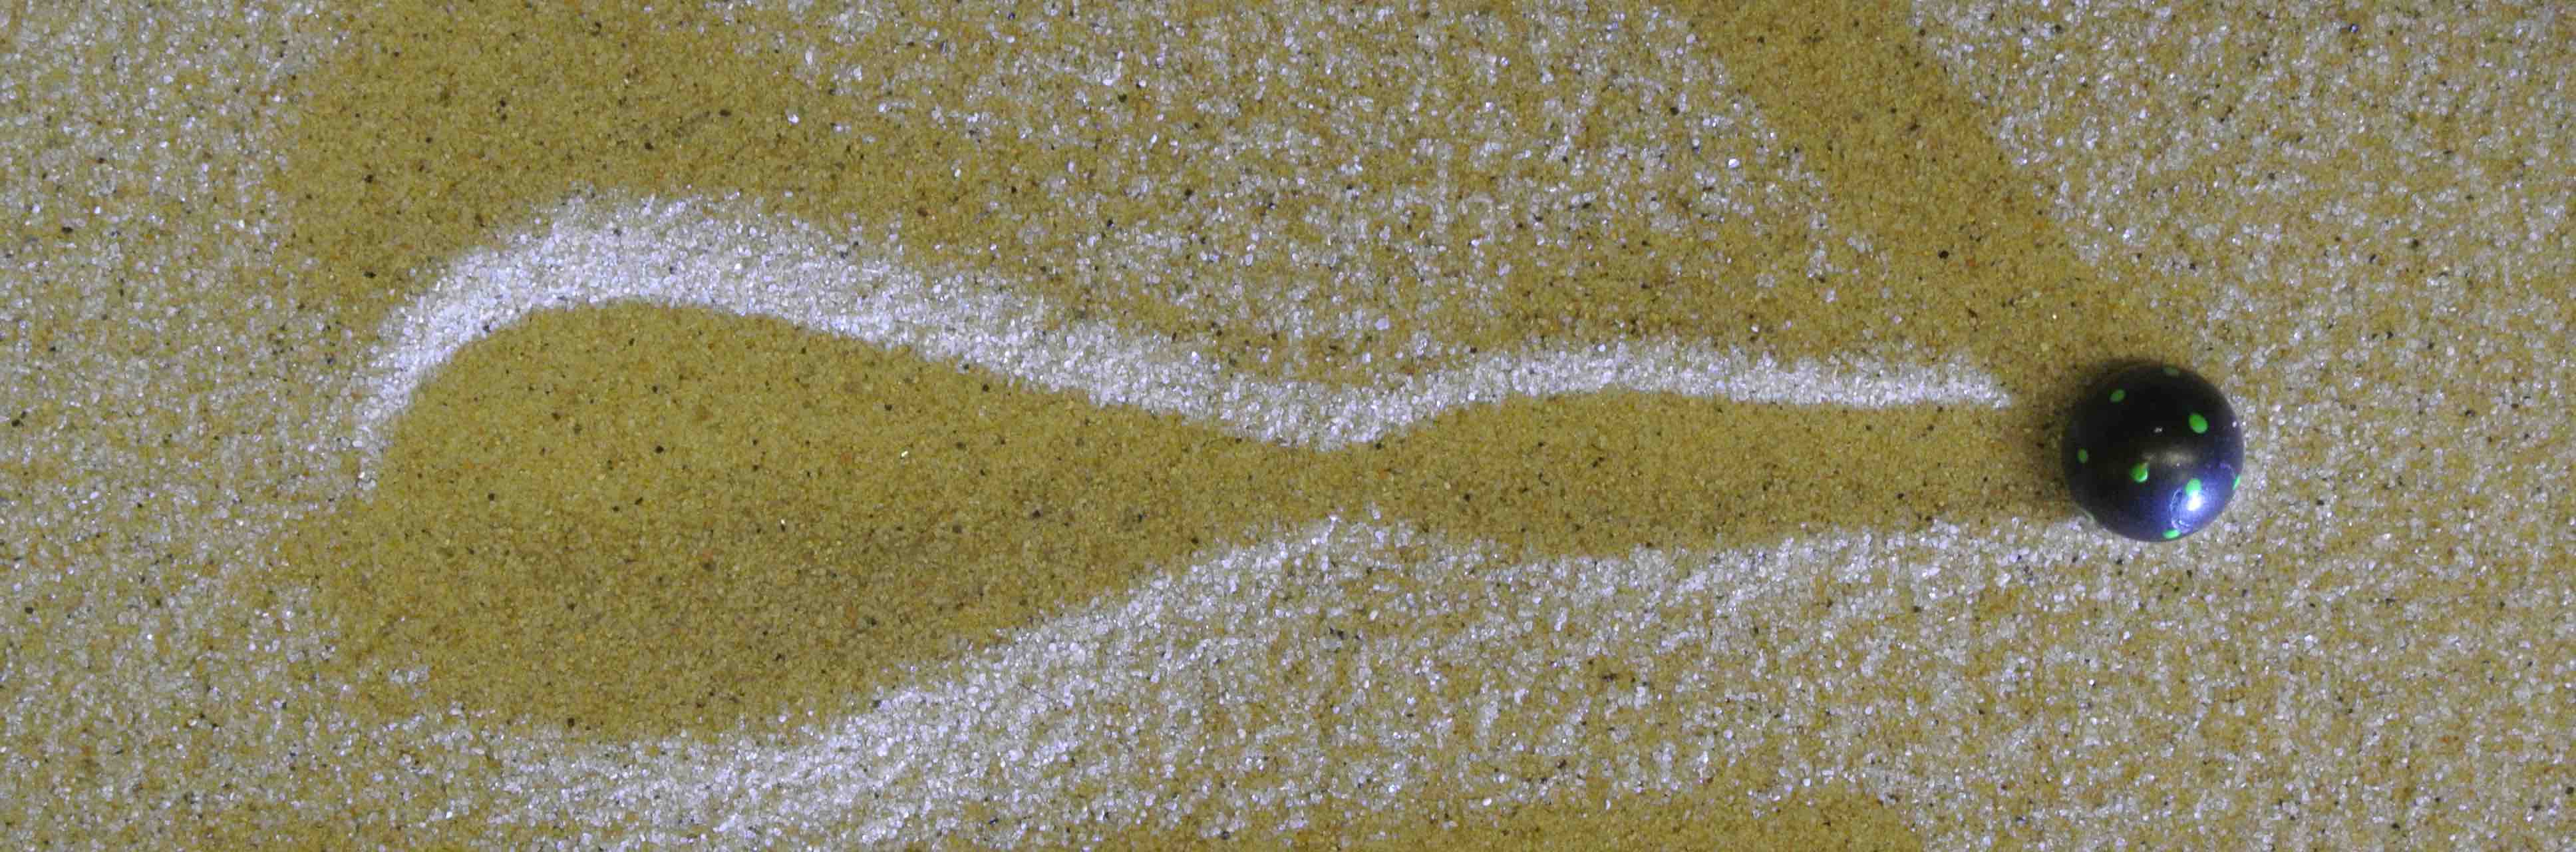
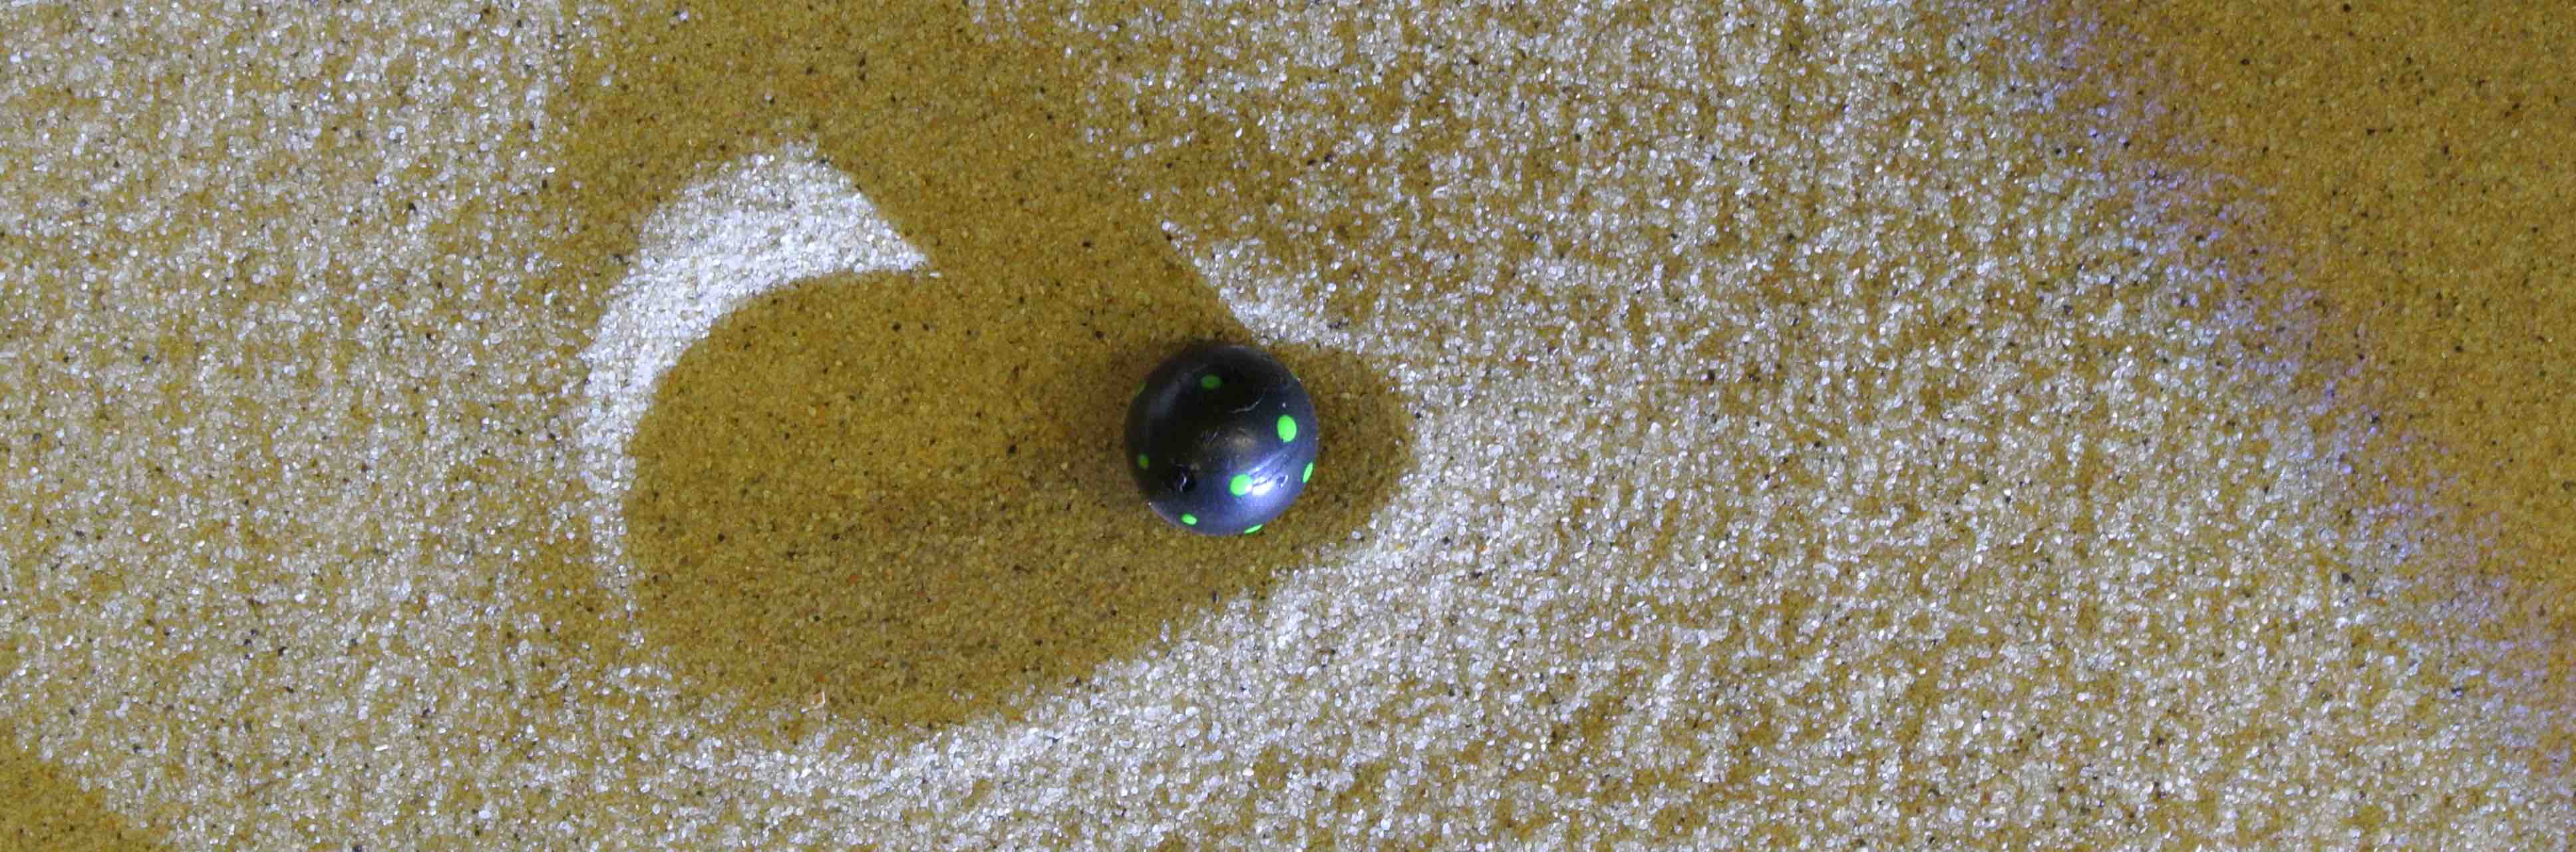
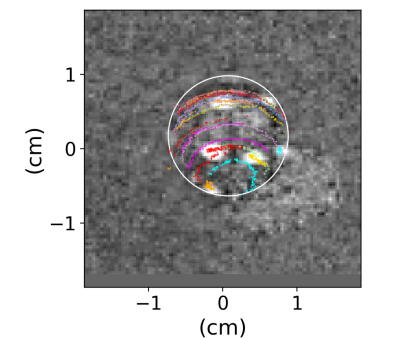
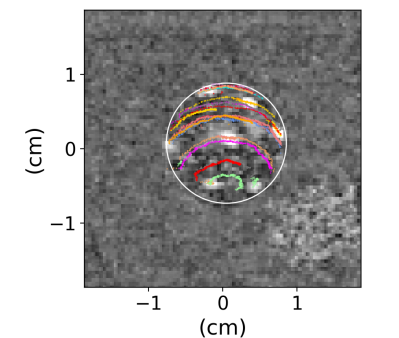
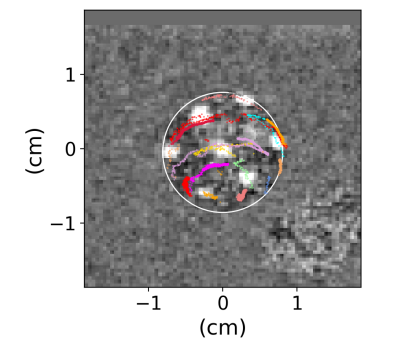
Photographs of impact craters from three different laboratory experiments are shown in Figure 6. These photographs were taken from above the sand tray looking downward after the impact of a projectile with velocity of a few m/s and at oblique angles. We used the resulting impact crater morphologies to classify our impacts as a ricochet, roll-out, or stop. A crater was classified as ricochet if there was a clear gap between a primary crater and a secondary one, as shown in Figure 6(a). An impact was classified as a roll-out if the marble rolled out of its crater, as shown in Figure 6(b). An impact was classified as a stop if the marble rested inside its impact crater after impact, as shown in Figure 6(c).
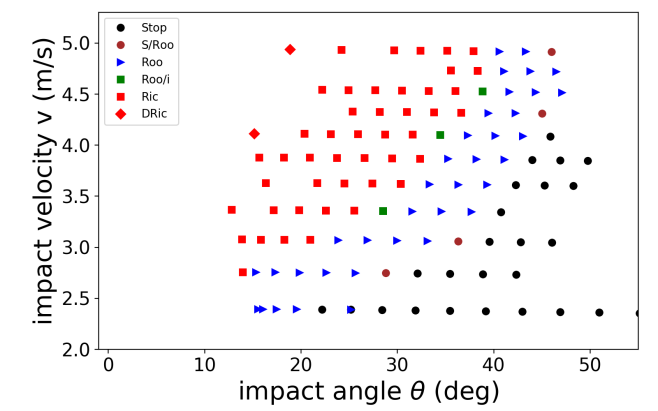
Using our pendulum setup described above we sampled the impact parameter space using about 120 unique combinations of the impact velocity and angle. The outcomes of the impact experiments are categorized as ricochet, roll-out, or stop and are plotted with different point types and colors in Figure 7 as a function of computed and . Each combination of impact velocity and angle was run multiple times to check for consistency in results. We set the impact velocity by adjusting the height of the pendulum and impact angle by the stop-bar position. For each impact, we recorded the initial pendulum drop height and the angle of the stop-bar . These two measurements were used to estimate the velocity of impact and the angle of impact , measured from horizontal so that a grazing impact has a low impact angle.
We describe how impact velocity and impact angle are computed from the initial pendulum drop height and stop-bar angle . The initial drop height from the mechanism base, , and distance of pendulum top to mechanism base when vertical, , as shown in Figure 2, are used to calculate the initial angle of the pendulum , (measured from vertical) with and using the pendulum length . The pendulum’s angular velocity at the moment the pendulum stops at the stop-bar and the projectile is ejected from its holder is
| (3) |
The radius of the pendulum’s center of mass is (from its pivot) and the angle is the angle set by the stop-bar from vertical. The speed of the marble when ejected from its holder is
| (4) |
Here is the radial distance from the pivot to the center of the marble when it is in the launcher. The marble’s horizontal and vertical velocity components are and .
We correct for the distance of projectile free fall before hitting the substrate surface, even though this correction is usually small. After it is ejected, the marble freely falls a distance of
| (5) |
to hit the sand, where is the height of sand surface above the pendulum mechanism base. The estimated velocity of projectile impact with the sand substrate is
| (6) |
and the angle of impact (measured from horizontal) is
| (7) |
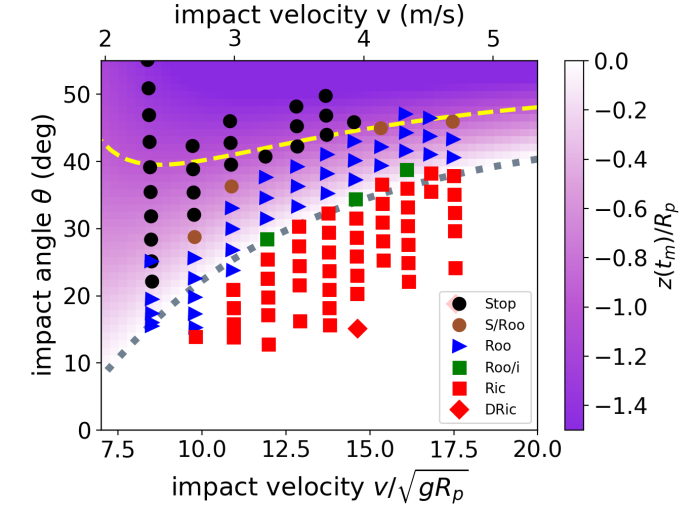
The velocity and angle of impact along with classifications based on impact crater morphology were used to make Figure 7. Figure 7 shows that crater morphology and impact behavior depends on both impact angle and velocity. At higher velocities and lower impact angles ricochets are more likely. Below a velocity of about 2 m/s grazing impacts had projectiles that rolled out of their crater rather than bounced off the sand. The dividing line between ricochet and roll-out and that between ricochet and stop was sometimes sensitive to vibrations and wobble in the apparatus. We noticed that the location of the ricochet/roll-out line shifted when we inserted shims into the pivot holder to keep it from vibrating during impact. With vibrations reduced, events were repeatable, with series of three or four trials at the same initial pendulum height and stop-bar position giving the same impact crater morphology and event classification. We tentatively assign a ° error to each point in Figure 7 that is due to variations in stiffness in the mechanical launch mechanism that we have tried to minimize. This value was the largest discrepancy between the estimated and measured impact angles. Estimated and measured impact velocities agree. The discrepancy in impact angle is discussed below.
Figure 7 shows that the dividing line between different outcomes is quite sensitive to the angle of impact. The dividing line trend is opposite to that found by Soliman et al. (1976) as we see the critical grazing impact angle dividing ricochets from roll-outs increases as a function of impact velocity, rather than decreases. There are some differences between our experiments and theirs that might explain this difference in behavior. Our projectile density is similar to the substrate density (glass marbles into sand), whereas Soliman et al. (1976) used denser projectiles (steel, aluminum and lead balls into sand). Their projectiles have higher velocity (theirs were up to 180 m/s and ours are below 5 m/s). Both our and their projectiles are spherical. Both sets of experiments can be considered at high Froude number where impact velocity gives . The Froude number of our impacts are 10–20, whereas those by Soliman et al. (1976) are 300–600.
Our projectiles remain in a shallow penetration regime, where the maximum penetration depth rarely exceeds the projectile diameter. We designed our experiment to minimize initial projectile spin. Unfortunately projectile spin is not discussed by these early works (though see the discussion on bouncing bombs by Johnson 1998). Models that predict granular flow above a particular stress level (Bagnold, 1954) might account for the higher lift we infer in our lower velocity experiments that give us ricochets at high impact angles, as the medium could be effectively stiffer at lower impact velocity. Alternatively lower velocity and lower projectile density, giving shallower levels of penetration, may be increasing the likelihood of ricochets in our experiments. Since collisions on asteroids are likely to have similar projectile and substrate densities, our experiments suggest that ricochets could be common in the low velocity regime.
2.2 The critical angle for ricochet
A ricochet takes place when the lift force is at least large enough to overcome the gravitational force and this must happen before drag forces reduce the horizontal velocity component velocity to zero (Johnson and Reid, 1975; Soliman et al., 1976; Bai and Johnson, 1981). For spherical projectiles, a lift force dependent on the square of the depth times the square of the velocity and a constant downward gravitational acceleration were adopted by Soliman et al. (1976) to estimate a critical impact angle for ricochet
| (8) |
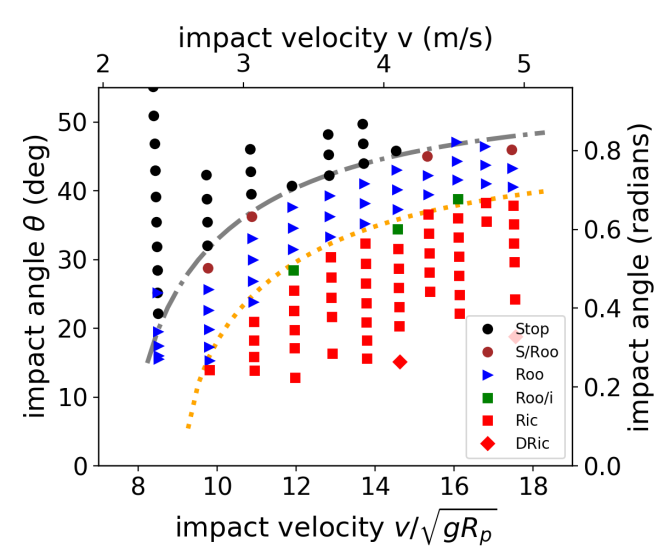
At a particular velocity, ricochets occur at impact angles below the critical one. The term on the right is proportional to the inverse of the square of the Froude number and was originally calculated for ricochets on water (Johnson and Reid, 1975; Birkhoff et al., 1944). The term on the left is only dependent on the substrate and projectile density ratio. At high velocities the critical angle only depends on the density ratio. In the limit of high velocity, equation 8 predicts a critical angle of for our substrate to projectile density ratio of . At the higher velocities in Figure 7, we saw ricochets at impact angles up to , so this model does not apply very well in the regime of our experiments.
Equation 8 predicts that the critical angle is larger at higher velocity. This behavior is seen on water, but ricochets on sand can deviate from this behavior and can scale in the opposite way with critical angle decreasing at higher velocity (see Figure 8 by Soliman et al. 1976). Bai and Johnson (1981) modified equation 8 with the addition of a constant pressure term dependent on parameter adding to the lift,
| (9) |
This additional term allowed them to account for a decreasing critical angle with increasing impact velocity, which was seen in their experiments.
As we see an increase in impact angle with increasing velocity, the simpler model by Soliman et al. (1976) might give a line that matches the division seen in our experiments. We found a similar line that does delineate the impact outcomes and it is shown in Figure 8 as a dotted orange line. Figure 8 shows the same experiments as Figure 7 except we rotated the axes so that is a function of the Froude number or with the marble radius. The orange dotted line that separates the ricochets from the roll-outs is
| (10) |
with in radians. A similar line, separating roll-outs from stops is shown as a grey dot-dashed line on Figure 8.
| (11) |
The second term in equation 8 is 4 times the square of the Froude number but our orange dotted line requires a number 13 times larger than this. The constant term in Equation 8 was predicted to be 1/10th the density ratio. Our substrate to marble density ratio is about 0.64 so the size of the constant term in Equation 10 is about 10 times higher than expected. The orange dotted line on Figure 8 (from equation 10) is not consistent with the ricochet model by Soliman et al. (1976).
The orange dotted line on Figure 8 (equation 10) represents our first attempt to model the line dividing ricochets from other types of events. This expression will be revisited and improved later on in this paper only after the experimental measurements are discussed.
3 Trajectories
The marbles were painted with a black undercoat. On top of the undercoat they were painted with 18 dots of fluorescent paint to aid in tracking the projectile’s spin. We lit the experiment with bright blue LEDs, causing the paint dots to fluoresce green. The LEDs are CREE XLamp XT-E Royal Blue that peak at 450 nm.111https://www.cree.com/led-components/media/documents/XLampXTE.pdf We were careful to use a fluorescent paint that is detected as bright when viewed with our high speed video camera. We used 4 wide angle blue LEDs to light the sandbox, primarily from the right side, as shown in Figures 2 5, and 3. The 4 blue light sources made this lighting fairly diffuse.
We also lit the impact region with a single bright white light from the top left side (see the photograph in Figure 3). With projectiles moving left to right, this gave a single white reflection on the marble that could be seen from the front of the experiment during most of the impact. The ejecta curtain tended to obscure the right side of the marble during the impact. We used the white reflection to track the marble’s center of mass motion.
We filmed the impacts with a Krontech Chronos 1.4 high speed camera at 3000 frames per second. The marble diameter (16.15 mm) was used to find the pixel scale in the video image frames. The high speed videos were taken from a 45∘ angle from vertical (see Figure 3), allowing us to track both horizontal and vertical projectile motions. The impact craters were used to verify that marble trajectories remained in the pendulum’s plane. Videos used to track the projectiles can be found in the supplemental materials.
3.1 Data reduction
As our high speed camera takes color images, using weighted sums of red, green and blue color channels we could emphasize the white light reflection or remove it and focus on the fluorescent green markers. The white light reflections were used to track the marble center of mass. The fluorescent green markers were used to measure the marble spin.
We use the soft-matter particle tracking software package trackpy (Allan et al., ) to identify and track the fluorescent dots and reflections on the projectile seen in individual video frames. Trackpy is a software package for finding blob-like features in video, tracking them through time, linking and analyzing the trajectories. It implements and extends in Python the widely-used Crocker-Grier algorithm for finding single-particle trajectories (Crocker and Grier, 1996).
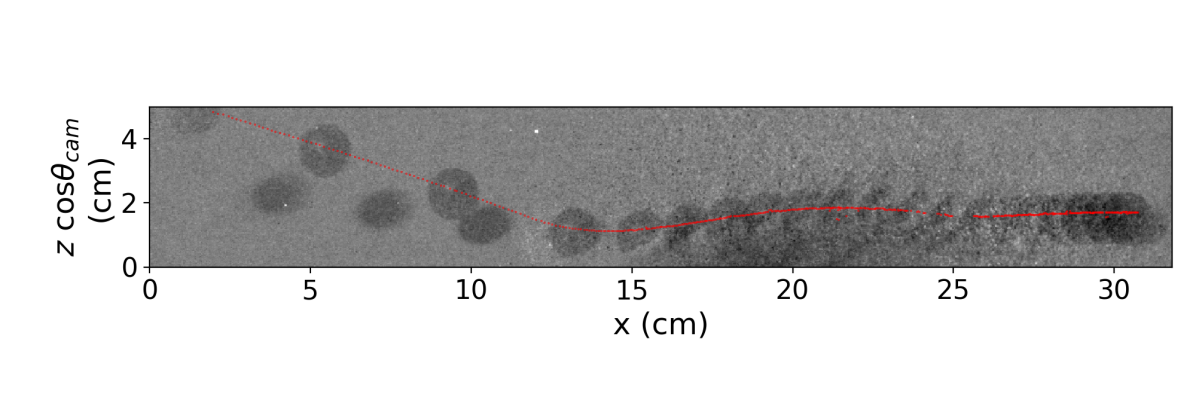
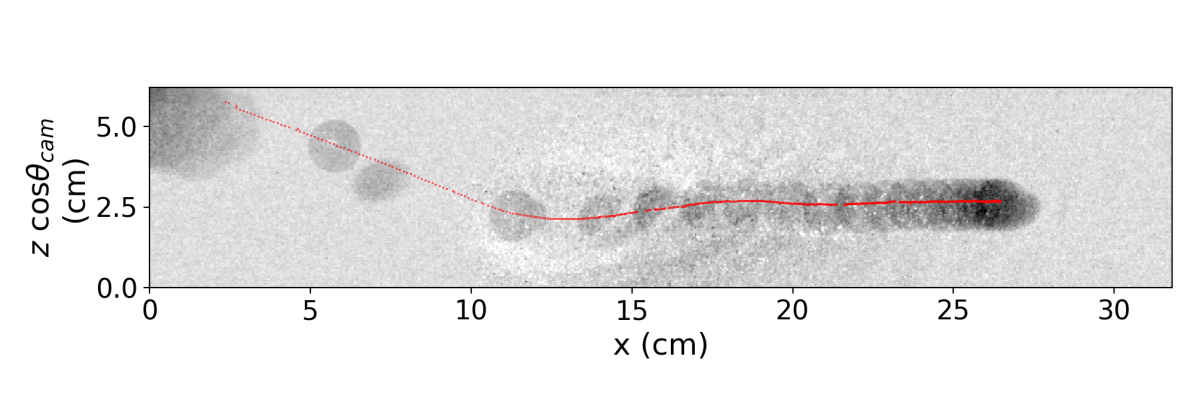
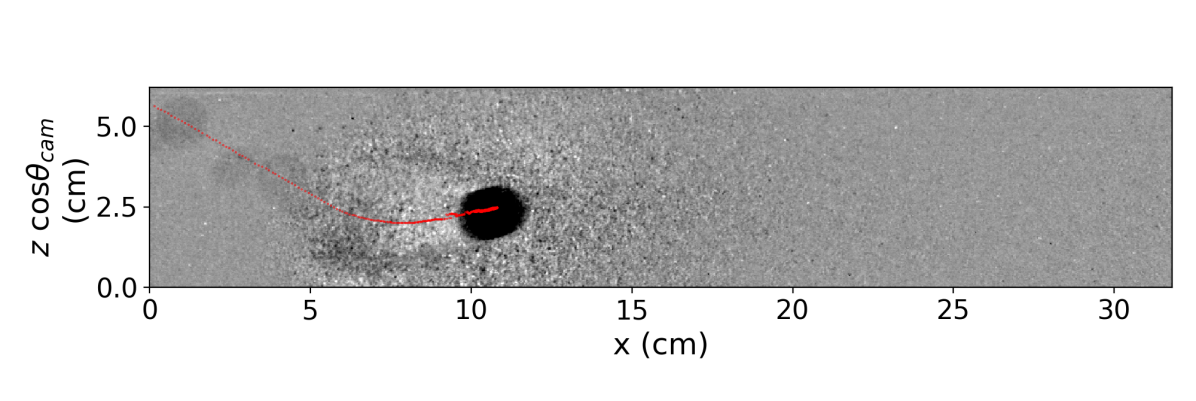
We first tracked the position of the white light reflection on the marble in each video frame. Prior to tracking we used a series of images to construct a median image which was subtracted from each video frame. We adjusted the radius and integrated peak brightness so that the reflection was identified by the tracking software and also so that the number of sand particles tracked is reduced. We eliminated spurious tracks by hand, leaving only the tracked white light reflection. The white light reflection track measured from three high speed videos is shown on top of a sum of images in Figure 9. The horizontal axis is the marble’s position in x and the vertical axis is the projected z direction as the camera was positioned 45° above the sand tray’s surface plane.
The positions of the white light reflection plus a constant offset gives us an estimate for the marble center of mass position as a function of time. We adopt a coordinate system with increasing in the horizontal direction along the direction of the projectile motion and increasing in the vertical direction. Projectile trajectories remained nearly in the plane (pendulum plane). The and marble position vectors were interpolated from the arrays of tracked positions so as to be evenly sampled in time. The vertical positions were corrected to take into account the camera viewing angle from horizontal. Because the camera frame was oriented parallel to the horizontal direction of the projectile motion, we did not need to correct the direction for camera viewing angle. The time vector is computed from frame numbers by dividing by the video frame rate (3000 fps). We estimated the time and position of impact from the first frame showing an ejecta curtain. We median filtered the and position arrays using a width of 11 samples which is 3.6 ms at a sampling rate of 3000 Hz. To compute velocities and accelerations, we smoothed the arrays using a Savinsky-Golay filter with widths of 15 and 17 samples respectively. We checked that the white light reflection used to track the center of mass of the marble did not change position on the surface during its motion. Trajectories of the marble center of mass as a function of time are shown in Figure 10. The origin of these plots correspond to the time and location of impact.
To measure the marble spin we used the video frames’ green channel, showing the fluorescent markers. We shifted each image using the previously computed marble center of mass positions to put the marble in the center of the image. We then tracked the fluorescent markers again using the trackpy software package. Tracks of the fluorescent markers spanning whole videos are shown in Figure 11 for three videos. Even though the marble spin varies as a function of time, the tracks in each figure lie on similar arcs. This implies that the spin orientation did not significantly vary throughout the video. This does not imply that the marble’s angular rotation rate remained fixed. The orientation of the arcs are consistent with a horizontal spin axis and the camera orientation angle, , of 45° with respect to vertical.
To measure the spin angular rotation rate we fit tracks during short intervals of time ( ms). Assuming a spherical surface, each track is described by the spin orientation angle, the angular rotation rate and an initial fluorescent dot position on the marble surface. We constructed a minimization function that is the sum of differences between predicted (via rotation) and observed tracked particle positions. We simultaneously fit for the initial dot positions and the angular rotation rate.
The vertical error bars for the angular rotation rates were determined by varying parameters that went into the angular velocity fitting routine such as center of mass position, camera angle, and projectile radius. The largest source of error was identified from the uncertainty in the radius. An uncertainty of 3 pixels in the radius gave a 10% error in the spin values. A radius of 33 pixels was used for our projectile spin fitting. Horizontal error bars for the angular rotation rates show the time interval used to measure the spin.
Table 3 lists experiments along with initial pendulum arm settings: height h, the stopping bar angle , and distance of sand surface to the pendulum base . Predicted impact velocities and angles were found using equations 6 & 7 respectively. Measured impact velocities and angles were obtained from marble trajectories just before impact. The predicted and measured impact velocities are consistent. The measured impact angles were about 5° lower than predicted for the ricochet and roll-out events.
The discrepancy between the predicted and measured angles are attributable to errors in the pendulum setup. Soft rubber was used on the launcher to better hold the marble. This could lead to a nonuniform suction causing the marble to not separate from the launcher once it hits the stopping bar. The pendulum hitting the stopping bar also caused the post to bend slightly. This was minimized by using a thicker post. The pendulum arm can also bounce when hitting the stopping bar. Lead weights were added to the base of the pendulum arm to reduce shaking during marble launch.
 |
 |
 |
| Length of pendulum | 94.8 cm | |
| Period of small oscillations | 1.78 s | |
| Moment of inertia divided by mass | 3972 cm2 | |
| Radius of pendulum’s center of mass | 50.5 cm | |
| Radius of marble holder from pivot | 84.3 cm | |
| Distance of pendulum tip to base | 1.5 cm | |
| Distance of base to sand surface | 9.9 cm | |
| Diameter of marble | 16.15 mm | |
| Mass of marble | 5.57 g | |
| Density of marble | 2.5 g/cm3 | |
| Unit of velocity | 28.1 cm/s | |
| Density of sand | 1.6 g/cm3 | |
| Sand angle of repose | 32∘ | |
| Coefficient of friction | 0.51 | |
| Camera Angle | 45° | |
| Inside dimensions of Sand Tray | 87.5 x 11.5 x | |
| 6.3 cm |
| Projectile mass | ||
| Surface gravitational acceleration | ||
| Projectile radius, if spherical | ||
| Granular substrate mean density | ||
| Projectile density | ||
| Projectile velocity at impact | ||
| Projectile velocity vector | ||
| Projectile cross sectional area | ||
| Critical impact angle | ||
| Froude number | Fr | |
| Horizontal coordinate | ||
| Vertical coordinate | ||
| Normalized vertical coordinate | ||
| Depth below surface level | with | |
| Impact angle | ||
| Drag force | ||
| Lift force | ||
| Coefficient of static friction | ||
| Angle of repose | ||
| Stopping time | ||
| Maximum penetration depth | ||
| Horizontal velocity component | ||
| at maximum depth | ||
| Time of maximum height | ||
| during rebound | ||
| Height reached in rebound | ||
| Drag coefficients | ||
| Lift coefficient | ||
| Effective friction coefficient | ||
| Vertical, horizontal acceleration | , | |
| Angular acceleration | ||
| Angle of stop-bar | ||
| Height of tip of pendulum arm | ||
| Drop angle of pendulum arm | ||
For a grazing impact . The vertical coordinate is positive upward. The horizontal coordinate is positive with the initial direction of projectile motion.
| Event/Video | |||||||
|---|---|---|---|---|---|---|---|
| (cm) | (deg) | (cm) | (cm/s) | (cm/s) | (deg) | (deg) | |
| Ricochet | 110 | 25 | 9.9 | 454 | 444 | 30.5 | 25.3 |
| Roll-out | 90 | 30 | 14.5 | 399 | 391 | 35.1 | 29.1 |
| Stop | 90 | 35 | 14.5 | 398 | 396 | 38.8 | 38.5 |
3.2 Shapes of Trajectories
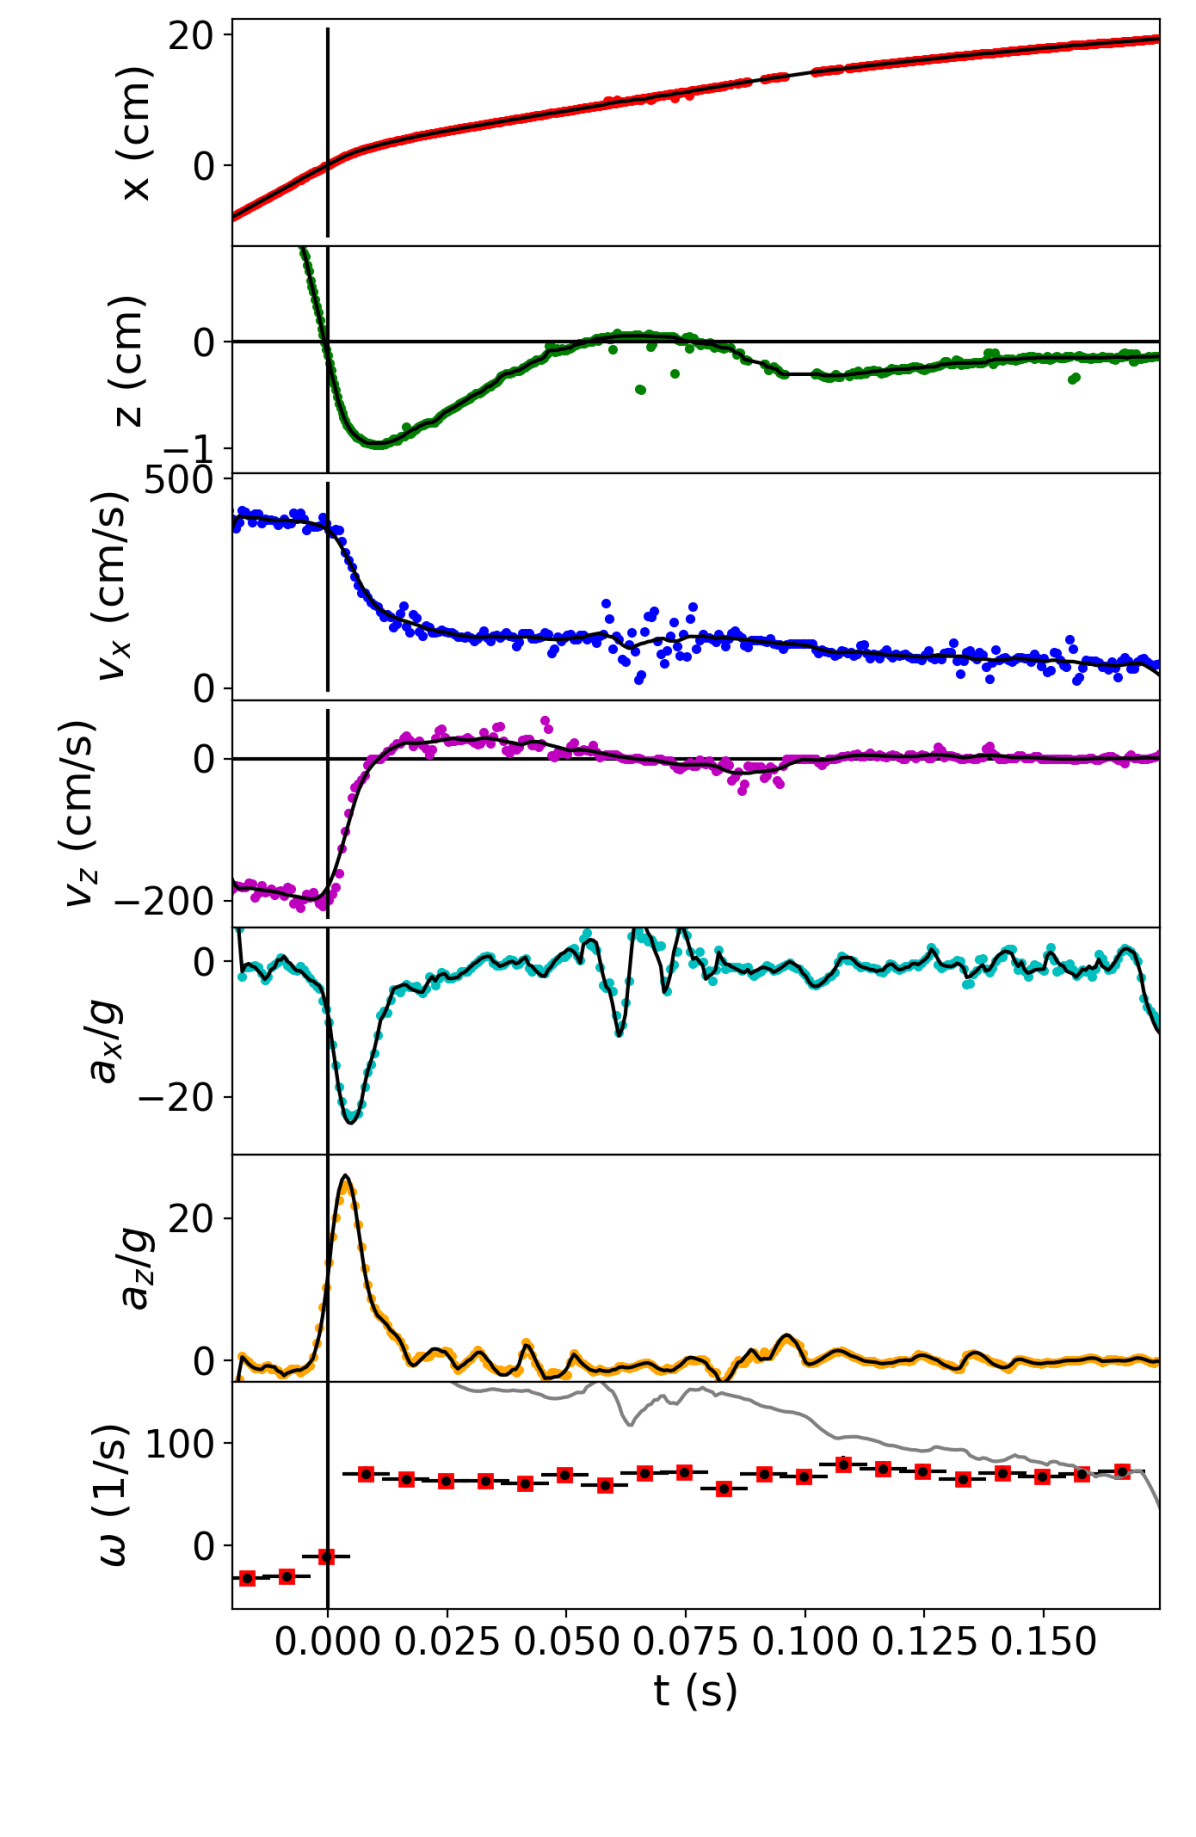
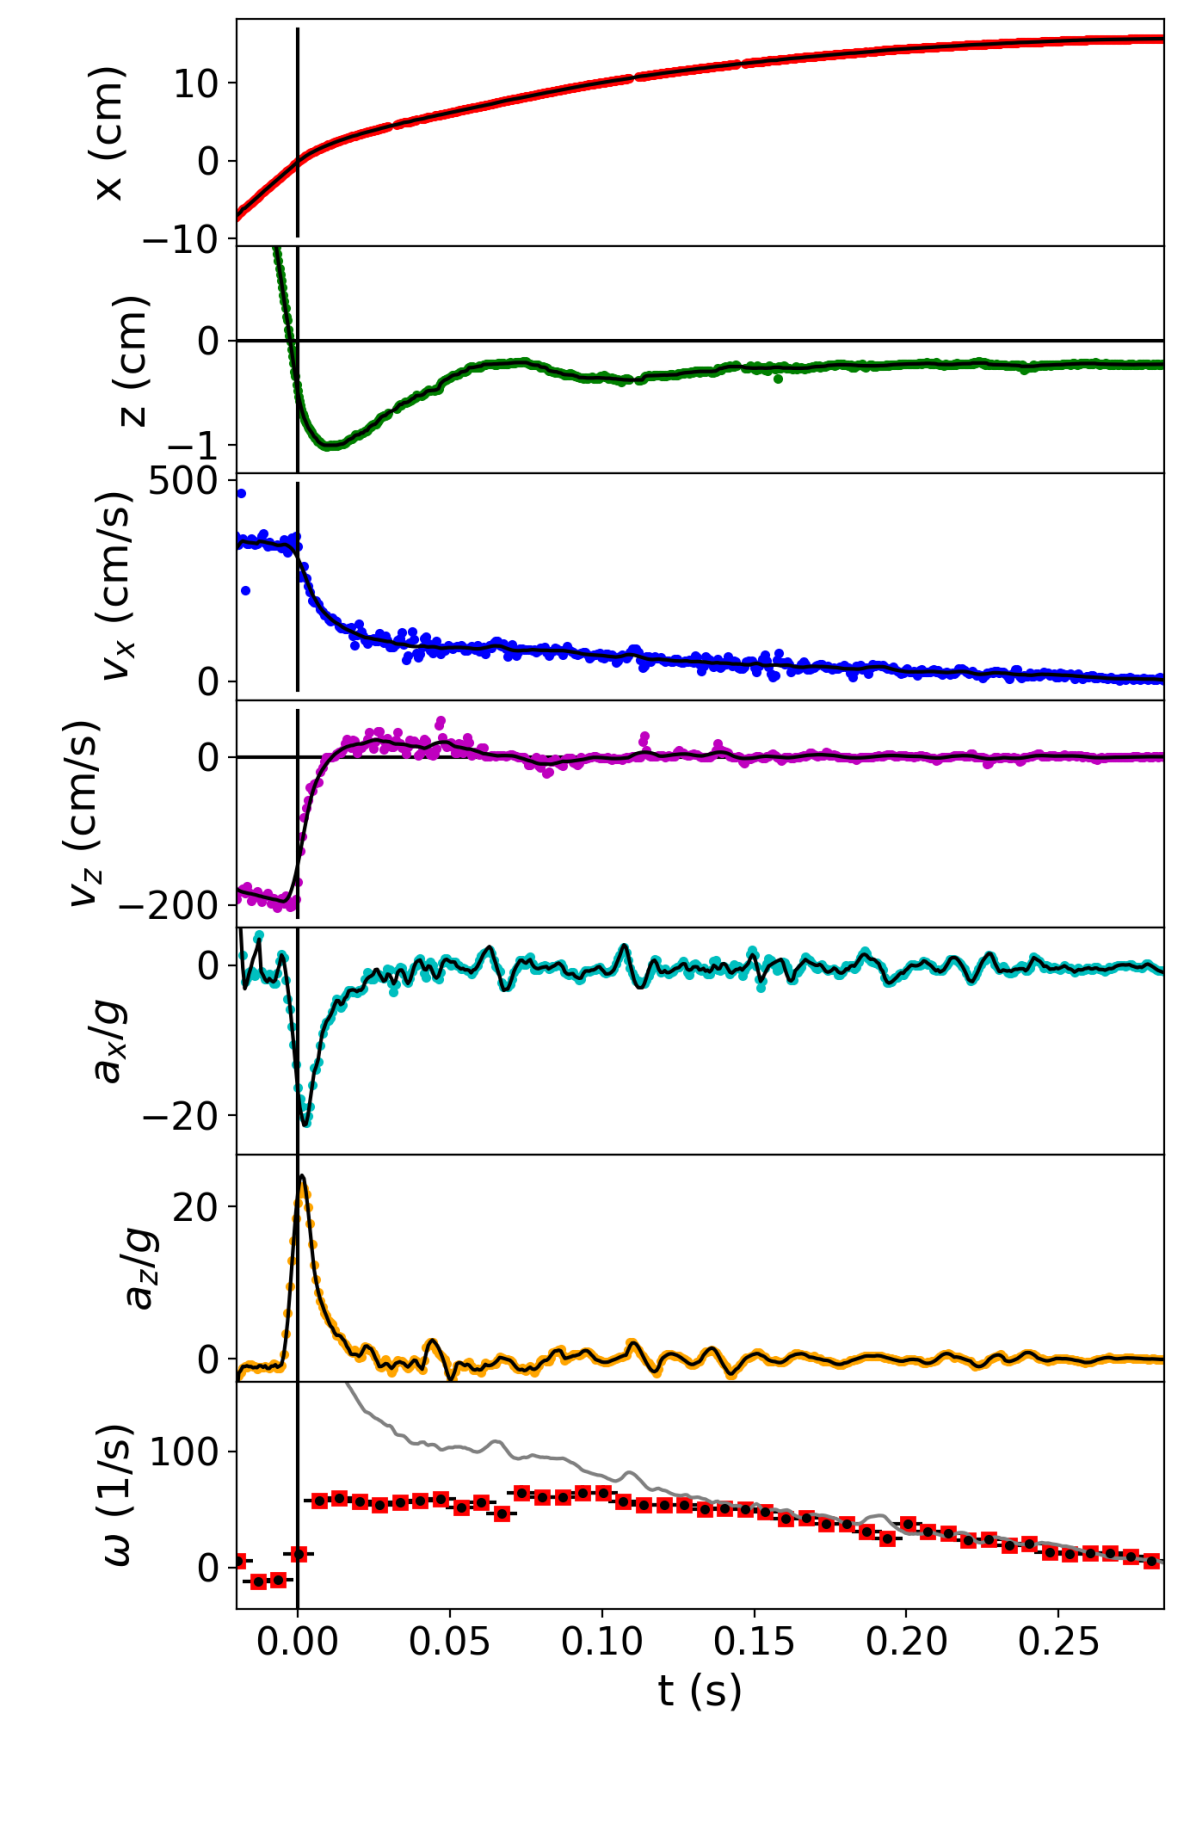
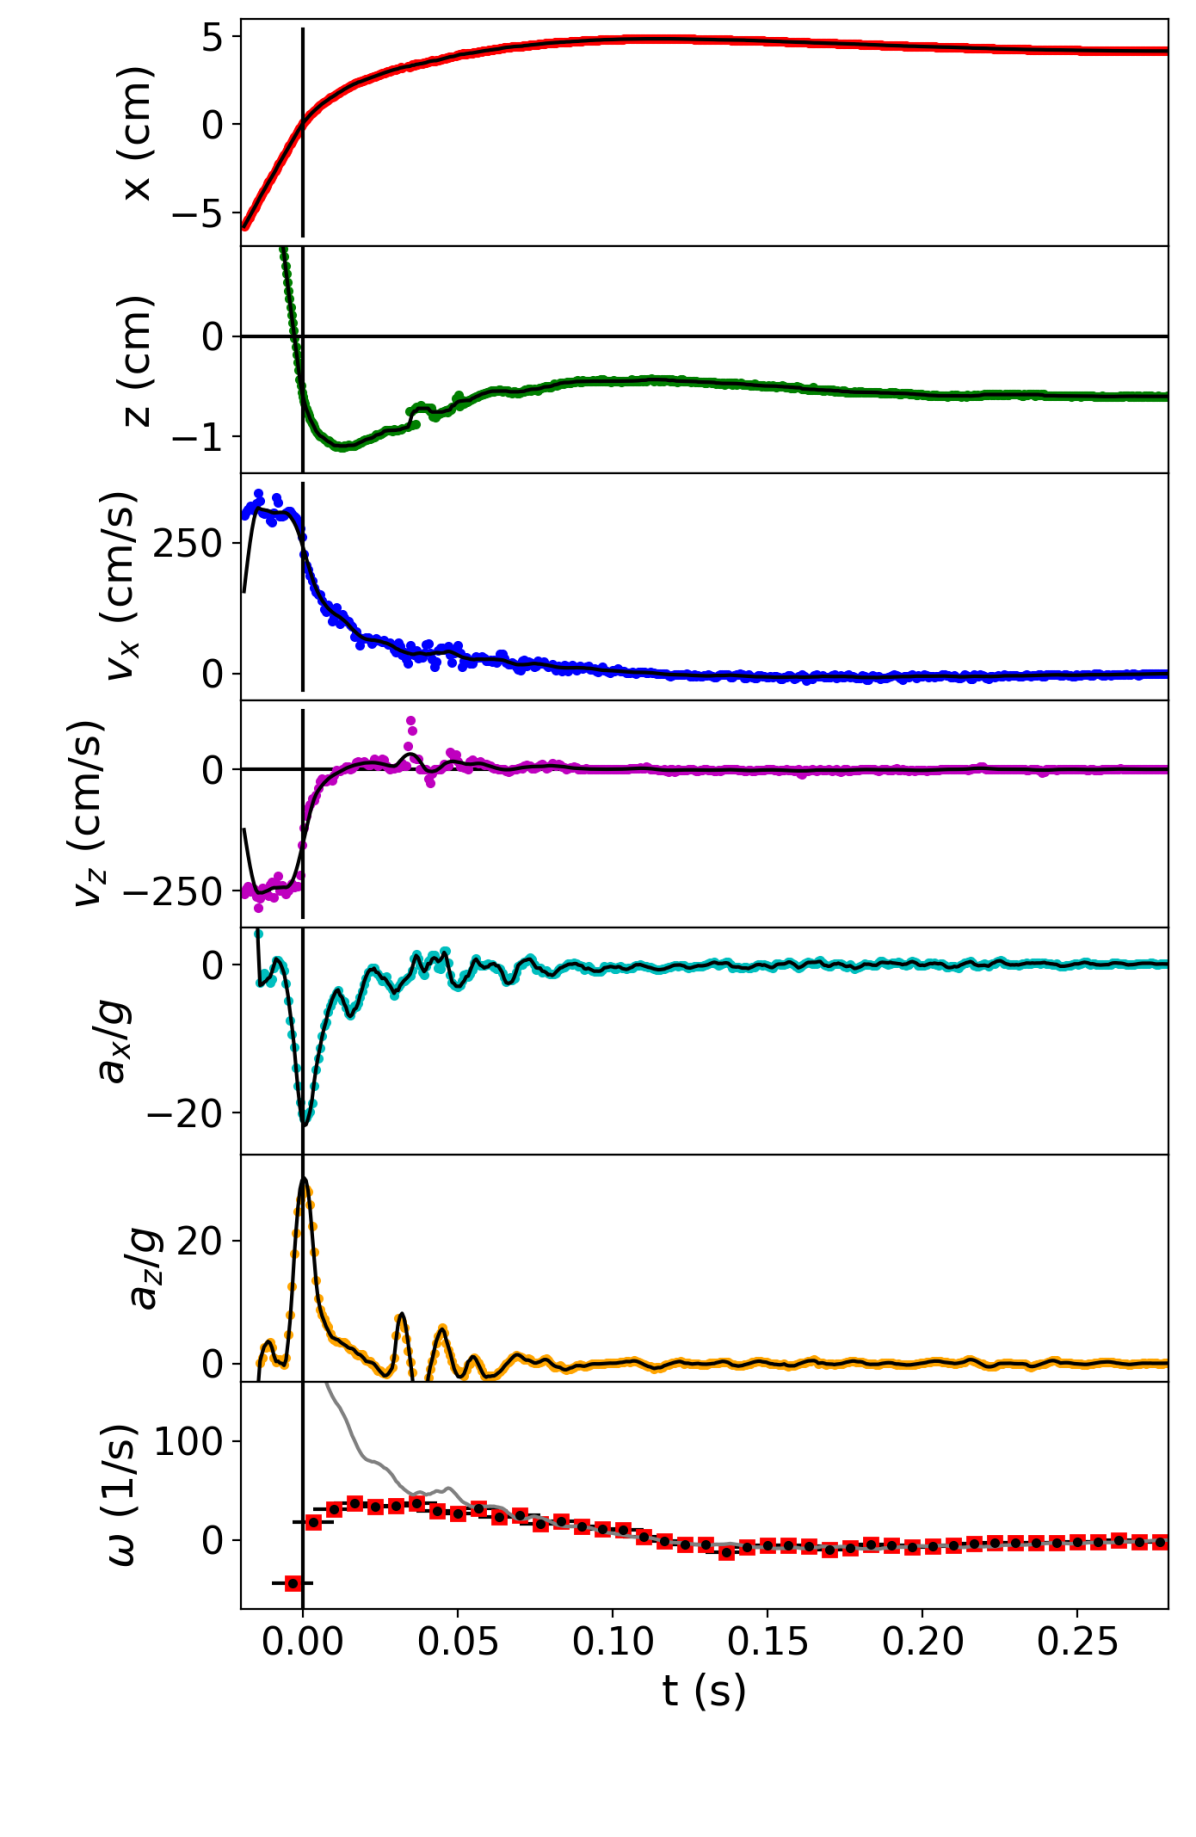
The trajectories shown in Figure 10 are measured from three different videos. The panels, from left to right, are for a ricochet, a roll-out, and a stop impact event. The top two panels show the x and z position of the white light reflection on the projectile as functions of time. The origin was chosen to be the location and time of impact. The x position increases for all time for all cratering events. The stop event has a decrease in x for late times that corresponds to the marble unable to escape its own initial impact crater and rolling backwards.
Inspection of the depths as a function of time (second panels from top in Figure 10) shows that the marble bounced above the surface (where ) during the ricochet event. The bottom surface of the marble did rise above the surface level breaking contact with the sand. The bottom of the marble remained below surface level after penetration for the roll-out and stop events.
In the stop event (rightmost figure in Figure 10) and after maximum penetration depth, the bottom of the marble rose to about cm which places the center of mass of the marble near the surface level. This can be contrasted with the roll-out event where the bottom of the marble rose to a height nearly level with the surface and placing the marble’s center of mass well above the surface level. Likely we can think of a roll-out event as one with depth reached after maximum penetration high enough to put the center of mass above the surface and allowing the marble to roll-out of its crater.
This is consistent with the crater morphology for these events that is shown in Figure 6 and provides confirmation that our tracking software is working. The maximum depth is closer to the point of impact than the crater center giving azimuthally asymmetric shapes which has been seen in other oblique impact treatments (e.g., Soliman et al. 1976; Daneshi and Johnson 1977; Bai and Johnson 1981).
Prior studies (e.g., Katsuragi and Durian 2013) call the maximum depth reached a penetration depth. The penetration depth is reached when the vertical velocity component changes sign. For our tracked videos we have listed measurements at the time of maximum depth in Table 4.
The trajectories have similar peak acceleration values, with peak vertical acceleration component g and peak horizontal acceleration slightly less at g. Katsuragi and Durian (2007), van der Meer (2017), and Goldman and Umbanhowar (2008) had accelerations that were the same order of magnitude for similar impact velocities. All were normal impact experiments with steel projectiles. van der Meer (2017) used sand as a substrate whereas the other two used glass beads.
As shown in the bottom panels of Figure 10, the marble’s spin increases while the deceleration is high right after impact. On the bottom panel, the gray lines show and the red dots show the spin or angular rotation rate. When the two coincide, the marble is rolling without slipping. We see that a rolling without slip condition is not reached until later times when the projectiles are at lower velocities. The marble’s surface was moving with respect to the sand while the ejecta curtains were launched. The ricochet event (that in the left figure in Figure 10) did not achieve rolling without slip until the marble fell back into the sand. The roll-out event (the middle figure) rolled without slipping past s while the marble continued to roll across the sand.
| Event/Video | |||
|---|---|---|---|
| (cm) | (cm/s) | (s) | |
| Ricochet | 0.95 | 221 | 0.008 |
| Roll-out | 1.00 | 165 | 0.01 |
| Stop | 1.10 | 108 | 0.012 |
Quantities measured at the moment of maximum penetration from the trajectories plotted in Figure 10 for the three experiments presented.
3.3 Estimating an effective friction coefficient from the spin
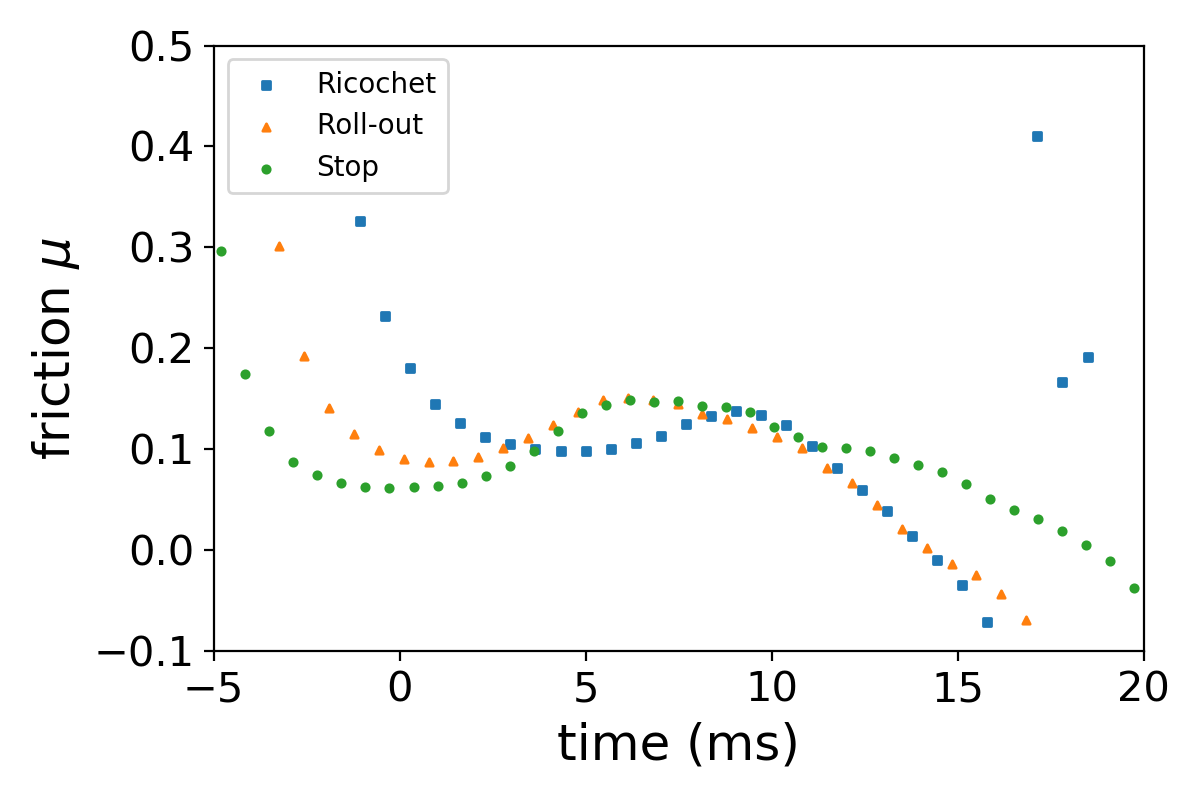
We estimate an effective friction coefficient between marble and sand using the rate of change of spin during the impact. We assume that the friction force on the marble is set by an effective friction coefficient times a normal force. We estimate the normal force from the size of the vertical acceleration . The torque on the marble . For a homogeneous sphere the moment of inertia . Putting these together, we estimate the friction coefficient
| (12) |
Using the rate of change of spin and vertical acceleration from our projectile trajectories we use equation 12 to estimate the effective friction coefficient as a function of time . Equation 12 requires dividing by acceleration. If the acceleration is low, the result is noisy. To mitigate this effect, we only measured the effective friction coefficient during the early and high acceleration phase of impact.
The effective friction coefficient measured near the time of impact for each experiment is shown in Figure 12. We computed the angular acceleration by passing our angular rotation rates through a Savinsky-Golay filer with width of 25 samples. The high values prior to impact are spurious and due to dividing by low value for the acceleration prior to impact. We only plotted the estimated friction coefficient during the early and high acceleration phase of impact for the same reason.
The coefficient of dynamic friction of glass to glass contact is 0.4. Our measured values peak around 0.1 which is below that expected for sand and marble friction contacts. Equation 12 can also be approximated as , using a change in spin and a change in the vertical velocity component . Using changes in both quantities during the high acceleration phases of the impacts, we confirm that the estimated friction coefficient is approximately 0.1. This check ensures that our estimate is not affected by how we smoothed the data.
We found that the value of the effective friction coefficient is remarkably low. The low value for the effective friction coefficient suggests that sand particles are acting like lubricant, or ball bearings rolling under the marble. Alternatively, contacts on the front size of the marble could be partly cancelling the torque exerted from contacts on the bottom of the marble.
3.4 Trends
Phenomenological models of low velocity impacts into granular media have primarily been developed for normal impacts (e.g., Tsimring and Volfson 2005; Katsuragi and Durian 2007; Goldman and Umbanhowar 2008; Katsuragi and Durian 2013; Brzinski et al. 2013; Murdoch et al. 2017). The developed empirical force laws are based upon measurements of impact penetration depth, duration and trajectories as a function of depth or time during the impact (e.g., Katsuragi and Durian 2013). To help pin down the force laws for non-normal impacts we use our trajectories to search for relations between acceleration and other parameters such as velocity and depth.
 |
 |
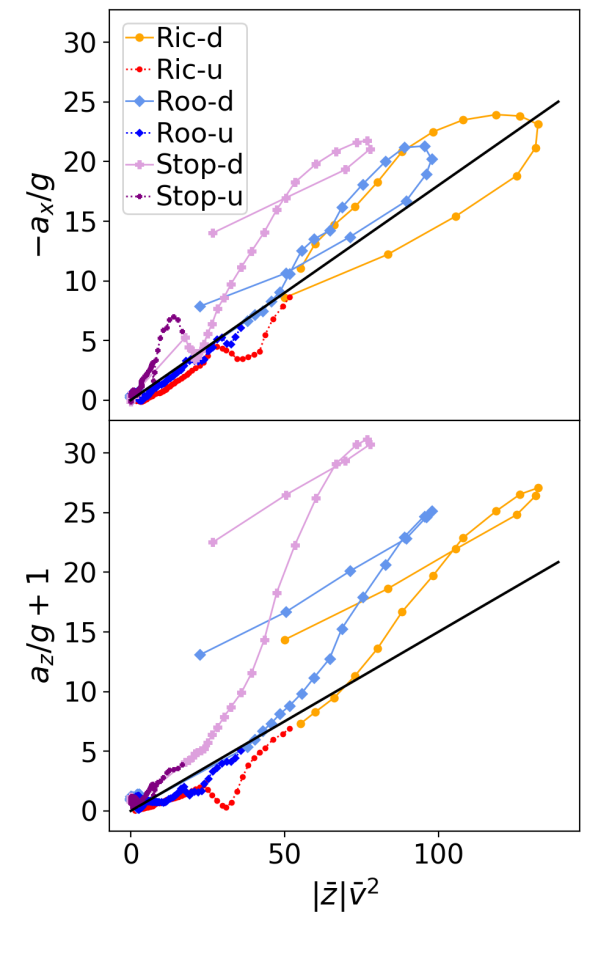
In Figure 13 we show the projectile horizontal and vertical components of acceleration from three experiments and in units of . The accelerations are plotted as a function of combinations of depth normalized by the marble radius and velocity in units of cm/s. The dimensionless is akin to a Froude number. Each trajectory is labeled with different colors and marker types. Each point is at a different time with positions, velocity and acceleration shown on our trajectory plots (Figures 10). The color and marker size depends upon whether the vertical velocity component is positive or negative. The lighter colors and larger markers are for the initial penetration phases where the projectile is moving downward into the granular media. The darker colors and smaller markers show the later part of the trajectories when the projectile is moving upward and the velocities are lower. The colors and point types are shown in the legends with labels ending with ’d’ corresponding to the initial downward penetration phase. Labels ending with ’u’ correspond to the later rebound phase when the projectiles move upward.
In the left panel in Figure 13 we plot acceleration components as a function of . We also show gray lines with a slope of 0.18 and 0.15 in the horizontal and vertical directions respectively. These slopes were found to approximately match both the horizontal and vertical accelerations in the slower and later (upward) rebound phases of the trajectories (and as seen on the lower left side of both panels). In this later phase, the accelerations scale with the square of the velocity, as would be expected from hydrodynamic drag or lift forces. When the projectile is moving upward, the vertical acceleration should be called ‘lift’ rather than drag as both velocity and acceleration are in the upward direction. The scaling does not match the accelerations during the earlier penetration phases of these trajectories.
The right panel of Figure 13 shows the horizontal and vertical components of the projectile’s acceleration as a function of . The vertical component has a black fit line with a slope of 0.6. It can be seen from both panels that the penetration phase of does not scale as alone but with the sine of the impact angle.
During the penetration phase a drag-like horizontal force with acceleration is approximately supported by the top left panel in Figure 13. An upward drag-like vertical force dependent on the square of the velocity and sine of the impact angle seems approximately supported by the lower right panel in Figure 13. We will use these relations to leverage prior normal impact studies to approximate estimate the maximum penetration depth and horizontal component of velocity at the time of maximum penetration in section 4.
We searched for combinations using scaling polynomials of powers of and components of that would put all the acceleration points on a single curve. If this were possible, such a curve would have allowed us to create an empirical force law that could be integrated to predict projectile trajectories. Unfortunately we failed to find simple combinations of depth and velocity for collapsing our trajectories to a single curve.
Figure 13 illustrates that a single force law does not fit both penetration and rebound phases of the trajectories. The trends seen here suggest that during the rebound phase, the vertical and horizontal forces scale with depth and velocity, and are similar in their dependence. However the forces during the penetration phase, before the time of maximum depth, must differ in form compared to those in the rebound phase. This might due to compaction of granular medium in front of the projectile, acting like ramp in front of a snow plow (e.g., Percier et al. (2011)). Simulations that take into account the response of the granular medium are probably required to match our projectile trajectories.
4 Phenomenological models
4.1 Empirical models for Normal Impacts
Phenomenological models have been proposed to account for experimental measurements of penetration depth of non-spinning spherical projectiles impacting granular materials in a gravitational field and at normal incidence (e.g., Ambroso et al. 2005; Tsimring and Volfson 2005; Katsuragi and Durian 2007; Goldman and Umbanhowar 2008; Katsuragi and Durian 2013; Altshuler et al. 2014; Murdoch et al. 2017). The equation of motion of the projectile’s vertical position during the impact,
| (13) |
where is the vertical coordinate with at the point of impact on the granular surface, is the projectile mass and is the downward vertical acceleration due to gravity. An empirical form for the vertical force from the granular substrate decelerating the projectile
| (14) |
where is a depth dependent force and called a hydrostatic, frictional or quasi-static resistance force term. The term describes an inertial or hydrodynamic-like drag force (e.g., Allen et al. 1957; Tsimring and Volfson 2005; Katsuragi and Durian 2007; Goldman and Umbanhowar 2008; Pacheco-Vázquez et al. 2011; Murdoch et al. 2017). Sometimes a velocity dependent term, here with coefficient , is included that looks like a low Reynolds number drag term (e.g., Allen et al. 1957; Goldman and Umbanhowar 2008).
The force law of equation 14 is commonly only applied while the projectile decelerates (e.g., Goldman and Umbanhowar 2008; Katsuragi and Durian 2013). A maximum penetration depth , is reached when the vertical velocity first reaches zero. The time at which this happens (after impact) is called a stopping or collision time . The equation of motion may not have a fixed point at this depth and at this time, so would give subsequent upward acceleration. However the post penetration phase upward motion is irrelevant when estimating a stopping time and a maximum penetration depth.
Recent normal impacts experiments into granular media using Atwood machines find that past a certain impact velocity, the maximum penetration depth is approximately independent of effective gravity and is approximately proportional to the collision velocity, (Goldman and Umbanhowar, 2008; Murdoch et al., 2017). The experiments by Goldman and Umbanhowar (2008) have impact velocities of a few m/s and effective gravity 0.1 to 1 g and those by Murdoch et al. (2017) have velocities 1 to 40 cm/s and effective gravity 10-2 to 1 g. The collision time or duration is approximately independent of impact velocity and the effective gravity (Goldman and Umbanhowar, 2008; Murdoch et al., 2017). These findings build upon prior experiments at 1 g that found similar scaling laws (de Bruyn and Walsh, 2004; Ambroso et al., 2005; Ciamarra et al., 2004; Tsimring and Volfson, 2005; Katsuragi and Durian, 2013). The equations of motion with empirical force law in the form of Equation 14 can match the trends measured for the maximum penetration depth and collision time, (e.g., Tsimring and Volfson 2005; Goldman and Umbanhowar 2008; Katsuragi and Durian 2013).
4.2 Empirical model for ricochet and roll-out lines
Prior empirical models for ricochet that we introduced in section 2.2 (Birkhoff et al., 1944; Johnson and Reid, 1975; Daneshi and Johnson, 1977; Soliman et al., 1976; Bai and Johnson, 1981), assume that the horizontal velocity component is nearly constant and that the lift force depends on it with . The assumed lift is dependent on depth and computed by integrating a hydrostatic pressure applied to the submerged surface of the spherical projectile. This pressure is estimated following Bernoulli’s principle. The velocity dependence of the lift force resembles that of the hydrodynamic drag-like force that has been used to model normal impacts (e.g., Katsuragi and Durian 2007).
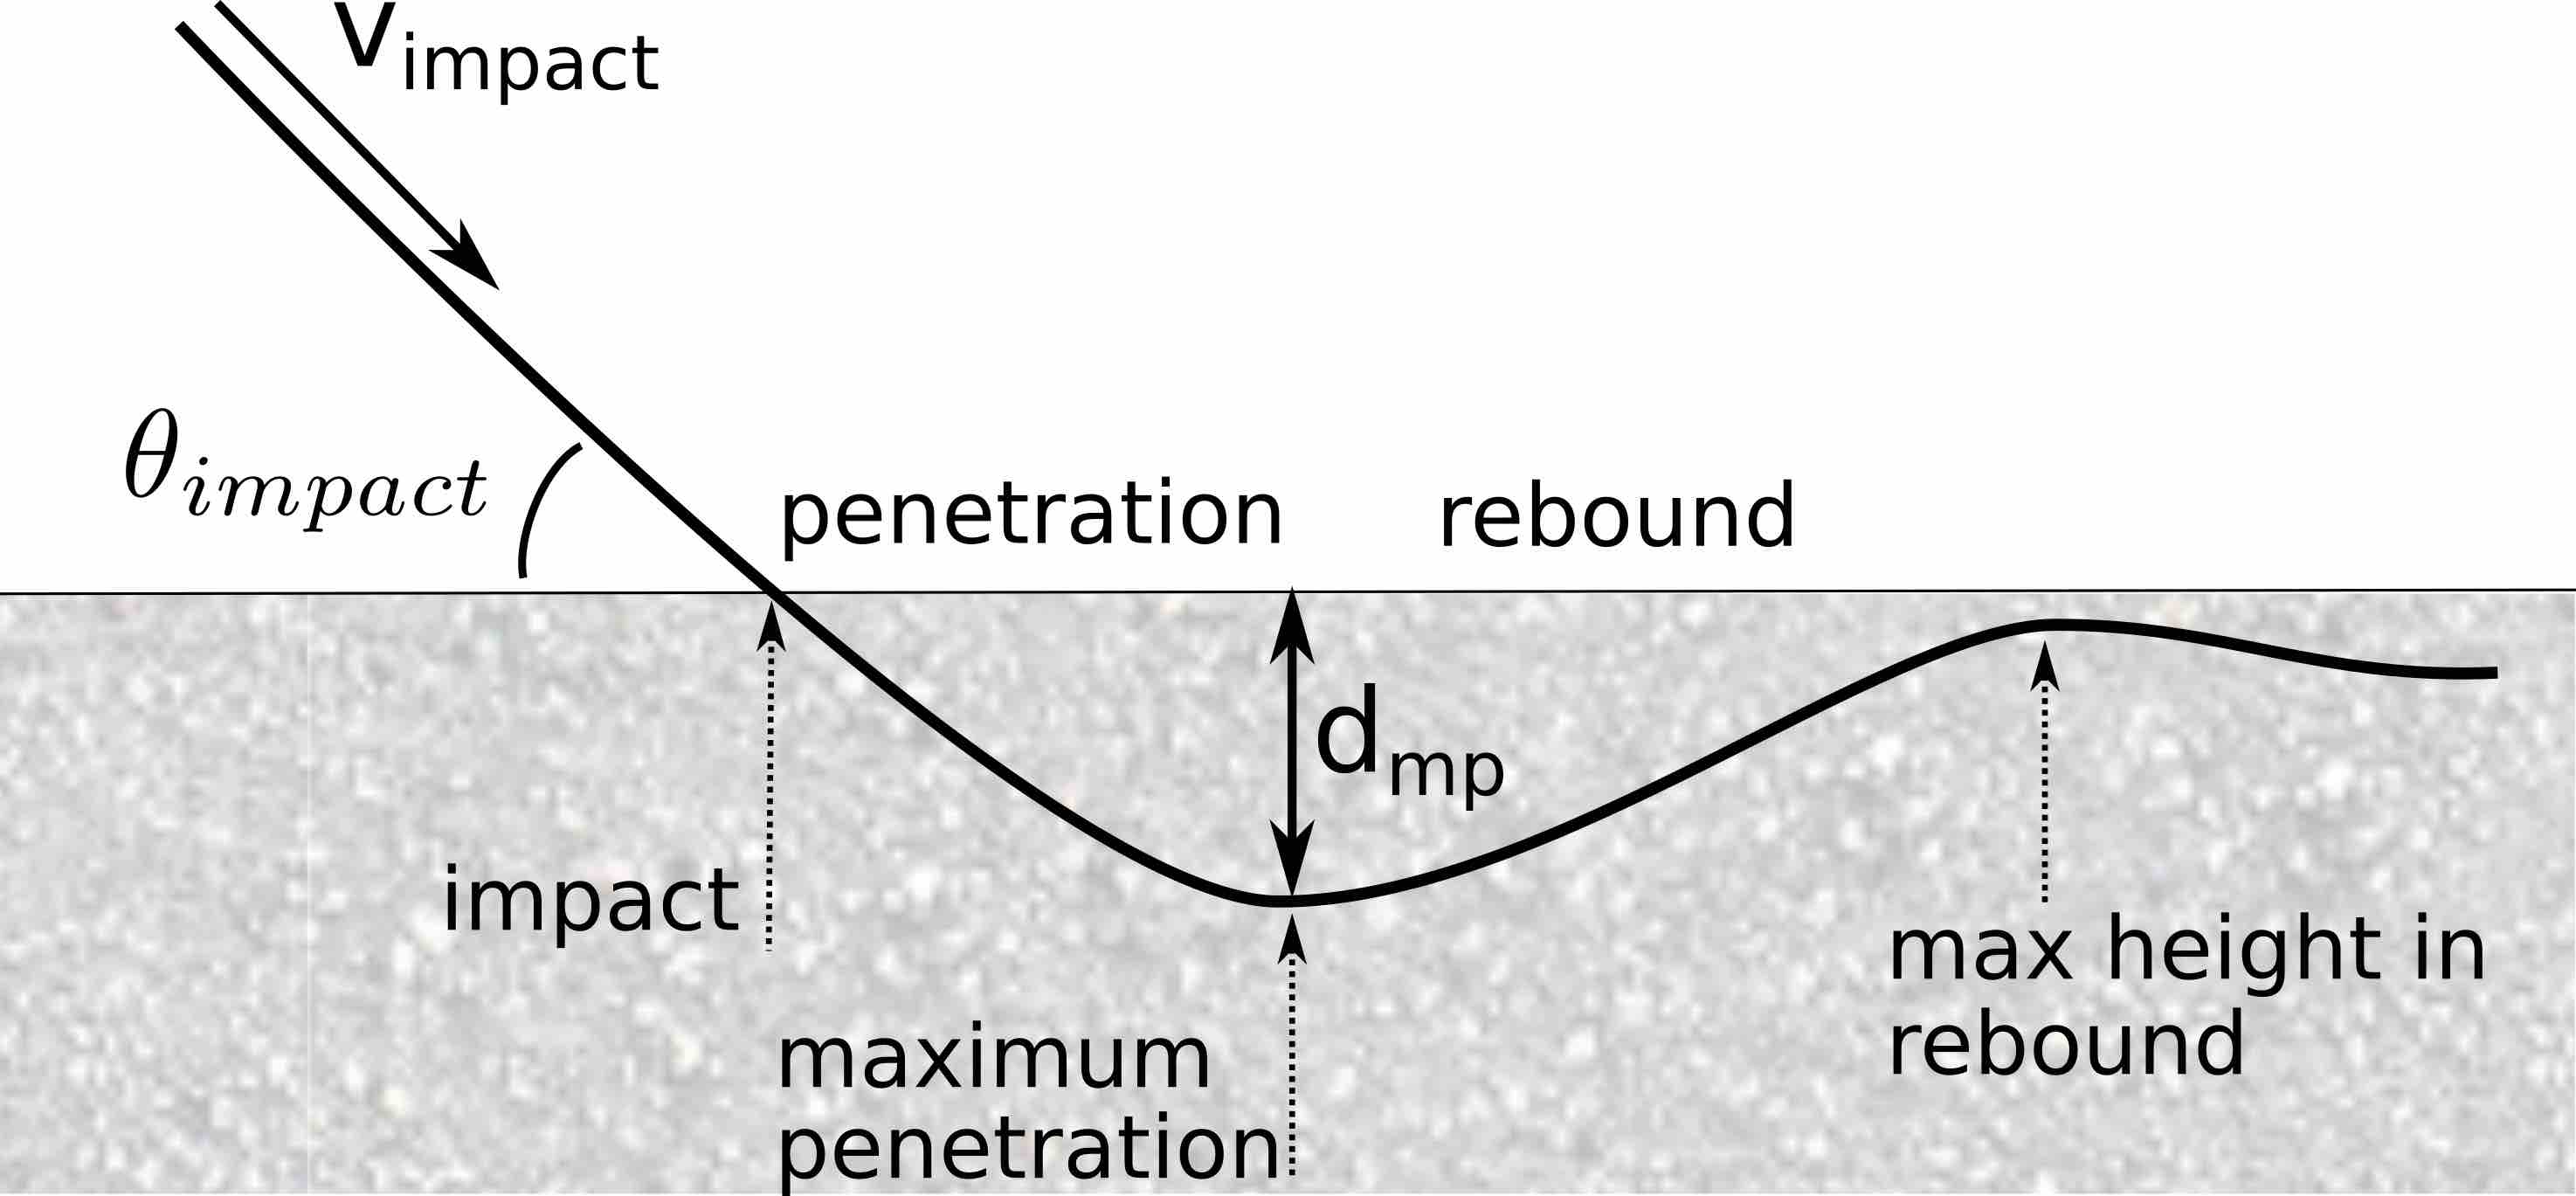
Our trajectories and trends in them discussed in section 3.4 imply that a single empirical model, based on that developed for normal impacts, would not give a good description for both the penetration phase and rebound phases of impacts (see Figure 14 for an illustration of these phases). We attempt to improve upon prior ricochet models in sand by using scaling developed for normal impacts into granular media to estimate a maximum penetration depth. We then use a simple but different model for the post penetration or rebound phase of impact to estimate a criterion for ricochet and roll-out events.
At the moment of maximum penetration, the horizontal velocity is , the depth is and the vertical velocity component . We first estimate and from the impact angle and the impact velocity . We then find the height reached in the rebound phase from a vertical equation of motion that has a lift force that is dependent on the horizontal component of velocity.
To estimate the horizontal component of velocity at the moment of maximum penetration, we assume that the horizontal velocity component during the penetration phase is described with a hydrodynamic-like drag
| (15) |
Here is a drag coefficient that has units of inverse length. For hydrodynamic drag on a sphere of radius , the drag force is proportional to the projectile cross sectional area and the drag coefficient depends on the density ratio and projectile radius,
| (16) |
Equation 15 has solution
| (17) |
where the initial horizontal velocity . The horizontal velocity component at the time of maximum penetration
| (18) |
in terms of the stopping time . Following experimental studies of normal impacts (Murdoch et al., 2017), we assume that the stopping time is independent of velocity and effective gravity. We also assume that the stopping time is independent of impact angle, as supported by recent experiments of oblique impacts (Bester et al., 2019).
Following experimental studies of normal impacts (e.g., Goldman and Umbanhowar 2008; Murdoch et al. 2017), we assume that the depth of maximum penetration is proportional to impact velocity. We expect that the depth of maximum penetration would be lower for shallower impact angles, so we assume
| (19) |
with unit-less parameter . We estimate and from measurements of our tracked trajectories. This angular dependence is consistent with penetration depth proportional to the initial z component of velocity, and this is approximately supported by the recent oblique impact experiments by Bester et al. (2019) (see their Figure 2).
We assume that the lift during the rebound phase is proportional to the square of the horizontal velocity component, as did prior models for ricochet (Soliman et al., 1976; Bai and Johnson, 1981). These ricochet models assumed that the horizontal component of velocity was nearly constant during the impact and that the lift was depth dependent. Our trajectories show that the horizontal component of velocity varies significantly during rebound. Likely the lift during rebound is both depth dependent and time dependent through its sensitivity to the horizontal velocity component.
To roughly characterize a regime for ricochet and roll-out we ignore the depth dependence of the lift but we take into account its time dependence. For the rebound phase we use an equation of motion in the vertical direction
| (20) |
with lift coefficient that is in units of inverse length. The left term is lift and the right term is the gravitational acceleration. With , the bottom edge of the projectile touches the substrate surface and with , it is entirely submerged.
The horizontal component of velocity in the rebound phase follows equation 17 but with a drag coefficient that might differ from that present during the penetration phase (that we called ). In the rebound phase
| (21) |
where is the horizontal velocity component at the moment of maximum depth (estimated in equation 18) and time is measured from the beginning of the rebound phase. Initial conditions are , and . We integrate Equation 20 using Equation 21 for
| (22) |
The constant of integration is determined by requiring at the moment of maximum depth. The maximum height (or minimum depth) during rebound is subsequently reached when where
| (23) |
We integrate Equation 22 to find the height in the rebound phase
| (24) |
The height gives a maximum height during the rebound phase.
Let’s examine the time (equation 23) which is the time in the rebound phase when height reaches an extremum. We require for the rebound trajectory to rise and not sink. This gives condition
| (25) |
If the horizontal velocity component does not significantly vary during the impact then is equivalent to
| (26) |
In the limit of low impact angle this condition becomes
| (27) |
which is similar to the expression for the critical angle giving ricochet by Soliman et al. (1976). A comparison between this equation and equation 10, the orange line we adjusted to match the ricochet line on Figure 8, gives a lift coefficient . Henceforth we allow the horizontal velocity component to decay during the impact. With horizontal drag, a larger lift coefficient would be required for ricochet to occur.
We can use computed using equations 18, 19, 23, and 24 to estimate the height reached during the rebound phase. These are functions of initial , and coefficients . The coefficients can be estimated from our impact trajectories. The drag and lift coefficients can be adjusted. The result is an estimate of the height as a function of impact velocity and angle .
If then the projectile rises above the level of the substrate and we would classify the event as a ricochet. If then the center of mass of the projectile rises above the substrate level and the projectile could roll. We assign the condition to be the line dividing ricochet from roll-out and to be the line dividing roll-out from stop events. By computing and adjusting to match our experimental event classifications, we find an empirical model for these two dividing lines.
We measured stopping times, , maximum penetration depths and horizontal velocity components at the maximum depth for the three videos that we tracked. These quantities are listed in Table 4. The three tracked videos have stopping time s. From the maximum penetration depths and using equation 19 we estimate the factor . The horizontal velocity component measured at maximum penetration depth divided by the initial horizontal velocity component is about 0.3 for our three tracked videos. From the horizontal velocity components measured at the maximum depth, impact angles and velocities and using equation 18 we estimate the drag coefficient during penetration phase . This is similar to that expected for ballistic drag (as estimated in equation 16) and is consistent with trends seen in the tracked trajectories, (shown in Figure 13).
In Figure 15 we show with a color map the rebound height computed at different values of impact velocity and angle. The colorbar shows the value of . The axis is a Froude number or impact velocity in units of . The rebound height in the rebound phase was computed using equations 18, 19, 23, and 24 and the above estimated values for stopping time, penetration depth parameter and drag coefficient . The remaining parameters used are lift coefficient and rebound phase drag coefficient . On this plot, we also show our experiment impact classifications that were described previously in section 2.1 and shown in Figures 7 and 8. The upper dashed yellow line shows a contour and the lower white dotted line shows a depth contour. These are estimates for the critical angle giving roll-out and that giving ricochet. The model is a pretty good match to the experimental ricochet/roll-out line, but overestimates the critical angle for the roll-out/stop line, particularly at lower velocities. The rolling marble, as seen in the roll-out event trajectory shown in Figure 10), stays at a particular equilibrium depth while rolling. A better prediction for the roll-out/stop dividing line might be made by computing the height that lets lower surface of the marble rise above this equilibrium level during the rebound phase.
We find that rebound drag coefficient must be smaller than the penetration phase drag coefficient, . Otherwise, the ricochet line on Figure 15 does not rise with increasing velocity. A lower value of the rebound drag coefficient is consistent with the shallow slope in seen in Figure 10 in the rebound phases. There is some degeneracy between rebound phase drag and lift coefficients, and . This degeneracy is not surprising, since their ratio appears in equation 24 for the height reached during rebound. Extremely low values of would give rebound phases that are longer than we observed.
As was true for prior penetration depth and stopping time estimates (e.g., Katsuragi and Durian (2013)), our model does not have an equilibrium fixed point at the maximum height reached during the rebound phase. After this height is reached, the gravitational acceleration in the model would cause the projectile to drop forever. A more complete model could add a hydrostatic-like force term, dominating at low velocity, that allows the projectile to reach a final equilibrium resting condition at a shallow depth. We opted to use a time dependent but depth independent lift force and a constant gravitational acceleration. The result is an acceleration that is approximately linearly dependent on time. It might be possible to derive a similar looking model with depth dependent forces. We attempted to do so with constant but depth dependent hydrostatic and lift terms but had less success with them.
5 Application to low-g environments
Using dimensionless numbers and scaling arguments laboratory experiments can be used to predict phenomena in regimes that are difficult to reach experimentally. With that idea in mind we discuss using scaling laws developed for crater impacts and ejecta curtains (Holsapple, 1993) to apply the results of our laboratory results at 1 g to asteroid surfaces. It is important to note that these scaling laws were developed for hypervelocity impacts normal to the surface, and for point source impactors (i.e. impactors that are much smaller than the diameter of the crater).
Holsapple (1993) defines three dimensionless parameters that have historically been denoted and . These dimensionless are used to give regimes and scaling relations for the crater efficiency, (sometimes called ), which is the ratio of the crater mass to the projectile mass. The first of the dependent dimensionless variables is where is the radius of the projectile and is its velocity. This is the same as the inverse of the square root of the Froude number. The parameter is defined as the ratio of the lithostatic pressure to the dynamic pressure generated by the impact at a depth of the projectile’s radius. The next dimensionless parameter is the ratio of the crustal material strength to the dynamic pressure of the impact . The strength of our sand is low and we can assume that regolith on an asteroid will also be low compared to the dynamic pressure from an impact. This results in a small value for and so we can neglect it in our scaling argument. The last parameter, is the ratio of the substrate to the projectile density, which in our experiments was 0.64. Holsapple ignores this parameter in the scaling relations since its value is confined to be near unity. Since our density ratio is not significantly different than unity we follow him by neglecting this parameter as well. This leaves only a single important dimensionless parameter, which is directly dependent on the Froude number.
Are there additional dimensionless parameters that might be important in the granular impact setting that were not considered by Holsapple (1993)? The ratio of projectile radius to grain size radius might be important. In our experiments this ratio is large (and equal to about 32). The ratio is large enough that it probably does not affect our experimental results, however planetary surfaces can have both larger and smaller sized particles near the surface.
We adopt the assumption that we can scale our laboratory experiments to a low g asteroid environment by matching the Froude number. Future experimental studies at low g facilities and using granular media of different size distributions could test this assumption.
We estimate the conditions (the velocity and impact angle) that would allow a rock to ricochet on asteroids such as Bennu or Ryugu. The escape velocity from a spherical object of radius can be written in terms of its surface gravity
| (28) |
We can write impact velocity in units of as
| (29) |
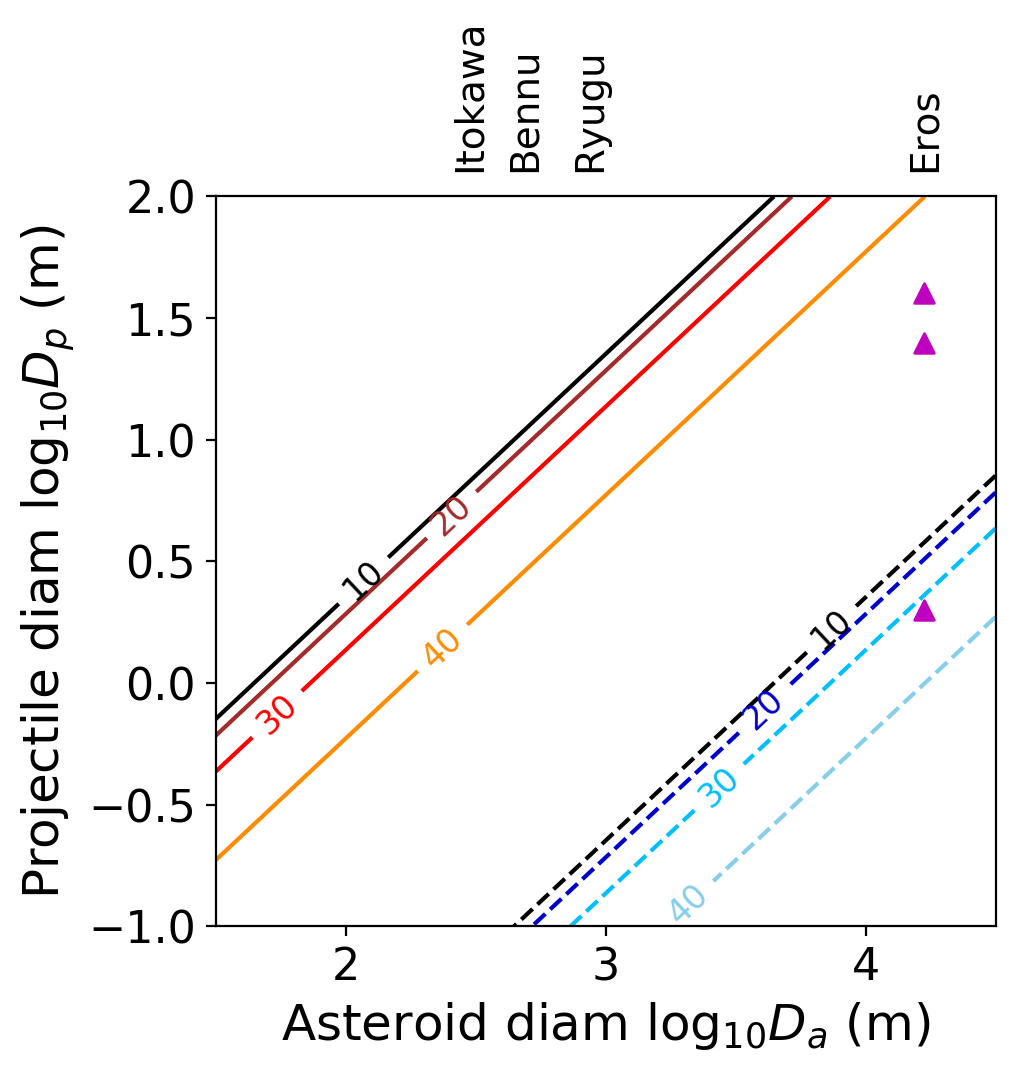
We insert this velocity into equation 10 for the critical angle allowing ricochet, giving us the critical angle as a function of projectile and asteroid radius. These are plotted on Figure 16. The series of black, red, and orange lines are for impacts at the escape velocity. Each line is labelled with the critical impact angle and points to the right and below the line allow ricochets below this labelled impact angle. The series of blue and green lines are for ricochets at a tenth of the escape velocity. The axes on this plot are log10 of asteroid and projectile diameters in meters.
Figure 16 shows that few meter diameter and smaller boulders on 500 m diameter asteroid such as Bennu, when hitting a region of level granular material at the escape velocity, would be likely to ricochet. Since most impacts would not be normal, this would apply to a large fraction of such objects. At lower velocities ricochets would only be likely for few cm sized objects.
We find that large boulders, such as the 14 m one shown in Figure 1 would be above the ricochet line and so would not ricochet. However this size boulder is near enough to the ricochet line that it might roll upon impact. If use equation 11 instead of equation 10 to make this plot, then a 14 m diameter rock is on the line allowing roll-out to take place at impact angles below .
If Froude number is relevant for matching grazing impact behavior at 1 g to that on asteroids, then we infer that boulders on Bennu would have rolled or ricocheted upon impact for near escape velocity impacts.
5.1 Ricochets on Eros
Durda et al. (2012) give examples of 3 tracks or oblong craters, paired with boulders, that likely made the tracks by skipping of the surface on asteroid 433 Eros. The three boulders have sizes 40, 2 and 25 m, respectively (see their Figure 1). The estimated impact velocities are m/s respectively (taking typical values from their Tables 1-3). Surface gravitational accelerations at the sites of the secondary craters computed by Durda et al. (2012) are , and m s-2, respectively. Using the sizes, velocities and accelerations values we compute Froude numbers of 24, 57, 30 where we have used half the length scale in place of radius in equation 1. They estimate grazing impact angles (which they call the mean elevation angle) . This places the inferred ricochets on Eros on the lower right hand side of Figure 15 and consistent with our estimate for the division between roll-out and ricochet events. The three boulder sizes observed by Durda et al. (2012) are plotted as purple triangles on Figure 16. The range of escape speeds on Eros is 3 to 17 m s-1 (Yeomans et al., 2000) so these events are consistent with impact velocity near the escape velocity. These points lie below the red lines in Figure 16 and are consistent with the limiting impact angles velocities for ricochet in our extrapolated model.
The coefficient of restitution of Eros’ surface was estimated by Durda et al. (2012) for their observed tracks. Their estimated values were found by taking the ratio of the projectile’s rebound speed and the impact speed with values in the range 0.08-0.19. Taking the same ratio of our ricochets results in a similar value of 0.14. These values also closely match our measured effective friction coefficient (see Figure 12) during impact.
6 Summary and Discussion
We have carried out laboratory experiments of glass spherical projectiles (marbles) impacting level sand at a range of impact angles. Impact velocities range from 2–5 m/s and grazing impact angles (measured with 0 corresponding to a grazing impact) range from about 10 to 50∘. Our projectile material (glass) has density similar to that of the grains in the granular substrate (sand). We use a pendulum projectile launcher to reduce projectile spin.
We use high speed camera images to track projectile motion and spin. The projectiles spin up when they penetrate the sand, however, the friction coefficient required is low, suggesting that the sand particles fluidize near the projectile and effectively lubricate the projectile surface.
We find that projectiles can ricochet or roll-out of their initial impact crater, and that this is likely at higher impact velocities and lower grazing impact angles. This trend is opposite to that found from experiments at higher velocities and higher projectile density into sand that were done by Soliman et al. (1976).
We delineate lines between ricochet, roll-out and stop events as a function of impact velocity and angle. The dividing lines for these classes of events are empiricaly matched by quadratic relation for the square of the critical impact angle, that is in the same form as that derived by Soliman et al. (1976), but has larger coefficients. We explore an empirical model for the post maximum penetration (rebound) phase of impact, balancing a lift force that is dependent upon the square of the horizontal velocity component against gravitational acceleration. This model estimates a maximum height reached in the rebound phase of the impact. A condition for ricochet is the projectile center of mass reaching a maximum height rising above the surface. A maximum height just reaching, but not above, the surface gives a condition for projectiles that roll-out of their impact crater. With adjustment of lift and drag coefficients, this empirical model can match our experiment ricochet and roll-out dividing lines.
The projectile trajectories show different scaling in penetration and rebound phases, making it difficult to find simple empirical force laws for the impact dynamics that cover inertial regimes and a lower velocity end phase. Likely a numerical simulation that includes an inertial regime for the granular medium is required to fully understand low velocity or shallow impact dynamics at oblique angles into granular media. Extending resistive force theory (e.g., Ding et al. 2011) into the inertial and low gravity regimes could be one way to improve empirical models.
We have tried to simplify our experiments by minimizing projectile spin and using spherical projectiles. In future we would like to explore how spin direction and rate affects the impact. Non-spherical projectiles would be harder to track but also interesting to characterize. We would also like to explore the role of irregularities in the substrate, surface level variations and different granular size distribution.
Due to their small size, our projectiles are in a high Froude number regime where to 17. If this dimensionless number governs behavior in low gravity environments then our projectiles match m sized projectiles near the escape velocity on small asteroids such as Bennu. The large range of angles allowing ricochet would then imply that projectiles in this regime would predominantly be found distant from their impact crater. Boulders and accompanying tracks on Eros support this scenario (Durda et al., 2012). Experiments in effective low surface gravity could be used to better understand low velocity impact phenomena in low g environments and improve upon our extrapolated models.
Acknowledgements
This material is based upon work supported in part by NASA grant 80NSSC17K0771, and National Science Foundation Grant No. PHY-1757062.
We thank Jim Alkins for helpful discussions regarding machining. We are grateful to Tony Dimino for advise, lent equipment, and suggestions that inspired and significantly improved this manuscript.
References
- (1) Allan, D., Caswell, T., Keim, N., van der Wel, C., . Trackpy v0.3.2. URL: https://doi.org/10.5281/zenodo.60550.
- Allen et al. (1957) Allen, W.A., Mayfield, E.B., Morrison, H.L., 1957. Dynamics of a projectile penetrating sand. Journal of Applied Physics 28, 370–376.
- Altshuler et al. (2014) Altshuler, E., Torres, H., González-Pita, A., Sánchez-Colina, G., Pérez-Penichet, C., Waitukaitis, S., Hidalgo, R.C., 2014. Settling into dry granular media in different gravities. Geophysical Research Letters 41, 3032–3037. doi:10.1002/2014GL059229.
- Ambroso et al. (2005) Ambroso, M.A., Santore, C.R., Abate, A.R., Durian, D.J., 2005. Penetration depth for shallow impact cratering. Physics Review E 71, 051305.
- Asphaug and Melosh (1993) Asphaug, E., Melosh, H.J., 1993. The stickney impact of phobos: A dynamical model. Icarus 101, 144–164.
- Bagnold (1954) Bagnold, R.A., 1954. Experiments on a gravity-free dispersion of large solid particles in a newtonian fluid under shear. Proceedings of the Royal Society of London, Series A 225, 49–63.
- Bai and Johnson (1981) Bai, Y.L., Johnson, W., 1981. The effects of projectile speed and medium resistance in ricochet off sand. Journal Mechanical Engineering Science 23, 69–75.
- Bester et al. (2019) Bester, C.S., Cos, N., Zheng, H., Behringer, R.P., 2019. Dynamics of oblique impact in a photoelastic granular medium. https://arxiv.org/abs/1904.11077.
- Biele et al. (2015) Biele, J., Ulamec, S., Maibaum, M., Roll, R., Witte, L., Jurado, E., Muñoz, P., Arnold, W., Auster, H.U., Casas, C., Faber, C., Fantinati, C., Finke, F., Fischer, H.H., Geurts, K., Güttler, C., Heinisch, P., Herique, A., Hviid, S., Kargl, G., Knapmeyer, M., Knollenberg, J., Kofman, W., Kömle, N., Kührt, E., Lommatsch, V., Mottola, S., Pardo de Santayana, R., Remetean, E., Scholten, F., Seidensticker, K.J., Sierks, H., Spohn, T., 2015. The landing(s) of Philae and inferences about comet surface mechanical properties. Science 349. URL: https://science.sciencemag.org/content/349/6247/aaa9816, doi:10.1126/science.aaa9816.
- Birkhoff et al. (1944) Birkhoff, G., Birkhoff, G.D., Bleick, W.E., Handler, E.H., Murnaghan, F.D., Smith, T.L., 1944. Ricochet off Water. Technical Report. Applied Mathematics Panel, National Defense Research Committee, Memo42.
- Bottke et al. (1994) Bottke, W.F., Nolan, M.C., Greenberg, R., Kolvoord, R.A., 1994. Velocity Distributions among Colliding Asteroids. Icarus 107, 255–268. doi:10.1006/icar.1994.1021.
- Brisset et al. (2018) Brisset, J., Colwell, J., Dove, A., Abukhalil, S., Cox, C., Mohammed, N., 2018. Regolith behavior under asteroid-level gravity conditions: low-velocity impact experiments. Progress in Earth and Planetary Science 5. URL: http://dx.doi.org/10.1186/s40645-018-0222-5, doi:10.1186/s40645-018-0222-5.
- de Bruyn and Walsh (2004) de Bruyn, J.R., Walsh, A.M., 2004. Penetration of spheres into loose granular media. Can. J. Phys. 82, 439–446.
- Brzinski et al. (2013) Brzinski, T.A., Mayor, P., Durian, D.J., 2013. Depth-dependent resistance of granular media to vertical penetration. Physics Review Letters 111, 168002.
- Cheng et al. (2002) Cheng, A.F., Izenberg, N., Chapman, C., Zuber, M., 2002. Ponded deposits on asteroid 433 eros. Meteoritics & Planetary Science 37, 1095–1105.
- Ciamarra et al. (2004) Ciamarra, M.P., Lara, A.H., Lee, A.T., Goldman, D.I., Vishik, I., Swinney, H.L., 2004. Dynamics of drag and force distributions for projectile impact in a granular medium. Physics Review Letters 92, 194301.
- Crocker and Grier (1996) Crocker, J.C., Grier, D.G., 1996. Methods of digital video microscopy for colloidal studies. Journal of Colloid Interface Science 179, 298–310.
- Daneshi and Johnson (1977) Daneshi, G., Johnson, W., 1977. The ricochet of spherical projectiles off sand. International Journal of Mechanical Sciences 19, 491 – 497. URL: http://www.sciencedirect.com/science/article/pii/0020740377900224, doi:https://doi.org/10.1016/0020-7403(77)90022-4.
- Ding et al. (2011) Ding, Y., Gravish, N., Goldman, D., 2011. Drag induced lift in granular media. Physics Review Letters 106, 028001.
- Durda et al. (2012) Durda, D.D., Chapman, C.R., Merline, W.J., Enke, B.L., 2012. Detecting crater ejecta-blanket boundaries and constraining source crater regions for boulder tracks and elongated secondary craters on eros. Meteoritics & Planetary Science 47, 1087–1097. doi:10.1111/j.1945-5100.2012.01380.x.
- Goldman and Umbanhowar (2008) Goldman, D.I., Umbanhowar, P., 2008. Scaling and dynamics of sphere and disk impact into granular media. Physics Review E 77, 021308.
- Hestroffer et al. (2019) Hestroffer, D., Sánchez, P., Staron, L., Bagatin, A.C., Eggl, S., Losert, W., Murdoch, N., Opsomer, E., Radjai, F., Richardson, D.C., Salazar, M., Scheeres, D.J., Schwartz, S., Taberlet, N., Yano, H., 2019. Small solar system bodies as granular media. The Astronomy and Astrophysics Review 27, 6.
- Hirabayashi et al. (2015) Hirabayashi, M., Sánchez, D.P., Scheeres, D.J., 2015. Internal Structure of Asteroids Having Surface Shedding Due to Rotational Instability. Astrophysical Journal 808, 63. doi:10.1088/0004-637X/808/1/63, arXiv:1506.03354.
- Ho et al. (2016) Ho, T.M., Baturkin, V., Grimm, C., Grundmann, J.T., Hobbie, C., Ksenik, E., Lange, C., Sasaki, K., Schlotterer, M., Talapina, M., et al., 2016. MASCOT—the mobile asteroid surface scout onboard the hayabusa2 mission. Space Science Reviews 208, 339–374. URL: http://dx.doi.org/10.1007/s11214-016-0251-6, doi:10.1007/s11214-016-0251-6.
- Holsapple (1993) Holsapple, K.A., 1993. The scaling of impact processes in planetary sciences. Annual Review of Earth and Planetary Sciences 21, 333–373.
- Holsapple (2010) Holsapple, K.A., 2010. On YORP-induced spin deformations of asteroids. Icarus 205, 430–442.
- Housen and Holsapple (2003) Housen, K., Holsapple, K., 2003. Impact cratering on porous asteroids. Icarus 163, 102–119.
- Johnson (1998) Johnson, W., 1998. The ricochet of spinning and non-spinning spherical projectiles mainly from water. part ii. an outline of theory and warlike applications. International Journal of Impact Engineering 21, 25–34.
- Johnson and Reid (1975) Johnson, W., Reid, S.R., 1975. Ricochet of spheres off water. Journal of Mechanical Engineering Science 17, 71–81.
- Katsuragi and Durian (2007) Katsuragi, H., Durian, D.J., 2007. Unified force law for granular impact cratering. Nature Physics 3, 420–423.
- Katsuragi and Durian (2013) Katsuragi, H., Durian, D.J., 2013. Drag force scaling for penetration into granular media. Physical Review E 87, 052208.
- Matsumura et al. (2014) Matsumura, S., Richardson, D.C., Michel, P., Schwartz, S.R., Ballouz, R.L., 2014. The Brazil nut effect and its application to asteroids. Monthly Notices of the Royal Astronomical Society 443, 3368–3380.
- Maurel et al. (2018) Maurel, C., Michel, P., Biele, J., Ballouz, R.L., Thuillet, F., 2018. Numerical simulations of the contact between the lander mascot and a regolith-covered surface. Advances in Space Research 62, 2099 – 2124. URL: http://www.sciencedirect.com/science/article/pii/S0273117717303745, doi:https://doi.org/10.1016/j.asr.2017.05.029.
- van der Meer (2017) van der Meer, D., 2017. Impact on granular beds. Annual Review of Fluid Mechanics 49, 463–484. URL: http://dx.doi.org/10.1146/annurev-fluid-010816-060213, doi:10.1146/annurev-fluid-010816-060213.
- Michel and Richardson (2013) Michel, P., Richardson, D.C., 2013. Collision and gravitational reaccumulation: Possible formation mechanism of the asteroid itokawa. Astronomy and Astrophysics 554, L1. URL: http://dx.doi.org/10.1051/0004-6361/201321657, doi:10.1051/0004-6361/201321657.
- Miyamoto et al. (2017) Miyamoto, H., Yano, H., Scheeres, D.J., Abe, S., Barnouin-Jha, O., Cheng, A.F., Demura, H., Gaskell, R.W., Hirata, N., Ishiguro, M., Michikami, T., Nakamura, A.M., Nakamura, R., Saito, J., Sasaki, S., 2017. Regolith migration and sorting on asteroid itokawa. Science 316, 1011–1014.
- Murdoch et al. (2017) Murdoch, N., Avila Martinez, I., Sunday, C., Zenou, E., Cherrier, O., Cadu, A., Gourinat, Y., 2017. An experimental study of low-velocity impacts into granular material in reduced gravity. Monthly Notices of the Royal Astrononical Society 468, 1259–1272. doi:10.1093/mnras/stw3391, arXiv:1702.05980.
- Pacheco-Vázquez et al. (2011) Pacheco-Vázquez, F., Caballero-Robledo, G.A., Solano-Altamirano, J.M., Altshuler, E., Batista-Leyva, A.J., Ruiz-Suárez, J.C., 2011. Infinite penetration of a projectile into a granular medium. Physics Review Letters 106, 218001–4.
- Percier et al. (2011) Percier, B., Manneville, S., McElwaine, J.N., Morris, S.W., Taberlet, N., 2011. Lift and drag forces on an inclined plow moving over a granular surface. Physical Review E 84, 051302.
- Potiguar and Ding (2013) Potiguar, F.Q., Ding, Y., 2013. Lift and drag in intruders moving through hydrostatic granular media at high speeds. Physical Review E 88, 012204.
- Royer et al. (2011) Royer, J.R., Conyers, B., Corwin, E.I., Eng, P.J., Jaeger, H.M., 2011. The role of interstitial gas in determining the impact response of granular beds. Europhysics Letters 93, 28008.
- Scheeres et al. (2019) Scheeres, D.J., McMahon, J.W., French, A.S., Brack, D.N., Chesley, S.R., Farnocchia, D., Takahashi, Y., Leonard, J.M., Geeraert, J., et al., 2019. The dynamic geophysical environment of (101955) Bennu based on OSIRIS-REx measurements. Nature Astronomy URL: http://dx.doi.org/10.1038/s41550-019-0721-3, doi:10.1038/s41550-019-0721-3.
- Soliman et al. (1976) Soliman, A., Reid, S., Johnson, W., 1976. The effect of spherical projectile speed in ricochet off water and sand. International Journal of Mechanical Sciences 18, 279 – 284. URL: http://www.sciencedirect.com/science/article/pii/0020740376900291, doi:https://doi.org/10.1016/0020-7403(76)90029-1.
- Sugita et al. (2019) Sugita, S., Honda, R., Morota, T., Kameda, S., Sawada, H., Tatsumi, E., Yamada, M., Honda, C., Yokota, Y., Kouyama, T., Sakatani, N., Ogawa, K., Suzuki, H., Okada, T., Namiki, N., Tanaka, S., Iijima, Y., Yoshioka, K., Hayakawa, M., Cho, Y., Matsuoka, M., Hirata, N., Hirata, N., Miyamoto, H., Domingue, D., Hirabayashi, M., Nakamura, T., Hiroi, T., Michikami, T., Michel, P., Ballouz, R.L., Barnouin, O., Ernst, C., Schröder, S., Kikuchi, H., Hemmi, R., Komatsu, G., Fukuhara, T., Taguchi, M., Arai, T., Senshu, H., Demura, H., Ogawa, Y., Shimaki, Y., Sekiguchi, T., Müller, T., Hagermann, A., Mizuno, T., Noda, H., Matsumoto, K., Yamada, R., Ishihara, Y., Ikeda, H., Araki, H., Yamamoto, K., Abe, S., Yoshida, F., Higuchi, A., Sasaki, S., Oshigami, S., Tsuruta, S., Asari, K., Tazawa, S., Shizugami, M., Kimura, J., Otsubo, T., Yabuta, H., Hasegawa, S., Ishiguro, M., Tachibana, S., Palmer, E., Gaskell, R., Le+Corre, L., Jaumann, R., Otto, K., Schmitz, N., Abell, P., Barucci, M., Zolensky, M., Vilas, F., Thuillet, F., Sugimoto, C., Takaki, N., Suzuki, Y., Kamiyoshihara, H., Okada, M., Nagata, K., Fujimoto, M., Yoshikawa, M., Yamamoto, Y., Shirai, K., Noguchi, R., Ogawa, N., Terui, F., Kikuchi, S., Yamaguchi, T., Oki, Y., Takao, Y., Takeuchi, H., Ono, G., Mimasu, Y., Yoshikawa, K., Takahashi, T., Takei, Y., Fujii, A., Hirose, C., Nakazawa, S., Hosoda, S., Mori, O., Shimada, T., Soldini, S., Iwata, T., Abe, M., Yano, H., Tsukizaki, R., Ozaki, M., Nishiyama, K., Saiki, T., Watanabe, S., Tsuda, Y., 2019. The geomorphology, color, and thermal properties of Ryugu: Implications for parent-body processes. Science 364.
- Sullivan et al. (2002) Sullivan, R.J., Thomas, P.C., Murchie, S.L., Robinson, M.S., 2002. Asteroid geology from Galileo and NEAR Shoemaker data, in: Bottke, W.F., Cellino, A., Paolicchi, P., Binzel, R.P. (Eds.), Asteroids III, University of Arizona Press, Tucson, Arizona. pp. 331–350.
- Sunday et al. (2016) Sunday, C., Murdoch, N., Cherrier, O., Morales Serrano, S., Valeria Nardi, C., Janin, T., Avila Martinez, I., Gourinat, Y., Mimoun, D., 2016. A novel facility for reduced-gravity testing: A setup for studying low-velocity collisions into granular surfaces. Review of Scientific Instruments 87, 084504. URL: http://dx.doi.org/10.1063/1.4961575, doi:10.1063/1.4961575.
- Thomas et al. (2001) Thomas, P., Veverka, J., Robinson, M., Murchie, S., 2001. Shoemaker crater as the source of most ejecta blocks on the asteroid 433 eros. Nature 413, 394–396. doi:10.1038/35096513.
- Tsimring and Volfson (2005) Tsimring, L., Volfson, D., 2005. Modelling of impact cratering in granular media. Powder Technology 2, 1215–1223.
- Uehara et al. (2003) Uehara, J.S., Ambroso, M.A., Ojha, R.P., Durian, D.J., 2003. Low-speed impact craters in loose granular media. Physics Review Letters 90.
- Veverka et al. (2001) Veverka, J., Farquhar, B., Robinson, M., Thomas, P., Murchie, S., Harch, A., Antreasian, P.G., Chesley, S.R., Miller, J.K., Owen, W.M., et al., 2001. The landing of the NEAR-Shoemaker spacecraft on asteroid 433 eros. Nature 413, 390–393. URL: http://dx.doi.org/10.1038/35096507, doi:10.1038/35096507.
- Walsh (2018) Walsh, K.J., 2018. Rubble pile asteroids. Annual Review of Astronomy and Astrophysics 56, 593–624. URL: http://dx.doi.org/10.1146/annurev-astro-081817-052013, doi:10.1146/annurev-astro-081817-052013.
- Walsh et al. (2019) Walsh, K.J., Jawin, E.R., Ballouz, R.L., Barnouin, O.S., Bierhaus, E.B., Connolly, H.C., Molaro, J.L., McCoy, T.J., Delbo’, M., et al., 2019. Craters, boulders and regolith of (101955) Bennu indicative of an old and dynamic surface. Nature Geoscience URL: http://dx.doi.org/10.1038/s41561-019-0326-6, doi:10.1038/s41561-019-0326-6.
- Wright et al. (2020) Wright, E., Quillen, A.C., South, J., Nelson, R.C., Sanchez, P., Martini, L., Schwartz, S., Nakajima, M., Asphaug, E., 2020. Boulder stranding in ejecta launched by an impact generated seismic pulse boulder stranding in ejecta launched by an impact generated seismic pulse. Icarus 337, 113424.
- Yeomans et al. (2000) Yeomans, D.K., Antreasian, P.G., Barriot, J.P., Chesley, S.R., Dunham, D.W., Farquhar, R.W., Giorgini, J.D., Helfrich, C.E., Konopliv, A.S., McAdams, J.V., Miller, J.K., Owen, W.M., Scheeres, D.J., Thomas, P.C., Veverka, J., Williams, B.G., 2000. Radio Science Results During the NEAR-Shoemaker Spacecraft Rendezvous with Eros. Science 289, 2085–2088. doi:10.1126/science.289.5487.2085.