Coherent dynamics and mapping of excitons
in single-layer MoSe2 and WSe2 at the homogeneous limit
Abstract
We perform coherent nonlinear spectroscopy of excitons in single-layers of MoSe2 and WSe2 encapsulated between thin films of hexagonal boron nitride. Employing four-wave mixing microscopy we identify virtually disorder free areas, generating exciton optical response at the homogeneous limit. Focussing on such areas, we measure exciton homogeneous broadening as a function of environmental factors, namely temperature and exciton density. Exploiting FWM imaging, we find that at such locations, nonlinear absorption of the exciton excited states and their coherent couplings can be observed. Using the WSe2 heterostructure, we infer coherence and density dynamics of the exciton 2S state. Owing to its increased radiative lifetime, at low temperatures, the dephasing of the 2S state is longer than of the 1S transition. While scanning various heterostructures across tens of micrometers, we conclude that the disorder, principally induced by strain variations, remain to be present creating spatially varying inhomogeneous broadening.
I Introduction
The interest in two-dimensional (2D) layered semiconductors stems from novel functionalities that can be obtained by varying their thickness, down to the single-layer (SL) limit, or by stacking layers from different materials to create van der Waals heterostructures. Semiconducting transition metal dichalcogenides (TMDs) in the SL form display direct band gap Mak et al. (2010) spanning across near infra-red and visible range. They typically show 10 absorption, which can approach unity, by engineering their photonic environment Horng et al. (2019). They are thus promising for future flexible optoelectronic applications, such as: LEDs, lasers, photovoltaics, photodetectors, electroluminescence or optical modulators Mak and Shan (2016).
On the more fundamental level, SL-TMDs are nowadays a benchmark to study the physics of excitons (EXs), hydrogen-like bound states formed by Coulomb interaction between an electron and a hole. In typical direct band gap bulk semiconductors such as GaAs, due to the large dielectric screening and small effective mass of the carriers, the resulting EX binding energy is barely a few millielectronvolt (meV). This is negligible compared to the thermal fluctuations, unless the sample is studied at low temperatures. In SL-TMDs though, due to large effective masses and reduced dielectric screening, the EX binding energy is increased up to several hundred meV, such that even at room temperature the optical properties are governed by EX transitions. Furthermore, their band structure displays a pair of non-equivalent valleys as regards the spin degree of freedom, establishing original selection rules for the excitation and emission of light, where the EX valley index is locked with the light helicity.
SL-TMD have been initially fabricated as bare flakes deposited directly on SiO2 substrates. In such configuration, they suffer from a direct contact with the environment and its invasive chemistry, thus become unstable and prone to structural aging Gao et al. (2016) and photodegradation Ahn et al. (2016). Due to microscopic and macroscopic disorder factors — such as: strain, wrinkling, flake deformations and cracks, lattice defects and vacancies, variation of charge state and of dielectric constant in the substrate — the optical response was largely dominated by the inhomogeneous broadening Moody et al. (2015); Jakubczyk et al. (2016), . Recently, it was demonstrated that surface protection by encapsulating SL-TMDs between layers of hexagonal boron nitride -BN Cadiz et al. (2017); Ajayi et al. (2017); Manca et al. (2017); Jakubczyk et al. (2019) provides stable samples with low disorder, avoiding surface contaminations causing the EX broadening. Encapsulation thus yields step-like improvement of optical properties. The main indicator of such improvement was the narrowing of the EX linewidth and appearance of the Rydberg series of the EX’s excited states Chernikov et al. (2014); Manca et al. (2017); Molas et al. (2019); Goryca et al. (2019).
II Experiment
The question arises if the structural disorder in such heterostructures can be suppressed to the point, where is not detectable in the optical response ? If so, how can one demonstrate that the EX transition linewidth indeed attains the homogeneous limit, ? Another query regards the spatial extensions, on which such optimal conditions can be maintained. To address these issues one has to use an optical microscopy technique capable to separate and within the transition spectral lineshape. Four-wave mixing (FWM) spectroscopy, which is the principal tool in our work, has been conceived for this very purpose.
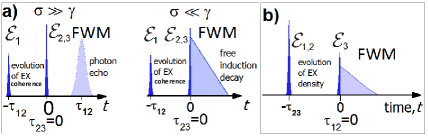
FWM is a nonlinear polarization in the material, proportional to , where are three short laser pulses generated by a femtosecond laser and is the transition oscillator strength. In this approach, and can be differentiated, by monitoring time-resolved (TR) FWM, while varying the time delay between and , . In the presence of , FWM appears as a photon echo Fig (a). As depicted in Fig. 1 a, TR-FWM is a Gaussian peak centered at and displaying the temporal width proportional to . Such en echo builds up due to the phase conjugation (labeled with ) between the first order absorption created by and FWM. Conversely, in the homogeneous limit, FWM transient shows the exponential decay starting at for whatever , also drawn in Fig. 1 a. This is known as free induction decay, adopting the nomenclature used in the NMR spectroscopy. In general, pair can be accurately retrieved by a two-dimensional fitting Jakubczyk et al. (2019) of TR FWM for various .
To enable microscopy, FWM is here detected through optical heterodyning. In short, i) are modulated by distinct radio frequencies around 80 MHz using acousto-optic deflectors. propagate co-linearly and are focussed onto the sample down to the diffraction limit using a microscope objective of NA=0.65. ii) in the detection path, the reflected signal is interfered with the reference beam modulated at the phase-locked linear combination of radio-frequencies , sensitive to the FWM response. iii) background-free spectral interference between and FWM is then recorded as DC signal on a CCD camera, which is installed at the output of the imaging spectrometer Langbein and Patton (2006). FWM field is obtained via spectral interferometry, granting access to the amplitude and phase of the signal. Thus, the modeling often requires to apply complex response functions, to properly account for detection of the field and potential interference effects. This setup is particularly suited to perform FWM micro-spectroscopy with a high signal to noise ratio, accessing the EX coherence dynamics with an enhanced temporal (spatial) resolution of 150 fs (500 nm). Further details regarding the experimental technique can be found in Refs. [Langbein and Patton, 2006; Langbein, 2010], while sketches of the experimental setup are presented in supplementary material in Refs. [Fras et al., 2016; Jakubczyk et al., 2018].
III Results
III.1 Photoluminescence and FWM mapping of a MoSe2 heterostructure
We first present results obtained on a -BN/MoSe2/-BN heterostructure. Its optical image under white light illumination, is shown in Fig. 2 a. The edges of the MoSe2 flake are contoured with the dashed line. The dark spots correspond to the air blisters between the flake and the top -BN having the thickness around 20 nm. The bottom -BN instead shows terraces of different thickness 232 nm (blue area), 240 nm (yellowish), 252 nm (orange) and 290 nm (red). To assess the optical response, the heterostructure is cooled down to T=5 K and we perform confocal photoluminescence (PL) under non-resonant CW excitation at 710 nm, at the position marked with a blue circle in a). As shown in Fig. 2 c, in the PL not only the neutral EX transition is observed, but also the trion (TR) one. For the latter, we note the characteristic low energy tail in the PL signal. While, owing to the residual strain, the spectral position of both transitions fluctuate across the sample by around 15 meV, the TR binding energy is constant and equal to 26 meV. In Fig. 2 d, we present the PL imaging of the sample obtained via raster scanning the excitation and spectrally integrated over TR and EX transitions. It is interesting to notice the correlation between the spectrally integrated PL intensity and the thickness of the bottom -BN terraces: the thinner the latter, the stronger PL is observed. This result is consistent with the recent observation that the EX radiative lifetime can be tuned through the Purcell effect, when varying the thickness of the surrounding -BN layers Fang et al. (2019). To investigate this scenario we propose to perform time-resolved resonant spectroscopy.
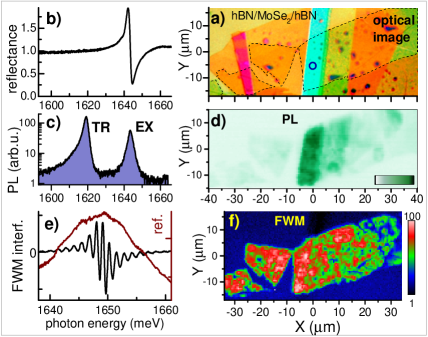
To measure the resonant optical response we first perform white light reflectance restricting the signal to the spot marked with a blue circle. The result is shown in Fig. 2 b. Only EX transition appears as a dispersive quasi-Lorentzian line, with the full width at half-maximum (FWHM) of marely meV. The trion line is absent owing to encapsulation and resonant excitation, which both suppress density of free carriers required to form charged excitons. In order to measure coherent nonlinear response FWM microscopy is carried out. In Fig. 2 e we present a typical spectral interferogram between (brown line) and the FWM signal at . FWM image is constructed by plotting time-integrated (TI) FWM amplitude measured for different points on the sample and is shown in Fig. 2 f. Although the strongest FWM is measured at the flake area covered with the “blue” -BN stripe, globally there is no clear correlation between the FWM amplitude, reflecting to large extend the EX radiative rate, and the thickness of the encapsulating layers. This is attributed to the underlying disorder, generating . We have recently demonstrated Jakubczyk et al. (2019) that there exists correlation between and the EX lifetime: the latter is increased at the areas showing larger due to the stronger exciton localization. The same effect is present here, as evidenced in the Supplementary Fig. S1. We also note that different interference conditions from the various thicknesses of the encapsulating layers generate different electric field distributions of the excitation laser at a plane of MoSe2 SL. This could yield different PL intensities measured at different -BN thicknesses in Fig. 2 d.
III.2 Dephasing mechanisms of excitons in the MoSe2 heterostructure
It was recently reported that FWM transient in bare SL TMDs is a photon echo Moody et al. (2015); Jakubczyk et al. (2016, 2018). In Fig. 3 a we present TR FWM for different delays measured at the same area as in Fig. 2 b. Here, there is virtually no sign of photon echo formation; the maximum amplitude of the transient does not follow the diagonal . Instead, for FWM is maximal for , and then evolves as the exponential free induction decay for . This shows that the optical response is dominated by the homogeneous broadening, i.e., . It is worth to note that FWM is here also detected for . In such configuration, arrives last and triggers FWM through the local field effect Wegener et al. (1990); Jakubczyk et al. (2019). Furthermore, as - delay increases, FWM sets off for increasingly longer times when going into more negative delays, as indeed visible in the color map.
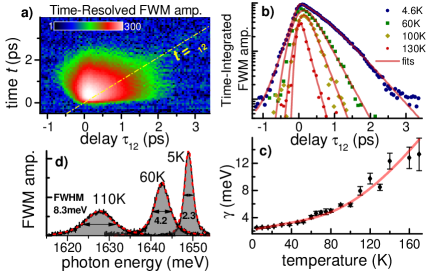
To measure , we plot TI FWM versus , as shown in Fig. 3 b. The data are modeled by a convolution of a Gaussian, reflecting pulse duration of around 150 fs and exponential decay , parameterized with (FWHM) or dephasing time . At low temperature T=4.6 K we measure meV. This differs from around 1 meV measured in bare MoSe2 SLs Jakubczyk et al. (2016) and is therein attributed to longer EX lifetime due to localization on disorder. The latter is significantly larger in bare SLs, as monitored by .
On top of ideal TMD crystal properties — determining the morphology of the EX wave function, its binding energy and radiative lifetime — there are at least three major environmental parameters influencing : temperature, EX density and local disorder, which will be considered in the following.
In Fig. 3 c we present measured for different temperatures. The apparent increase of is modeled by the sum of linear increase and exponential activation part, due to interaction with acoustic and optical phonons, respectively. The data are fitted with the following equation: , with meV, corresponding to activation energy of optical phonons Molina-Sánchez and Wirtz (2011). Qualitatively, the phonon dephasing mechanisms are therefore similar as in bare MoSe2 SLs Jakubczyk et al. (2016). We note that temperature induced increase of the linewidth can be directly monitored in the FWM spectra, as exemplified in Fig. 3 d. Owing to negligible , there is a very good correspondence between retrieved from the coherence dynamics and directly measured FWM spectral linewidth. We emphasize that such comparison to be valid, requires prior knowledge that the transition lineshape is homogeneous. Such an independent assessment is here provided by TR FWM data.
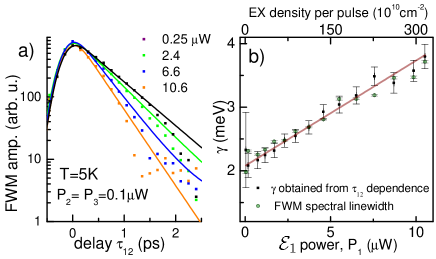
An important factor influencing is the EX density, . With its increase, EX-EX interaction increases, causing excitation induced dephasing, as observed in the past in semiconductor quantum wells Wang et al. (1993); Honold et al. (1989) and more recently for WSe2 Moody et al. (2015) and MoS2 Jakubczyk et al. (2019) SLs. In Fig. 4 a we present exemplary curves of coherence dynamics, where a steeper slope is visible with increasing intensity, . Monitoring the impinging power and assuming absorption of approximately 10%, we can estimate . In Fig. 4 b we plot the resulting dependence: the broadening is well visible, we observe that can be doubled with 300-fold increase of the resonantly generated EX density. We propose to describe the effect by the linear dependence , where is the zero-density linewidth and is the interaction parameter, both established for T=5 K. From the linear fit, we obtain meV and meVcm2. The interaction strength is here 5 times smaller compared to similar studies performed on WSe2 SLs Moody et al. (2015). In Fig. 4 b we also show that the broadening is directly visible in the FWM spectra and in a good agreement with the coherence dynamics measurements.
III.3 Reflectance and FWM response in a WSe2 heterostructure
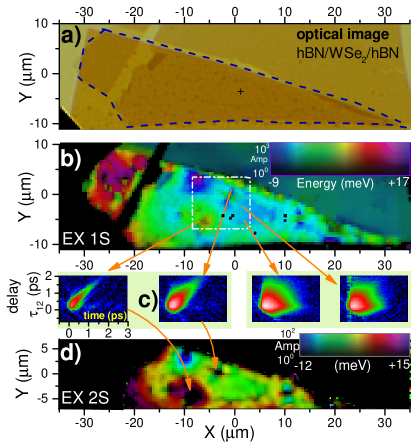
The second part of this work is devoted to investigations of a WSe2 heterostructure. Its optical image is presented in Fig. 8 a. A large WSe2 SL of around m was transferred at the bottom -BN nm thick layer and then partially covered with the top one of nominally the same thickness, resulting in the elongated heterostructure, with a shape marked with a dashed contour in Fig. 8 a. Let us first investigate the area of the flake marked with a cross, which is free from wrinkling (occurring at the edges) and air blisters (visible as dark spots on the neighboring surface).
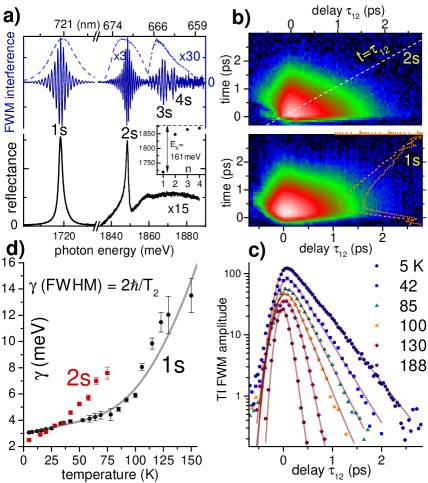
The reflectance spectrum measured at T=5 K is presented in Fig. 5 a. The fundamental EX 1S transition is detected as an emissive quasi-Lorentzian line, with FWHM only meV. Interestingly, the second resonance is clearly observed around meV above EX 1S, with even a sharper line-shape of meV (FWHM). It is attributed to the EX excited 2S state. An additional spectral wiggle is seen another meV higher, however its contrast is not sufficient for the unequivocal assignment of the underlying transitions. FWM spectral interferograms at are shown as blue traces in Fig. 5 a. To drive FWM of the 1S EX we still employ a Ti:Shapphire laser. However, to study the excited states occurring well below 700 nm, an Optical Parametric Oscillator must be used. As the technique is background free and detection is at the shot-noise limit, apart from 1S and 2S states, FWM reveals further resonances attributed to 3S and 4S states. When plotting the energy versus the quantum number (see inset) we observe non-hydrogenic series, in line with previous findings Chernikov et al. (2014) and the EX binding energyMolas et al. (2019); Goryca et al. (2019) of Eb=161 meV.
III.4 Exciton coherence dynamics in the WSe2 heterostructue: dephasing and coherent coupling
FWM transients versus measured for 1S and 2S states are shown as color maps in Fig. 5 b. With increasing , FWM is emitted as an exponentially decaying transient with a maximum centered around . We see strictly no indication of the photon echo formation. FWM takes the form of the free induction decay, proving that at the probed position, the EX transition is homogeneously broadened. To determine FWHM of , in Fig. 5 c we plot time-integrated FWM amplitude as a function of . Resulting coherence dynamics displays a mono-exponential decay over three (six) orders of magnitude in a FWM field (intensity). From these decays we extract , similarly as for the MoSe2 heterostructure (Fig. 3 b).
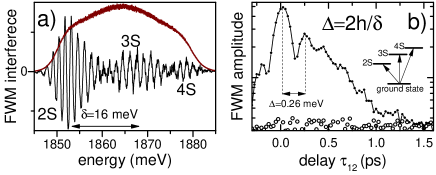
Let us note that the excitation bandwidth of the OPO laser is sufficient to simultaneously cover the excited states 2S, 3S and 4S, as shown in Fig. 6 a. Because these transitions share the same ground state, they are expected to be coherently coupled (absorption on one of the transitions, mutually generates FWM on the other ones). Such coupling should therefore induce quantum beating in the corresponding coherence dynamics. In Fig. 6 b, we present such dynamics measured via -dependence. Indeed, we observe that FWM is here modulated with the period of meV, well corresponding to the 2S-3S splitting meV. We can resolve two oscillation periods within the initial ps. For subsequent delays ps the beating is smeared out owing to fast dephasing of higher excited states. This measurement thus indicates that one can induce couplings within the Rydberg states of TMD EXs.
Focussing back on the dephasing mechanisms, in Fig. 5 c we observe that for increasing temperature, the FWM decay gets more pronounced, owing to the increase of (and correspondingly, shortening of dephasing time ). Such temperature dependence of , measured at 1S and 2S states Fig (b) is summarized in Fig. 5 d.
The exciton 1S EX transition is once again modeled with a linear increase, with meV and meV/K, attributed to the interaction with acoustic phonons, and the exponential activation term with meV, due to the onset of interaction with optical phonons Molina-Sánchez and Wirtz (2011).
As regards the 2S EX transition, let us remind that for an ideal two-dimensional Wannier exciton, the oscillator strength scales with the quantum number as: . The radiatively limited broadening of the 2S EX could be therefore estimated to be times weaker than the one of the 1S EX, thus only around meV at low temperature. It is interesting to note that for , we indeed measure . However is around 20 times larger than the radiative limit, indicating that even low temperature dephasing is dominated by a non-radiative decay, plausibly through the scattering into 1S EX at high center-of-mass in-plane momenta. With increasing temperature, we observe much stronger EX dephasing for the 2S state with respect to 1S. However, recent theoretical work Brem et al. (2019) predicts that 2S transition is less prone to interaction with phonons than the 1S. We here therefore refrain from the modeling of the dependence measured for the 2S EX.
III.5 Population dynamics of 1S and 2S excitons
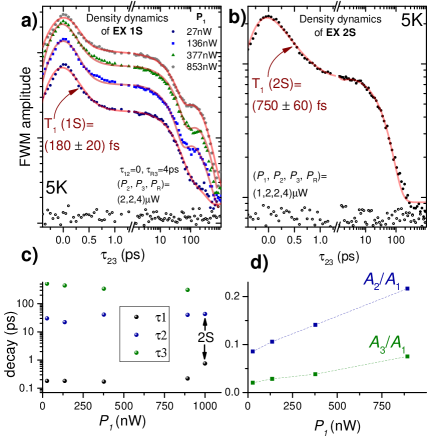
To further elucidate the interplay between radiative and non-radiative decay mechanisms of EX 1S and 2S transitions, we infer the dynamics of resonantly excited EX density. We set and employ and to drive modulation of EX’s population, slowly varying with the frequency MHz. TI-FWM, triggered via delayed from by , reflects the amplitude of this oscillating EX density, as depiced in Fig. 1 b. Exemplary data reflecting such dynamics of 1S EX measured at T=5 K for increasing and fixed and are given in Fig. 7 a. While the EX coherence, inspected in previous sections, vanishes after a few ps, the EX density evolves here on a timescale of at least one nanosecond. This is consistent with recent FWM experiments on SL MoSe2 Scarpelli et al. (2017) and MoS2 heterostructure Jakubczyk et al. (2019), and also perovskite nanocrystals Becker et al. (2018) and nanoplatlets Naeem et al. (2015).
Qualitatively, in the dynamics we distinguish: i) the rise from negative , owing to the finite duration of the laser pulses, ii) initial decay on a few hundred fs scale, attributed to the radiative decay and EX scattering to dark EX states. iii) followed after ps by a much longer FWM decay, due to populating the dark EX states and their subsequent relaxation and interaction with the bright ones, i.e., EXs within the light cone, obeying spin selection rules for radiative recombination.
Because the density dynamics is here measured via the interference with , which is phase-sensitive, it should be described with a complex response function . The latter is here proposed in a form of a coherent superposition of three exponential decay components Scarpelli et al. (2017); Jakubczyk et al. (2019):
| (1) |
where with are amplitude, phase and decay constant of each of the three processes. The pulse width is taken into account by convoluting with the Gaussian of fs. Furthermore, owing to the repetition period ns, there is a pile-up effect building up throughout many repetitions of the heterodyne experiment equal to . The response function therefore takes the following form: . Finally, to fit the FWM amplitude we take absolute value of .
The result of the modeling is given by red traces and retrieved set of decay constants for different is given in Fig. 7 c. For the initial decay we consistently find ps. The second and third process decay on a scale of a few tens and a few hundred ps, respectively. They describe EX evolution in the dark state reservoirs, namely EXs with the in-plane momentum out of the light cone and the spin-forbidden ones. Note that the wiggling observed around ps, building up when increasing , is due to interference between all three processes. The interference becomes more pronounced as the ratios and increase with , as reported in Fig. 6 d. In other words, increasing the excitation results in higher occupancy of dark EX states and their enhanced interaction with the bright EX, which is probed with FWM -dependence.
In Fig. 7 b we present the density dynamics measured on the 2S EX transition. The modeling includes now only two decay processes. Interestingly the initial decay of ps is measured to be more than four times longer than for the 1S EX, indicating longer radiative decay of the 2S state. It is however still far off from the prediction based on the relative oscillator strength, again indicating dominance of the non-radiative decay processes of the 2S states. We note that dephasing of the higher states is much faster than our temporal resolution of 150 fs, showing prominently non-radiative decay of the higher excited EX states.
III.6 FWM mapping of exciton 1S and 2S transitions in the WSe2 heterostructure
An important conclusion emerging from our experiments is that EX’s excited states can be observed uniquely at the areas with eradicated disorder, where the optical response is dominated by . To substantiate this claim, we perform FWM spatial imaging across the flake. In Fig. 8 b we present a color map where FWM amplitude and transition energy of 1S EX are encoded as brightness and hue level, respectively. Even though locally (on the areas up to m2) the transition energy can be quasi-constant (spectrally fluctuating an order of magnitude less than ), globally the EX energy changes by around 25 meV. This variation is attributed to residual strain generated during the processing of the heterostructure - other sources of disorder, like variation of dielectric permittivity or doping were shown to be suppressed Raja et al. (2019) in -BN encapsulated TMD SLs.
To illustrate the interplay between strain-induced disorder and coherent response, we perform mapping of the EX coherence dynamics: we therefore spatially scan within the part of the heterostructure enclosed by a white square, while at each position the delay is varied. In Fig. 8 c we provide four examples of the time- and -resolved FWM. In the first pair of panels, the response clearly displays the photon echo. When cross-correlating with b), one assigns these to the areas exhibiting a strong radial strain gradient of the EX energy, generating . Conversely, the second pair of panels, measured on a spot showing a quasi-constant energy level, yields FWM as a free-induction decay signal. We note that at some positions, we observe FWM temporal response generated by a mixture of inhomogeneous contributions. In other words, even within the sub-m excitation area, several domains characterized by different and can contribute to the signal, rendering quantitative analysis of these transients challenging.
Finally, we have carried out FWM spatial imaging of the 2S EX transition. As in panel b), we encode the amplitude and transition energy as brightness and hue, and present the result in Fig. 8 d. One can notice that at areas with suppressed disorder — here identified by FWM displaying free-induction decay instead of photon echo — the 2S EX transition can be observed. Interestingly, FWM of the 2S EX is suppressed at the areas exhibiting a pronounced photon echo. This indicates that absorption of EX’s excited states can only be induced at locations with low disorder on both microscopic and macroscopic scales.
IV Conclusions
We investigated coherent non-linear response of the EX transitions in high quality -BN/MoSe2/-BN and -BN/WSe2/-BN heterostructures. Using FWM microscopy and imaging we showed that encapsulating SLs of MoSe2 and WSe2 generally provides low disorder samples, which on areas reaching host homogeneously broadened EX transitions. At such locations, we: i) investigated EX dephasing mechanisms, ii) revealed coherent nonlinear response of EX excited states up to 4S, iii) provided indication of coherent coupling within excited states. We compared population lifetimes of 1S and 2S states, notably finding longer dephasing time (smaller homogeneous broadening) of the 2S state. This is assigned to its larger spatial extent and correspondingly longer radiative lifetime with respect to the EX 1S, as indicated by investigation of the EX population dynamics. Even though locally optical response of these TMD heterostructures is nowadays brought close to perfection, our work shows that further efforts in processing are necessary, to attain such performance across the entire heterostructure. Eliminating spatially varying disorder would, for instance, permit to quantitatively evaluate the impact of dielectric surrounding on the coherent response of TMD EXs. Furthermore, the resulting weak EX localization would enable to investigate propagative aspects of EX coherence and density (diffusion) by implementing FWM with a spatially separated excitation beams.
V Methods: sample fabrication
The heterostructures were obtained by a bottom-up method using the gel-film assisted exfoliation technique. As a substrate an ultra-flat silicon wafers were used, provided by Ted Pella. The WSe2 and MoSe2 crystals were bought from HQ Graphene and the high purity -BN was prepared in NIST (Japan). A bottom layer of -BN was exfoliated directly to the silicon substrate. The flakes of required thickness were identified using the optical microscope and some of them verified using AFM. For the heterostructures -BN/WSe2/-BN the thickness of bottom -BN is nm. The heterostructures -BN/MoSe2/-BN possess sequence of different thicknesses in the range from 200 to 250 nm for the bottom -BN. SLs of TMDs and top -BN were transferred directly from gel-film using all-dry transfer method. Heterostructures were annealed before each transfer (180C, 5 min) to remove as much residues as possible. After completing the stacking process all samples were annealed for another 5 hours at 200C. All heterostructures contain some air trapped between TMD and top -BN flake (easily visible in form of bubbles in Fig. 2 a and Fig. 8 a).
VI Acknowledgments
JK acknowledges support by the European Research Council (ERC) Starting Grant PICSEN (grant no. 306387) and he is grateful for discussions with D. Wigger, M. Richter, M. Selig and J. Renard and W. Langbein. LZ acknowledges the support from the Student Project IGA Pr F2019 031 of Palacký. MB acknowledges the support from the Ministry of Education, Youth and Sports of the Czech Republic under the project CEITEC 2020 (LQ1601) University. Growth of hexagonal boron nitride crystals was supported by the Elemental Strategy Initiative conducted by the MEXT, Japan and the CREST (JPMJCR15F3), JST. Finally, we acknowledge support by the EU Graphene Flagship project (no. 785219).
References
- Mak et al. (2010) K. F. Mak, C. Lee, J. Hone, J. Shan, and T. F. Heinz, “Atomically thin MoS2: A new direct-gap semiconductor,” Phys. Rev. Lett. 105, 136805 (2010).
- Horng et al. (2019) J. Horng, E. W. Martin, Y.-H. Chou, E. Courtade, T.-C. Chang, C.-Y. Hsu, M.-H. Wentzel, H. G. Ruth, T.-C. Lu, S. T. Cundiff, F. Wang, and H. Deng, “Perfect absorption by an atomically thin crystal,” condmat (2019).
- Mak and Shan (2016) K. F. Mak and J. Shan, “Photonics and optoelectronics of 2d semiconductor transition metal dichalcogenides,” Nat. Photon. (2016).
- Gao et al. (2016) J. Gao, B. Li, J. Tan, P. Chow, T.-M. Lu, and N. Koratkar, “Aging of transition metal dichalcogenide monolayers,” ACS Nano 10, 2628–2635 (2016).
- Ahn et al. (2016) S. Ahn, G. Kim, P. K. Nayak, S. I. Yoon, H. Lim, H.-J. Shin, and H. S. Shin, “Prevention of transition metal dichalcogenide photodegradation by encapsulation with h-BN layers,” ACS Nano 10, 8973–8979 (2016).
- Moody et al. (2015) G. Moody, C. Kavir Dass, K. Hao, C.-H. Chen, L.-J. Li, A. Singh, K. Tran, G. Clark, X. Xu, G. Berghäuser, E. Malic, A. Knorr, and X. Li, “Intrinsic homogeneous linewidth and broadening mechanisms of excitons in monolayer transition metal dichalcogenides,” Nat. Commun. 7, 8315 (2015).
- Jakubczyk et al. (2016) T. Jakubczyk, V. Delmonte, M. Koperski, K. Nogajewski, C. Faugeras, W. Langbein, M. Potemski, and J. Kasprzak, “Radiatively limited dephasing and exciton dynamics in MoSe2 monolayers revealed with four-wave mixing microscopy,” Nano Lett. 16, 5333–5339 (2016).
- Cadiz et al. (2017) F. Cadiz, E. Courtade, C. Robert, G. Wang, Y. Shen, H. Cai, T. Taniguchi, K. Watanabe, H. Carrere, D. Lagarde, M. Manca, T. Amand, P. Renucci, S. Tongay, X. Marie, and B. Urbaszek, “Excitonic linewidth approaching the homogeneous limit in MoS2 based van der Waals heterostructures: accessing spin-valley dynamics,” Phys. Rev. X 7, 021026 (2017).
- Ajayi et al. (2017) O. A. Ajayi, J. V. Ardelean, G. D. Shepard, J. Wang, A. Antony, T. Taniguchi, K. Watanabe, T. F. Heinz, S. Strauf, X.-Y. Zhu, and J. C. Hone, “Approaching the intrinsic photoluminescence linewidth in transition metal dichalcogenide monolayers,” 2D Mater. 4, 031011 (2017).
- Manca et al. (2017) M. Manca, M. M. Glazov, C. Robert, F. Cadiz, T. Taniguchi, K. Watanabe, E. Courtade, T. Amand, P. Renucci, X. Marie, G. Wang, and B. Urbaszek, “Enabling valley selective exciton scattering in monolayer WSe2 through upconversion,” Nat. Commun. 8, 14927 (2017).
- Jakubczyk et al. (2019) T. Jakubczyk, G. Nayak, L. Scarpelli, F. Masia, W.-L. Liu, S. Dubey, N. Bendiab, L. Marty, T. Taniguchi, K. Watanabe, G. Nogues, J. Coraux, V. Bouchiat, W. Langbein, J. Renard, and J. Kasprzak, “Coherence and density dynamics of excitons in a single-layer MoS2 reaching the homogeneous limit,” ACS Nano 13, 3500–3511 (2019).
- Chernikov et al. (2014) A. Chernikov, T. C. Berkelbach, H. M. Hill, A. Rigosi, Y. Li, O. B. Aslan, D. R. Reichman, M. S. Hybertsen, and T. F. Heinz, “Exciton binding energy and nonhydrogenic Rydberg series in monolayer WS2,” Phys. Rev. Lett. 113, 076802 (2014).
- Molas et al. (2019) M. R. Molas, A. O. Slobodeniuk, K. Nogajewski, M. Bartos, Ł. Bala, A. Babiński, K. Watanabe, T. Taniguchi, C. Faugeras, and M. Potemski, “Energy spectrum of two-dimensional excitons in a nonuniform dielectric medium,” Phys. Rev. Lett. 123, 136801 (2019).
- Goryca et al. (2019) M. Goryca, J. Li, A. V. Stier, T. Taniguchi, K. Watanabe, E. Courtade, S. Shree, C. Robert, B. Urbaszek, X. Marie, and S. A. Crooker, “Revealing exciton masses and dielectric properties of monolayer semiconductors with high magnetic fields,” Nat. Commun. 10, 4172 (2019).
- Fig (a) see Supplemental Material at [URL will be inserted by publisher] for an example of the photon echo formation, in particular in Fig. S1 b.
- Langbein and Patton (2006) W. Langbein and B. Patton, “Heterodyne spectral interferometry for multidimensional nonlinear spectroscopy of individual quantum systems,” Opt. Lett. 31, 1151 (2006).
- Langbein (2010) W. Langbein, “Coherent optical spectroscopy of semiconductor nanostructures,” Rivista del nuovo cimento 33, 255–312 (2010).
- Fras et al. (2016) F. Fras, Q. Mermillod, G. Nogues, C. Hoarau, C. Schneider, M. Kamp, S. Höfing, W. Langbein, and J. Kasprzak, “Multi-wave coherent control of a solid state single emitter,” Nat. Phot. 10, 155 (2016).
- Jakubczyk et al. (2018) T. Jakubczyk, K. Nogajewski, M. R. Molas, M. Bartos, W. Langbein, M. Potemski, and J. Kasprzak, “Impact of environment on dynamics of exciton complexes in a WS2 monolayer,” 2D Mater. 5, 031007 (2018).
- Fang et al. (2019) H. H. Fang, B. Han, C. Robert, M. A. Semina, D. Lagarde, E. Courtade, T. Taniguchi, K. Watanabe, T. Amand, B. Urbaszek, M. M. Glazov, and X. Marie, “Control of the exciton radiative lifetime in van der waals heterostructures,” Phys. Rev. Lett. 123, 067401 (2019).
- Wegener et al. (1990) M. Wegener, D. S. Chemla, S. Schmitt-Rink, and W. Schäfer, “Line shape of time-resolved four-wave mixing,” Phys. Rev. A 42, 5675–83 (1990).
- Molina-Sánchez and Wirtz (2011) A. Molina-Sánchez and L. Wirtz, “Phonons in single-layer and few-layer MoS2 and WS2,” Phys. Rev. B 84, 155413 (2011).
- Wang et al. (1993) H. Wang, K. Ferrio, D. G. Steel, Y. Z. Hu, R. Binder, and S. W. Koch, “Transient nonlinear optical response from excitation induced dephasing in GaAs,” Phys. Rev. Lett. 71, 1261–1264 (1993).
- Honold et al. (1989) A. Honold, L. Schultheis, J. Kuhl, and C. W. Tu, “Collision broadening of two-dimensional excitons in a GaAs single quantum well,” Phys. Rev. B 9, 6442–6445 (1989).
- Fig (b) see Supplemental Material at [URL will be inserted by publisher] for corresponding dephasing curves measured at the 2S exciton at different temperatures, namely Fig. S2.
- Brem et al. (2019) S. Brem, J. Zipfel, M. Selig, A. Raja, L. Waldecker, J. D. Ziegler, T. Taniguchi, K. Watanabe, A. Chernikov, and E. Malic, “Intrinsic lifetime of higher excitonic states in tungsten diselenide monolayers,” Nanoscale 11, 12381–12387 (2019).
- Scarpelli et al. (2017) L. Scarpelli, F. Masia, E. M. Alexeev, F. Withers, A. I. Tartakovskii, K. S. Novoselov, and W. Langbein, “Resonantly excited exciton dynamics in two-dimensional monolayers,” Phys. Rev. B 96, 045407 (2017).
- Becker et al. (2018) M. A. Becker, L. Scarpelli, G. Nedelcu, G. Raino, F. Masia, P. Borri, T. Stoferle, M. V. Kovalenko, W. Langbein, and R. F. Mahrt, “Long exciton dephasing time and coherent phonon coupling in CsPbBr2Cl perovskite nanocrystals,” Nano Lett. 18, 7546–7551 (2018).
- Naeem et al. (2015) A. Naeem, F. Masia, S. Christodoulou, I. Moreels, P. Borri, and W. Langbein, “Giant exciton oscillator strength and radiatively limited dephasing in two-dimensional platelets,” Phys. Rev. B 91, 121302 (2015).
- Raja et al. (2019) A. Raja, L. Waldecker, J. Zipfel, Y. Cho, S. Brem, J. D. Ziegler, M. Kulig, T. Taniguchi, K. Watanabe, E. Malic, T. F. Heinz, T. C. Berkelbach, and A. Chernikov, “Dielectric disorder in two-dimensional materials,” Nat. Nanotechnol. 14, 832–837 (2019).