Distorted surfaces of magnetic helium-peculiar stars: An application to a Cen
Abstract
Helium-peculiar magnetic chemically peculiar stars show variations of helium abundance across their surfaces. As a result of associated atmospheric scale height variations, the stellar surface becomes distorted, with helium-rich regions dented inwards. Effectively, on top of flux variations due to opacity effects, the depressed helium-rich surface regions become less bright in the optical regions and brighter in the ultraviolet. We study the observational effects of the aspherical surface on the light curves of a Cen. We simulate the light curves of this star adopting surface distributions of He, N, O, Si, and Fe derived from Doppler mapping and introducing the effect of distortion proportional to helium abundance. We show that while most of the optical and UV variations of this star result from flux redistribution due to the non-uniform surface distributions of helium and iron, the reduction of light variations due to the helium-related surface distortion leads to a better agreement between simulated optical light curves and the light curves observed with the BRITE satellites.
keywords:
stars: chemically peculiar – stars: early type – stars: variables – stars: individual a Cen1 Introduction
During their lifetimes, the surfaces of chemically peculiar stars on the upper main sequence acquire significantly different chemical composition than the circumstellar clouds from which they were born. This results from the competing processes of radiative levitation and gravitational settling in their (primarily) radiative atmospheres (Vauclair et al., 1991; Michaud et al., 2011; Alecian et al., 2011). These processes separate radiatively-supported elements from those that are deposited in the deeper stellar layers.
The chemical separation affects a fraction of the stellar surface, which varies with the age of the star (Vick et al., 2010). The peculiarities can appear only in layers which are sufficiently stable against mixing processes. As a consequence, chemically peculiar stars are typically slow rotators and mostly avoid close binaries (Carrier et al., 2002). Moreover, the surface layers of chemically peculiar stars are frequently stabilized by magnetic fields that are likely of fossil origin (Morel et al., 2015; Wade et al., 2016; Grunhut et al., 2017) and may also originate in stellar mergers (Bogomazov & Tutukov, 2009; Schneider et al., 2019).
Chemical elements are not distributed evenly across the surface of chemically peculiar stars. They predominantly appear in large surface spots (patches), and the abundance contrast across the surface can approach several orders of magnitude (Lüftinger et al., 2010b; Kochukhov et al., 2014). This results in spectroscopic line profile variability modulated by the stellar rotation. The associated flux redistribution, which stems from the dependence of opacity on wavelength, leads to periodic light variability at the level of a few percent (Krtička et al., 2012; Prvák et al., 2015).
Despite the order-of-magnitude variation of abundances in the stellar atmosphere, the structural changes associated with the peculiar composition are generally only modest. The reason is that hydrogen remains the dominant element throughout the stellar atmosphere for most stars. It is only in helium-rich stars that the dominant hydrogen is replaced by helium to a significant extent (Khokhlova et al., 2000; Oksala et al., 2015). This leads to up to a factor-of-two increase of mean molecular weight and hence a factor-of-two reduction of atmospheric scale height (Norris & Baschek, 1972; Mihalas, 1973). These are significant changes that can be most easily detected in photometry.
The inclusion of such distorted stellar surfaces could be important for our understanding of the light curves of chemically peculiar (CP) stars. According to the current paradigm, the light variability results from the flux redistribution from the far-UV to near-UV and visible domains due to the bound-bound (lines, mainly iron or chromium) and bound-free (ionization, mainly silicon and helium) transitions, horizontal surface distribution of elements, and stellar rotation (Krtička et al., 2012; Prvák et al., 2015). The simulated light curves of CP stars derived from the integrated flux of model atmospheres computed for abundances from Doppler maps typically agree with observations in the ultraviolet (UV) and optical domains. However, there are some details that remain unexplained, for example the difference between the Strömgren and light curves of Aur (Krtička et al., 2015) or the out-of-eclipse light variations of Ori E (Oksala et al., 2015). In some of these cases a distorted stellar surface may provide an explanation of the discrepancies.
Due to variation of surface helium abundance and the density scale height the stellar surface becomes distorted. We study the effect of distorted surface on the light curves of the helium-peculiar star a Cen (V761 Cen, HR 5378, HD 125823). The star a Cen is of particular interest in this context because it exhibits the most extreme variation of He abundance across its surface of any known He-peculiar star (Bohlender et al., 2010). Hence it is the best-suited target to identify the potential effects of surface distortion.
2 The shape of the stellar surface
The distortion of the stellar surface is connected with the variation of density scale height
| (1) |
which is given by the surface gravity , hydrogen mass , and mean molecular weight . In a helium-dominated gas, the mean molecular weight changes from about 0.6 for the solar chemical composition to about 1.3 for fully ionized helium. This implies a decrease of the density scale height by a factor of up to about 2 (Norris & Baschek, 1972; Mihalas, 1973). However, the real change of the stellar radius is expected to be much smaller, because helium dominates only a fraction of the stellar envelope.
To quantitatively estimate the influence of variable molecular weight on the shape of the stellar surface we used MESA evolutionary models (Paxton et al., 2011, 2013) to calculate the interior structure of a Cen. We adopted the zero age main sequence mass and let the model evolve for 32 Myr. These values correspond to the parameters of a Cen as determined by Kochukhov & Bagnulo (2006).
We assume that the helium-rich region extends from the stellar surface up to the depth where the gas energy density starts to dominate the magnetic field energy density . One can expect that below this region the mixing processes do not allow for strong helium enrichment. The depth of this region was derived from the MESA model assuming magnetic field strength of 8 kG, which corresponds to the maximum modulus of the surface field of a Cen as derived from the magnetic Doppler imaging (MDI, Wade et al. 2017, Huang et al., in preparation). In a particular stellar model, this happens at the radius corresponding to a Rosseland optical depth . We modified the derived MESA model by replacing hydrogen and helium mass fraction in the layers dominated by magnetic field by and , respectively, and we let the model evolve for an arbitrarily short time of 1 yr. This should be long enough to allow the model to relax to a new hydrostatic structure of the outer layers, because the timescale of the approach to hydrostatic equilibrium is order of days for the whole star. The change of surface chemical composition resulted in a negligible change of the stellar luminosity, but the stellar radius decreased by about and the effective temperature increased by roughly K.

The total brightness variations due to the distorted surface is a combination of the effect of the higher effective temperature and smaller radius, which compensate each other to keep the luminosity constant. The change of brightness as a function of wavelength can be described by a ratio of emergent fluxes calculated for the normal stellar effective temperature and for the effective temperature increased by ,
| (2) |
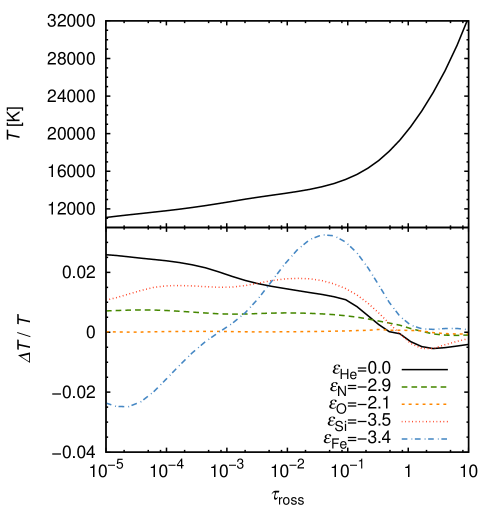
where the geometrical factor accounts for a smaller radius at the location of the distortion. From Fig. 1 it follows that in the far-ultraviolet regions the temperature effect dominates due to the redistribution; therefore these wavelength regions become brighter. On the other hand, in the visible and near-ultraviolet regions the geometric factor dominates and these layers become fainter. These changes contribute to the larger flux variations caused by the opacity effects (Krtička et al., 2007), but affect only helium-rich regions of the stellar surface.
The distortion of the stellar surface contributes to the deviation from the spherical symmetry. Because the surface layers are rigidly rotating due to the magnetic field, the surface distortion leads to the precession of the star. Such problems were studied in the context of the influence of magnetic field on the stellar structure (Mestel & Takhar, 1972; Lander & Jones, 2017). The timescale of the evolution of the direction of the rotational axis is roughly given by the angular frequency of precession , where is the period of rotation and and are moments of inertia about the normal to the helium-rich region and about the principal rotation axis, respectively (assuming helium spot at the equator). From this follows the typical timescale of about yr, which was determined using the moments of inertia calculated from the output of the MESA models discussed above.
The precessional motion of the rotational axis can be observationally tested by study of rotational period variations, but corresponding changes are very small (Mikulášek, et al., 2008). On the other hand, the bulk of the star is not confined by the magnetic field and the precessional motion is accompanied by interior flows, which are oscillatory on the precession timescale (Mestel & Takhar, 1972; Lander & Jones, 2017). This could possibly explain long timescales of rotational period evolution observed in some helium peculiar stars (Mikulášek, et al., 2008; Shultz, et al., 2019), that cannot be explained by rotational braking by magnetized wind (Ud-Doula, Owocki & Townsend, 2009).
The stability considerations require that the star rotates along the axis with largest corresponding moment of inertia, that is, with helium-rich regions located around the poles. This does not appear in real stars implying either long relaxation processes or the existence of another stronger surface distortion.
The distortion of the stellar surface due to helium abundance variations may be modified by the effect of the magnetic field (Mihalas, 1973). While the poloidal field likely does not significantly contribute to the pressure gradient due to small variations of the poloidal field component in the atmosphere, the toroidal field component may have more significant effect.
3 Ultraviolet and visual variability
| Effective temperature | K |
|---|---|
| Surface gravity (cgs) | |
| Inclination | |
| Microturbulent velocity | |
| Helium abundance | |
| Nitrogen abundance | |
| Oxygen abundance | |
| Silicon abundance | |
| Iron abundance |
3.1 The observed rotational variability of a Cen
The magnetic helium weak/strong chemically peculiar star a Cen is known as spectroscopic, photometric, and magnetic variable with a period of 8.817 d which was identified with its rotational period (Mihalas, 1973; Catalano & Leone, 1996). The simultaneous analysis of 99 497 relevant observational data covering the time interval 1967–2016 shows that the observed variations can be satisfactorily well approximated by the linear ephemeris
| (3) |
The period analysis, which is based on (Norris, 1971; Pedersen & Thomsen, 1977; Catalano & Leone, 1996), Hipparcos (ESA, 1997), SMEI (Pigulski, priv. comm.), and BRITE photometry, He line strengths (Norris, 1971; Underhill et al., 1975; Pedersen & Thomsen, 1977), magnetic field measurements (Borra et al., 1983), and our own He line spectroscopy and magnetic field measurements, will be published elsewhere (Mikulášek et al., in preparation). The zero phase corresponds to the maximum strength of He lines. We used this ephemeris for the simulations that follow111The rotational period, derived from the above mentioned observations and new high-precision data from TESS satellite, d (for full period analysis see Mikulášek et al., in preparation) does not contradict the ephemeris used in this paper..
3.2 Simulation of the SED variability
The simulation of the variability of the spectral energy distribution (SED) of a Cen is based on the model atmosphere code TLUSTY200 (Hubeny, 1988; Lanz & Hubeny, 2003). The list of included elements, ionization states, and the atomic data used for the atmosphere modelling are the same as used by Lanz & Hubeny (2007). The data are appropriate for B-type stars and they were mostly calculated within the Opacity and Iron Projects (Seaton et al., 1992; Hummer et al., 1993). Our calculations assumed the (fixed) effective temperature and surface gravity given in Table 1. We calculated a grid of LTE model atmospheres parametrized by abundances of helium, nitrogen, oxygen, silicon, and iron (see Table 2). The abundances cover the range of abundances found on the surface of a Cen from the MDI, except for the lowest abundances of helium, nitrogen, and oxygen. Our test showed that these elements at their lowest abundances found from the MDI do not significantly influence the emergent flux. For all other elements not included in the MDI we assumed solar abundances after Asplund et al. (2009). In the model atmospheres, we assumed the chemical stratification to be vertically homogeneous, although vertical abundance gradients may exist in helium rich stars (Vauclair et al., 1991; Leone & Lanzafame, 1997; Leone, 1998). In the following denotes abundances relative to hydrogen by number, i.e., .
Synthetic spectra were calculated from the model atmospheres using the SYNSPEC45 code assuming the same abundances as the model atmosphere calculations. For the grid of abundances specified in Table 2, we derived the abundance-dependent specific intensities ) for equidistantly-spaced values of , where is the angle between the normal to the surface and the line of sight, and denotes vector of abundances, . The original linelist provided with SYNSPEC45 was extended by about 23 million iron lines derived from theoretical and observational line lists downloaded in 2013 from the Kurucz website222http://kurucz.harvard.edu.
| He | |||||||||
|---|---|---|---|---|---|---|---|---|---|
| N | |||||||||
| O | |||||||||
| Si | |||||||||
| Fe |
The basic photometric quantity observed at a distance from the star is the radiative flux in a band (Hubeny & Mihalas, 2014)
| (4) |
where is the stellar radius. The specific intensity in the band varies across the stellar surface. The intensity is obtained by interpolating between intensities from the grid of at each surface point with spherical coordinates . The intensities from the grid are calculated as
| (5) |
The response function for individual bands is derived by either fitting the tabulated response functions for BRITE bands (Weiss et al., 2014) or simply assuming a Gaussian function for UV and variations (see Krtička et al. 2007 for adopted coefficients for Strömgren bands).
For a comparison with the observed light variations we calculate the magnitude difference in a given band defined as
| (6) |
where is calculated from Eq. 4. Here is the reference flux obtained under the condition that the mean magnitude difference over the rotational period is zero.
The influence of the aspherical distorted stellar surface was approximated by a function
| (7) |
where we selected and the values of were taken from Fig. 1. The function was selected for convenience, because it gives for small and for large . The effect of distortion was included in our simulations by multiplication of intensities expressed by Eq. (5) by .
There is an additional effect connected with distortion of the stellar surface in addition to the change of the surface brightness. As a result of distortion, the normal to the surface no longer has a radial direction, but is tilted with respect to the radial direction. This has to be accounted for when interpolating between the specific intensities as a function of in Eq. (4). We included this effect in our models and it turns out that this leads to a change of the light curve on the order of . Because we do not know the detailed structure of the surface anyway, we neglected this effect in the simulated light curves presented here.
3.3 Influence of abundances on model atmospheres and emergent flux: the case without surface asphericity
Individual elements influence the temperature distribution via light absorption due to bound-bound (line) and bound-free (continuum) transitions. As a result, the temperature in the continuum-forming region of the model atmosphere (for ) increases with increasing abundance of given element (see Fig. 2). The influence of helium, silicon, and iron is the strongest, while the effect of nitrogen and oxygen is only marginal.
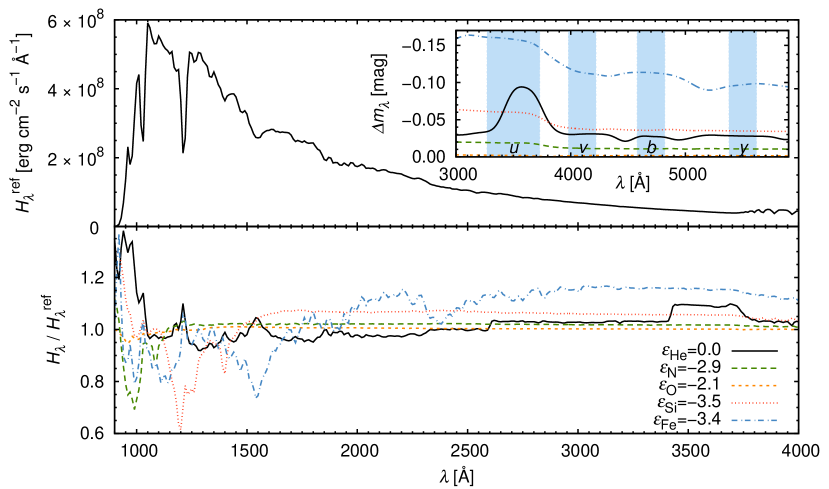
Enhanced opacity in atmospheres with overabundance of individual elements together with the associated modified temperature structure lead to the redistribution of flux from wavelength regions with strong opacity of a given element to regions with low opacity. Because the regions with strong opacity appear typically in the far-UV region, the flux is typically redistributed from the far-UV to the near-UV and optical regions (see Fig. 3). Consequently, overabundant spots are typically bright in the visual and near-UV bands, and are dark in the far-UV bands. However, these variations are not monotonic due to the non-monotonic dependence of opacity on wavelength.
These flux changes can be detected as SED variability in the UV and optical regions. To understand the optical variations, we also plot the relative magnitude difference
| (8) |
as a function of wavelength in Fig. 3. Here is the reference flux calculated for nearly solar chemical composition (, , , , and ). From Fig. 3 it follows that the absolute value of the relative magnitude difference is the largest in the -band of the Strömgren photometric system due to helium and iron, while the relative magnitude difference is nearly the same in the visual bands (, , and ). An apparent maximum of the relative magnitude difference in the -band in the model with enhanced helium abundance is caused by the filling of the Balmer jump. In the helium-rich models (typically for ), the hydrogen Balmer jump vanishes, while the jumps due to helium become visible. From Fig. 3 it also follows that nitrogen and oxygen do not significantly influence the visible light curve.
3.4 Predicted visual and ultraviolet variations


Simulated light curves were calculated from Eq. (6) as a function of rotational phase. We used the abundance maps derived from MDI (Wade et al. 2017, Huang et al., in preparation) and the emergent fluxes computed with the SYNSPEC code.
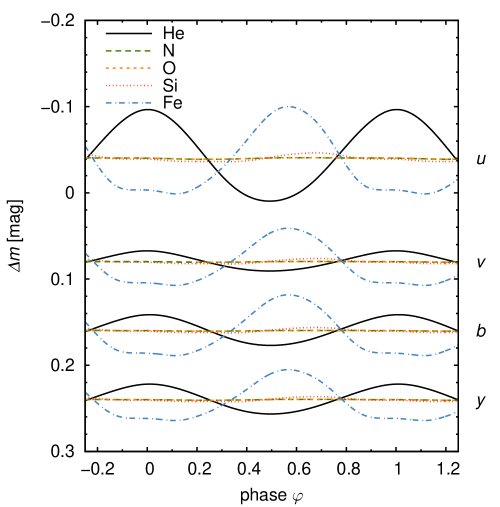
As a first step, we studied the influence of individual elements separately, neglecting the distorted surface. We calculated visual light variations from the abundance map of a single element, assuming fixed abundance of other elements (, , , , and ). Fig. 4 shows that helium and iron contribute principally to the visual light variations. These elements show large overabundance in the spots and large abundance variations on the stellar surface. The light curves reflect the abundance variations on the visible part of the stellar surface. As a result of the anticorrelation of the helium and iron surface distributions, the light curves due to these elements are also anticorrelated. The influence of nitrogen, oxygen, and silicon on the visual light variations is only marginal. This is not unexpected in the case of nitrogen and oxygen, but the light curves due to the silicon show surprisingly low amplitudes. The reason is the same for all these elements, because they do not significantly influence the emergent flux (see Fig. 3) and none of these elements show large spots close to the center of the visible disk. A small role of silicon in the overall light variability of a Cen was already unveiled by Molnar (1974).
The light curve calculated from the surface distributions of all elements is given in Fig. 5 for the Strömgren photometric system and in Fig. 6 for the BRITE observations. The light curve is dominated by iron in the optical region, and helium influences the light curve in the color. The adopted model explains most of the light variability in the optical bands of the Strömgren photometric system and in the blue and red bands of BRITE. The inclusion of surface distortion via Eq. (7) dampens the variations due to helium and leads to a better agreement between light curves predicted for a Cen and observed with the BRITE satellite (Fig. 6). For BRITE photometry, the inclusion of surface distortion leads to a decrease of reduced from 19 to 13 in the blue domain and from 10 to 7 in the red domain.
It remains unexplained why the shape of the light minimum during the phases , where our model predicts local maximum due to helium, is not reproduced by the observations. This is particularly clear in comparison with the BRITE data. The local maximum due to helium is (in accordance with Fig. 3) strongest in the near-UV band. Helium dominates the light curve due to large spot with on the visible hemisphere. The corresponding feature is completely missing in the observations. As a result of this, the observed and predicted light curves disagree around phase in . The disagreement in the colour could be connected with the fact that the variations due to iron and helium partially cancel in this domain. Consequently, the predicted light variations are particularly sensitive to inaccuracies in the abundance maps or model opacities. Omission of additional elements, NLTE effects or vertical abundance stratification may also contribute to the disagreement between observation and theory. Sokolov (2012) concluded that besides iron also chromium and nickel shape the UV flux distribution of a Cen, thus possibly affecting the optical light variability. Wade et al. (2017) discussed presence of pulsations with similar amplitude as that due to distortion. However, their effect on the BRITE curve is rather small, because period of pulsations and rotation are not commensurable and the BRITE light curve was averaged in phase intervals.
| SWP camera | LWR camera | ||||
|---|---|---|---|---|---|
| Image | Julian date | Phase | Image | Julian date | Phase |
| 2,400,000+ | 2,400,000+ | ||||
| 02112 | 43716.20883 | 0.036 | 01901 | 43716.20120 | 0.035 |
| 02168 | 43722.19095 | 0.715 | 01941 | 43722.18401 | 0.714 |
| 02175 | 73723.17280 | 0.826 | 01951 | 43723.16725 | 0.825 |
| 02182 | 43724.14355 | 0.936 | 01965 | 43724.13660 | 0.935 |
| 02199 | 43725.12749 | 0.048 | 01979 | 43725.12194 | 0.047 |
| 02212 | 43726.17045 | 0.166 | 01990 | 43726.16490 | 0.165 |
| 02223 | 43727.12593 | 0.274 | 01998 | 43727.11829 | 0.274 |
| 02240 | 43729.12783 | 0.502 | 02039 | 43731.11237 | 0.727 |
| 02257 | 43731.11793 | 0.727 | 02054 | 43732.77056 | 0.915 |
| 02271 | 43732.77681 | 0.915 | 02089 | 43737.07990 | 0.403 |
| 02287 | 43734.80857 | 0.146 | 02106 | 43739.13249 | 0.636 |
| 02311 | 43737.08615 | 0.404 | |||
| 02330 | 43739.14012 | 0.637 | |||
The light variability is caused by the flux redistribution from short wavelength regions. This results in UV flux variations detected by Molnar (1974) and Sokolov (2012). To test the predicted UV light curves, we extracted large-aperture, low-dispersion IUE spectra of a Cen from the INES archive (Wamsteker et al., 2000, see Table 3) using the SPLAT package (Draper, 2004; Škoda et al., 2014). The comparison of observed and predicted narrow-band UV variations calculated using a Gaussian filter with dispersion of Å is given in Fig. 7. Because the UV variations are dominated by the effect of opacities and the effect of distortion is marginal in the UV domain, we plot only the light curves that account for both surface opacity variations and distortion. The comparison shows that the flux variations agree nicely, with the difference between observations and simulation being comparable to the observational uncertainty.
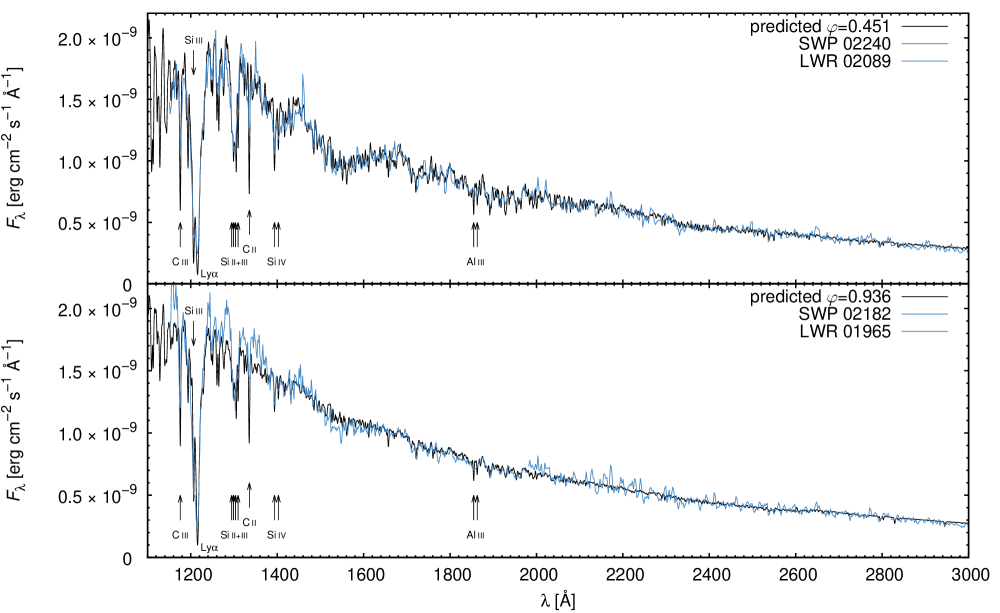
As follows from Fig. 3, light variations in UV are dominated by iron. Near-UV variations with Å are in phase with optical variations (Sokolov, 2012), because iron-rich regions are bright in this wavelength domain (see Fig. 3). On the other hand, iron line absorption is especially important around Å. For the shortest wavelengths observed, around Å, silicon and helium also influence the flux variations. Our calculations agree with the results of Sokolov (2012), who also found that iron, silicon, and additionally carbon determine the flux distribution and its variability in the UV spectral domain of a Cen.
The simulated ultraviolet SED agrees nicely with the observed flux distribution at individual rotational phases (Fig. 8). The flux distribution is plotted for the rotational phases close to the maximum of iron and helium line strength.


4 Conclusions
We studied the effect of an aspherical distorted stellar surface on the observational properties of helium chemically peculiar stars. Helium-rich magnetic chemically peculiar stars show uneven surface distributions of helium. As a result of this, the density scale height varies across the stellar surface. Consequently, helium-rich regions are depressed inwards and show effectively lower local radius and higher effective temperature, keeping the total luminosity constant. From the photometric point of view, helium-rich regions become slightly brighter in the far-ultraviolet region due to the distortion of the stellar surface, while becoming fainter in the near-ultraviolet and optical regions.
We demonstrated the effect of the distorted surface on helium-rich magnetic chemically peculiar star a Cen. We calculated model atmospheres with a chemical composition corresponding to the abundance maps derived using magnetic Doppler imaging of this star. We integrated the emergent flux across the chemically inhomogeneous stellar surface to predict the light variability. We have shown that most of the light variability is due to the redistribution of the flux from far-ultraviolet to the near-ultraviolet and optical regions due to variable blanketing caused by iron line transitions and helium bound-free transitions.
The effect of surface distortion causes additional light variability with amplitudes of the order of millimagnitudes. It contributes to the light variability caused by variable blanketing and leads to improvement of the agreement between predicted and observed light curves in the optical region. However, the modification of the light curve caused by the surface distortion is smaller than the difference between predicted and observed light curves. Consequently, additional effects likely contribute to the observed light curve. The effect of distortion is negligible in the UV region, where the amplitude of the light variability is larger, and where the flux redistribution due to the abundance spots nicely reproduces the observed flux variations.
Although surface distortion is not a dominant effect for the light variability of chemically peculiar stars, it affects photometry with millimagnitude precision. Therefore, it is required to obtain good detailed agreement between simulated and observed light curves of helium rich chemically peculiar stars.
Acknowledgements
The authors thank Drs. L. Huang and J. Silvester for providing us with the surface abundance maps. This work was supported by grant GA ČR 18-05665S. GAW acknowledges Discovery Grant support from the Natural Science and Engineering Research Council (NSERC) of Canada. Based on data collected by the BRITE Constellation satellite mission, designed, built, launched, operated and supported by the Austrian Research Promotion Agency (FFG), the University of Vienna, the Technical University of Graz, the University of Innsbruck, the Canadian Space Agency (CSA), the University of Toronto Institute for Aerospace Studies (UTIAS), the Foundation for Polish Science & Technology (FNiTP MNiSW), and National Science Centre (NCN). Access to computing and storage facilities owned by parties and projects contributing to the National Grid Infrastructure MetaCentrum provided under the program ”Projects of Large Research, Development, and Innovations Infrastructures” (CESNET LM2015042) is greatly appreciated.
References
- Alecian et al. (2011) Alecian, G., Stift, M. J., & Dorfi, E. A. 2011, MNRAS, 418, 986
- Asplund et al. (2009) Asplund M., Grevesse N., Sauval A. J., Scott P., 2009, ARA&A, 47, 481
- Bogomazov & Tutukov (2009) Bogomazov A. I., Tutukov A. V., 2009, ARep, 53, 214
- Bohlender et al. (2010) Bohlender, D.A., Rice, J., B., Hechler, P., 2010, A&A 520, 44
- Borra et al. (1983) Borra, E. F., Landstreet, J. D., & Thompson, I. 1983, ApJS, 53, 151
- Carrier et al. (2002) Carrier F., North P., Udry S., Babel J., 2002, A&A, 394, 151
- Catalano & Leone (1996) Catalano F. A., Leone F., 1996, A&A, 311, 230
- Draper (2004) Draper, P. W. 2004, SPLAT: A Spectral Analysis Tool, Starlink User Note 243 (University of Durham)
- ESA (1997) ESA 1997, The Hipparcos and Tycho Catalogs, SP–1200
- Grunhut et al. (2017) Grunhut, J. H., Wade, G. A., Neiner, C., et al. 2017, MNRAS, 465, 2432
- Hubeny (1988) Hubeny, I. 1988, Comput. Phys. Commun., 52, 103
- Hubeny & Mihalas (2014) Hubeny, I., & Mihalas, D., 2014, Theory of Stellar Atmospheres (Princeton University Press, Princeton)
- Hummer et al. (1993) Hummer D. G., Berrington K. A., Eissner W., Pradhan A. K., Saraph H. E., Tully J. A., 1993, A&A, 279, 298
- Khokhlova et al. (2000) Khokhlova, V. L., Vasilchenko, D. V., Stepanov, V. V., & Romanyuk, I. I. 2000, AstL, 26, 177
- Kochukhov & Bagnulo (2006) Kochukhov O., & Bagnulo S. 2006, A&A, 450, 763
- Kochukhov et al. (2014) Kochukhov O., Lüftinger T., Neiner C., Alecian E., & MiMeS Collaboration 2014, A&A, 565, A83
- Krtička et al. (2007) Krtička, J., Mikulášek, Z., Zverko, J., Žižňovský, J., 2007, A&A, 470, 1089
- Krtička et al. (2012) Krtička, J., Mikulášek, Z., Lüftinger, T. et al. 2012, A&A, 537, A1
- Krtička et al. (2015) Krtička J., Mikulášek Z., Lüftinger T., Jagelka M., 2015, A&A, 576, A82
- Lander & Jones (2017) Lander S. K., Jones D. I., 2017, MNRAS, 467, 4343
- Lanz & Hubeny (2003) Lanz, T., Hubeny, I. 2003, ApJS, 146, 417
- Lanz & Hubeny (2007) Lanz, T., Hubeny, I. 2007, ApJS, 169, 83
- Leone (1998) Leone F., 1998, CoSka, 27, 285
- Leone & Lanzafame (1997) Leone F., Lanzafame A. C., 1997, A&A, 320, 893
- Lüftinger et al. (2010b) Lüftinger, T., Kochukov, O., Ryabchikova, T., et al. 2010, A&A, 509, A71
- Mestel & Takhar (1972) Mestel L., Takhar H. S., 1972, MNRAS, 156, 419
- Michaud et al. (2011) Michaud, G., Richer, J., & Vick, M. 2011, A&A, 534, A18
- Mihalas (1973) Mihalas D., 1973, ApJ, 184, 851
- Mikulášek, et al. (2008) Mikulášek Z., et al., 2008, A&A, 485, 585
- Molnar (1974) Molnar M. R., 1974, ApJ, 187, 531
- Morel et al. (2015) Morel, T., Castro, N., Fossati, L., et al. 2015, New Windows on Massive Stars, 307, 342
- Norris (1971) Norris, J. 1971, ApJS, 23, 235
- Norris & Baschek (1972) Norris J., Baschek B., 1972, A&A, 21, 385
- Oksala et al. (2015) Oksala, M. E., Kochukhov, O., Krtička, J., et al. 2015, MNRAS, 451, 2015
- Paxton et al. (2011) Paxton B., Bildsten, L., Dotter A., et al., 2011, ApJs, 192, 3
- Paxton et al. (2013) Paxton B., Cantiello, M., Arras P., et al., 2013, ApJS, 208, 4
- Pedersen & Thomsen (1977) Pedersen, H., Thomsen, B., 1977, A&AS, 30, 11
- Prvák et al. (2015) Prvák M., Liška J., Krtička J., Mikulášek Z., Lüftinger, T., 2015, A&A, 584, A17
- Seaton et al. (1992) Seaton, M. J., Zeippen, C. J., Tully, J. A., et al. 1992, Rev. Mexicana Astron. Astrofis., 23, 19
- Schneider et al. (2019) Schneider F. R. N., Ohlmann S. T., Podsiadlowski P., Röpke F. K., Balbus S. A., Pakmor R., Springel V., 2019, Natur, 574, 211
- Shultz, et al. (2019) Shultz M., Rivinius T., Das B., Wade G. A., Chandra P., 2019, MNRAS, 486, 5558
- Škoda et al. (2014) Škoda, P., Draper, P. W., Neves, M. C., Andrešič, D., & Jenness, T. 2014, Astronomy and Computing, 7, 108
- Sokolov (2012) Sokolov N. A., 2012, MNRAS, 426, 2819
- Ud-Doula, Owocki & Townsend (2009) Ud-Doula A., Owocki S. P., Townsend R. H. D., 2009, MNRAS, 392, 1022
- Underhill et al. (1975) Underhill, A. B., Fahey, R. P., & Klinglesmith, D. A. 1975, ApJ, 199, 120
- Vauclair et al. (1991) Vauclair, S., Dolez, N., & Gough, D. O. 1991, A&A, 252, 618
- Vick et al. (2010) Vick M., Michaud G., Richer J., Richard O., 2010, A&A, 521, A62
- Wamsteker et al. (2000) Wamsteker, W., Skillen, I., Ponz, J. D., et al. 2000, Ap&SS, 273, 155
- Wade et al. (2016) Wade, G. A., Neiner, C., Alecian, E., et al. 2016, MNRAS, 456, 2
- Wade et al. (2017) Wade G. A., et al., 2017, sbcs.conf, 94
- Weiss et al. (2014) Weiss, W. W., Rucinski, S. M., Moffat, A. F. J., et al. 2014, PASP, 126, 57