From genotypes to organisms: State-of-the-art and perspectives of a cornerstone in evolutionary dynamics
Abstract
Understanding how genotypes map onto phenotypes, fitness, and eventually organisms is arguably the next major missing piece in a fully predictive theory of evolution. We refer to this generally as the problem of the genotype-phenotype map. Though we are still far from achieving a complete picture of these relationships, our current understanding of simpler questions, such as the structure induced in the space of genotypes by sequences mapped to molecular structures, has revealed important facts that deeply affect the dynamical description of evolutionary processes. Empirical evidence supporting the fundamental relevance of features such as phenotypic bias is mounting as well, while the synthesis of conceptual and experimental progress leads to questioning current assumptions on the nature of evolutionary dynamics—cancer progression models or synthetic biology approaches being notable examples. This work delves into a critical and constructive attitude in our current knowledge of how genotypes map onto molecular phenotypes and organismal functions, and discusses theoretical and empirical avenues to broaden and improve this comprehension. As a final goal, this community should aim at deriving an updated picture of evolutionary processes soundly relying on the structural properties of genotype spaces, as revealed by modern techniques of molecular and functional analysis.
keywords:
molecular evolution , genotype-phenotype map , genotype network , fitness landscape , phenotypic bias , experimental evolution1 Introduction
How genetic variation contributes to phenotypic variation is an essential question that must be answered to understand the evolutionary process. The experimental characterisation of the genotype-phenotype (GP) relationship is a formidable theoretical and experimental challenge, but also an expensive task which suffers from severe practical limitations. Computational approaches have been recurrently used to make predictions of phenotypes from genotypes and to uncover the statistical features of that relationship. Advances notwithstanding, an apparently insurmountable problem remains: the astronomically large size of the space of genotypes. The space of possible phenotypic change and the probabilities of such change are directly determined by the architecture of the GP map; to quantify this map will allow better quantification of how the space of phenotypes is explored and answer important questions about the probability of evolutionary rescue or innovation under endogenous or exogenous changes.
Progress in our understanding of GP maps at various levels is of relevance for different scientific communities with interests that range from evolutionary theory to molecular design through genomic bases of disease aetiology. Understanding of how RNA, DNA or amino acid sequences map onto molecular function could be of great importance for more fundamental approaches in synthetic biology, biotechnology, and systems chemistry. In a broader ecological context, the way in which generic properties of the GP map shape adaptation have rarely been explored. As of today, the overarching question of whether organismal phenotypes can be predicted from microscopic properties of genotype spaces remains open.
In this review, we discuss the state-of-the-art of genotype-to-organism research and future research avenues in the field. The review is structured into four major parts. The first part is constituted by this introduction and Section 2, which puts in perspective how relevant the generation of variation is in the evolutionary process, and introduces important biases arising from the inherent structure of genotype spaces.
The second part comprises sections 3 to LABEL:sec:evolutionOFgpmaps, where we discuss conceptual approaches to the static properties of GP maps and their dynamical consequences, as well as the evolution of GP maps themselves. The field is broad and several aspects have been addressed in previous reviews, so we only briefly summarise topics dealt with elsewhere. Therefore, we will succinctly present computational GP maps and only recapitulate, taking an integrative and explanatory viewpoint, the topological properties of the space of genotypes [reidys:1997, stadler:2006, wagner:2011, ahnert:2017, aguirre:2018, nichol:2019]. Section 3 constitutes a synthetic overview of GP map models, including paradigmatic examples such as RNA folding, more recent multi-level models such as toyLIFE, and a summary of artificial life examples. Readers familiar with those models can safely skip that section. Those models endow genotype spaces with topological properties that are briefly reviewed in the introduction of Section 4, which is mostly devoted to discussing possible roots for generic properties of a broad class of GP maps. Attention is subsequently devoted to population dynamics on genotype spaces, which has been a less explored topic. Section 5 describes transient and equilibrium dynamical features of evolutionary processes. First, it delves into the effects of recombination and mutation bias, and on phenotypic transitions caused by the hierarchical, networked structure of genotype spaces. Then, a mean-field description that incorporates the essentials of GP map topology to clarify major dynamical features is discussed. The section finishes with a derivation of equilibrium properties in the context of statistical mechanics and some applied examples. Section LABEL:sec:evolutionOFgpmaps discusses the evolution of GP maps themselves by means of two illustrative examples: a scenario where a multifunctional quasispecies emerges and a model of virtual cells incorporating the evolution of genome size.
The third part, sections LABEL:sec:empirical and LABEL:sec:cancer is devoted to empirical GP maps and to biological applications, and mostly presents topics under development. Section LABEL:sec:empirical examines most recent achievements regarding the experimental characterisation of GP and genotype-to-function maps in molecules and simple organisms, and the different possibilities that current and future techniques might allow. It includes a formal discussion on how phenotypes can be inferred from genotypic data and fitness assays, and a discussion of the intimate relationship between fitness landscapes and GP maps. Section LABEL:sec:cancer exemplifies how concepts and techniques originating in quantitative studies of the GP map can enlighten useful approaches to diseases with a genetic component.
The fourth and last part presents a mostly self-contained overview of open questions and difficulties that the field faces, as well as some possible avenues for further progress, in Section LABEL:sec:perspectives. The paper closes with an outlook in Section LABEL:sec:GOmap where we reflect on the feasibility of characterising the genotype-to-organism map, and on plausible epistemological difficulties to comprehend the organisation and complexity of full organisms.
2 GP maps and the importance of variation
Darwinian evolution requires heritable phenotypic variation, upon which natural selection acts. Much of traditional evolutionary theory has focused on the role of natural selection, while the study of variation has been much less developed. There are a number of reasons for this difference.
Firstly, there is an influential tradition, stemming from the early days of the modern synthesis, that any meaningful change over evolutionary time is ultimately caused by natural selection. One argument in favour of this thesis comes from the simple observation that a heritable phenotype with higher fitness will, over the generations, exponentially out-compete other phenotypes with lower fitness in the same population. Thus, differences in the rate at which mutations arrive will be swamped by the effect of fitness differences (there are much more sophisticated versions of this argument). Another argument, which is often more implicitly than explicitly made, is that a large part of variation is isotropic—in other words, it is not biased in one direction or another. Stephen J. Gould, who was critical of this viewpoint, expresses it as follows: “variation becomes raw material only, an isotropic sphere of potential about the modal form of a species …[only] natural selection …can manufacture substantial, directional change” [gould:2002]. Whether evolutionary trends must primarily be explained by natural selection, or whether anisotropic (biased) variation also plays a key role, is a complex question. While the arguments have moved on considerably since the critique of Gould, especially with the rise of evo-devo [love:2015], they are far from being settled [laland:2014, stoltzfus:2018]. Ever since the modern synthesis, directed variation has been deemed anathema because it evokes the Lamarckian view of variation to facilitate adaptation. However, as the analysis of GP maps reveals, these maps are a major source of anisotropic variation, even if this variation is not necessarily biased in the most beneficial way for the organism.
The second reason why our understanding of variation is relatively underdeveloped is that working out the exact role played by the arrival of variation in evolutionary history is difficult because in nature we typically only observe the final outcomes of an evolutionary process. It is hard to know what variation may have arisen in the past, but not fixed, or what variation could have potentially arisen, but did not. For example, even when all potential variation is isotropic, the non-lethal variation may well be anisotropic, depending on the environment.
In this context, the study of GP maps is critical, because they provide access to the way that changes in genotypes, brought on by various kinds of mutations, are translated into phenotypic variation for the biological system that the map describes. They allow us to ask important counterfactual questions, such as what is the full spectrum of variation that could potentially arise? Working out how variation affects evolutionary outcomes depends on an understanding of such counterfactuals.
A final issue for understanding variation comes from the unfathomable vastness of genotype spaces, whose size grows exponentially with genome length, rapidly leading to hyperastronomical numbers of possibilities [louis:2016]. If these spaces are so unimaginably vast, then it might seem natural to conclude, as many have done, that the variation that appears in evolutionary history is largely contingent upon accidents of history, and unlikely to be repeated (see Ref. [louis:2016] for a discussion).
This problem of hyperastronomically large spaces means that only relatively simple GP maps allow global questions about the full spectrum of possible variation to be addressed. Nevertheless, important progress in this direction has been made through the use of GP maps that can be computationally explored and, more recently, through the development of quantitative approaches to shared generic properties. Among the latter, one of the most striking properties is a strong bias in the number of genotypes mapping to a phenotype [greenbury:2016, ahnert:2017]. This begs the question: Can this bias, which often extends over many orders of magnitude, affect evolutionary outcomes? Indeed, phenotypic bias, among other non-trivial properties of GP maps, does severely affect not only our understanding of how variation arises through random mutations, but also any accurate representation—be it metaphorical or formal—of evolutionary dynamics at large.
3 Models of the GP map
Maynard Smith introduced the notion of a mapping from a genetic space to a molecular structure—and with it the idea of a network linking viable genotypes—as a resolution of an evolutionary paradox pointed out by Salisbury [maynard-smith:1970]. In brief, Salisbury noted [salisbury:1969] that the number of possible amino acid sequences exceeds by many orders of magnitude the number of proteins that ever existed on Earth since the origin of life, and concluded from this fact that functionally effective proteins have a vanishingly small chance of arising by mutation. As a way out of this dilemma, Maynard Smith suggested that the existence of networks of functional proteins are essential to navigate the space of genotypes to produce a sequence of adaptive improvements and to explore new regions that, eventually, secure evolutionary innovation [huynen:1996b]. Formally, the space of genotypes can be defined as a network where nodes represent genotypes, with any two nodes linked if they are mutually accessible through a single point mutation [schuster:1994]. A neutral network is therefore an ensemble of connected genotypes with the same fitness, including those with identical phenotypes. The empirical existence of such networks and their role in providing access to new phenotypes [fontana:1998] was unequivocally demonstrated [koelle:2006, schultes:2000] four decades after Maynard Smith’s conjecture.
Many studies have aimed at probing the statistical structure of the GP relationship, thus relying on the computational exploration of GP maps. Models of RNA secondary structure [hofacker:1994, schuster:1994], protein secondary structures [lipman:1991, irback:2002], gene regulatory networks [wagner:2011, payne:2014a], metabolic networks [barve:2013, hosseini:2015], protein complexes [johnston:2011, greenbury:2014], artificial life [ofria:2004], or multilevel maps such as a toyLIFE, which includes protein structure, regulatory, and metabolic networks [arias:2014, catalan:2018], have been explored through the years. Computational frameworks often rely on building complete GP maps from exhaustive enumeration of genotypes (or sparse GP maps from large samples) in models with simple genotype-to-phenotype rules as the ones above. To study global properties of a GP map, such as phenotype frequencies, a large number of genotype-phenotype pairs have to be evaluated. With notable exceptions [aguilar:2017, rowe:2009, jimenez:2013], some of which will be discussed in section LABEL:sec:empirical of this paper, the exhaustive study of GP maps represents an enormous challenge that has been restricted to systems where the phenotype can be found computationally from the genotypic information.
For the sake of simplicity, most GP computational maps assign a unique phenotype to each genotype, in a many-to-one representation. Some maps also take into account environmental factors such as temperature, which modify GP mapping rules and, therefore, include phenotypic plasticity in a streamlined fashion [wagner:2014]. Other implementations also consider phenotypic promiscuity [jensen:1976, aharoni:2005], that is, the possibility that each sequence maps to more than one phenotype under fixed environmental variables. However, many-to-many GP maps entail an exponentially increasing cost in computation time, so they have been rarely explored in depth (for exceptions see [ancel:2000, barve:2013, wagner:2014, espinosa-soto:2011, deboer:2012, deboer:2014, payne:2014c, rezazadegan:2018, diaz-uriarte:2018]).
Creating complete computational frameworks for GP models is a challenge—building complete GP maps for sequences as long as functional molecules in realistic environments is beyond our current computational power. Nevertheless, progress has been steady and significant. For example, and despite the freedom inherent to any definition of phenotype, many generalities have emerged from studying these models, and theoretical arguments to explain some of them have been developed [greenbury:2015, manrubia:2017, garcia-martin:2018]. These studies have led to a relatively sound understanding of the conditions that are behind different phenotype abundances, its relationship with robustness, and the topology of neutral networks [greenbury:2016, aguirre:2009, aguirre:2011].
In this section, we begin by briefly summarising a variety of GP maps that have been computationally studied to date. Some attention is devoted to RNA, a model for which we examine in perspective some of the important lessons learnt and discuss possible future contributions to GP map research. There is a substantial body of literature available, including comprehensive reviews [schuster:2006] that we do not even attempt to summarise here. We finish this part discussing the GP maps of artificial life systems.
We would like to remark that, while we focus here on sequence-to-structure and sequence-to-function maps, it is important to highlight that genotype-phenotype and genotype-fitness maps have also been studied in the context of development [salazar-ciudad:2010, salazar-ciudad:2013, hagolani:2021].
3.1 One-level GP models
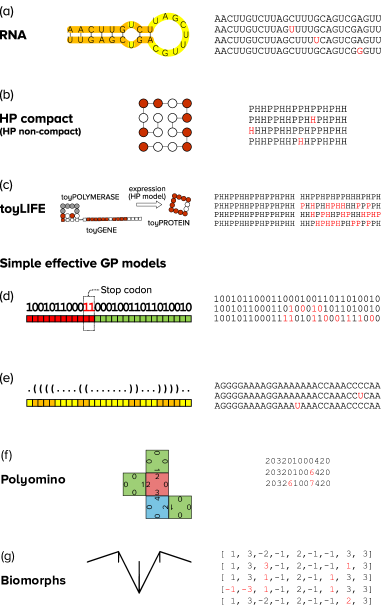
Over the past three decades, the GP maps of several simple biological model systems have been studied in great detail. Figure 1 summarises the essentials of some of the GP maps we will be discussing. Two classical examples are RNA secondary structure [hofacker:1994, schuster:1994] and the HP model of protein folding [lipman:1991, li:1996]. The HP model represents proteins on a regular lattice as self-avoiding chains of hydrophobic (H) or polar (P) beads. In its compact version the chains are forced to fold into rectangular configurations that leave no empty sites, while in the non-compact version all possible self-avoiding walks in the lattice are considered. The phenotype is defined as the minimum energy of a given configuration calculated from a contact potential between neighbouring (but not in the backbone) beads. Because RNA and HP models are relatively tractable, properties such as the distribution of the number of genotypes per phenotype [stich:2008, louis:2016, shahrezaei:1999], the phenotypic robustness and evolvability [wagner:2007, holzgrafe:2011] (see Box 3.1) or the topological structure of neutral networks [aguirre:2011] could be systematically studied and compared [ferrada:2012].
Given the pivotal role proteins play in cellular processes, the protein sequence-to-structure map, of which the HP model constitutes the simplest realisation, is of great general interest [shakhnovich:2006, ciliberti:2007b, chen:2008]. The protein sequence-to-structure map has been also studied using more realistic, multi-parametric contact potentials [mirny:1996, buchler:1999, li:2002, bastolla:2003] and coarse-grained models at different levels, such as the Polyomino model [johnston:2011, greenbury:2014] for protein complexes. Some inferences about local and global properties of the protein sequence-to-structure-to-function GP map have also been made from experimental data [sarkisyan:2016, ferrada:2008, ferrada:2010], and estimates of neutral set sizes (NSSs) have been obtained from structural data [england:2003].
Breakthroughs in the computational prediction of protein structure from amino acid sequence have recently been achieve by deep learning with artificial neural networks. The AlphaFold 2 system by DeepMind [callaway:2020] outperformed 100 other teams in the 2020 Critical Assessment of Structure Prediction challenge (CASP13), with prediction accuracy rivaling that of experimental structure determination. Enormous resources are required for each evaluation, however, taking days of real time computational for a single protein sequence. If subsequent development can maintain the accuracy while allowing exponential speedups, these computational systems should be able to open up entirely new investigations of the GP map for proteins.
[frametitle= Box 3.1a. Definitions]
- Function
-
Function is a contentious term [graur:2013, kellis:2014] that is used to mean many things. In this review we are mostly referring to properties of proteins, such as stability, catalytic activity, and binding affinity.
- Genetic correlations
-
A GP map has this property if two sequences differing at a single site are more likely to generate the same phenotype than two arbitrary sequences [greenbury:2016].
- Genotype network
-
A set of mutually connected genotypes that have the same phenotype. This term is usually employed as a synonym of neutral network, although in some context a genotype network needs not be neutral—for instance, in the case of GP maps with both a categorical phenotype (e.g. molecular structure) as well as a quantitative fitness (e.g. thermodynamic stability of the structure).
- Genotypic evolvability
-
Total number of distinct alternative phenotypes that can be reached through point mutations from a single genotype [wagner:2007].
- Genotypic robustness
-
Number of point mutations that do not change the phenotype of a specific genotype. It is analogous to the neutrality of a genotype.
- Navigability
-
Ability to navigate throughout genotype space via neutral mutations.
- Neutral network
-
A set of mutationally connected genotypes that have the same fitness, including those that have the same phenotype. Often, it refers to the largest connected component of a neutral set.
- Neutral set
-
A set of genotypes which have the same fitness, including those that have the same phenotype. The neutral set size is therefore the number of genotypes that map to a given phenotype.
- Organism
-
Any individual entity that embodies the properties of life, like a cell, an animal, or a plant. It is a synonym for “life form”. By extension, it also applies to artificial life forms.
- Phenotype
-
A property which is encoded in the genotype and is biologically relevant, for example a molecular structure. Though abstract, this broad definition allows a variety of models to be treated with the same terminology.
- Phenotypic robustness
-
Average genotypic robustness of all genotypes in a neutral network [wagner:2007].
- Phenotypic evolvability
-
Total number of distinct alternative phenotypes that can be reached through point mutations from a phenotype’s neutral network [wagner:2007].
- Plasticity
-
Quality of a genotype leading to the production of more than one phenotype depending on the environment [rezazadegan:2018].
- Promiscuity
-
Quality of a genotype leading to the production of more than one phenotype in the same environment.
- Quasispecies
-
Population structure with a large numbers of variant genomes related by mutations. Quasispecies typically arise under high mutation rates as possible mutants change in relative frequency as replication and selection proceeds [domingo:2019].
- Shape-space-covering
-
A GP map has the shape space covering property if, given a phenotype, only a small radius around a sequence encoding that phenotype needs to be explored in order to find the most common phenotypes [schuster:1994].
- Versatility
-
A quantitative measure of the rescaled robustness of a specific sequence position [garcia-martin:2018].
[frametitle= Box 3.1b. Acronyms]
- CPMs
-
Cancer progression models
- DAG
-
Directed acyclic graph
- FACS
-
Fluorescence-activated cell sorting
- FPGA
-
Field-programmable gate array
- GP
-
Genotype-to-phenotype
- MAVEs
-
Multiplexed assays for variant effects
- MFE
-
Minimum free energy
- MPRAs
-
Massively parallel reporter assays
- NSS
-
Neutral set size
- OLS
-
Oligo(nucleotide) library synthesis
- SCRaMbLE
-
Synthetic Chromosome Recombination and Modification by LoxP-mediated Evolution
A number of models work at levels above sequences. Simple gene regulatory networks act as effective genotypes in models that map them onto phenotypes defined as the steady-state gene expression pattern [wagner:2003, ciliberti:2007]. A metabolic genotype is defined as all chemical reactions an organism can catalyse via enzymes encoded in its genome; the phenotype is defined as viability in minimal chemical environments that differ in their sole carbon sources [matias-rodrigues:2009, samal:2010]. Those two models share the property that most genotypes do not map to any functional phenotype—it has been put forward that such a restrictive relationship may stem from a minimisation of the cost incurred by maintaining a complex functional network [leclerc:2008]. However, genotype spaces where function is sparse still contain large neutral networks that percolate that space and guarantee phenotypic innovation without loss of function [ciliberti:2007, matias-rodrigues:2009, barve:2013].
There are compact [catalan:2018] and non-compact [holzgrafe:2011] versions of the HP model with an overwhelming majority of non-functional genotypes where neutral networks are very small and mostly disconnected; therefore, innovation is severely hindered, if not plainly impossible, in those one-level maps. However, that lack of navigability turns out to be irrelevant if additional, higher levels, are taken into account.
3.2 Multi-level GP models
Most computational GP maps studied to date, including those discussed in the previous section, only include one level (or scale) of description, mapping genotypes of different kinds to their corresponding phenotypes (see, however, [serohijos:2014]). But even the simplest organisms include more than one level: RNAs and proteins will perform enzymatic and regulatory reactions that will in turn affect the availability of other molecules inside and outside the cell. If the study of one-level GP maps has led to great changes in our understanding of evolutionary theory, it stands to reason that studying multi-level GP maps will yield equally important insights.
It has been shown that multilevel models endowed with biophysically realistic interaction rules lead to the emergence of complex fitness landscapes that permit multiple, equally successful, evolutionary pathways [heo:2008, heo:2011] or the growth of organismal population size when protein-based, functional genotypes are discovered through evolution [zeldovich:2007_PLoSCB]. Recent proposals for multilevel models are the model of RNA-based virtual cells discussed in Section LABEL:sec:VirtualCells, a model of developmental spatial patterning [khatri:2009, khatri:2019] (see Section 5.5), and toyLIFE [arias:2014, catalan:2018]. toyLIFE is a multi-level model that includes genes, proteins and metabolites, as well as their regulatory and metabolic interactions. toyGenes consist of binary sequences (the genotype) that are first mapped to HP-like proteins. None of these proteins can be obtained from any other through single-point mutations. Proteins interact between themselves, with the genome, and with metabolites. The phenotype is defined by the set of metabolites that a given sequence is able to catabolise. In its three-gene version, phenotype is mostly defined through the first two genes, which admit very few mutations, while the third gene is essentially free to mutate, thus restoring evolvability to the system. Additionally, the existence of promiscuous sequences further enhances navigability when environmental factors such as temperature are considered [catalan:2017tesis]. Promiscuity was recognised long ago as a key property in adaptive processes [jensen:1976] that, as of yet, has not been explored in most GP maps.
One of the most interesting results to come out of an early exploration of toyLIFE’s metabolic GP map is that adding levels of complexity to a phenotypic definition actually increases robustness [catalan:2018]: proteins can change and become non-functional, and regulatory functions can be altered, while the overall metabolic function remains constant. This suggests that the potential for cells to evolve toward new evolutionary challenges has been significantly underestimated in the past.
3.3 RNA
RNA is the most paradigmatic model for studying GP relationships and constructing GP maps [schuster:1994, fontana:1993, schultes:2005, wagner:2005, smit:2006, cowperthwaite:2008, jorg:2008, stich:2011, aguirre:2011, schaper:2014, dingle:2015, garcia-martin:2018]. Two major breakthroughs behind its popularity were the development of empirically based energy models—of which the most widespread is the Turner nearest neighbour energy model [mathews:1999]—, and two fast dynamic programming algorithms to determine the minimum free energy (MFE) secondary structure [zuker:1981] and to compute the partition function [mccaskill:1990] of a sequence. In general, a sequence can fold into a number of secondary structures and the energy models and dynamic programming algorithms have made it possible to select low-energy structures [wuchty:1999], quantify their free energies [lorenz:2011] and use this to define a GP map in several ways: one GP map definition considers a single structure per sequence, usually the minimum-free-energy structure [schuster:1994]. This will lead to a many-to-one GP map, where each sequence maps to a single structure, but each structure can be generated by a number of different sequences. An alternative definition allows several low-free-energy structures per sequence, which leads to a more complex many-to-many relationship. Together, these different studies defined a range of formal measures to quantify some of the key features of GP relationships, such as plasticity, evolvability, robustness and modularity [ancel:2000]. The results obtained with RNA through the years have served as inspiration and guide to our intuition when faced with other GP maps.
3.3.1 Phenotypic bias in RNA
We will start by reviewing results from the commonly studied many-to-one GP map, where the focus is solely on the predicted minimum-free-energy structure of each sequence. The largest exhaustive enumeration performed for RNA sequences, of length , yielded 10 orders of magnitude difference in the number of genotypes mapping from the most rare to the most frequent secondary structure phenotypes [schaper:2014]. Approximate calculations of NSSs for longer sequences [dingle:2015, garcia-martin:2018] show that this variance grows rapidly with increasing length. For example, for this difference is expected to be over 50 orders of magnitude: these maps are extremely biased. In an important study [jorg:2008] the NSSs for longer length RNA were calculated using a sampling technique. When comparing to structures in the fRNAdb database for functional non-coding RNA (ncRNA) [kin:2007], they found, for systems of lengths to , that the natural RNA secondary structures were typically among those with larger NSS. These results suggested that the strong bias in the GP map was reflected in the secondary structures found in nature.
Another interesting set of studies compared structural features (e.g. distributions of stack and loop sizes) of natural secondary structures and those obtained when randomly sampling over sequences. They found that many are quite similar [fontana:1993], and that natural and random RNA share strong similarities in the sequence nucleotide composition of secondary structure motifs such as stems, loops, and bulges [smit:2006]. Why should random sampling over sequences generate distributions that are so similar to natural RNA, where natural selection would normally be thought to play an important role?
The study of much larger datasets of natural RNA from the fRNAdb database—and for lengths ranging from to —demonstrated that the distributions of various structural features, and also properties such as the genotypic robustness, are very close to those obtained by random sampling over genotypes [dingle:2015]. Furthermore, the distribution of NSS for natural RNA was found to closely follow the NSS distribution that arises upon random sampling of phenotypes. If one were to simply randomly sample over phenotypes, very significant differences with random genotype sampling (and natural RNA) would be found. By working out these counterfactuals it was therefore possible to demonstrate that the way in which variation arises through a GP map is dramatically different from the naive expectation that all potential variation is equally likely.
The close agreement of the distributions found in nature and those found by random sampling of genotypes via the GP map is very surprising given that natural selection is expected to be an important factor in the process that allows a particular functional RNA to fix in a population. The fact that its effect is not really visible for the properties above, at least when compared to a null model of random sampling genotypes, would appear to be strong evidence for the importance of anisotropic variation in determining evolutionary outcomes. However, before this conclusion can be drawn, it is important to remember that evolution does not proceed by random sampling of genotypes. Instead, it typically starts with a particular genotype and phenotype, and alters it via mutations that in turn generate new phenotypes that are either fixed or disappear over the generations in evolving populations. Given the hyper-astronomically large size of these spaces, it is not clear that such a local search should be at all similar to the results of random sampling of genotypes, which is a global property that does not depend on the starting point in genotype space.
Still, a counterexample of natural RNA where selection seems to have played a visible effect is that of viroids. Viroids are small, non-coding, circular RNA molecules that infect plants [diener:1971]. Viroids have compact secondary structures that constrain their evolution [elena:2009] and whose preservation seems essential to avoid degradation and inactivation [diserio:2017], and to minimise the effect of deleterious mutations [sanjuan:2006:MBEI, sanjuan:2006:MBEII]. Viroids bear a number of paired nucleotides well above random expectations [cuesta:2017], such that the estimated NSSs of typical viroids are significantly below those of random sequences. For example, a typical structure for a circular RNA of length 399 has an average of 230 paired nucleotides and about compatible sequences. However, the largest known viroid is Chrysanthemum chlorotic mottle viroid, which matches that length, but has 280 paired nucleotides and an NSS of about genotypes [catalan:2019a].
3.3.2 Promiscuity in RNA
Beyond the many-to-one GP map, many-to-many GP maps that take into account the MFE structure and suboptimal structures in the Boltzmann ensemble have been studied [ancel:2000, wagner:2014, rezazadegan:2018]. Suboptimal structures can be included according to several criteria: either all structures which fall within a fixed free energy range from the MFE structure [ancel:2000, wagner:2014] are considered or only structures which have the same free energy as the MFE structure up to the energy resolution of the computational model [rezazadegan:2018]. First, a link was found between the suboptimal phenotypes of a sequence in the many-to-many GP map and the phenotypes in the mutational neighbourhood of the same sequence in the corresponding many-to-one GP map [ancel:2000]. Secondly, genotypes with low promiscuity were shown to have MFE structures with higher modularity [ancel:2000]. Finally, it was found that evolving populations encounter a higher number of phenotypes if suboptimal phenotypes are included [wagner:2014]. Altogether, these observations point to the important adaptive role of molecular promiscuity by supplying alternative phenotypes in the absence of mutations, and so redefining the fitness landscape [aguirre:2018].
3.3.3 Hints from RNA inverse folding algorithms
The characterisation of functional phenotypes by designing sequences that fold into a given RNA secondary structure has been much less explored than the direct fold of given sequences. Finding sequences that yield a particular secondary structure is known as the RNA inverse folding problem. This is an NP-complete problem even for the MFE structure [schnall-levin:2008], hence a very demanding computational task. As a consequence, most approaches are based on local search algorithms [churkin:2017]. Actually, RNA inverse folding algorithms are mostly intended for synthetic design, though they have occasionally been used to investigate GP relationships [wagner:2007, borenstein:2006]. However, their use is controversial due to the intrinsic bias of the underlying local search algorithms [szollosi:2009], which are not complete by definition and therefore produce biased samples under multiple runs. This caveat notwithstanding, there are some inverse folding methodologies that appear more suitable for this purpose.
The first method is a soft inverse folding approach which implements a dynamic programming algorithm to compute the RNA dual partition function [garcia-martin:2016b]. This partition function is defined as the sum of Boltzmann factors , where is the energy of the RNA nucleotide sequence compatible with a target structure , and the absolute temperature (in units of energy). An energy weighted sampling from the low energy ensemble of sequences that are compatible with the given secondary structure is performed to calculate this partition function. While this approach is not particularly practical for synthetic design, it provides insights into molecular evolution.
This theoretical abstraction and the measures derived from it, such as the expected dual energy, can provide useful information about general properties of the phenotypes without exploring the whole genotype space. Computational analyses based on the nearest neighbour energy model over all the RNA sequences in the Rfam database [kalvari:2018] indicate that natural RNAs fold into secondary structures with energy higher than expected for sequences with the same length and GC content. Possible explanations for this observation are either that functional RNAs are not under evolutionary pressure to be highly thermodynamically stable or that sequence requirements prevent reaching minimum folding energies. On the other hand, experimental studies confirm that even random sequences frequently acquire compact folds similar to those of natural RNAs. Empirical observations further indicate that natural selection could be a determinant factor to achieve unique, stable tertiary folds—i.e. without major competing phenotypes—under natural conditions [schultes:2005]. Besides, the controlled bias in this sampling methodology provides a delimited context to evaluate the properties that characterise a functional RNA with respect to sequences with similar structure. Simulations using this approach indicate that bacterial ncRNAs are more plastic and less robust than other sequences with similar structure [garcia-martin:2016b].
Although the samples returned by this algorithm are representative of the low energy ensemble of sequences of the given structure, the MFE structure of individual sequences is not necessarily the target structure. However, the proportion of alternative MFE structures of the sampled sequences is the distribution of competing phenotypes in the low energy ensemble of the target structure, which can in turn be interpreted as an estimate of the structures that are likely to coexist with that phenotype in a many-to-many GP map.
Similar algorithms for computing and sampling from the RNA dual partition function with additional constraints have been developed and used to determine the neutral path between sequences in the same phenotype [barrett:2018].
The second methodology is complete inverse folding based on constraint programming [garcia-martin:2013]. The constraint programming paradigm avoids exploring the whole sequence space when structural, sequence or environmental restrictions are included. These restrictions comprise, among many others, GC content, sequence motifs, multiple local and global structures and folding temperatures. Rather than slowing down the search, each constraint increases the speed of this algorithm. This algorithm can potentially retrieve all sequences that meet the requirements or conclude that no solution exists. In practice, the running time depends on the sequence space defined by the given constraints. These features make it appropriate for the study of genotype-phenotype-function relationships of moderately small functional RNAs with known moieties, or of regulatory RNA elements like riboswitches and thermoswitches.
Some examples of the performance of complete inverse folding based on constraint programming are the computationally-based suggestion that the conserved GUH (no G) motif in the hammerhead ribozyme type III cleavage site of Peach latent mosaic viroid is due to structural, rather than functional, requirements [dotu:2014], or that natural thermoswitches do not seem to be optimised to maximise the probability difference between the active and inactive structures at the corresponding folding temperatures [garcia-martin:2016a].
3.4 Artificial life
Evolutionary processes have not only been studied in biology, but also in man-made systems. Some models were designed to simulate biological evolution computationally and mimic biological properties. A widely used example is the digital model of a biological organism called Avida [ofria:2004]. Avida organisms are pieces of code which can self-replicate and evolve towards optimal usage of computational resources. Richard Dawkins introduced a different form of artificial life to study evolution: biomorphs [dawkins:2003] are two-dimensional stick figures produced recursively from a genotype, which consists of nine integer numbers. These biomorphs resemble abstract animal or plant shapes. Lindenmayer systems are another famous recursive model which can produce plant-like figures [lindenmayer:1968a, lindenmayer:1968b]. These model systems are abstractions of biological organisms, but they all imitate properties of biological systems: the recursive branching rules in Lindenmayer’s systems and later in Dawkins’ biomorphs were inspired by plant development, whereas Avida digital organisms have a metabolism and compete, just like bacteria [ofria:2004, lindenmayer:1968b, dawkins:2003]. However, evolutionary principles have been applied even more generally: the study of programmable electronic hardware has been addressed using the GP framework [raman:2011]. Circuit configurations were treated as genotypes and the function which a circuit computes as the corresponding phenotype.
Here we will focus on results for four artificial life models: Avida organisms [fortuna:2017], biomorphs [dawkins:2003, martin:2020], the 2PD0L model [lehre:2005, lehre:2007], which is based on Lindenmayer’s systems, and FPGAs [raman:2011], a type of programmable electronic circuits. These studies have focused on different properties, which makes a direct and quantitative comparison difficult. However, similarities between these artificial life GP maps and molecular sequence-to-structure GP maps exist [fortuna:2017, lehre:2005, lehre:2007, raman:2011]: first, in three of these four systems the number of genotypes mapping to a given phenotype was estimated and found to vary significantly between phenotypes [fortuna:2017, raman:2011, martin:2020]. For the fourth model a related quantity, the neutral set diameter, was also found to differ between phenotypes [lehre:2007]. Such a heterogeneity, or phenotypic bias, in the distribution of genotypes over phenotypes has long been observed in molecular structure GP maps [schuster:1994, li:1996]. Second, a high degree of genotypic robustness was observed, which enables the formation of neutral networks [fortuna:2017, raman:2011, lehre:2007, martin:2020]. This property was also first found in molecular structure GP maps [lipman:1991] and is referred to as genetic correlations [greenbury:2016]. A third shared property follows from the vastly different NSS: the probability of transitioning from a larger to a chosen smaller neutral set by point mutations is much smaller than that in the reverse direction. This asymmetry is known from molecular structure GP maps [fontana:1998b] and has been confirmed for two of the artificial life GP maps: Avida [fortuna:2017] and the 2PD0L model [lehre:2005].
In addition to these shared properties, there are points in which the various artificial life systems differ. In Avida, a high fraction of genotypes is considered inviable because the organisms are unable to reproduce [fortuna:2017], whereas in the biomorphs system all genotypes produce well-defined drawings and all stick figures are viable until an external decision is made about the fitness of specific shapes. In molecular GP maps the fraction of viable genotypes also depends on the system: in studies of model proteins, a large fraction of genotypes does not fold into a unique structure and is considered unstable, whereas for RNA secondary structure a minimum free energy structure is found for most sequences [ferrada:2012]. Further comparisons could be made once quantities defined for GP maps, such as phenotypic robustness and evolvability, NSS, and mean-field mutation probabilities, are evaluated consistently for all of these and further artificial life models. Commonalities between artificial life and molecular structure GP maps dominate the picture at present, but future research may also identify differences between these two groups of models.
4 The universal topology of genotype spaces
Some of the results highlighted in the former section hint at the possibility that any sensible GP map (and, by extension, artificial life system) is characterised by a generic set of structural properties that appear repeatedly, with small quantitative variations, regardless the specifics of each map. Extensive research performed in recent years has confirmed this possibility to an unexpected degree.
Some of the commonalities documented are navigability, as reflected in the ubiquitous existence of large neutral networks for common phenotypes that span the whole space of genotypes, a negative correlation between genotypic evolvability and genotypic robustness, a positive correlation between phenotypic evolvability and phenotypic robustness, a linear growth of phenotypic robustness with the logarithm of the NSS, or a near lognormal distribution of the latter. There are recent and comprehensive reviews of the properties measured and shared by different GP maps [reidys:1997, stadler:2006, wagner:2011, ahnert:2017, aguirre:2018, nichol:2019]. In the following sections, we discuss new views on the plausible roots of this seemingly universal class of GP maps.
4.1 Possible roots of universality in GP maps
The question obviously arises: Why are structural properties of GP maps unaltered by the details of the mapping? Part of the answer must lie in the topology of the very high dimensional spaces governing the relationship between genotypes and phenotypes. Our intuitions often fail us here because these spaces are highly interconnected. Although their volumes grow exponentially with sequence length, distances are linear. For example, if one made every RNA of length , the molecules would weigh more than the Earth [louis:2016]. Yet none of those strands is more than 79 point mutations away from any other.
One way this interconnection manifests itself is through the property of shape-space covering, a term first introduced for GP maps in the RNA context [schuster:1994], and borrowed from its original use in immunology [perelson:1979]. It captures the fact that many phenotypes are only a handful of mutations away from one another. While this property has been best studied in the secondary structure RNA GP map, it has also been shown to be present in the HP model [bornberg-bauer:1999, ferrada:2012], toyLIFE [catalan:2018], the polyominoes [greenbury:2014], and a model of gene expression [khatri:2009] (where it is described as ergodicity of phenotypic exploration). Shape-space covering suggests that no matter where you start, many other phenotypes are in principle close by in terms of Hamming distance. In the cases above, this holds even if the search begins in an arbitrary genotype. In GP maps where function is sparse in genotype space [ciliberti:2007, matias-rodrigues:2009, barve:2013], phenotypes are still close to each other, but links are established through a limited number of genotypes that might take a long time to find through random walks on the neutral network.
4.2 Constrained and unconstrained sequence positions. Formalising neutrality and evolvability
The intuitions above have received quantitative support from analytically tractable, streamlined GP maps which aim to capture the essentials of generic GP map features. These models, the results attained and the clues they provide are summarised in this section, which might appear slightly technical to the non-familiar reader but clarifies possible constructive principles of evolutionarily apt GP maps.
Highly simplified, abstract GP maps can reproduce many of the generic properties discussed [greenbury:2015, weiss:2018]. These simplified maps hint at two major possible causes underlying structural universality: (i) the partition of sequence regions into constrained and unconstrained parts and (ii) non-local interdependence of sequence positions with regard to their constraints (as sketched in Fig. 1 (d,e)). Let us illustrate how to derive general results with a simple example. Consider a sequence of length whose first positions are fully constrained (changing any of those positions amounts to changing the phenotype) and the remaining positions are neutral (changes do not affect phenotype). If every position in the sequence admits possible values ( for a binary alphabet, formed for example by symbols and in quaternary alphabets, as A, C, G, U), then there are different phenotypes for every value of , each of size . Using a rank-ordering of the sizes of phenotypes and some simple algebra, it is easy to conclude that the probability that a phenotype has size is , with [manrubia:2017]. If the restriction of a position being fully constrained or neutral is relaxed, different values of the exponent can be obtained. The exponent also changes if a stop codon (equivalent to considering an -dependent amount of lethal mutations) is introduced [greenbury:2015].
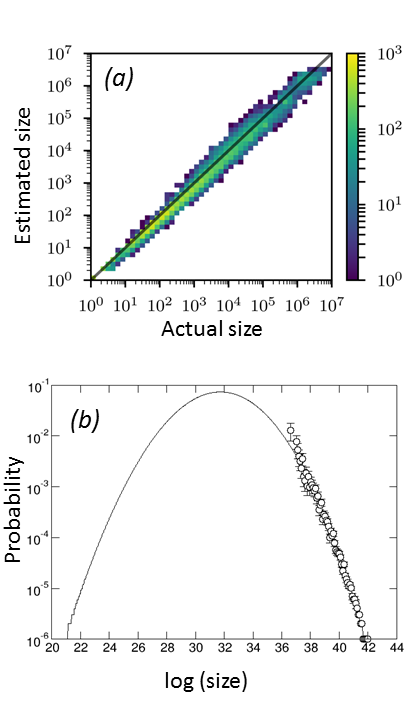
Interestingly, the shape of the distribution changes to a lognormal function if, in the examples above, constrained sites can be arbitrarily distributed along the sequence. In general, the positions of a sequence are neither constrained nor neutral, but versatile in varying degrees. Let us define the versatility of position in a sequence as the average number of alphabet letters at that site that do not modify the phenotype. This extends the ideas above and provides a simple estimation of neutral set size , as . This estimated value has been shown to be a very good approximation to the NSS in several GP models such as RNA, HP and toyLIFE [garcia-martin:2018] (Fig. 2a). In all those cases and several others, the distribution is compatible with a lognormal, which can be analytically derived under very generic assumptions in the case of RNA [manrubia:2017] (Fig. 2b). Moreover, the results suggest that this approximation can be extrapolated to larger sizes. Additional properties, such as genotypic and phenotypic robustness, can be analytically obtained in such effective models [greenbury:2015], which constitute a sound first step towards deriving a formal theory of genotype spaces and their universal properties.
Generic biological sequences display the characteristics above in almost every biological context: exons and introns correspond to constrained and unconstrained regions, as do genes and noncoding intergenic sequences. Start and stop codons as well as interactions between transcription factors and their targets are examples of the interdependence of one sequence region on the constraint of another. As a result it is likely that the same GP map properties we observe in abstract model systems also hold for much more complex and biologically realistic phenotypes. The challenge in these more complex GP maps, however, is the vast size of the genotype space. A protein of 300 residues has a sequence space of size 20. Approaches that can estimate the structural properties of a GP map from relatively small samples are therefore essential. Knowledge of these properties is not just interesting for the study of GP maps, but also has potentially useful applications [dingle:2015]. Being able to measure properties such as the phenotypic robustness, evolvability, and neutral network size of phenotypes in more complex GP maps would therefore provide a powerful methodological tool for the prediction of evolutionary pathways. The division of sequences into constrained and unconstrained regions is also likely to make prediction of structural GP map properties from local samples easier. This is because a division of sequences into constrained and unconstrained regions implies that many sequence positions are largely independent of each other with regard to their phenotypic effect. While important interdependencies remain, which particularly affect evolvability, the fact that interdependent sequence positions are likely to constitute a relatively small fraction of the total sequence means that a sampling approach is feasible for the purpose of estimating neutral network sizes and phenotypic robustness.
5 Evolutionary dynamics on genotype spaces
In the previous sections we have discussed the static properties of genotype spaces, their plausible universality and some basic principles that may underlie their topology. Such findings are relevant by themselves, but a further aim is to uncover the consequences of genotype space architecture in evolutionary dynamics. Evolution can be pictured as the navigation on the space of all possible genotypes [maynard-smith:1970], and GP maps describe the way different phenotypes are organised in such a space [alberch:1991]. This organisation and the intrinsic structure of GP maps affects, among others, the ability to find genotypes and phenotypes in evolutionary searches [schaper:2014, cowperthwaite:2008], as well as the rate of adaptation [draghi:2010, manrubia:2015].
Early studies of dynamics on neutral networks quantified the trend of populations to maximise genotypic robustness by demonstrating that mutation-selection equilibrium is solely determined by the network topology [nimwegen:1999]. Still, the time to reach equilibrium is an inverse function of the mutation rate [aguirre:2009]. Neutral networks in GP maps, as well as in a few instances where this property could be quantified, are assortative [aguirre:2011]: the neutrality of genotypes one mutation away from each other is positively correlated. As a result, the dynamics is naturally canalised towards maximally connected regions [ancel:2000], resulting in an acceleration in the rate of accumulation of neutral mutations with time [manrubia:2015].
In more recent analyses, attention has turned towards the effect of phenotypic bias in adaptation, as we have already discussed by means of enlightening studies with RNA. The question has been also investigated using a modified version of toyLIFE to model pattern-formation in regulatory networks [catalan:2017tesis, catalan:2020] aimed at finding out how evolution chooses between two a priori equally fit phenotypes. It turns out that evolutionary dynamics at the phenotypic level cannot be well described by a Markovian process between phenotypes [manrubia:2015], because of the nontrivial topology of each phenotype’s neutral network [aguirre:2018]. As a matter of fact, the escape time from one phenotype does not follow an exponential distribution, as most evolutionary models assume. This is one instance of the so-called phenotypic entrapment [manrubia:2015], in which the trend of populations to become trapped in increasingly robust regions of a phenotype neutral network results in a long-tailed distribution of escape times: either the population escapes very fast, or takes a very long time to do it.
Accounts of evolution on neutral networks driven by point mutations and the corresponding mathematical formalism can be found elsewhere [wilke:2001BMB, reidys:2001, aguirre:2018], though some essentials will be also described here. In this section we will mainly discuss the effects of a largely disregarded but essential evolutionary mechanism (recombination) and how mutational bias affects isotropic searches.
We continue with evolutionary dynamics on genotype and phenotype networks defined by point mutations, where if we make an ergodic assumption that all typical phenotypes are locally accessible we are led in a natural manner to the formulation of the statistical mechanics of phenotypic evolution. We close by discussing a number of applications where these ergodic assumptions are most appropriate.
The approaches in this section differ in the formalism used (complex networks at large, mean-field effective models and statistical mechanics) but all converge in the main emerging lesson: the size of a phenotype plays a role in evolution comparable to that of fitness. Quantification of their relative weight through formal approaches might eventually settle the false dichotomy between neutralism and adaptationism.
5.1 Robustness and recombination
Genotypic robustness is a property of the GP map that quantifies to what extent functional genotypes can be maintained in the presence of random mutations [visser:2003, lenski:2006, masel:2010, wagner:2005]. Specifically, consider a genotype encoded by a sequence of length that admits a total of single point mutations (recall that is the size of the alphabet). Genotypes are classified to be either viable (functional) or lethal (non-functional). Then the genotypic robustness of a viable genotype is defined as the fraction of mutations that maintain viability [chen:2009], , where is the number of viable mutational neighbours. The population-averaged robustness is correspondingly defined as
| (1) |
where denotes the set of viable genotypes and is the stationary frequency of genotype . Two limiting cases are of particular interest. If the product of population size and mutation rate per individual and generation is small, , the population is monomorphic and performs a random walk on the network of viable states. The stationary frequency distribution is then uniform and (1) reduces to
| (2) |
where is the number of viable genotypes. On the other hand, when , the stationary frequency distribution is determined by mutation-selection balance and can be shown to be given by the leading eigenvector of the adjacency matrix of the network of viable genotypes [bornberg-bauer:1999, nimwegen:1999], see also Section 5.3. The population robustness is related to the corresponding eigenvalue and exceeds the uniform robustness whenever the network is inhomogeneous. This implies that selection in large populations increases robustness by focusing the population in highly connected regions of the network.
Numerical studies of recombining populations on various types of genotype networks have indicated that recombination enhances the focusing effect of selection and thus substantially increases genotypic robustness [azevedo:2006, hu:2014, huynen:1994, singhal:2019, szollosi:2008, xia:2002]. Recently, a systematic and largely analytic investigation of the relationship between recombination and genotypic robustness within the framework of deterministic mutation-selection-recombination models has been presented [klug:2019].
As a simple but informative example, consider the space of binary sequences endowed with a ‘mesa’ landscape where genotypes carrying up to 1’s are viable and all others are lethal [wolff:2009]. The genotypes on the brink of the mesa carry exactly mutations and have robustness , whereas all others have robustness . Combinatorial considerations show that the uniform robustness for large and , reflecting the fact that a large fraction of genotypes are located at the brink for purely entropic reasons. The maximal robustness that can be achieved through selection alone is [wolff:2009]
| (3) |
which exceeds but is small compared to unity when . Thus selection only partly counteracts the entropic outward pressure and as a consequence a large part of the population is still located near the brink under mutation-selection balance. By contrast, in the presence of recombination for small mutation rates, because the contracting property of recombination efficiently transfers the population to the interior of the mesa where all genotypes are surrounded by viable mutants.

Simulations on different types of random genotype networks show that the massive enhancement of robustness found for the mesa landscape is generic, and typically a recombination rate on the order of the mutation rate suffices to achieve this effect. It is not obvious that the focusing of the population towards the centre of its genotypic range by recombination should generally increase robustness in this case, because viable and lethal genotypes are randomly interspersed in the network. To rationalise the observed increase in robustness it is useful to quantify the likelihood of a genotype to be created by recombination through its recombination weight defined by
| (4) |
Here denotes the probability that is generated by crossover from and and is the total number of genotypes. The normalisation ensures that , and the recombination weights sum to . The genotype that maximises is called the recombination centre of the network and provides a good predictor for the point of concentration of the recombining population in the limit (see Fig. 3 for an example). Moreover, for two classes of random, percolation-type genotype networks and one empirical fitness landscape, the recombination weight was found to be positively correlated with the genotypic robustness .
If this correlation were a generic feature of GP maps, it would constitute a mechanistic explanation for how recombination acts to enhance genotypic robustness. Future work should therefore elucidate the conditions on the topology of the genotype network required for such a correlation to be present. It is not difficult to construct counterexamples where the recombination centre has low robustness, e.g., by placing a hole of lethal genotypes at the centre of a mesa landscape. Only the investigation of specific, biophysically motivated GP maps such as RNA secondary structures or lattice proteins will clarify whether or not such instances are statistically relevant. More broadly, it appears that a common perspective on recombination, robustness and evolvability [masel:2010, lenski:2006, wagner:2005] may help to develop and test novel hypotheses about the evolutionary origins of these important biological phenomena.
5.2 Mutation bias
Some regions of genotype space exhibit biases in the mutations they contain. For instance, GC-rich regions have more GC transversion (purine-to-pyrimidine or pyrimidine-to-purine) mutations than transitions (pyrimidine-to-pyrimidine or purine-to-purine mutations). This may interact with biases in the generation of genetic variation, because some mutations occur more frequently than others. For instance, the rate of AG transitions exceeds the rate of TC transitions in transcribed human genes, whereas there is no significant difference in non-transcribed regions [green:2003]. Furthermore, CpG dinucleotides—regions of DNA where C follows G—are considered “hot spots” for GA and CT transition mutations [nachman:2000]. Other forms of mutation bias such as deletion bias and strand-specific bias have been reported in bacterial genomes [paul:2013, mira:2002].
Under certain population genetics conditions, mutation bias can be a orienting factor in adaptive evolution [mccandlish:2014, stoltzfus:2017], and several experimental evolution studies indicate that mutation bias can influence trajectories of adaptive protein evolution [lozovsky:2009, rokyta:2005]. It is possible to get a better understanding of how such mutation biases affect the outcomes and mutational trajectories of adaptive evolution by studying their impact on the navigability of GP maps.
Instead of the classic depiction of a GP map in which all the possible mutations are equally likely to occur, one could consider regions of the genotype space being differentially prone to distinct kinds of mutations. Ultimately this would affect the probability of traversing different edges in the genotype network and, therefore, its navigability. In this context, a mutation bias weight could be formally defined and introduced into a more general formulation of genotype networks, by biasing the accessibility of different genotypes. Understanding the potential evolutionary implications of mutation biased GP maps could provide us with valuable information about the nature of the systems they represent. For example, if a bias towards certain kinds of mutations enhances the ability to find the adaptive peaks of a certain GP map, a testable prediction could be that adaptive genotypes are more likely to evolve in regions of the genome that are prone to that particular kind of mutation.
Moreover, integrating mutation bias into the study of GP maps can change properties such as robustness and evolvability [cano:2020, sella:2005]. Both robustness and evolvability are based on the structure of genotypic neighbourhoods, and this structure can change if mutation bias is considered. For instance, a genotype might seem highly robust when most of its neighbours in the genotype space map onto the same phenotype. However, if there is a sufficiently high mutation bias towards mutations that do not preserve that phenotype, robustness would be diminished. The same principle can apply to evolvability.
5.3 Phenotypic transitions as competitions between networks
[frametitle= Box 5.3: Genotype spaces as networks of networks] Populations evolve in steadily changing environments where the impact of internal and external perturbations can rarely be considered in full. Often, nonlinear responses to small external changes hinder predictability, as weak perturbations might trigger critical transitions that strongly influence the fate of whole ecosystems [may:1977, scheffer:2001]. Complex network theory and the tools associated to it offer a powerful framework to tackle this type of dynamical systems, since a multitude of natural systems can be modelled as nodes (agents) connected by links (interactions).
While network science has largely focused on single networks, in the last decade the study of dynamical properties on networks of networks or, in a more general way, on multilayer networks [kivela:2014], has attracted wide attention [gao:2011, quill:2012]. One important motivation has been the finding that robustness, synchronisation or cooperation lead to different behaviour when studied in isolated or in interconnected networks [buldyrev:2010, aguirre:2014, gomezgardenes:2012, iranzo:2016]. However, the main reason for this change of perspective has been to realise that many natural systems, beyond displaying a network-like organisation, are also made of interacting and competing networks at very different scales, from the molecular level to supranational organisations [buldu:2019].
The extent to which network science can foster our knowledge and comprehension of the evolution and adaptation of heterogeneous populations in an ever changing biosphere is a relevant open question. In particular, the theory of competing networks can be used to analyse the evolutionary dynamics of populations in a space of genotypes that can be regarded as a network of networks [yubero:2017]. From this viewpoint, population evolution is described as a competition for resources of a certain kind, where the competitors are whole networks instead of independent nodes [aguirre:2013].
Formal studies of the way the structure and navigability of GP maps affects evolutionary dynamics can provide insights into the mechanisms underlying adaptive evolution, robustness and the emergence of phenotypic innovations. In the previous two sections, it has been shown that links between genotypes in a genotype network are weighted: microscopic mechanisms such as recombination and mutation bias modify the likelihood of transitions between pairs of genotypes. Constant link weights of a generic transition matrix M correctly describe mutation bias, but cannot account for the effects of recombination, since in the latter case they depend on the abundances of each genotype in a nonlinear way, and in general are a time-dependent quantity. The simultaneous consideration of point mutations and recombination in a network framework remains as a topic for future studies.
In the following, we summarise a mutation-selection evolutionary process on a network of genotypes subject only to point mutations using tools from complex network theory. Consider a vector whose components are the population of individuals at each node at time (upon normalisation, each component is the frequency of the genotype ). Then,
| (5) |
represents the dynamics of the population, where M is a transition matrix with information on the fitness of each genotype, on the mutation and replication process, and on the weighted topology of the network. describes the distribution, at each time , of the population of sequences on the space of genotypes. As already stated, mutation-selection equilibrium is independent of the initial state and given by the eigenvector associated to the largest eigenvalue of M. Furthermore, yields the growth rate of the population at equilibrium, and is also a measure (known as eigenvector centrality) of the topological importance of a node in a network [newman:2010].
In the context of the theory of competing networks, any dynamics that takes place on networks interconnected through a limited number of links (networks of networks), can be often characterised as a competition where the contenders are whole networks, and where eigenvector centrality represents the resource that the agents compete for (see Box 5.3). The final outcome of such a struggle for centrality strongly depends on the internal structure of the competing networks and on the links connecting them [aguirre:2013].
On the other hand, it has been shown [aguirre:2015] that even when environmental perturbations are weak, populations may suffer critical transitions in their genomic composition when the fraction of lethal mutations (i.e. of zero-fitness genotypes) is sufficiently high—of the order of that observed in natural populations [eyre-walker:2007]. A recent analysis of these results suggested that the space of genotypes can be regarded as a network of networks in “competition” to attract population [yubero:2017], and that knowledge of the topology of the space of genotypes entails a certain predictive capability of the future evolutionary dynamics of the population under study. In fitness landscapes with a large fraction of lethal genotypes (as it could be the case of the non-compact HP model, GP maps for gene regulatory networks, or models for metabolism), the space of genotypes is formed by many subnetworks connected through narrow adaptive pathways. This topology induces drastic transitions of population from one subnetwork to another, occasionally causing the extinction of the population. The key topological element underlying sudden genomic shifts is the high heterogeneity in the network describing and linking viable genotypes. This topology can arise under a significant fraction of lethal mutations (or non-viable genotypes), but the same phenomenon is observed in rugged fitness landscapes.
5.3.1 An empirical test of the theory: transition forecast
It is highly likely that large molecular populations able to evolve fast, such as RNA viruses, can provide an empirical test of this predicted critical behaviour. The enormous advances of high-throughput sequencing allow for a very precise description of the populations at the molecular level, and in particular of the abundances of the coexisting genotypes. This information might be used to build the space of sequences associated to a population that evolves in a changing environment, and thus a proxy of the network of genotypes where the population evolves. Applying the theory of competing networks it is conceivable that the eigenvalues of the different subnetworks and the centrality of the connector nodes would provide valuable information on how environmental variability affects the sharpness of the transitions and on the chances that the population could survive. The combination of tools from complex networks theory and the last decades’ research on state shifts in the biosphere [barnosky:2012, brook:2013] might eventually lead to a prediction of the time left until the transition occurs. This prediction is important because, once a tipping point takes place, it becomes very difficult, if not impossible, to return to the previous state. At present, a wide variety of early warning signals for state shifts has already been characterised, but none of them yields precise information about the time left before the tipping point is reached [scheffer:2009, scheffer:2012]. However, calculations of the minimal distance between the first and second eigenvalues associated to the transition matrix M could be used to obtain a first estimation of the time to the transition [aguirre:2015]. In an evolving population, the relative abundances of the different genotypes could be used as an approximation of the eigenvector ; a measure of the growth rate of the population at equilibrium could yield the largest eigenvalue , and might be estimated by quantifying how resilient the population is to external perturbations [dai:2012]. A sufficiently precise measurement of these quantities would represent a very fruitful connection between actual evolving populations and a dynamical description of possible sudden evolutionary transitions. On a related note, regarding the space of genotypes as a network of networks entails a more coarse-grained, effective model where each genotype network can be considered as a single node, and where the dynamics can be simplified to account only for changes in the phenotype. Links in this higher-level description would have a weight proportional to the within- and between-phenotypes links. At odds with the description at the genotype level though, transitions between phenotypes are no longer symmetrical [fontana:2002, cowperthwaite:2008], nor is the dynamics describing these transitions Markovian any more [huynen:1996, manrubia:2015].
5.4 A mean-field description of phenotype networks
The qualitative properties of a high-dimensional evolutionary search are inherent to navigable GP maps and very likely responsible for some of the generic features described in Section 4. Despite all caveats that the complex dynamics at the genotype level may raise due to its non-Markovian nature [huynen:1996, manrubia:2015], the high dimensionality of genotype spaces helps us understand why a simple mean field model [schaper:2014], which averages over much of the local structure of a neutral set, succeeds in capturing some of those generic, dynamical properties. The model works with , the probability that a point mutation for genotypes that map to phenotype generates a genotype for phenotype , averaged over all genotypes that generate . By measuring the , a weighted network between all the phenotypes can be defined, with as the weights. This allows for a much simpler dynamics that ignores the individual genotypes, and so analytic results can be derived for many properties in dynamical regimes ranging from the monomorphic to the fully polymorphic limits. Interestingly, for RNA, as well as for a number of other GP maps [greenbury:2016], it was found to a good first approximation that if then
| (6) |
where is the global frequency of phenotype , i.e., the fraction of genotypes that map to . Since the range over many orders of magnitude, so do the . In contrast to the case where , the robustness of phenotype is , and so varies much less with NSS. This property of the robustness is critical for neutral exploration. The mean field model predicts that for many different starting phenotypes , the probability that a different phenotype will appear as potential variation will scale as .
For several GP maps, this simplified model does an excellent job at predicting the rates at which variation arises in full GP map simulations. Since NSS, or equivalently , varies over many orders of magnitude, this argument predicts that, to first order, the rate at which variation arises will also vary over many orders of magnitude. Therefore, even though the set of physically possible variations may be very large, only a tiny fraction of the most frequent phenotypes will ever be presented to natural selection. This arrival of the frequent effect [schaper:2014] is therefore very strong. Fundamentally it is a non-steady state effect, since the longer an evolutionary run proceeds, the more the potential variation with lower becomes likely to appear. The arrival of the frequent differs from the survival of the flattest, [wilke:2001Nat] which describes the situation where a fitness peak with lower fitness can nevertheless dominate over a higher fitness peak with a lower NSS. The latter effect can be analysed in a steady-state framework, whereas the former effect cannot.
Let us return in this context to the question of why so many structural features, as well as the genotypic robustness of RNA secondary structures, are so accurately predicted by a null model that ignores selection entirely. The arguments above suggest that even in the more complex situation of RNA evolution in nature, variation will nevertheless to a good first approximation arise with a probability proportional to its NSS. Since this rate varies by so many orders of magnitude, this arrival of the frequent effect determines what natural selection can work with, and so tends to dominate over local fitness effects. Rare phenotypes will almost have no bearing on evolutionary dynamics: they will hardly be found by a population searching for an adaptive solution and, if they are found, they will be quickly lost due to mutations. This is akin to an entropic effect in statistical physics: dynamics tend to favour macrostates with a larger set of microstates.
In other words, natural selection can only act on variation that has been pre-sculpted by the GP map. For the case of RNA described in Section 3.3.1, it appears that it mainly works by further refining parts of the sequence. This picture of the primacy of variation stands in sharp contrast to more traditional arguments about the importance of natural selection as an ultimate explanation of any evolutionary trends. It also raises many open questions. Are there other GP maps for which we can see such dramatic effects in nature? There are certainly conditions where this primacy of variation is incorrect. But how, and when does this GP map based picture of pre-sculpted variation break down? The exceptional case of viroids, discussed in Section 3.3 might be one such example, and provide clues to seek answers to the latter question.
5.5 Equilibrium properties and statistical mechanical analogies in the weak mutation regime
The broad question of optimisation in evolution, such as the existence of a Lyapunov function, describing a general dynamics and approach to equilibrium was first addressed by Iwasa [iwasa:1988] in his definition of “free fitness”, in analogy to the free energy of statistical mechanics, and then later rediscovered for the particular case of the weak mutation regime [sella:2005] and in the context of the evolution of quantitative traits [barton:2009, barton:2009a]. The key insight, is that, at finite population size, not fitness itself but a combination of fitness and Shannon entropy (weighted by , where is the effective population size) is optimised over the evolutionary degrees of freedom of interest. This perception is consistent with the mean-field description reviewed in the previous section, where it has been shown that phenotypic bias is at least as relevant as phenotype fitness in evolutionary dynamics.
From a statistical mechanics viewpoint, and in the weak mutation regime (, , where is the gain in fitness brought about by a mutation), populations are approximately monomorphic and the degrees of freedom of interest are the different alleles, codons or genotypes, which are fixed, or not, in the population; evolution can be described by a Markov process, where populations effectively jump sequentially between adjacent genotypes by a substitutional process [mccandlish:2014], where in equilibrium (assuming uniform mutation and the fixation probability given by the diffusion approximation) the probability of occupation is given by the Boltzmann distribution
| (7) |
where is the fitness of genotype, allele, or codon , and is the partition function. It is clear that plays the role of inverse temperature, such that fitness dominates at large population sizes (low temperature) and genetic drift for small population sizes (high temperature). Many of the calculational tools of statistical mechanics and generating functions then carry over to evolutionary problems [barton:2009a] under usual ergodic assumptions.
The statistical mechanical analogy finds particular use in understanding the evolution of phenotypes arising from GP maps. Here, selection acts on phenotypes, but mutation and variation arise at the level of genotypes. Keeping in mind the many-to-one nature of most GP maps and phenotypic bias, the Boltzmann distribution of genotypes can be recast in terms of a Boltzmann distribution of phenotypes [khatri:2009, khatri:2015]; as each genotype mapping to a given phenotype must by definition have the same fitness, the probability of each phenotype is the Boltzmann factor () weighted by the degeneracy of each phenotype , giving
| (8) |
where
| (9) |
is the free fitness of phenotypes, being the Boltzmann or sequence entropy of phenotypes. We see that for small populations phenotypes with larger sequence entropy are favoured by genetic drift in evolution.
5.5.1 Statistical mechanics of the evolution of transcription factor-DNA binding
The ideas above first formally found application in simple biophysical models of transcription factor DNA binding [berg:2004, mustonen:2005, mustonen:2008], where the degeneracy of binding affinities can be exactly quantified under simplifying assumptions. It is typically found that for a given transcription factor, the amino acids at the binding interface tend to have strong preference to bind a single nucleotide; it is then mismatched nucleotides that control the binding affinity, as these are strongly destabilising, since hydrogen bonding is disrupted at the interface, as well as the lost hydrogen bonds with water molecules. A simple model of transcription factor binding, assumes binding between protein and DNA can be reduced to either a quaternary or binary alphabet, where the binding energy is proportional to the number of mismatches, or Hamming distance, , . The degeneracy function is then related to the binomial coefficient
| (10) |
This simple combinatorial argument shows that there is a huge degeneracy, or phenotypic, bias towards poor binding in this genotype-phenotype map. This methodology has been used to infer the effective genome-wide fitness landscape for transcription factor DNA binding in Escherichia coli and yeast [mustonen:2005, mustonen:2008, haldane:2014], suggesting that on average binding is under stabilising selection, with monotonically decreasing fitness with decreasing binding affinity.
This simple model of transcription factor DNA binding suggests that smaller populations bear a significantly greater drift load under stabilising selection, than would be predicted if we assumed evolution based on phenotypes only [khatri:2015, khatri:2015a]; while selection pushes populations to larger binding affinities, there is an opposing sequence entropic pressure for poorer binding. In equilibrium, these opposing tendencies are balanced, and it is the free fitness that is maximised, not fitness. This effect of sequence entropy on drift load is significantly greater than would be expected for a trait under stabilising selection, which ignores any degeneracy (see Box 5.5.1).
[frametitle= Box 5.5.1: Quadratic free fitness landscape] We examine a quadratic free fitness landscape, which is a simple description for the statistical mechanics of transcription factor DNA binding. For moderately large , we can make the standard Gaussian approximation of the binomial distribution in the degeneracy function (10), such that the sequence entropy function (up to a constant) is approximately quadratic:
| (11) |
where is the mean of the binomial distribution ( for binary, and for quaternary alphabets). Further, if we assume that the fitness landscape of binding affinities is quadratic of the form , whose maximum is for the best binders (), then from Eq. (9) the free fitness of binding energies/Hamming distance is then itself quadratic with new curvature and with shifted maximum :
| (12) |
This new maximum is shifted to poorer binding affinities and represents the balance between selection and sequence entropy:
It is instructive that the drift-load for this simple GP map varies as , a far stronger dependence on population size than if we considered evolution on only a phenotypic landscape , which would vary as ; this significant difference arises as the sequence entropic pressure causes the peak of the phenotypic distribution to shift, whilst ignoring this would simply give rise to a broadening of the distribution.