Photon-induced desorption of larger species in UV-irradiated methane (CH4) ice
Abstract
At the low temperatures found in the interior of dense clouds and circumstellar regions, along with H2O and smaller amounts of species such as CO, CO2, or CH3OH, the infrared features of CH4 have been observed on icy dust grains. Ultraviolet (UV) photons induce different processes in ice mantles, affecting the molecular abundances detected in the gas-phase.
This work aims to understand the processes that occur in a pure CH4 ice mantle submitted to UV irradiation. We studied photon-induced processes for the different photoproducts arising in the ice upon UV irradiation.
Experiments were carried out in ISAC, an ultra-high vacuum chamber equipped with a cryostat and an F-type UV-lamp reproducing the secondary UV-field induced by cosmic rays in dense clouds. Infrared spectroscopy and quadrupole mass spectrometry were used to monitor the solid and gas-phase, respectively, during the formation, irradiation, and warm-up of the ice.
Direct photodesorption of pure CH4 was not observed. UV photons form CH and H radicals, leading to photoproducts such as H2, C2H2, C2H6, and C3H8. Evidence for the photodesorption of C2H2 and photochemidesorption of C2H6 and C3H8 was found, the latter species is so far the largest molecule found to photochemidesorb. 13CH4 experiments were also carried out to confirm the reliability of these results.
keywords:
Methods: laboratory: molecular - ultraviolet: ISM - ISM: molecules - Astrochemistry1 Introduction
The low temperatures present in dense interstellar clouds promote the formation of ice mantles around carbonaceous and silicate dust grains. In the outer regions of the cloud, the temperature and the UV field are too high for any molecule to freeze out. Deeper inside the cloud, there is sufficient screening from the external UV radiation field, and molecules form and accrete onto dust grains, thus forming ice mantles. Even the highly volatile species like CO and N2 are frozen at 10 K. Methane has been detected in the interstellar medium (ISM) and dense clouds (Lacy et al., 1991; Boogert
et al., 1996; Öberg
et al., 2008). Methane ice can be formed from successive hydrogenation of carbon atoms over a dust grain surface, from photoprocessing of CH3OH ice, or even from gas-phase reactions and subsequent freeze out over dust grains (Öberg
et al., 2008, and references therein). CH4 constitutes a source of carbon atoms in ice mantles, with abundances around 5% and 2% of the water ice in low-mass and high-mass protostars, respectively (Dartois, 2005; Öberg
et al., 2011; Boogert et al., 2015). Complex organic molecules (COMs), containing six or more atoms and at least one carbon, can be formed from methane processing in the interstellar and circumstellar medium, or comets. These systems contain variable quantities, up to 4% relative to water, of solid methane, which is exposed to vacuum ultraviolet (UV) photons with a spectral energy distribution as simulated in our experiments (Gerakines et al., 1996; Lin et al., 2014). In our Solar System, CH4 has been detected on the surface of Triton (Cruikshank
et al., 1993; Owen
et al., 1993), Titan (McKay et al., 1997), and Pluto (Grundy
et al., 2016), among others.
At the low temperatures that govern the interior of dense clouds, thermal energy is almost negligible, and ice processes driven by cosmic rays and UV photons play a significant role. Secondary UV radiation, generated by the interaction between cosmic rays and hydrogen molecules (Cecchi-Pestellini & Aiello, 1992; Shen et al., 2004) is the main source of photons impinging on ice mantles in dense clouds. The absorption of UV photons by methane molecules in the ice leads to an efficient photochemistry. In this article, we explore the photon-induced desorption of molecules upon UV-irradiation of CH4 in the laboratory.
The absorption of sufficient photon energy by a molecule on the ice surface counteracts the intermolecular forces with the surrounding species, allowing photon-induced desorption. UV photons, however, can also break covalent bonds, inducing the formation of radicals that may react to form new molecules, leading to photochemistry. Depending on the species present in the ice and the photon energy, UV radiation induces photon-induced desorption, photochemistry, or both.
The direct desorption of a molecule from the ice surface (van Hemert et al., 2015; Dupuy
et al., 2017), after absorption of a photon, is of low efficiency compared to the indirect photodesorption, by which the photon is absorbed by another molecule and the photon energy is distributed to the surrounding molecules. In this case, a UV photon can be absorbed by a molecule in the subsurface layers of the ice, leading to electronic excitation. The energy from the relaxation to the ground state is redistributed to the neighboring molecules. A different kind of photon-induced desorption was observed when a surface molecule absorbs a photon and dissociates into photofragments that may recombine, forming a photoproduct. This photoproduct can desorb if the excess energy of the parent photofragments is sufficient to overcome the binding energy of the ice, due to the exothermicity of the reaction (Andersson &
van Dishoeck, 2008; Fayolle
et al., 2013; Fillion
et al., 2014; Bertin
et al., 2016). Photochemical desorption or photochemidesorption only applies to species that are formed on the ice surface and are immediately ejected to the gas, leading to a constant photodesorption yield during the irradiation (Martín-Doménech et al., 2016, 2018; Cruz-Diaz et al., 2016).
The IR features arising from UV radiation or -particle and proton bombardment of pure CH4 ice were reported (Gerakines et al., 1996; Kaiser &
Roessler, 1998). More recently, Lin et al. (2014) and Lo et al. (2015) irradiated CH4 ice at 3 K with monochromatic UV light from a synchrotron, and Dupuy
et al. (2017) studied CH4 photodesorption using monochromatic UV radiation. This work focuses on photon-induced desorption processes of CH4 photoproducts using a continuum UV emission lamp that mimics the secondary UV-field in dense clouds. We will show that photoproducts desorb mainly via photochemidesorption.
2 Experimental
Experiments were carried out in the InterStellar Astrochemistry Chamber (ISAC) located at the Centro de Astrobiología (for a detailed description of ISAC see Muñoz Caro et al. (2010)). ISAC is an ultra-high vacuum chamber with a base pressure around 410-11 mbar, similar to the pressure in dense interstellar clouds. A closed-cycle helium cryostat allows to cool down to 8 K, a temperature similar to that of dust grains in the inner parts of dense interstellar clouds. CH4 (gas, Praxair 99.95%) and 13CH4 (gas, Cambridge Isotopes Laboratories 99.9%) were used for the experiments. Gases at a pressure of 210-7 mbar were introduced in the UHV-chamber through a stainless steel tube at normal incidence angle with respect to the MgF2 substrate. The low temperature of the substrate led to the formation of amorphous ices (Hudson
et al., 2015). The column density of the ice samples corresponds to an absorption of about 90% of the incident photon flux in the deposited ice layers. To estimate the number of UV photons absorbed, we adopted the UV absorption cross-section of CH4 ice measured by Cruz-Diaz et al. (2014).
Fourier-Transform Infrared Spectroscopy (FTIR) measured with a Bruker Vertex 70 spectrometer equipped with a deuterated triglycine sulfate detector (DTGS) was used to monitor the column densities and composition of the ice samples. IR spectra were measured with a resolution of 2 cm-1 after deposition of the ice, after each irradiation step, and also during the warm-up. The measured spectral range in the reported experiments spans from 6000 to 1200 cm-1 (1.66 to 8.33 m), since the MgF2 substrate becomes optically thick at longer wavelengths. The column density of the ice layer was determined using equation 1, where is the column density of the molecule of interest in molec cm-2, is the band strength of the considered band in cm molecule-1, the optical depth of the band, and the wavenumber differential in cm-1:
| (1) |
Ice samples were irradiated using an F-type microwave discharge hydrogen lamp (MDHL) from Opthos Instruments, providing an UV flux of 21014 photons cm-2 s-1 and 8.6 eV average photon energy (e. g. Cruz-Diaz et al. (2016)). The MgF2 window between the MDHL and the vacuum chamber leads to a cut-off at 114 nm (10.87 eV). Destruction cross-section of CH4, and similarly of 13CH4, were obtained using equation 2, where and are the column densities measured by FTIR before and after the irradiation, respectively, in molec cm-2, is the UV flux in photons cm-2 s-1, is the irradiation time in s, which belongs to the first irradiation period, as the ice is less processed at the beginning, and is the destruction cross-section in cm2.
| (2) |
Formation cross-section for ethane molecules () was obtained using equation 3, where is the variation of the column density of ethane molecules after irradiation time, is the irradiation time in s, and is the average column density of methane during the irradiation interval.
| (3) |
The gas-phase was monitored during deposition, irradiation, and warm-up processes using a Pfeiffer Prisma quadrupole mass spectrometer (QMS) equipped with a Channeltron detector. Molecules were ionized by electron impact of 70 eV and accelerated into the mass filter of the QMS, leading to a characteristic fragmentation pattern for each species. From the ion current obtained in the QMS for each molecular fragment, a quantification of the gas-phase molecules was done following the procedure presented in Martín-Doménech et al. (2015). After baseline and blank (no ice sample) irradiation corrections, the area below the QMS during each irradiation period was calculated, obtaining the ion current as a function of the photon dose. Applying Eq. 4 and the values in Table 1, photodesorption rates of methane, ethane and propane were obtained by monitoring 15, 30, and 43, respectively. These fragments were selected considering the possible contribution of other molecules and the relative intensity for each of the fragments. In Eq. 4, is the photodesorption rate in molec photon-1, is the area obtained from the QMS normalized by the number of incident photons, is the proportionality constant from the calibration of the QMS in a CO ice irradiation experiment (see Martín-Doménech et al. (2015)), (mol) is the ionization cross-section of each species ionized at a voltage of 70 eV in the QMS (data adopted from the National Institute of Standards and Technology), is the ionization factor, which has been considered unity for all molecules, as most of them will be charged once, is the fragmentation factor, it refers to the percentage of molecules which account for a given value (using the mass spectrum of methane measured by our QMS during deposition, while the mass spectra from NIST database was used for the photoproducts), and is the sensitivity of the QMS, which depends on the ion current generated at the QMS as a function of the mass of each molecule (for calculation details, see Martín-Doménech et al. (2015)).
| Parameter | CO | CH4 | C2H6 | C3H8 |
|---|---|---|---|---|
| - | - | - | ||
| (mol) (A2) | 2.516 | 3.524 | 6.422 | 8.619 |
| 0.939 | 0.419 | 0.122* | 0.0757* |
* Values taken from the National Institute of Standards and Technology (NIST) database.
| (4) |
After the irradiation steps, ice samples were warmed up until room temperature using a LakeShore Model 331 temperature controller. The temperature was monitored by a silicon diode sensor with a sensitivity of 0.1 K, located underneath the sample holder.
3 Results and discussion
3.1 Photochemical processes
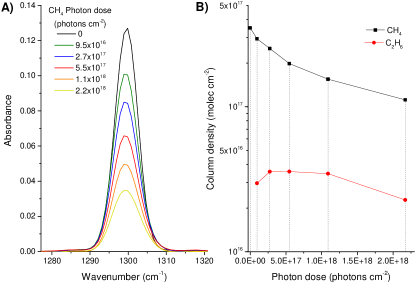
Fig. 1A shows the evolution of the stretching mode of CH4 (1301 cm-1). The reaction network presented in scheme i shows that UV photons can dissociate methane molecules producing CH and H radicals, CH radicals and H2 molecules or, to a lesser extent, CH radicals, H2 and H radicals. The position of the IR band does not change, while its intensity is reduced. In the gas-phase, for 123.6 nm (10.03 eV) photons, the quantum yields for the second and third reactions are 0.5 and 0.06, respectively (Okabe, 1978).
| (i) |
Radicals produced from methane dissociation will recombine giving rise to new species. This observation is supported by the formation of hydrogenated amorphous carbon (a-C:H) at 10 K in similar CH4 irradiation experiments (Dartois et al., 2005). As a consequence, bands related to CH radicals were not detected in IR spectra (e. g. the 3150 cm-1 band for CH, de Barros
et al. (2011)). H radicals can diffuse inside the ice and recombine producing H2 molecules, as shown in Scheme ii.
| (ii) |
The reaction of two CH radicals in the gas-phase produces ethane, C2H6, (Scheme LABEL:Sch.C2H6), with a rate constant of 5 10-11 cm3 molec-1 s-1 (Okabe, 1978), leading to the appearance of its characteristic IR bands (see Fig. 2 and Table. 2). Ethane can also be produced from the reaction between a CH radical and a CH4 molecule, although the lower formation rate of CH radicals would probably determine a minor production rate by this route.
| (iii) |
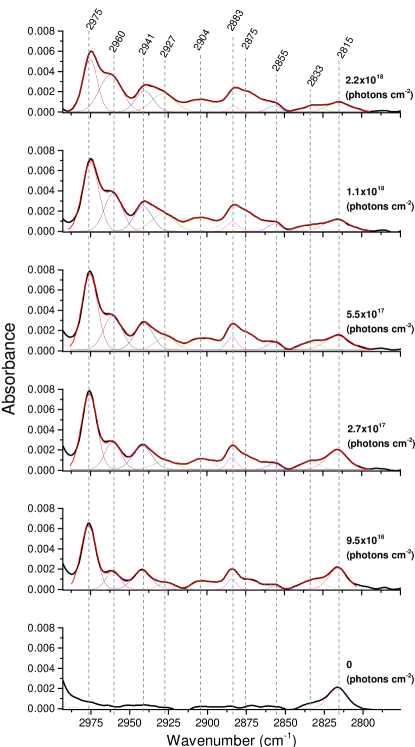
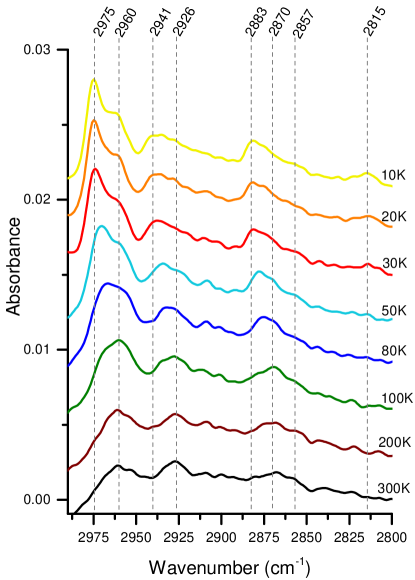
As shown in Fig. 2, bands related to C-H stretching modes from different molecules appeared in the IR spectrum between 3000-2800 cm-1 upon irradiation. The profile of this region was fitted using 10 Gaussian curves. The bands assignment is shown in Table 2 for CH4 and 13CH4 irradiations. Within the first steps of irradiation, the integrated IR absorption of the photoproducts increases as a consequence of the ice processing. However, IR bands related to ethane (2975, 2941 and 2883 cm-1) decrease for longer irradiation times, while other IR bands are still growing. The formation of hydrogen molecules, which can escape from the ice, determines that the proportion of carbon to hydrogen increases during the irradiation, and CH radicals are more and more scarce. Therefore, the production of C2H6 (Scheme LABEL:Sch.C2H6) molecules is lowered, whereas its dissociation (Scheme iv) does not change, in agreement with the observed ethane band intensities.
| CH4 | 13CH4 | |||||
|---|---|---|---|---|---|---|
| Frequency (cm-1) | Asignment | Reference | Frequency (cm-1) | Asignment | Reference | |
| 3009 | CH4 | 1, 6 | 3000 | 13CH4 | 7 | |
| 2975 | C2H6 | 1, 2, 8 | 2966 | 13C2H6 | 7 | |
| 2960 | R-CH2-R’ | 2, 3, 9 | 2958 | R-13CH3 | 7 | |
| 2941 | C2H6 | 2 | 2940 | 13C2H6 | This work | |
| 2927 | R-CH2-R’ | 4 | 2931 | R-13CH2-R | 7 | |
| 2904 | ? | 2909 | ? | |||
| 2883 | C2H6 | 1, 2, 3, 5, 8 | 2879 | R,R’-13CH-R” / 13C2H6 | 7 | |
| 2875 | R-CH3 | 5 | 2871 | R-13CH3 | This work | |
| 2855 | R-CH2-R’ | 2 | 2843 | R-13CH2-R’ | This work | |
| 2833 | R-CH3 | 5 | 2817 | R-13CH3 | This work | |
| 2815 | CH4 | 1, 7 | 2807 | 13CH4 | This work | |
| (iv) |
The CH4 band at 1301 cm-1 was selected for quantification of its column density using Eq. 1 and assuming a band strength of 6.1x10⁻¹⁸ cm molecule-1 (Gerakines et al., 1996; Kaiser &
Roessler, 1998). Fig. 1B shows the column density of methane and ethane as a function of the incident photon flux. The Gaussian profile at 2975 cm-1 was used to obtain the column density of C2H6 molecules, using a band strength of 1.3x1017 cm molecule-1, following Gerakines et al. (1996). Taking into account the destruction cross-section of methane shown in Table 3, and the column density of ethane molecules after the first irradiation step, the formation cross-sections of C2H6 was obtained using equation 3 (see Table 3). Ethane was found to be the main molecular photoproduct for short irradiation periods, but, as the amount of CH radicals is reduced, less hydrogenated compounds arise in the ice upon further irradiation.
| Nt=0 (moleccm-2) | photon flux () | Species | (cm2) |
|---|---|---|---|
| 3.51017 | incident | CH4 | 1.9 x10⁻¹⁸ |
| C2H6 | 1.0 x10⁻¹⁸ | ||
| 3.51017 | absorbed | CH4 | 2.2 x10⁻¹⁸ |
| C2H6 | 1.2 x10⁻¹⁸ |
Dissociation of ethane molecules gives rise to the formation of other photoproducts. C2H radicals produced from ethane dissociation may react with CH radicals, thus forming propane (Scheme LABEL:Sch.C3H8). Propane can also be produced from the reaction of a CH radical with two CH radicals. However, the probability of three species reacting simultaneously should be lower in the solid phase, and this reaction pathway may be negligible. The column density of propane molecules was not possible to determine, as its IR bands (e. g. 2960 cm-1) overlap with vibration modes from a-C:H. The proposed reaction pathway for the formation of propane is provided below:
| (v) |
Ethyl radicals produced from methane dissociation may also react, forming butane molecules.
| (vi) |
C4H10 can also be produced from the rupture of propane molecules and the subsequent reaction with a methyl radical (Scheme LABEL:Sch.C4H10.2). However, as propane was found to be less abundant, this reaction is not expected to be influential in our experiments. Hence no butane was detected among the photoproducts in our experiments.
| (vii) |
We mentioned that chemical reactions between radicals formed by CH4 ice irradiation lead to a complex branched network of C and H atoms, known as hydrogenated amorphous carbon, a-C:H (Dartois et al., 2005). The refractory a-C:H is the main constituent of carbonaceous dust grains observed in the ISM (Dartois et al., 2005). Subsequent irradiation leads to a reduction of C-H bonds in a-C:H, the C to H rate changes during the irradiation, and a less hydrogenated amorphous carbon is obtained.
| (viii) |
3.2 Vacuum UV spectra
Fig. 3 shows the VUV spectrum of methane ice. CH4 has a strong absorption from the cut-off of the lamp (114 nm, 10.87 eV) to 133 nm (9.32 eV), and almost no absorption above 140 nm (8.86 eV) (Wu et al., 2012; Cruz-Diaz et al., 2014). During the irradiation steps, the formation of different photoproducts involving C-C bonds is responsible for the extended UV absorbance up to 180 nm (6.89 eV). These include C2H6, C3H8, the a-C:H residue, and probably C2H2 identified as a photodesorbing species in Sect. 3.3. C2H4, which was not identified by IR or QMS, could be responsible for the bump appearing between 160-180 nm (7.75-6.89 eV), according to its UV absorption spectrum (Lu
et al., 2004; Young
et al., 2018).

3.3 Photon-induced desorption
The QMS monitored the desorption of molecules from the ice sample. The time-dependent ion current from each molecular fragment served to detect the evolution of molecules in the gas-phase (see Sect. 2). Fig. 4A, B, and C represent the ion current measured during the irradiation of pure CH4 ice for the main fragments from H2, C2H6, and C3H8, respectively.
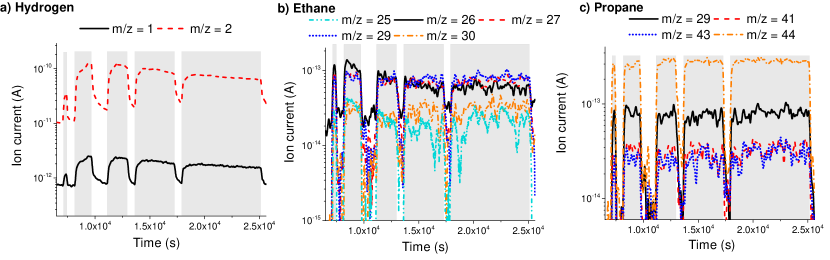
H radicals produced from methane dissociation can diffuse through the ice even at 8 K, thus forming hydrogen molecules that can escape from the ice to the gas-phase, allowing their detection by QMS for short irradiation times. The presence of H2 background contamination intrinsic to UHV chambers and its possible release from turbomolecular pumps prevented the quantification of H2 photodesorption. Additionally, the ion current generated by H2 in the QMS is reduced for longer irradiation times as the column density of CH4 ice diminishes.
Dupuy
et al. (2017) reported CH4 photodesorption from pure CH4 ice for monochromatic photon energies above 9 eV, where the UV absorption of CH4 becomes important (Cruz-Diaz et al., 2014). They found photodesorption of methane to be around 2.3 10-3 molecules per photon at Ly- photon energy, and 2.2 10-3 molecules per photon integrating over the Gredel et al. (1989) photon distribution. However, CH4 was not found to photodesorb in our experiments using the continuum emission MDHL, with a calculated upper limit of 1.7 10-4 molecules per incident photon. This difference could be explained by the onset of CH4 photodesorption starting at energies of about 9.2 eV (135 nm), with a large absorption cross-section of solid methane at Ly-, and even higher above 11 eV (Wu et al., 2012), while there is almost no UV-absorption corresponding to the MDHL molecular emission range below 9.2 eV, i. e. a lower average absorption cross-section over the photon energy range covered by the MDHL, see Cruz-Diaz et al. (2014). Besides, when UV photons dissociate CH4 ice molecules, H atoms escape from the solid phase, leaving CH radicals behind. Therefore, the backward reaction to produce CH4 is inhibited, in particular at the surface of the ice, which may explain the absence of CH4 photochemidesorption in our experiments with pure CH4 ice. Cruz-Diaz et al. (2016) found that UV irradiation of pure CH3OH ice gives rise to CH and HCO species, among others. A likely explanation is that in Cruz-Diaz et al. (2016) experiments, CH radicals react with HCO and other species, allowing the formation of CH4 molecules and their subsequent photochemidesorption when these reactions occur at the surface.
NH and NH radicals produced from UV irradiation of pure NH3 ice were found to react mainly at temperatures well above 10 K (Martín-Doménech et al., 2018). Thus, the photoprocessing of the ice is limited to the production of radicals, and other photoproducts appear mainly during the warm-up phase. On the contrary, our experiments showed that radicals produced from UV irradiation of CH4 are more reactive at low temperature, in agreement with other works (e. g. Lin et al., 2014).
CH radicals produced from CH4 dissociation react in the ice, leading to an efficient ethane formation at the ice bulk and surface. QMS detected photon-induced desorption of the so-formed ethane molecules. The energy released during the formation of ethane from two methyl radicals overcomes the intermolecular interactions of the new molecule with the ice, which therefore photochemidesorbs as soon as it is formed (with a rate of molecules per incident photon111Values of the photon-induced desorption yields can vary by a factor of 2, estimated by the errors in the parameters in Eq. 4, see Martín-Doménech et al. (2016)). A similar effect is observed for propane, which is, to our knowledge, the largest molecule found to photochemidesorb, with a rate of molecules per incident photon. The constant QMS ion current measured for ethane and propane molecules supports a photochemidesorption mechanism (Cruz-Diaz et al., 2016; Martín-Doménech et al., 2015, 2016). The surface of the ice is renewed upon UV-irradiation due to formation of photoproducts and their eventual desorption if these species are formed at the ice surface. Radical formation and recombination also occurs in the ice bulk and become gradually exposed at the renewed surface due to desorption of the top monolayers during irradiation. The surface is thus enriched in ethane and propane molecules. The constant desorption rates of these species during irradiation indicates that only when they are formed directly on the surface, they can escape from the ice. Indeed, an ethane/propane molecule formed in the bulk that becomes later exposed to the surface will photodissociate rather than desorb when it absorbs a UV-photon.
Interestingly, Fig. 4B shows that = 25, and 26, decrease over the irradiation steps, while = 27, 28, 29, and 30 remain constant, suggesting that a second contribution is present within = 25, and 26. C2H2 photodesorption may be responsible for this behaviour, since = 26 is the most intense molecular fragment of acetylene, followed by = 25, and almost no = 24 is produced. Acetylene can be produced from dehydrogenation of ethane molecules, although ethane photochemidesorption would inhibit acetylene formation in the surface, and therefore its photodesorption. C2H2 can also be formed from the reaction between two CH radicals produced directly from CH4 dissociation, as shown in Scheme LABEL:Sch.C2H2. Okabe (1978) reports a yield value of 0.06 with respect to the production of CH radicals for the gas-phase using Ly- photons. Recently, Lin et al. (2014) measured the threshold energy of this reaction in CH4 ice at 3 K, obtaining a value of 9.2 eV (134.8 nm). Therefore, the continuum emission of our MDHL may favour this reaction.
| (ix) |
3.4 Thermal desorption
After irradiation, CH4 ice samples were warmed up at a rate of 1 K/min. IR spectra were collected during the temperature programmed desorption (TPD). Methane bands at 3009, 2815 and 1300 cm-1 disappear at a temperature lower than 40 K, while photoproducts (mainly ethane, propane and hydrogenated amorphous carbon), will remain in the ice at higher temperatures. Fig. 5 shows the IR spectra measured during the TPD at different temperatures. Bands identified with ethane (2975, 2941 and 2883 cm-1) disappear gradually as the temperature increases, and they are not observed above 70 K. Meanwhile, IR bands at 2960 cm-1, 2926 cm-1, 2870 cm-1 and 2857 cm-1, related to different stretching modes of a-C:H (Dartois et al., 2005), are still clearly observable at 300 K.
| Species | Tdes(K) | Eb(K) | Species | Tdes(K) | Eb(K) | |
|---|---|---|---|---|---|---|
| CH4 | 38.6 | 1193 | 13CH4 | 38.7 | 1196 | |
| C2H6 | 66.1 | 2042 | 13C2H6 | 67.0 | 2070 | |
| C3H8 | 83.5 | 2580 | 13C3H8 | 85.0 | 2626 |
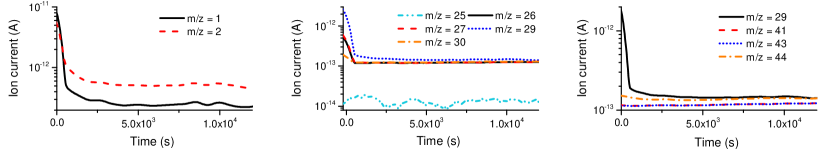
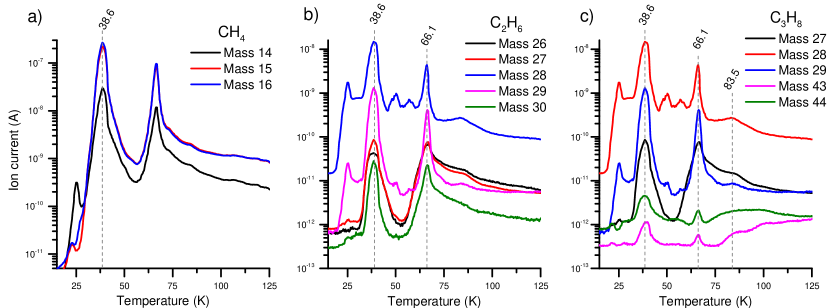
The ion current of different fragments during the TPD process is represented in Fig. 6. CH4 molecules (Fig. 6A) desorb thermally from the irradiated CH4 ice at 38.6 K. A second peak that appears near 66.5 K is related to the thermal desorption of methane ice that accreted outside the sample substrate in cold areas of the cold finger. Indeed, this peak disappears if the cold finger of the cryostat is warmed up at the same rate with the thermal resistance and the cryostat off (natural TPD). The thermal desorption of C2H6 occurs at 66.1 K. Two clear peaks are also observed in Fig. 6B. The one at 38.6 K represents the ethane molecules co-desorbing with CH4, with = 30 for the molecular ion, C2H, and other fragments at = 29, 28, 27, 26 and 25 with relative intensities similar to those in the NIST database for ethane. As CH4 is the primary molecule present in the ice, its thermal desorption can drag other molecules. But other ethane molecules will remain in the ice until 66.1 K, where C2H6 molecules desorb from pure ethane ice (in agreement with Hudson
et al. (2009)). Propane co-desorption with methane and ethane molecules is observed at 38.6 K and 66.1 K, respectively. The third peak, appearing at 83.5 K, belongs to the propane ice thermal desorption. Following Luna
et al. (2017), the binding energies of these species are obtained multiplying the peak temperatures by a factor of 30.9. These values for CH4, C2H6 and C3H8 and their homologous 13C isotopologues are shown in Table 4.
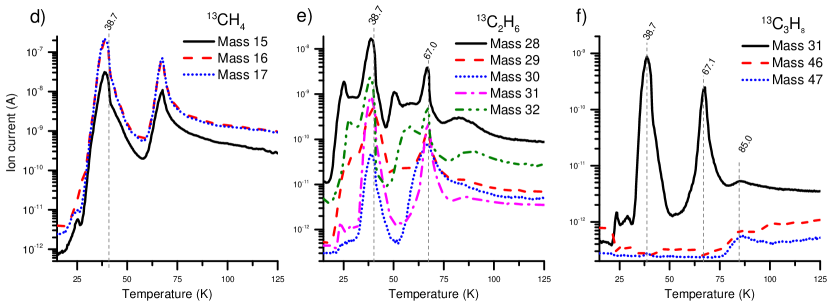
To further confirm the results obtained for CH4 ice, experiments were repeated using 13CH4. The ion current of different fragments is represented in Fig. 6 (bottom part) for a TPD from a 13CH4 ice sample. 13CH4 desorbs thermally at 38.7 K. 13C2H6 co-desorbs with methane, while its pure thermal desorption occurs at 67.0 K. Both processes are similar to the ones found for the CH4 ice. Propane co-desorption with CH4 and C2H6 at 38.6 K and 66.1 K in the CH4 experiment, monitored by = 43 and 44, were not confirmed by their corresponding fragments = 46 and 47 in the 13CH4 experiment. While = 44 could suffer from CO2 contamination, the = 43 desorption could not be identified with a contaminant. Nevertheless, the desorption of C3H8 at 83.5 K was reproduced in the 13CH4 experiment as a peak appearing at 85.0 K (Fig. 6F). Thermal desorption of 13CH4, 13C2H6 and 13C3H8 takes place at slightly higher temperatures when compared to the homologous species with 12C, as a consequence of their larger molecular mass.
In this work, 13CH4 was only employed to rule out any potential source of carbon contamination. Some processes were not quantified, such as propane formation or photochemidesorption of species in the 13CH4 experiment. Despite this, similar trends regarding photochemistry and photodesorption were obtained.
4 Astrophysical implications
In the interior of dense clouds, the dust temperature is too low to induce thermal processes, and the interstellar radiation UV field cannot penetrate deep into the cloud. Therefore, secondary UV-photons drive the photolytic processes in these regions (see Sect. 1). This work reports measurements of the UV photon-induced processes over a pure CH4 ice, as a first approximation to a more realistic scenario, in line with previous works that addressed the photon-induced behaviour of pure ice components. Since CH4 is thought to be mainly formed from successive hydrogenation of C atoms (Öberg
et al., 2008), methane might be present in a H2O-rich environment. Intermolecular forces binding CH4 molecules in the ice will obviously depend on the ice mantle composition and this will also affect strongly its photodesorption and photochemistry. For instance, contrary to the case of pure CH4 ice, reported in this paper, CH4 formed by methanol or ethanol ice irradiation is found to photochemidesorb (Cruz-Diaz et al., 2016; Martín-Doménech et al., 2016).
Boogert
et al. (1996); d’Hendecourt
et al. (1996) reported methane abundance in dense interstellar clouds up to 1.9% relative to water. In addition, d’Hendecourt
et al. (1996) estimated a column density of 4.31017 cm-2 toward RAFGL 7009S, a circumstellar environment, representing a 4% abundance relative to water ice. Öberg
et al. (2008) analyzed CH4 abundances toward different low-mass young stellar objects, finding an average value of 5.8% abundance relative to water. CH4 is expected to play a role in the production of COMs in the ISM. From pure CH4 ice irradiation, larger molecules are formed, and eventually ejected to the gas-phase, such as ethane and propane. Complementary experiments are required to gain a better understanding of the behaviour of CH4 in different ice mixtures, such as H2O:CH4 (Martín-Doménech et al., 2016) or CO:CH4 mixtures. In the H2O:CH4 ice irradiation, Martín-Doménech et al. (2016) observed the photon-induced desorption of formaldehyde. Öberg et al. (2010) found that the destruction cross-section of CH4 molecules is increased in a water-rich environment.
Photochemidesorption of C2H6 was found to be about 810-4 molecules per incident photon, while that of C3H8 is 2.410-3 molecules per incident photon. As pure CH4 ice may not be present within interstellar conditions, these values can be taken as upper limits to explain the gas-phase abundance of ethane and propane molecules. On the other hand, pure CH4 is abundant in transneptunian objects (TNOs) such as Triton or Pluto (Owen
et al., 1993, and references therein) and may be a common ice component in outer regions of protoplanetary disks. The composition of Pluto’s atmosphere contains not only N2 and CH4, but also C2H2, C2H4, and C2H6 (Young
et al., 2018). The surface temperature is high enough to allow thermal desorption of CH4, explaining its presence in the gas-phase, while other species require the presence of alternative pathways. Our experiments show that photon-induced processes, as discussed in Wong et al. (2017), can contribute to the processes enriching the gas-phase abundance of C2H6 and C2H2 species, while C2H4 was not detected in the gas-phase. These results qualitatively agree with Pluto observations reported by Young
et al. (2018), which measured C2H6 to be the most abundant hydrocarbon (apart from CH4), followed by C2H2 and C2H4.
Our results can also be extended to the discussion of the evolution of carbon-enriched comets, which contain relatively large abundances of methane molecules, up to 1% relative to water (Mumma & Charnley, 2011). In these objects, photolysis of CH4 gives rise to ethane and acetylene molecules, with cometary abundances ranging from 0.1-2% and 0.09-0.5%, respectively, which were also detected in our experiments. A full study of the evolution with more realistic CH4/H2O cometary ice analog mixtures is required to better constrain the photochemistry in these objects.
5 Conclusions
Lin et al. (2014) and Lo et al. (2015) irradiated CH4 samples, both pure and dispersed in a neon matrix, at 3 K, with monochromatic UV photons at wavelengths ranging from Ly- to 190 nm. In addition to other photoproducts, they reported the formation of C2H6, C2H4 and C2H2 molecules as well as CH and CH radicals. They found CH radicals to react even at 3 K in a CH4:Ne = 1:10.000 matrix. In our experiments, CH radicals were not detected, as their lifetime is not high enough at 8 K. Their irradiation experiments at Ly- wavelengths showed similar abundances to our experiments, C2H6 being the most abundant photoproduct, followed by C2H2 and C2H4. However, since the abundances depend on the wavelength used for irradiation, a different emission spectrum may change the photon-induced desorption processes found in our experiments.
In addition to the monochromatic irradiation of methane samples, Bossa et al. (2015) used a continuum emission hydrogen lamp, similar to our experiments. They deposited samples at 20 K, thus having a phase II methane instead of an amorphous one (Hudson
et al., 2015). They reported the formation of ethane, ethylene and acetylene, but, as in our experiments, radical species were not detected.
Similar photoproducts were found by Abplanalp
et al. (2018), who irradiated methane ices at 5.5 K with keV electrons, monochromatic Ly- photons and continuum emission photons (from 112.7-169.8 nm, or 11.0-7.3 eV) using a deuterium lamp. They reported the presence of radical species and small hydrocarbons measured in the ice by infrared spectroscopy. Additionally, they reported the detection of larger hydrocarbon chains and cyclic species during the warm-up of the samples by time-of-flight mass spectrometry analysis.
Baratta
et al. (2002) reported experiments of a pure CH4 ice irradiated by 30 keV He+ ions and UV photons. They measured the column density of methane, ethane and propane after different irradiation doses. de Barros
et al. (2011) compared the effects of pure CH4 ice processing using different irradiation sources: oxygen MeV ions, protons, -particles and electrons. In this work, we have provided experiments regarding UV-irradiation (from 7.6 eV to 10.8 eV) of pure CH4 ice aiming to study the photon-induced desorption of photoproducts. Ethane molecules were found to account for 54% of the dissociated methane molecules at the beginning of the irradiation. Other photoproducts, such as C3H8 and the progressive formation of a-C:H, account for the rest of C atoms from methane dissociation, although the proportions varied during the irradiation. Propane was not quantified, as its main bands overlap with those of a-C:H, which is formed from the beginning of the irradiation, in agreement with Dartois et al. (2005).
Gerakines et al. (1996) measured the photolysis and formation cross-section of CH4 and C2H6, respectively. They found of methane to be 7.210-19 cm2, while our experiments showed a value of 2.210-18 cm2. The following reasons could explain our higher . First, Gerakines et al. (1996) calculated their value as a function of the incident photon dose, while we took into account the absorption from the ice, thus removing the contribution of low energy UV-photons which are not absorbed by the CH4 ice sample. Additionally, the total flux was estimated in our experiments by in-situ measurements with a Ni-mesh (see González Díaz et al. (2019)) whereas Gerakines et al. (1996) assumed a constant mean flux of 1015 photons cm-2 s-1. Finally, the poorer vacuum conditions in Gerakines et al. (1996) setup could contribute to reduce the photodissociation of CH4 due to background water accretion. of ethane found in our experiments (1.210-18 cm2) is also larger than the one they reported (3.210-19 cm2).
Photodesorption mechanisms were studied for CH4 and its daughter molecules. Dupuy
et al. (2017) found CH4 photodesorption for monochromatic energies above 9.1 eV. However, in agreement with Cruz-Diaz et al. (2014) and Martín-Doménech et al. (2016), no evidence of a significant CH4 photon-induced desorption was found in our work using the MDHL. Indeed, in our experiments, methane molecules are prone to dissociate rather than photodesorb. Recombination of radicals produce ethane and propane molecules, which were found to photochemidesorb. The excess energy released from the formation of photoproducts contributes to their desorption on the top monolayer. The constant ion current obtained for ethane and propane molecules during CH4 ice irradiation supported the photochemidesorption mechanism, as explained in Sect. 3.3. Additionally, C2H2 was found to photodesorb, producing a difference in the ion current of = 25, and 26, when compared to other fragments of the hydrocarbons detected.
acknowledgements
The Spanish Ministry of Science, Innovation and Universities supported this research under grant number AYA2017-85322-R (AEI/FEDER, UE), PhD fellowship FPU-17/03172 and MDM-2017-0737 Unidad de Excelencia "María de Maeztu"– Centro de Astrobiología (CSIC-INTA). G. A. Cruz-Diaz was supported by the National Aeronautics and Space Administration through the NASA Astrobiology Institute under Cooperative Agreement Notice NNH13ZDA017C issued through the Science Mission Directorate.
References
- Abplanalp et al. (2018) Abplanalp M. J., Jones B. M., Kaiser R. I., 2018, Physical Chemistry Chemical Physics (Incorporating Faraday Transactions), 20, 5435
- Andersson & van Dishoeck (2008) Andersson S., van Dishoeck E. F., 2008, A&A, 491, 907
- Baratta et al. (2002) Baratta G. A., Leto G., Palumbo M. E., 2002, A&A, 384, 343
- Bennett et al. (2006) Bennett C. J., Jamieson C. S., Osamura Y., Kaiser R. I., 2006, ApJ, 653, 792
- Bertin et al. (2016) Bertin M., et al., 2016, ApJ, 817, L12
- Boogert et al. (1996) Boogert A. C. A., et al., 1996, A&A, 315, L377
- Boogert et al. (2015) Boogert A. C. A., Gerakines P. A., Whittet D. C. B., 2015, ARA&A, 53, 541
- Bossa et al. (2015) Bossa J. B., Paardekooper D. M., Isokoski K., Linnartz H., 2015, Physical Chemistry Chemical Physics (Incorporating Faraday Transactions), 17, 17346
- Cecchi-Pestellini & Aiello (1992) Cecchi-Pestellini C., Aiello S., 1992, MNRAS, 258, 125
- Cruikshank et al. (1993) Cruikshank D. P., Roush T. L., Owen T. C., Geballe T. R., de Bergh C., Schmitt B., Brown R. H., Bartholomew M. J., 1993, Science, 261, 742
- Cruz-Diaz et al. (2014) Cruz-Diaz G. A., Muñoz Caro G. M., Chen Y. J., Yih T. S., 2014, A&A, 562, A120
- Cruz-Diaz et al. (2016) Cruz-Diaz G. A., Martín-Doménech R., Muñoz Caro G. M., Chen Y. J., 2016, A&A, 592, A68
- Dartois (2005) Dartois E., 2005, Space Sci. Rev., 119, 293
- Dartois et al. (2005) Dartois E., Muñoz Caro G. M., Deboffle D., Montagnac G., d’Hendecourt L., 2005, A&A, 432, 895
- Dupuy et al. (2017) Dupuy R., et al., 2017, A&A, 603, A61
- Fayolle et al. (2013) Fayolle E. C., et al., 2013, A&A, 556, A122
- Fillion et al. (2014) Fillion J.-H., et al., 2014, Faraday Discussions, 168, 533
- Gerakines et al. (1996) Gerakines P. A., Schutte W. A., Ehrenfreund P., 1996, A&A, 312, 289
- González Díaz et al. (2019) González Díaz C., Carrascosa de Lucas H., Aparicio S., Muñoz Caro G. M., Sie N.-E., Hsiao L.-C., Cazaux S., Chen Y.-J., 2019, MNRAS, 486, 5519
- Gredel et al. (1989) Gredel R., Lepp S., Dalgarno A., Herbst E., 1989, ApJ, 347, 289
- Grundy et al. (2016) Grundy W. M., et al., 2016, Science, 351, aad9189
- Hudson et al. (2009) Hudson R. L., Moore M. H., Raines L. L., 2009, Icarus, 203, 677
- Hudson et al. (2015) Hudson R. L., Gerakines P. A., Loeffler M. J., 2015, Physical Chemistry Chemical Physics (Incorporating Faraday Transactions), 17, 12545
- Kaiser & Roessler (1998) Kaiser R. I., Roessler K., 1998, ApJ, 503, 959
- Lacy et al. (1991) Lacy J. H., Carr J. S., Evans Neal J. I., Baas F., Achtermann J. M., Arens J. F., 1991, ApJ, 376, 556
- Lin et al. (2014) Lin M.-Y., Lo J.-I., Lu H.-C., Chou S.-L., Peng Y.-C., Cheng B.-M., Ogilvie J. F., 2014, The Journal of Physical Chemistry A, 118, 3438
- Lo et al. (2015) Lo J.-I., Lin M.-Y., Peng Y.-C., Chou S.-L., Lu H.-C., Cheng B.-M., Ogilvie J. F., 2015, MNRAS, 451, 159
- Lu et al. (2004) Lu H.-C., Chen H.-K., Cheng B.-M., 2004, Analytical chemistry, 76, 5965
- Luna et al. (2017) Luna R., Luna-Ferrándiz R., Millán C., Domingo M., Muñoz Caro G. M., Santonja C., Satorre M. Á., 2017, ApJ, 842, 51
- Martín-Doménech et al. (2015) Martín-Doménech R., Manzano-Santamaría J., Muñoz Caro G. M., Cruz-Díaz G. A., Chen Y. J., Herrero V. J., Tanarro I., 2015, A&A, 584, A14
- Martín-Doménech et al. (2016) Martín-Doménech R., Muñoz Caro G. M., Cruz-Díaz G. A., 2016, A&A, 589, A107
- Martín-Doménech et al. (2018) Martín-Doménech R., Cruz-Díaz G. A., Muñoz Caro G. M., 2018, MNRAS, 473, 2575
- McKay et al. (1997) McKay C. P., Martin S. C., Griffith C. A., Keller R. M., 1997, Icarus, 129, 498
- Moore & Hudson (2003) Moore M. H., Hudson R. L., 2003, Icarus, 161, 486
- Muñoz Caro et al. (2010) Muñoz Caro G. M., Jiménez-Escobar A., Martín-Gago J. Á., Rogero C., Atienza C., Puertas S., Sobrado J. M., Torres-Redondo J., 2010, A&A, 522, A108
- Mumma & Charnley (2011) Mumma M. J., Charnley S. B., 2011, Annual Review of Astronomy and Astrophysics, 49, 471
- Öberg et al. (2008) Öberg K. I., Boogert A. C. A., Pontoppidan K. M., Blake G. A., Evans N. J., Lahuis F., van Dishoeck E. F., 2008, ApJ, 678, 1032
- Öberg et al. (2010) Öberg K. I., van Dishoeck E. F., Linnartz H., Andersson S., 2010, ApJ, 718, 832
- Öberg et al. (2011) Öberg K. I., Boogert A. C. A., Pontoppidan K. M., van den Broek S., van Dishoeck E. F., Bottinelli S., Blake G. A., Evans II N. J., 2011, ApJ, 740, 109
- Okabe (1978) Okabe H., 1978, Photochemistry of small molecules
- Owen et al. (1993) Owen T. C., et al., 1993, Science, 261, 745
- Shen et al. (2004) Shen C. J., Greenberg J. M., Schutte W. A., van Dishoeck E. F., 2004, A&A, 415, 203
- Wong et al. (2017) Wong M. L., et al., 2017, Icarus, 287, 110
- Wu et al. (2012) Wu Y.-J., Wu C. Y. R., Chou S.-L., Lin M.-Y., Lu H.-C., Lo J.-I., Cheng B.-M., 2012, ApJ, 746, 175
- Young et al. (2018) Young L. A., et al., 2018, Icarus, 300, 174
- d’Hendecourt et al. (1986) d’Hendecourt L. B., Allamandola L. J., Grim R. J. A., Greenberg J. M., 1986, A&A, 158, 119
- d’Hendecourt et al. (1996) d’Hendecourt L., et al., 1996, A&A, 315, L365
- de Barros et al. (2011) de Barros A. L. F., Bordalo V., Seperuelo Duarte E., da Silveira E. F., Domaracka A., Rothard H., Boduch P., 2011, A&A, 531, A160
- van Hemert et al. (2015) van Hemert M. C., Takahashi J., van Dishoeck E. F., 2015, Journal of Physical Chemistry A, 119, 6354