Vol.0 (20xx) No.0, 000–000
22institutetext: CAS Key Laboratory for Research in Galaxies and Cosmology, Department of Astronomy, University of Science and Technology of China, Hefei 230026, China; llfan@ustc.edu.cn
33institutetext: School of Astronomy and Space Sciences, University of Science and Technology of China, Hefei, Anhui 230026, People’s Republic of China;
\vs\noReceived 20xx month day; accepted 20xx month day
Local galaxies with compact cores as the possible descendants of massive compact quiescent galaxies at high redshift
Abstract
In order to test a possible evolutionary scenario of high- compact quiescent galaxies (cQGs) that they can survive as local compact cores embedded in local massive galaxies with different morphology classes, we explore the star formation histories of local compact cores according to their spectral analysis. We build a sample of 182 massive galaxies with compact cores () at from SDSS DR7 spectroscopic catalogue. STARLIGHT package is used to analyze the median stacked spectra and derive the stellar ages and metallicities. Our main results show that local compact cores have the average age of about Gyr, indicating their early formation at , which is consistent with the formation redshifts of cQGs at . Together with previous studies, our result that local compact cores have similar formation redshifts as those of high- cQGs, supports that local massive galaxies with compact cores are possible descendants of cQGs. Morphological study of local galaxies with compact cores suggests that there would be multiple possible evolutionary paths for high- cQGs: most of them () will evolve into local massive ETGs according to dry minor merger, while some of them () will build a substantial stellar/gas discs according to the late-time gas accretion and sustaining star formation, and finally grow up to spiral galaxies.
keywords:
galaxies: bulges - galaxies: evolution - galaxies: formation - galaxies: stellar content - galaxies: structure1 Introduction
In the local universe, early-type galaxies (ETGs) are the most massive objects with predominantly old stellar population, indicating that most of their stars were formed at redshift (Renzini 2006). Among a lot of observational scaling relations, ETGs have a remarkably tight luminosity–size/mass–size correlation (Shen et al. 2003; Cappellari et al. 2013). However, massive quiescent galaxies (QGs) at high redshift, which have been considered as the progenitors of local massive ETGs, have been found to deviate from the local mass-size relation, being significantly more compact, by a factor of , than local ETGs endowed with the same stellar mass (Daddi et al. 2005; Trujillo et al. 2006; van Dokkum et al. 2008; Ryan et al. 2012; van de Sande et al. 2013; Fan et al. 2013a, b; Belli et al. 2014, 2017; van der Wel et al. 2014; Straatman et al. 2015).
The dramatic size difference between local ETGs and high- QGs provides an important observational constraint on various models of massive galaxy formation and evolution. The most popular viewpoint is that the compact high- QGs experience a dramatic galaxy size evolution which increase their sizes to catch-up the local mass-size relation. Several physical mechanisms have been proposed to explain such an evolution, including dry major merger (Boylan-Kolchin et al. 2006), dry minor merger (Hopkins et al. 2009a; Naab et al. 2009; Oser et al. 2010; Trujillo et al. 2011) and AGN/supernova feedback (Fan et al. 2008, 2010; Damjanov et al. 2009). However, none of these mechanisms alone can explain the observed size evolution (Hopkins et al. 2010; Trujillo 2013). The predicted size increase by dry major merger is proportional to the stellar mass increase, resulting in moving galaxies along the direction paralleling the local mass-size relation rather than towards it (Boylan-Kolchin et al. 2006; Nipoti et al. 2009). Puff-up due to the massive expulsion of gas by the effect of AGN/supernova feedback predicts a fast size evolution (Ragone-Figueroa & Granato 2011), making it difficult in explaining the old compact QGs ( Gyr). Despite both the cosmological simulations and the observational evidence favor dry minor merger as the main driver of size evolution, there are several works suggesting that it can not be the only mechanism. For instance, there are not enough satellites observed around massive galaxies for dry minor mergers (Mármol-Queraltó et al. 2012) and the size increase is inefficient even assuming a short merger timescale at (Newman et al. 2012).
In additional to a genuine growth of galaxy size, the observed size difference between local ETGs and high- QGs has been explained mainly due to the observational effect, termed progenitor bias (Carollo et al. 2013; Poggianti et al. 2013; Fagioli et al. 2016). In this viewpoint, the arrival of the newly quenched galaxies, which are typically larger than early quenched galaxies, will move the average sizes of ETGs towards the local mass-size relation. However, there is no size difference between young and old QGs at (Zanella et al. 2016), which is inconsistent with the expectation of progenitor bias. Based on the dynamical studies and the reconstruction of star formation histories of QGs, the progenitor bias can contribute about half the increase in average sizes of QGs (Belli et al. 2014, 2015).
All aforementioned works follow the same assumption that the high- compact QGs (cQGs) will evolve into the local ETGs. An inside-out growth of the high- cQGs has been proposed, i.e., compact cores being formed at high and evolving into the local ETGs by adding the extended stellar envelope according to dry minor mergers (Patel et al. 2013; Huang et al. 2013). It is indeed an important and likely major channel for size evolution of the high- cQGs, but is not necessarily the only one. Another potential evolutionary scenario leading from the high- cQGs to the compact cores of local ETGs, lenticular galaxies (S0) and even late-type galaxies (LTGs) has been proposed in recent years (Dullo & Graham 2013; Graham 2013; Graham et al. 2015). To test this new evolutionary scenario, de la Rosa et al. (2016) compared the number density, photometric and dynamic mass-size and mass-density relations between local massive galaxies with compact cores and the high- cQGs. Their results were consistent with the high- cQGs becoming cores of not only local ETGs and S0, but also some LTGs. The latter was consistent with cosmological simulations, which showed that extended star-forming discs can develop around the high- cQGs (Zolotov et al. 2015; Tacchella et al. 2016).
In this paper, we aim to investigate the connection between the high- cQGs and the local massive galaxies with compact cores. We explore the star formation histories (SFHs) of compact cores and compare with the high- cQGs. This paper is organised as follows. In Section 2, we describe the sample selection of local massive galaxies with and without compact cores and the high- cQGs . In Section 3, we show our method of stellar population analysis. We show our main results and discussion in Section 4. In Section 5, we summarize our conclusions. Throughout this paper we assume a standard, flat CDM cosmology (Komatsu et al. 2011), with km s-1, , and .
2 DATA AND SAMPLE SELECTION
2.1 Data description
In order to select the local galaxy sample with and without compact cores, we utilize Sloan Digital Sky Survey (SDSS) Data Release 7 spectroscopic data set (Abazajian et al. 2009). The definitions of core and compact core are the same as in de la Rosa et al. (2016), i.e., core is the bulge component in bulge+disc decomposition of galaxies with all morphologies, while compact core is a core that fulfils the same compactness criterion used for massive compact galaxies at high redshift. The structural parameters of more than one million galaxies in SDSS DR7, such as their bulge and disc sizes, ellipticity, position and inclination angles, have been derived by performing bulge+disc decomposition (Simard et al. 2011; Meert et al. 2015), using the GIM2D software package (Simard et al. 2002). We refer to the effective radius of the decomposed bulge component as . Based on the Simard et al. (2011) photometry catalog, Mendel et al. (2014) presented bulge, disc, and total stellar mass estimates of about 660,000 galaxies with spectroscopic redshifts and successful ugriz bulge+disc decomposition available, via fitting to broadband spectral energy distributions (SEDs). We refer to the estimated bulge stellar mass as .
For high-redshift compact quiescent galaxy sample, we utilize the multiwavelength photometry in all five CANDELS/3D-HST fields (Grogin et al. 2011; Koekemoer et al. 2011; Brammer et al. 2012; Momcheva et al. 2016). We use the Skelton et al. (2014) catalogue, which includes photometric redshifts, rest-frame colors, and stellar population parameters derived by fitting the SED of each galaxy with a linear combination of seven templates via the EAZY code (Brammer et al. 2009). The stellar masses are derived by fitting the SEDs using the FAST code (Kriek et al. 2009) based on the Bruzual, & Charlot (2003) stellar population synthesis (SPS) models with the Chabrier (2003) initial mass function (IMF) and solar metallicity. The effective radii of those galaxies are taken from the work of van der Wel et al. (2014), which are measured with GALFIT package (Peng et al. 2002, 2010). For our sample, we use the effective radii measured with the /WFC3 images.
2.2 Sample selection
2.2.1 Local galaxies with and without compact cores
Beginning with Mendel et al. (2014) catalogue, we select the local galaxy sample with compact cores following several steps. The basic idea is similar to that in de la Rosa et al. (2016). We summarize our selection steps as follows:
-
1.
Galaxies with uncertain structural decomposition, defined by using the parameter dBD, are firstly excluded.
-
2.
Those galaxies showing anomalous bulge+disc decomposition, tagged as Tpye 4 in the Mendel et al. (2014) catalog, are also excluded.
-
3.
Disc inclination angle is set to 60 degrees, in order to minimize internal disc extinction on the bulge light.
-
4.
Bulge ellipticity is selected to be , in order to avoid strong bars.
-
5.
Those galaxies with their effective radii of galaxies larger than 80 percent of the point spread function (PSF) are selected, in order to exclude the poorly resolved galaxies.
-
6.
The redshift range is set to 0.02 0.06, where the 3 aperture of the SDSS spectroscopic fibre covers the physical size kpc, roughly corresponding to the effective radii of massive cQGs at .
Finally, we select massive galaxies with compact cores. We adopt the compactness criterion of the van Dokkum et al. (2015) definition:
| (1) |
We adopt the definition of circularized effective radius as , where is the semi-major effective radius and is the axial ratio of the galaxy. By imposing these seven selection criteria, the final sample includes 182 objects.
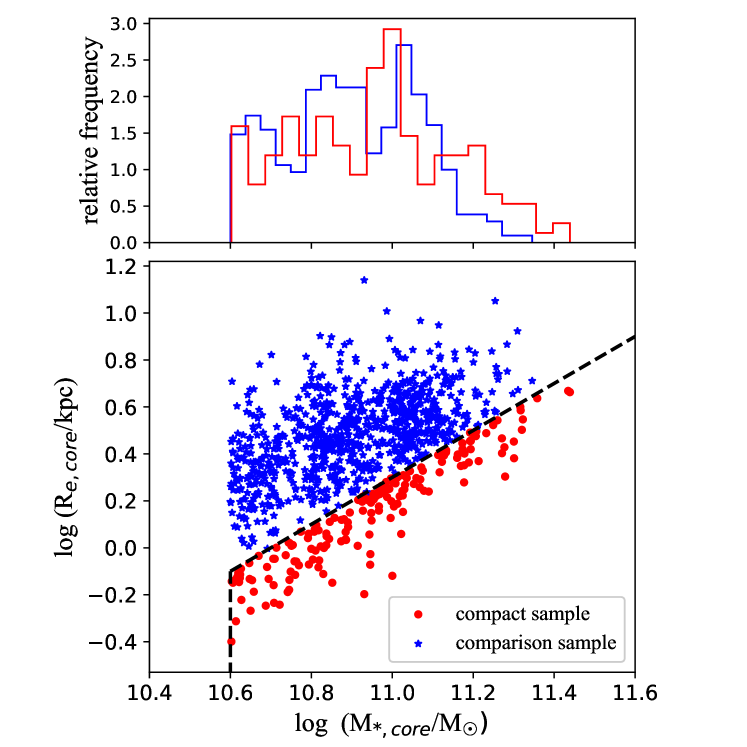
We also build a comparison sample of galaxies without compact cores. For each galaxy with compact core, we select five comparison galaxies which fulfill the first six selection criteria presented before and have similar stellar masses ( dex). In the lower panel of Figure 1, we plot the mass-size distributions of local galaxies with compact cores and the galaxies in the comparison sample. The black dashed line shows the compactness criterion of the van Dokkum et al. (2015) definition. In the upper panel, we compare the stellar mass distributions of these two samples.
2.2.2 Massive compact quiescent galaxies at
As we propose to test the possible evolutionary connection between the local massive galaxies with compact cores and the high- cQGs, we need to construct the massive cQG sample at . We follow the similar selection criterion presented in Fang et al. (2015) and Lu et al. (2019) to select the high- cQGs. Firstly, we select massive quiescent galaxies with log at by using the rest-frame and colors (Wuyts et al. 2007; Williams et al. 2010):
| (2) |
Secondly, we select those massive quiescent galaxies utilizing the compactness criterion of the van Dokkum et al. (2015) definition. Finally, we obtain a sample with 483 massive cQGs at .
3 Stellar population analysis
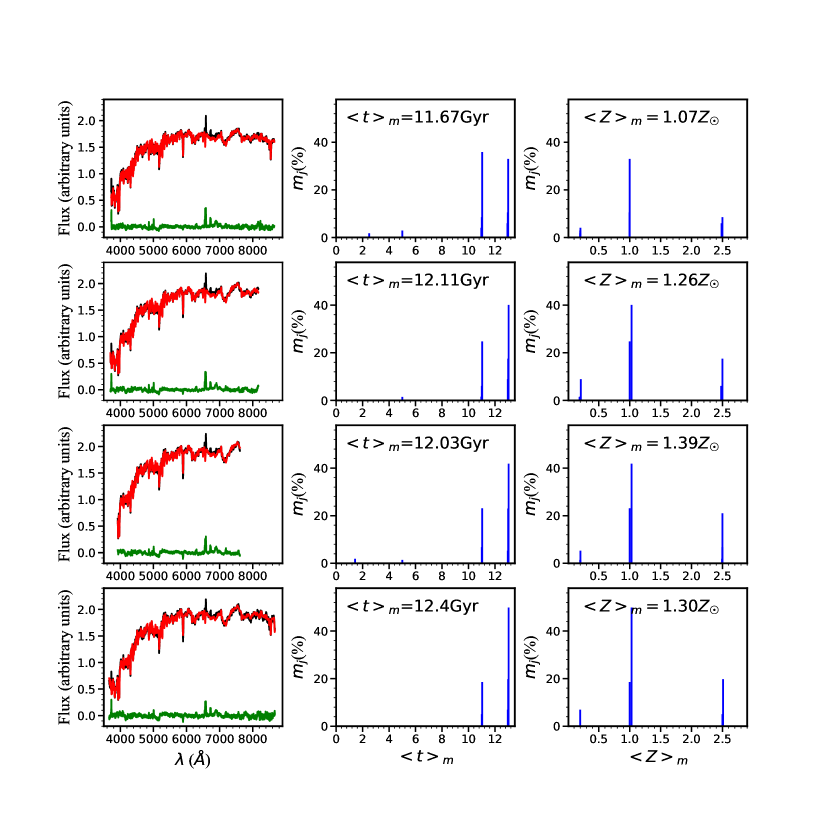
Using the full-spectrum fitting code STARLIGHT (Cid Fernandes et al. 2005) 111https://www.starlight.ufsc.br, which provides a fit to both galaxy continuum and spectral features, we fit the SDSS spectra of our local galaxy sample with compact cores and the comparison sample to derive their stellar population properties. The bases of STARLIGHT are single stellar population (SSP) templates with a grid of ages and metallicities. To use STARLIGHT, we create a spectral library containing 45 SSPs from BC03 (Bruzual, & Charlot 2003) theoretical models, with 15 different ages ranging from 1 Myr to 13 Gyr and 3 different metallicities . We adopt Chabrier (2003) IMF and Galactic extinction law (Cardelli & Clayton & Mathis 1989) with RV = 3.1.
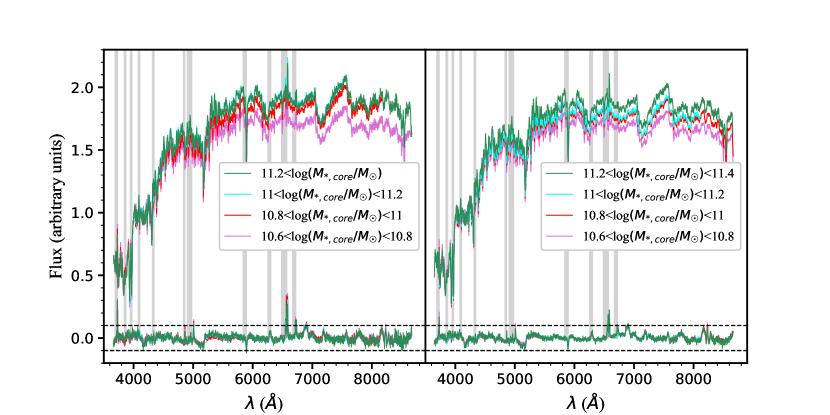
In order to increase the signal-to-noise (S/N) of the input spectra, we work on the median stacked spectra derived for four mass bins: 10.6 10.8, 10.8 , and . We obtain the median stacked spectra following the same method presented in the work of Citro et al. (2016). Here we summarize the main steps. Firstly, we shift each individual spectrum to rest-frame. Then we normalize each spectrum at rest-frame 5000Å, where no strong absorption features are presented. Thirdly, we compute the median flux by interpolating the common wavelengths. Wavelength regions of some strong emission lines have been masked out (see gray shaded regions in Figure 2). We define the median stacked flux error as MAD/, where MAD222MAD=1.48median(X)), the details can be found in Hoaglin et al. (1983). is the median absolute deviation and is the number of objects at each wavelength.
4 RESULTS AND DISCUSSION
4.1 Ages and Metallicities
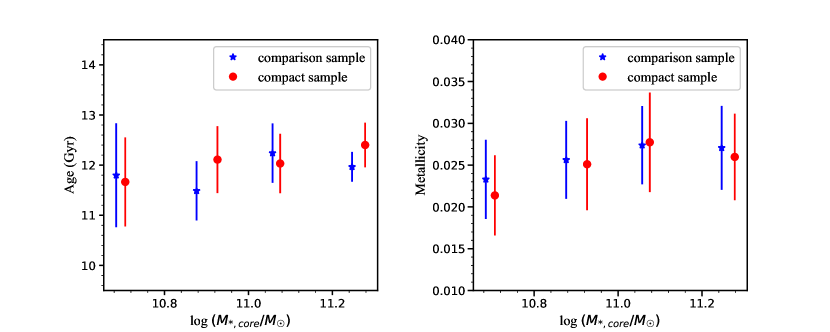
By using STARLIGHT fitting on the stacked spectra, we derive the mass-weighted ages and metallicities of both the local massive galaxy sample with compact cores and the comparison sample (see Figure 4). The derived mass-weighted ages of local massive galaxies with compact cores vary from to Gyr, which are consistent with previous works at similar redshifts (Thomas et al. 2010; Conroy et al. 2014; Citro et al. 2016). Our results suggest that these compact cores have been formed at . There is a weak evolutionary trend, with mass-weighted ages increasing systematically with stellar masses. This trend is in agreement with the downsizing scenario of galaxy evolution (Cowie et al. 1996; Pérez-González et al. 2008; Fontanot et al. 2009). We also find that metallicities correlate with stellar masses, well known as mass-metallicity relation (Tremonti et al. 2004). The relation gets flattened at the high mass end as shown in the previous works (Tremonti et al. 2004; Gallazzi et al. 2005). Compared to local massive galaxies with compact cores, those galaxies without compact cores show the age varying from to Gyr and the metallicity from 0.023 to 0.028. Considering the large uncertainties, we suggest that there is no obvious difference of ages and metallicities between local massive galaxy sample with compact cores and the comparison sample. This suggests that the massive cores of local galaxies are formed early, regardless of their compactness.
4.2 Local galaxies with compact cores as the possible descendants of high- cQGs
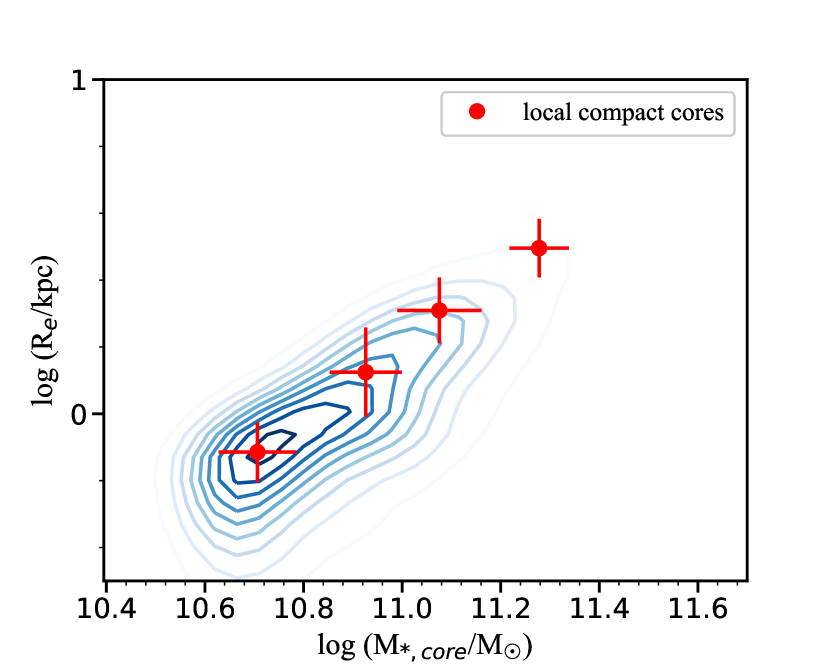
The main motivation of this paper is to test the possibility of local massive galaxies with compact cores as the potential descendants of massive compact galaxies at . In Figure 5, we plot the mass-size distributions of local compact cores and cQGs at . For local compact cores, we use stellar masses and effective radii of compact cores, while we use those of the entire galaxies for cQGs at . At the given stellar masses, local compact cores show the similar sizes to those of high- cQGs. In particular, mass-size relations of local compact cores and high- cQGs show the similar slope (de la Rosa et al. 2016), where the definition of follows . We notice that the value of is the observational result for high- cQGs, while it is driven by the choice of our compactness criterion of van Dokkum et al. (2015). For local massive ETGs, the slope is different, varying from to (Shen et al. 2003; Semyeong et al. 2017).
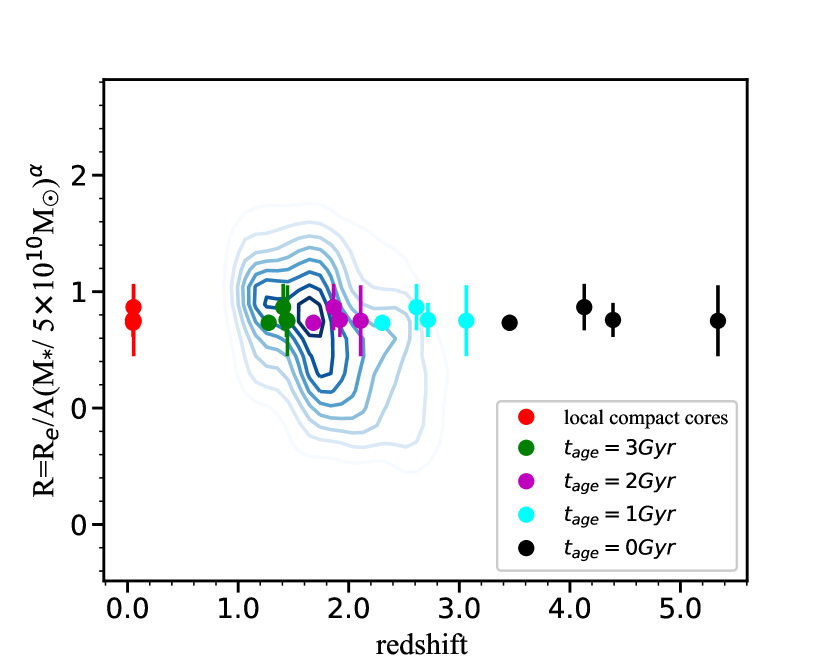
In Figure 6, we plot the normalized radii of local compact cores with different ages and high- cQGs as a function of redshift. The normalized radius has been defined as (e.g., van der Wel et al. 2014), where and . With the derived mass-weighted ages, the formation redshifts of local compact cores (see black symbols in Figure 6) have been suggested to be at . Considering the derived stellar ages of cQGs at ranging from 1 to 3 Gyr (Damjanov et al. 2009; Belli et al. 2015), the formation redshifts of high- cQGs will be in the range of , which is widely consistent with those of local compact cores. Assuming that local compact cores will evolve passively and have no size evolution after their formation, their normalized radii will keep constant. Cyan, purple and green points represent stellar ages of 1 Gyr, 2 Gyr and 3 Gyr after the formation of local compact cores. The normalized radii of local compact cores with stellar ages of 13 Gyr matches well with the observed values of cQGs at , which indicates that local compact cores are possible descendants of high- cQGs.
4.3 Morphology
If local massive galaxies with compact cores are possible descendants of high- cQGs, a relevant question is what kind of morphological types those galaxies will have. Following the same method as presented in de la Rosa et al. (2016), we classify local massive galaxies with compact cores into four morphology classes: Elliptical (Ell), lenticular (S0), Sab and Scd. According to the automated morphological classification based on support vector machines provided by Huertas-Company et al. (2011), the probability of each galaxy morphology type has been given. With a simple linear model, these probabilities can be converted into the T-type classification scheme (Meert et al. 2015). By using the definition of the galaxy morphology classes in terms of T-type (Meert et al. 2015), each local galaxy with compact core can be flagged with one of four morphology classes.
In Table 1, we present the morphology classification result of local massive galaxies with compact cores. Over 80% of them host in elliptical and lenticular galaxies. However, there is still a non-negligible fraction () of compact cores hosting in the early-type spiral galaxies (Sab). Only a few () of them host in the late-type spiral galaxies (Scd). If the scenario that the high- cQGs survive as compact cores in the local universe is correct, there would be multiple possible evolutionary paths for high- cQGs. By building an extended wing according to dry minor merger (Hopkins et al. 2009a; Naab et al. 2009; Patel et al. 2013), most of high- cQGs will evolve into local massive ETGs with “normal sizes”, which match the local mass-size relation (Shen et al. 2003). Some of them build a substantial stellar/gas disc according to the late-time gas accretion and sustaining star formation, and finally grow up to spiral galaxies.
| Class | Definition | Fraction |
|---|---|---|
| Elliptical | T-type | 39.6 |
| S0 | T-type 0.5 | 42.3 |
| Sab | 0.5 T-type 4 | 15.4 |
| Scd | T-type 4 | 2.7 |
5 SUMMARY AND CONCLUSIONS
Recent discoveries of high- cQGs provide a testbed for the different scenarios of massive galaxy evolution. Most studies in the literature proposed different evolutionary mechanisms under the assumption that the high- cQGs will evolve into the local ETGs. However, another potential evolutionary scenario has been recently proposed that the high- cQGs can survive as compact cores hosting in local massive galaxies with different morphology classes. In this paper, we try to test this scenario by exploring the star formation histories of local massive compact cores according to their spectral and morphological analysis. We build a sample of 182 massive galaxies with compact cores () at from SDSS DR7 spectroscopic catalogue. The narrow redshift range is selected to ensure the observed spectra coming from the central kpc region, which is about the average effective radius size of high- cQGs.
The sample is divided into four bins with increasing core masses and their median stacked spectra have been obtained. STARLIGHT package is used to analyze the median stacked spectra and derive the stellar ages and metallicities. Our main results show that local compact cores have old ages with the average age of about 12 Gyr, indicating their early formation at , which is consistent with the formation redshifts of cQGs at . Assuming that compact cores will evolve passively and have no size evolution after their formation, they will have the similar stellar ages (1-3 Gyr) and compact sizes as those of observed cQGs at . Combined with the results presented in de la Rosa et al. (2016), who found that local compact cores have the similar structure and abundance as those of high- cQGs, our study supports the evolutionary scenario that high- cQGs survive as compact cores and embedded in the center of local massive galaxies. Morphological study of local galaxies with compact cores suggests that there would be multiple possible evolutionary paths for high- cQGs: most of high- cQGs will evolve into local massive ETGs by dry minor merger, while some of them build a substantial stellar/gas disc according to the late-time gas accretion and sustaining star formation, and finally grow up to spiral galaxies.
Acknowledgements.
We thank the anonymous referee for constructive comments and suggestions. This work is supported by National Key R&D Program of China (No. 2017YFA0402703). LF acknowledges the support from the National Natural Science Foundation of China (NSFC, Grant Nos. 11822303 and 11773020) and Shandong Provincial Natural Science Foundation, China (ZR2017QA001, JQ201801). YG thanks Dr. Z. Pan for the valuable discussion. Funding for the SDSS and SDSS-II has been provided by the Alfred P. Sloan Foundation, the Participating Institutions, the National Science Foundation, the U.S. Department of Energy, the National Aeronautics and Space Administration, the Japanese Monbukagakusho, the Max Planck Society, and the Higher Education Funding Council for England. The SDSS Web Site is http://www.sdss.org/. The SDSS is managed by the Astrophysical Research Consortium for the Participating Institutions. The Participating Institutions are the American Museum of Natural History, Astrophysical Institute Potsdam, University of Basel, University of Cambridge, Case Western Reserve University, University of Chicago, Drexel University, Fermilab, the Institute for Advanced Study, the Japan Participation Group, Johns Hopkins University, the Joint Institute for Nuclear Astrophysics, the Kavli Institute for Particle Astrophysics and Cosmology, the Korean Scientist Group, the Chinese Academy of Sciences (LAMOST), Los Alamos National Laboratory, the Max-Planck-Institute for Astronomy (MPIA), the Max-Planck-Institute for Astrophysics (MPA), New Mexico State University, Ohio State University, University of Pittsburgh, University of Portsmouth, Princeton University, the United States Naval Observatory, and the University of Washington.References
- Abazajian et al. (2009) Abazajian, K. N., Adelman-McCarthy, J. K., Agüeros, M. A., et al. 2009, ApJS, 182, 543
- Belli et al. (2014) Belli, S., Newman, A. B., Ellis, R. S., et al. 2014, ApJ, 788, L29
- Belli et al. (2015) Belli, S., Newman, A. B., & Ellis, R. S. 2015, ApJ, 799, 206
- Belli et al. (2017) Belli, S., Newman, A. B., & Ellis, R. S. 2017, ApJ, 834, 18
- Boylan-Kolchin et al. (2006) Boylan-Kolchin, M., Ma, C.-P., & Quataert, E. 2006, MNRAS, 369, 1081
- Brammer et al. (2009) Brammer, G. B., Whitaker, K. E., van Dokkum, P. G., et al. 2009, ApJ, 706, L173
- Brammer et al. (2012) Brammer, G. B., van Dokkum, P. G., Franx, M., et al. 2012, ApJS, 200, 13
- Bruzual, & Charlot (2003) Bruzual, G., & Charlot, S. 2003, MNRAS, 344, 1000
- Cappellari et al. (2013) Cappellari, M., McDermid, R. M., Alatalo, K., et al. 2013, MNRAS, 432, 1862
- Cardelli & Clayton & Mathis (1989) Cardelli J.A.,Clayton G.C.,Mathis J.S., 1989, ApJ, 345, 245
- Carollo et al. (2013) Carollo, C. M., Bschorr, T. J., Renzini, A., et al. 2013, ApJ, 773, 112
- Chabrier (2003) Chabrier G., 2003, PASP,115,763
- Cid Fernandes et al. (2005) Cid Fernandes, R., Mateus, A., Sodr, L., Stasiska, G., & Gomes, J. M., 2005, MNRAS, 358, 363
- Citro et al. (2016) Citro, A., Pozzetti, L., Moresco, M.,Cimatti, A., 2016, ApJ, 592A, 19C
- Conroy et al. (2014) Conroy, C., Graves, G. J., & van Dokkum, P. G. 2014, ApJ, 780, 33
- Cowie et al. (1996) Cowie, L. L., Songaila, A., Hu, E. M., et al. 1996, AJ, 112, 839
- Daddi et al. (2005) Daddi,E.,Renzini,A.,Pirzkal,N., 2005, ApJ, 626, 680
- Damjanov et al. (2009) Damjanov,I.,McCarthy,P.J.,Abraham,R.G., et al. 2009, ApJ, 695, 101
- de la Rosa et al. (2016) de la Rosa, I. G., La Barbera, F., Ferreras, I., et al. 2016, MNRAS, 457, 1916
- Dullo & Graham (2013) Dullo,B.,& Graham,A.W., 2013, ApJ, 768, 36
- Fagioli et al. (2016) Fagioli, M., Carollo, C. M., Renzini, A., et al. 2016, ApJ, 831, 173
- Fan et al. (2008) Fan, L., Lapi, A., De Zotti, G., Danese, L., 2008, ApJ, 689, L101
- Fan et al. (2010) Fan, L., Lapi, A., Bressan, A., et al. 2010, ApJ, 718, 1460
- Fan et al. (2013a) Fan, L., Chen, Y., Er, X., et al. 2013, MNRAS, 431, L15
- Fan et al. (2013b) Fan, L., Fang, G., Chen, Y., et al. 2013, ApJ, 771, L40
- Fang et al. (2015) Fang, G., Ma, Z., Kong, X., et al. 2015, ApJ, 807, 139
- Fontanot et al. (2009) Fontanot, F., De Lucia, G., Monaco, P., et al. 2009, MNRAS, 397, 1776
- Gallazzi et al. (2005) Gallazzi, A., Charlot, S., Brinchmann, J., et al. 2005, MNRAS, 362, 41
- Graham (2013) Graham, A. W. 2013, Planets, Stars and Stellar Systems. Volume 6: Extragalactic Astronomy and Cosmology, 91
- Graham et al. (2015) Graham, A. W., Dullo, B. T., & Savorgnan, G. A. D. 2015, ApJ, 804, 32
- Grogin et al. (2011) Grogin, N. A., Kocevski, D. D., Faber, S. M., et al. 2011, ApJS, 197, 35
- Hoaglin et al. (1983) Hoaglin, D. C., Mosteller, F., & Tukey, J. W., 1983, Understanding robust and exploratory data anlysis
- Hopkins et al. (2009a) Hopkins, P. F., Hernquist, L., Cox, T. J., et al. 2009, ApJ, 691, 1424
- Hopkins et al. (2010) Hopkins, P. F., Bundy, K., Hernquist, L., et al. 2010, MNRAS, 401, 1099
- Huang et al. (2013) Huang, S., Ho, L. C., Peng, C. Y., et al. 2013, ApJ, 768, L28
- Huertas-Company et al. (2011) Huertas-Company, M., Aguerri, J.A.L., Bernardi, M., Mei, S., 2011, A&A, 525, 157
- Komatsu et al. (2011) Komatsu, E., Smith, K. M., Dunkley, J., et al. 2011, ApJS, 192, 18
- Koekemoer et al. (2011) Koekemoer, A. M., Faber, S. M., Ferguson, H. C., et al. 2011, ApJS, 197, 36
- Kriek et al. (2009) Kriek, M., van Dokkum, P. G., Franx, M., et al. 2009, ApJ, 705, L71
- Lu et al. (2019) Lu, S.-Y., Gu, Y.-Z., Fang, G.-W., et al. 2019, Research in Astronomy and Astrophysics, 19, 150
- Mármol-Queraltó et al. (2012) Mármol-Queraltó, E., Trujillo, I., Pérez-González, P. G., et al. 2012, MNRAS, 422, 2187
- Meert et al. (2015) Meert, A., Vikram, V., & Bernardi, M. 2015, MNRAS, 446, 3943
- Mendel et al. (2014) Mendel,J.T., Simard,L., Palmer,M., Ellison,S.L., Patton,D.R. 2014, ApJS, 210, 3
- Momcheva et al. (2016) Momcheva, I. G., Brammer, G. B., van Dokkum, P. G., et al. 2016, ApJS, 225, 27
- Naab et al. (2009) Naab, T.,Johansson, P.H.,& Ostriker,J.P., 2009, ApJ,699,L178
- Newman et al. (2012) Newman, A. B., Ellis, R. S., Bundy, K., et al. 2012, ApJ, 746, 162
- Nipoti et al. (2009) Nipoti, C., Treu, T., Auger, M. W., et al. 2009, ApJ, 706, L86.
- Oser et al. (2010) Oser, L., Ostriker, J. P., Naab, T., et al. 2010, ApJ, 725, 2312
- Patel et al. (2013) Patel, S. G., van Dokkum, P. G., Franx, M., et al. 2013, ApJ, 766, 15
- Peng et al. (2002) Peng, C. Y., Ho, L. C., Impey, C. D., et al. 2002, AJ, 124, 266
- Peng et al. (2010) Peng, C. Y., Ho, L. C., Impey, C. D., et al. 2010, AJ, 139, 2097
- Pérez-González et al. (2008) Pérez-González, P. G., Rieke, G. H., Villar, V., et al. 2008, ApJ, 675, 234
- Poggianti et al. (2013) Poggianti, B. M., Moretti, A., Calvi, R., et al. 2013, ApJ, 777, 125
- Ragone-Figueroa & Granato (2011) Ragone-Figueroa, C., & Granato, G. L. 2011, MNRAS, 414, 3690.
- Renzini (2006) Renzini, A. 2006, ARA&A, 44, 141
- Ryan et al. (2012) Ryan, R. E., McCarthy, P. J., Cohen, S. H., et al. 2012, ApJ, 749, 53
- Semyeong et al. (2017) Semyeong, OH., Jenny, E.G., Claire, N.L., 2017, ApJ,836,115O
- Shen et al. (2003) Shen, S., Mo, H.J., Simon, D.M. et al. , 2003, MNRAS, 343, 978
- Simard et al. (2002) Simard, L., Willmer, C. N. A., Vogt, N. P., et al. 2002, ApJS, 142, 1
- Simard et al. (2011) Simard,L.,Mendel,J.T., Patton,D.R., Ellison,S.L., McConnachie,A.W., 2011, ApJS, 196, 11
- Skelton et al. (2014) Skelton, R. E., Whitaker, K. E., Momcheva, I. G., et al. 2014, ApJS, 214, 24
- Straatman et al. (2015) Straatman, C. M. S., Labbé, I., Spitler, L. R., et al. 2015, ApJ, 808, L29
- Tacchella et al. (2016) Tacchella, S., Dekel, A., Carollo, C. M., et al. 2016, MNRAS, 458, 242
- Thomas et al. (2010) Thomas, D., Maraston, C., Schawinski, K., et al. 2010, MNRAS, 404, 1775
- Tremonti et al. (2004) Tremonti, C. A., Heckman, T. M., Kauffmann, G., et al. 2004, ApJ, 613, 898
- Trujillo et al. (2006) Trujillo,I.,Frster Schreiber, N.M., Rudnick,G., et al. 2006, ApJ, 650, 18
- Trujillo et al. (2011) Trujillo, I., Ferreras, I., & de La Rosa, I. G. 2011, MNRAS, 415, 3903
- Trujillo (2013) Trujillo, I. 2013, The Intriguing Life of Massive Galaxies, 27
- van de Sande et al. (2013) van de Sande, J., Kriek, M., Franx, M., et al. 2013, ApJ, 771, 85
- van der Wel et al. (2014) van der Wel, A., Franx, M., van Dokkum, P. G., et al. 2014, ApJ, 788, 28
- van Dokkum et al. (2008) van Dokkum,P.G., Franx,M.,Kriek,M.,et al. 2008, ApJ, 677, L5
- van Dokkum et al. (2015) van Dokkum,P.G.,Nelson,E.J.,Franx,M.,Kriek,M.,et al. 2015, ApJ, 813, 23
- Williams et al. (2010) Williams, R. J., Quadri, R. F., Franx, M., et al. 2010, ApJ, 713, 738
- Wuyts et al. (2007) Wuyts, S., Labbé, I., Franx, M., et al. 2007, ApJ, 655, 51
- Zanella et al. (2016) Zanella, A., Scarlata, C., Corsini, E. M., et al. 2016, ApJ, 824, 68
- Zolotov et al. (2015) Zolotov, A., Dekel, A., Mandelker, N., et al. 2015, MNRAS, 450, 2327