Molecular Oxygen in the nearest QSO Mrk 231
Abstract
We report the detection of an emission feature at the 12 level with FWHM line width of about 450 km s-1 toward the nearest quasi-stellar object, QSO Mrk 231. Based on observations with the IRAM 30 m telescope and the NOEMA Interferometer, the - transition of molecular oxygen is the likely origin of line with rest frequency close to 118.75 GHz. The velocity of the O2 emission in Mrk 231 coincides with the red wing seen in CO emission, suggesting that it is associated with the outflowing molecular gas, located mainly at about ten kpc away from the central AGN. This first detection of extragalactic molecular oxygen provides an ideal tool to study AGN-driven molecular outflows on dynamic time scales of tens of Myr. O2 may be a significant coolant for molecular gas in such regions affected by AGN-driven outflows. New astrochemical models are needed to explain the implied high molecular oxygen abundance in such regions several kpc away from the center of galaxies.
1 Introduction
As the third most abundant element in the universe after hydrogen and helium, oxygen and its chemistry in dense interstellar clouds are important for understanding the properties of molecular gas (Goldsmith et al., 2011; Hollenbach et al., 2009). Due to the attenuation of earth’s atmosphere, it is impossible to observe O2 lines near their rest frequencies from the ground. Searches for O2 emission in the Milky Way have been carried out from orbital observatories including the Submillimeter Wave Astronomy Satellite (SWAS) (Goldsmith et al., 2000, 2002), Odin (Liseau et al., 2005; Larsson et al., 2007), and Herschel (Goldsmith et al., 2011; Liseau et al., 2012). Based on observations with those space missions (SWAS, Odin, and Herschel), the [O2]/[H2] abundance ratios in dense gas regions are more than two orders of magnitude lower than predictions from pure gas-phase chemical models (Langer & Graedel, 1989; Bergin et al., 1998), to . Because of its low abundance and weak line emission, O2 is believed not to be an important coolant of the gas in dense molecular clouds.
The O2 line in extragalactic sources is red-shifted away from the attenuation of the Earth’s atmosphere, and thus can be observed with ground-based millimeter facilities. However, none of the observations detected O2 emission in the galaxies observed (Liszt, 1985; Goldsmith & Young, 1989; Combes et al., 1991; Frayer et al., 1998; Kanekar & Meier, 2015) in the past two decades, with the best [O2]/[H2] upper limit being 110-6 in NGC 6240 at the 1 level (Combes et al., 1991), while the non-detection of absorption features toward a foreground galaxy in front of the BL Lac object B0218+357 give an upper limit of 210-7 at the 1 level (Combes et al., 1997). Although the freeze-out of oxygen carriers, particularly H2O, onto dust grains is generally cited as the explanation for the lack of gas-phase O2, a comprehensive picture of oxygen chemistry in different interstellar environments is still missing.
The enhancement of O2 emission in Orion (Goldsmith et al., 2011; Chen et al., 2014) is best explained by recent passage of a shock, while the AGN-driven molecular outflow can produce continuous shocks in associated molecular clouds. Thus, Mrk 231 is a good choice to search for extragalactic O2 emission. At a distance of 172 Mpc (Fischer et al., 2010), Mrk 231 is the nearest QSO and the most luminous ULIRG (Ultra-Luminous InfraRed Galaxy, in the local universe (Feruglio et al., 2010). It contains high velocity molecular outflows revealed by far infrared OH absorption (Fischer et al., 2010), and millimeter emission of CO (Feruglio et al., 2010; Cicone et al., 2012) and is observed in dense gas tracers (Aalto et al., 2012). The molecular mass outflow rate in Mrk 231 is estimated to be 700 /year based on CO J=1-0 observations, which is higher than the star formation rate of 200 /yr (Feruglio et al., 2010).
The O2 =- transition with rest frequency 118.750343 GHz, is free from contamination by known nearby lines (Sandqvist et al., 2008). This spectral line, which can be observed toward local galaxies with red shift greater than 0.025 using ground based millimeter-wavelength facilities, is the best choice for a search for extragalactic molecular oxygen among O2 transitions. It was also the choice for the previous searches for extra-galactic O2 emission referred to above.
In this paper, we describe the observations and data reduction in §2, present the main results in §3, discuss the results in §4, and give as brief summary and discuss future prospects in §5.
2 Observations and data reduction
2.1 Observation with IRAM 30 meter telescope and data reduction
The observations were carried out from August 20 to 23, 2015, with the IRAM 30m telescope in good weather conditions with precipitable water vapor (pwv) less than 4mm (Project id: 068-15, PI: Junzhi Wang). The Eight MIxer Receiver (EMIR) with dual polarizations, Fast Fourier Transform Spectrometer (FTS) backend, and standard wobbler switching mode at 0.5Hz with offset beam throw, were used toward Mrk 231 pointing at RA=12:56:14.2 DEC=+56:52:25.0 (J2000). The beam size of the IRAM 30m telescope at the observing frequency (114 GHz) is about 23′′. In order to verify that the signal is from the sky rather than being radio-frequency interference (RFI) at the IF frequency or from the backend, four local oscillator (LO) tuning setups were used during the observations, which are 103.77 GHz, 103.87 GHz, 103.57 GHz, and 103.07 GHz for August 20, 21, 22, 23, respectively. We dumped the data every 1.7 minutes as one scan, and did one calibration observation every 6 scans. The CLASS package GILDAS 111http://www.iram.fr/IRAMFR/GILDAS was used for data reduction. During the data reduction, we checked the spectrum of each scan and dropped scans with bad baseline and/or hot spots in some channels, which comprised about 5% of the total data. We combined the data from all four days to obtain the final spectrum weighted by the rms of each individual scan. The rms of the final spectrum is 0.38 mK in Tmb after smoothing to the velocity resolution of 98.7 km s-1, while the total effective observing time (on+off) is 408 minutes.
2.2 Observations with NOEMA and data reduction
The NOEMA observations were carried out on December 1 and 3, 2017, (Project id: d17ae001, PI: Junzhi Wang) under good weather conditions with the same pointing center as that of IRAM 30m observation in 2015. The frequency coverage of upper side band (USB) is from about 108.2 GHz to 116.2 GHz, which covers the redshifted CN 1-0, CO 1-0, O2, and HC3N =13-12 lines. The original frequency resolution was 2 MHz, which corresponds to 5.26 km s-1 at 114 GHz. On Dec 1, 3C84 was used as flux and bandpass calibrator, while 1300+580 and 1150+497 were used as phase calibrators, with 7 antennae in the array and a total of 2.6 hours time on Mrk 231. There were two observing blocks on Dec 3 using 3C273 as flux and bandpass calibrator while the phase calibrators were again 1300+580 and 1150+497. One block was done with 8 antennae in the array and a total of 0.8 hours on Mrk 231, while the other was done with 9 antennae in the array and a total of 3.8 hours on Mrk 231.
After accounting for bandpass, flux, phase and amplitude calibrations for the visibility data with ‘CLIC’ in GILDAS, we carried out imaging and deconvolving with both ‘MAPPING’ in GILDAS and also CASA. The final results from both software packages are consistent. The images and spectra presented in this paper were done with CASA after smoothing to 10 MHz frequency resolution corresponding to a velocity resolution of 26.3 km s-1, and giving a slightly noncircular beam of 3.63 with =.
3 Results
3.1 Detection of O2 =- emission with the IRAM 30 meter telescope
An emission feature was detected at about the 12 level, which we identify as O2 =- emission with similar velocity range to that of the red wing of outflowing gas observed in CO =1-0. The velocity range of this feature is about 150 to 650 km s-1 (see Figure 1). The frequency resolution of the spectrum shown in Figure 1 is 37.5 MHz, which corresponds to 98.7 km s-1 at 113.945 GHz for the O2 =- line with =0.04217 (Bryant & Scoville, 1996; Carilli, Wrobel & Ulvestad, 1998). This red shift corresponds to 12642 km s-1 as the optically-defined velocity for this galaxy from NASA/IPAC Extragalactic Database (NED, http://ned.ipac.caltech.edu).
The velocity integrated flux of O2 =- emission is 0.88 K km s-1, which corresponds to 4.4 Jy km s-1 with the conversion factor of 5.0 from K to Jy. The error of 0.07 K km s-1 is from single component Gaussian fitting for the spectrum, while there will be about 20% more uncertainties due to absolute flux calibration which should be considered if comparing with different observations. The flux of detected O2 emission in Mrk 231 is comparable to that of the red wing of CO 1-0 previously detected (Cicone et al., 2012), which is 2.32 Jy km s-1. Our CO =1-0 data obtained simultaneously with the O2 in our IRAM 30 m observations provided similar results for the red wing of CO 1-0, with similar flux level and velocity range (see Figure 1). In addition to O2 =- line, we also detect HC3N =13-12 line, at a significance of 8 . This line is at 1200 km s-1 in the Figures since the O2 =- frequency corrected central velocity of the galaxy was used as reference frequency. The data are shown at higher velocity resolution and wider velocity coverage in Figure 2.
Since the on-source times on Aug 20 and 21 are about half of those on Aug 22 and Aug 23, and the system temperatures on Aug 20 and 21 are higher than those on Aug 22 and 23, most of which are lower than 300 K, the main contributions to the final spectrum are from the data on Aug 22 and 23. We present the data of Aug 22 and 23 as the two spectra in Figure 3. Even though the noise levels of the two spectra are much higher than the 4-day combined spectrum, the two emission features, especially the one in the range 100 to 800 km s-1, can be seen in the individual spectra shown in Figure 3. On the other hand, due to very little on-source time in Aug 20 and 21 without any emission signature, the spectra are not shown here.
3.2 Emission features confirmed with the NOEMA interferometer
The single dish detections of O2 =- and HC3N =13-12 emission in Mrk 231 were confirmed with observations using the NOrthern Extended Millimeter Array (NOEMA). O2 =- emission detected with the NOEMA extends to (1′′=0.87kpc for Mrk 231) from the center of galaxy (see Figure 4). After the inclination correction with the average value of cos() for random sample, the physical projection will be 15kpc. However, since the real inclination is unknown, the distances to center in the discussion part are without such correction. The total flux of the identified emission features observed with NOEMA (see Table 1) is 1.9 Jy km s-1, which includes about 43% of the emission detected with the 30 m telescope, and covers a consistent velocity range, from about 180 to 570 km s-1. Since the signal is not a point source located at the phase center, which leads to the difficulty of obtaining the emission features in UV plane data, UV spectrum was not presented.
Continuum subtraction was implemented in the cleaned image data cube based on nearby line free channels, from about -2500 to -1000 km s-1 and from about 1600 to 3000 km s-1. HC3N 13-12 was seen as compact emission in the nuclear region, coincident with the AGN/extreme starburst and consistent with the spectrum taken by the IRAM 30 m telescope, while O2 emission was observed to be extended in outer disk regions 10 kpc from the nucleus. The emission was detected in several different regions with different velocities (see Figures 4 and 5). The flux of the HC3N 13-12 line detected with the NOEMA is 1.550.07 Jy km s-1, which agrees with the total emission detected with the IRAM 30 m single-dish telescope within the uncertainties of the observations at the two facilities.
We present the velocity-integrated maps for different velocity ranges in Figure 5, smoothed to about 150 km s-1 velocity resolution. The noise level (1) is about 0.045 Jy km s-1 for each map, while the contours are from 2 with 1 steps. Emission features can be seen in several velocity components above 3, especially from 180 to 570 km s-1, which is consistent with the emission feature detected with the IRAM 30 m telescope. The O2 moment zero map (Figure 4, in both gray scale and contours) includes emission features in the velocity range 180 to 570 km s-1. The corresponding angular regions are marked in Figure 5. With information from NOEMA observations, even the velocity range of O2 =- emission is similar to that of CO red wing, which traces molecular outflows within 3′′ (Feruglio et al., 2010; Cicone et al., 2012), O2 is from different regions of outflowing gas traced by CO red wing.
3.3 Line identification as O2 =- emission
The image rejection of the EMIR receiver on the IRAM 30 meter telescope is better than 13 dB, which corresponds to 20:1. The lower sideband image frequency corresponding to the feature of interest in the upper sideband is different on different days, since different LO frequencies were used. The result is that any signal from the lower sideband will move around in frequency rather than adding together when the data from different days are added. The image frequencies are in the range 96 GHz to 97.5 GHz during the four days, and are not near the strong dense gas tracer CS =2-1 at the rest frequency of 97.980953GHz. Even the strongest dense gas tracer in the 3mm band, HCN 1-0, produced an antenna temperature of only 6.5 mK in Mrk 231 with the IRAM 30 meter telescope (Jiang et al., 2011). The lower sideband image frequencies with NOEMA corresponding to the upper sideband emission feature identified as O2 =- are between 92 to 94 GHz (due to the different IF frequency), and there were no emission features detected in the lower sideband, while the detected CS =2-1 line with NOEMA observation is about half the intensity of HCN =1-0. The expected confusion from the lines in the image sideband should thus be much less than 0.2 mK for the final spectrum, which does not affect the line identification.
The rest frequency range of the emission feature from -100 to 900 km s-1 in Figure 1 is from about 118.4 GHz to 118.8 GHz. From splatalogue (http://www.cv.nrao.edu/php/splat/), which combines the JPL molecular catalog (Pickett et al., 1998) and the CDMS catalog (Muller et al., 2001), there are 350 lines in this frequency range, including the O2 =- line at 118.75034 GHz, which is the only one that has been detected in space (Larsson et al., 2007). With the criterion of lower level energy less than 100 K, the number of lines is decreased to 83, which are mainly from complex molecules, such as CH3OCH3 and CCCN, or isotopologues, such as 33SO2. The abundances of such complex molecules and isotopologues are not be expected to be high enough to produce emission stronger than HC3N =13-12 in Mrk 231. Otherwise, such features should be easily detected in Galactic molecular clouds, while HC3N =13-12 was the strongest (and possibly the only) emission line detected in the frequency range from 117.8 GHz to 118.75 GHz toward the Sgr A complex region in the Galactic centre with Odin (Sandqvist et al., 2008).
If we restrict the emission feature to fall within 100 km s-1 of the central velocity of the galaxy, with the rest frequency range from 118.54 to 118.62 GHz, there are 57 lines from splatalogue, none of which has been reported as detected. All of them, except for SO2 at 118.57743 GHz and the vibrationally excited HC3N =13-12 1e line at 118.56145 GHz, are extremely complex molecules with more than 5 atoms. The lower level energy of SO2 and HC3N transitions are from about 250K to 1600K, which makes them unlikely candidates for the observed emission. In addition, the vibrationally excited line would almost certainly be significantly weaker than the corresponding ground vibrational state line, as found even in regions of high infrared flux that can radiatively excite the vibrational levels e.g. Goldsmith et al. (1982).
If the origin of the emission were a low-lying transition of a complex molecule, it should have been detected in sources in the Milky Way. However, no such emission feature was reported by Sandqvist et al. (2008). Thus, the most probable identification of the emission feature from 100 to 800 km s-1 is O2 =- with the velocity of the red wing of the gas in Mrk 231.
4 Discussion
4.1 O2 abundance in different regions of Mrk 231: outer disk v.s. central 2 kpc
Stellar components traced at optical wavelengths can be seen (Rupke, & Veilleux, 2011) in the region with high velocity red-shifted O2 emission, while studies of molecular gas traced by CO lines (Feruglio et al., 2010; Cicone et al., 2012; Feruglio et al., 2015) were focused on the central 2 to 3 kpc region, even though some outflow features can be seen up to 5′′ (4 kpc) north of the central region (Cicone et al., 2012). In the region with O2 detection extending from 450 to 570 km s-1, the flux of the simultaneously-obtained CO =1-0 line was about 4 times that of the O2 =- line. However, the velocity range of CO 1-0 is primarily associated with the central region of Mrk 231, which is quite distinct from the O2 emission. Thus, even though the O2 emission has a similar velocity range as the red wing of molecular outflow traced by CO 1-0, it is coming from a different portion of Mrk 231. Molecular line emission of CH+ =1-0 without associated CO emission has been found in several high redshift starburst galaxies (Falgarone et al., 2017), which indicates that CO emission is not necessarily detectable in the regions in which some special molecules, such as O2 and CH+ can be detected.
The CO =1-0 fluxes in the regions with O2 detections were comparable to, or even less than that of O2 =- line, if we consider that only CO 1-0 emission with the same velocity range as the O2 line is from the same gas as responsible for the O2 emission. Using the same CO 1-0 flux to H2 conversion factor in the O2 emission region as that of the host galaxy and assuming that the O2 line is optically thin with a 15 K excitation temperature (), which is the same as was assumed in NGC 6240 (Combes et al., 1991), the O2 to H2 abundance ratio can be estimated to be higher than (see Table 2), nearly 2 orders of magnitude higher than that of Galactic sources detected in O2, and higher than the CO to H2 abundance ratio. The dependence of the O2 column density on its excitation temperature in LTE is (Liseau et al., 2005). Thus if the excitation temperature of O2 were higher than 15 K, the O2 to H2 abundance ratio would be even higher.
The nondetection of O2 emission in the central 2 kpc of Mrk 231 with our NOEMA observations gave the best upper limit at the of extragalactic O2 =- to CO 1-0 line ratio of 110-3 (1) , much lower than the 1.210-2 value for NGC 6240, which was used previously for estimating the O2/H2 abundance ratio (Combes et al., 1991). Using the same CO =1-0 flux to H2 conversion factor as that in NGC 6240 and similar excitation conditions of the O2 molecules (Combes et al., 1991), the O2 to H2 abundance ratio should be less than 810-8 in the host galaxy of Mrk 231, which is consistent with that found the vast majority of that in dense molecular gas in the Milky Way (Goldsmith et al., 2000; Pagani et al., 2003). The only exceptions are Orion (Goldsmith et al., 2011) (having significantly higher abundance in 10-6 in a very small region) and Oph (Larsson et al., 2007; Liseau et al., 2012) (with comparable abundance 5).
We compiled the sources with O2 detections, the best upper limit of O2 to H2 abundance ratio in NGC 6240 with emission (Combes et al., 1991) and in B0218+357 with absorption (Combes et al., 1997) in the literature, and show the results in Table 2. If we wish to detect O2 =- emission in extragalactic sources without O2 abundance enhancement, observations of the red-shifted O2 =- line with 5 times lower noise level than that of our observations with NOEMA toward Mrk 231 are needed. With the Atacama Large millimeter/submillimeter array (ALMA), about ten hours on-source time toward nearby gas-rich galaxies with bright CO emission can achieve such sensitivity.
4.2 Origin of molecular Oxygen: large scale shock caused by AGN molecular outflow?
The velocity range of our O2 emission is mainly from red-shifted gas, especially from 345 to 615 km s-1, with projected distance of about 10 kpc north and south from the central region, while the low velocity components, from about -400 to +300 km s-1, were seen as weaker emission and at smaller projected distances to the center (see Figure 4). On the other hand, high velocity blue-shifted components were even weaker than the low velocity ones and were hardly detected in this observation. The asymmetry in spatial and velocity distribution of O2 emission, including the absence of O2 emission along the line of sight around the nuclear region, can be attributed to the geometry of molecular gas in Mrk 231 and the asymmetry of the molecular outflow from the central AGN, which had been found in CO observations up to about 3 kpc scale away from the center of Mrk 231 in projection (Feruglio et al., 2010; Cicone et al., 2012).
The absence of a blue-shifted component of O2 emission may be caused asymmetric distribution of molecular gas in the regions about 10 kpc away from the center, because O2 should be produced by the interaction between the outflowing gas from the AGN center and the local molecular gas there. With velocity of about 500 km s-1, 20 Myr are required for gas to travel 10 kpc, which is the typical projected distance between the O2 emission regions and the center of Mrk 231. Thus O2 emission in Mrk 231 traces the outflow from the central AGN on a characteristic dynamic time scale of 20 Myr.
X-ray emission extended up to 25 kpc away from the center of Mrk 231 was found with half-mega second Chandra spectral imaging. A merger remnant was proposed as the main contributor to the large-scale X-ray halo of Mrk 231 (Veilleux et al., 2014). However, the central AGN is responsible for emission at smaller ( 6 kpc) distances. We suggest that large scale AGN molecular outflow is the most plausible mechanism to produce a shock that drives the enhancement of the O2 abundance but a merger is another possibility for producing a shock (or multiple shocks) that enhanced the abundance of O2.
Models of shock chemistry (Chen et al., 2014; Neufeld et al., 2014; Melnick& Kaufman, 2015; Godard et al., 2019) suggest that essentially all of the gas phase oxygen will be incorporated into H2O and CO if the shock velocity exceeds 20 km s-1. Thus, a single shock that provides the velocity offset of the redshifted O2 emission of Mrk 231 could not be responsible for dramatically enhancing the abundance of molecular oxygen. Rather, a number of lower velocity shocks produced in the outflow, having different velocities relative to the general outflow, could collectively provide the observed large O2 abundance. A high O/CO ratio up to 2 can be produced in a model of a UV irradiated molecular shock (Godard et al., 2019). Such irradiated molecular clouds with shocks located far away from the center of galaxies can have physical properties similar to those of the O2-emitting regions in Mrk 231. Chemical networks coupled with dynamic models including radiation field are necessary for understanding the high O2/CO abundance ratio there.
For 15K gas under LTE conditions, the 118.75034 GHz O2 transition is the brightest among the 114 O2 lines listed between 10 GHz and 1000 GHz (Pickett et al., 1998). In total, only 12 transitions make meaningful contributions, which is consistent with what had been predicted with an LVG model (Liseau et al., 2005). The total O2 flux amounts to 2.9 times the flux at 118 GHz. Similar procedures applied to 17 transitions of CO yielded a CO total flux 5.1 times that of CO 1-0. Given the comparable fluxes of the O2 =- transition and the CO 1-0 line in outer disk region of Mrk 231, the O2 molecule is comparable to CO as an important coolant of such molecular gas.
Based on CO observations (Cicone et al., 2014; Fluetsch et al., 2019), massive molecular outflows, which have negative feedback on star formation in galaxies, are quite common in AGN. The O2 =- transition is thus a promising new tool for studying such outflows on dynamic time scales of a few 10s of Myr. AGNs with molecular gas detected via strong CO emission will be good candidates for searching for O2 emission in extragalactic sources.
5 Summary and future prospects
With deep observations toward Mrk 231 using the IRAM 30 meter telescope and NOEMA, we detected O2 =- emission in external galaxy for the first time, at about the 12 level. The detected O2 emission is located in regions about 10 kpc away from the center of Mrk 231 and may be caused by the interaction between the AGN-driven molecular outflow and the outer disk molecular clouds.
Massive molecular outflows are quite common in AGN based on CO observations (Cicone et al., 2014). The O2 =- transition could prove to be a new tool for studying the effect of such outflows, because outflows identified with CO observations can be severely contaminated by emission components of the host galaxy. On the other hand, O2 emission from dense molecular gas in host galaxy can be neglected, which means O2 emission can be used to study a molecular outflow even if it is perpendicular to the line of sight. AGNs with molecular outflows detected in CO emission are good candidates for detecting O2 emission in extragalactic sources. Even though Mrk 231, a northern source at Declination of 57∘, cannot be reached with ALMA, other red-shifted AGNs with molecular outflows may be studied with high resolution high sensitivity O2 =- observations using ALMA and NOEMA, as well as the Next-Generation Very Large Array (ngVLA) in the next decade. O2 lines at submillimeter wavelengths, such as that at 424.76 GHz, with suitable red-shift shifting it to an observable window of ALMA, may be useful for studying molecular oxygen in more distant galaxies.
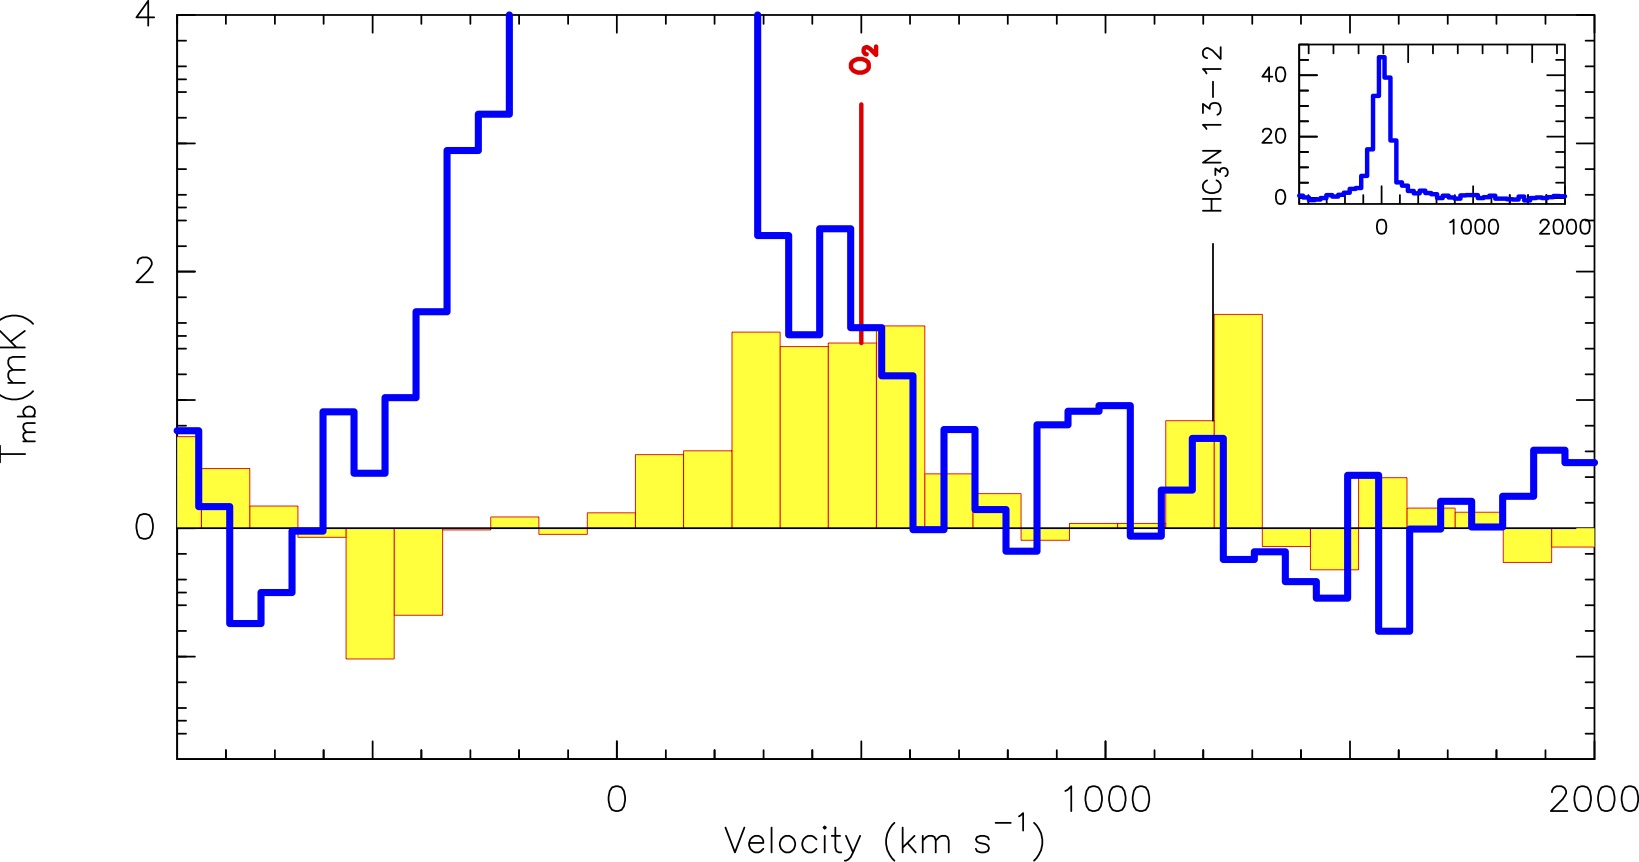
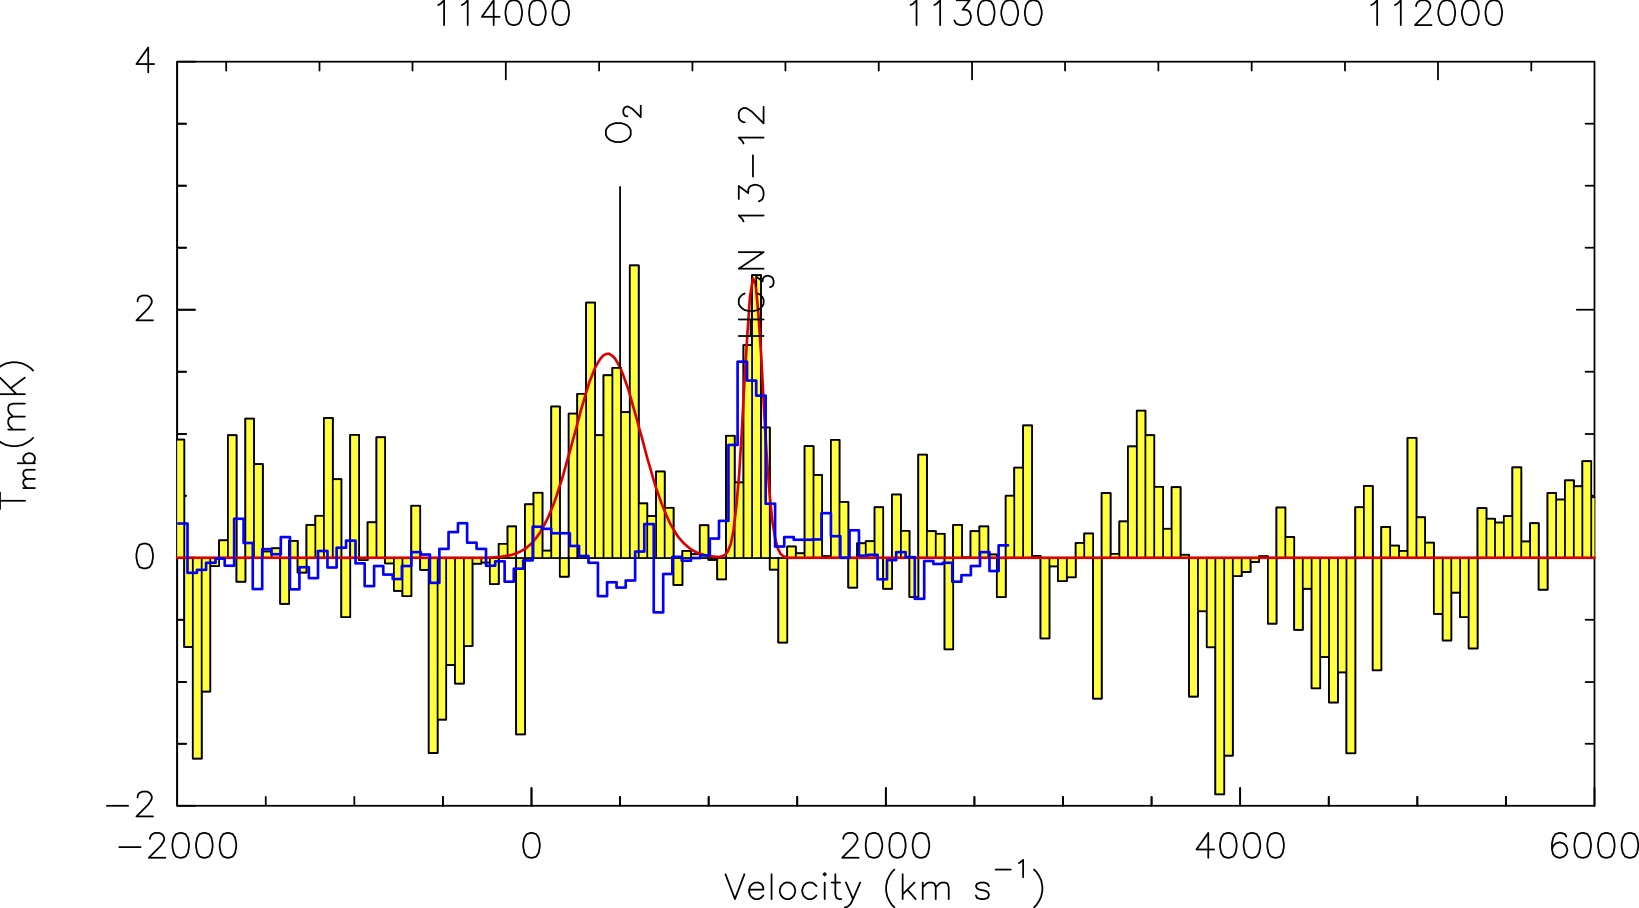
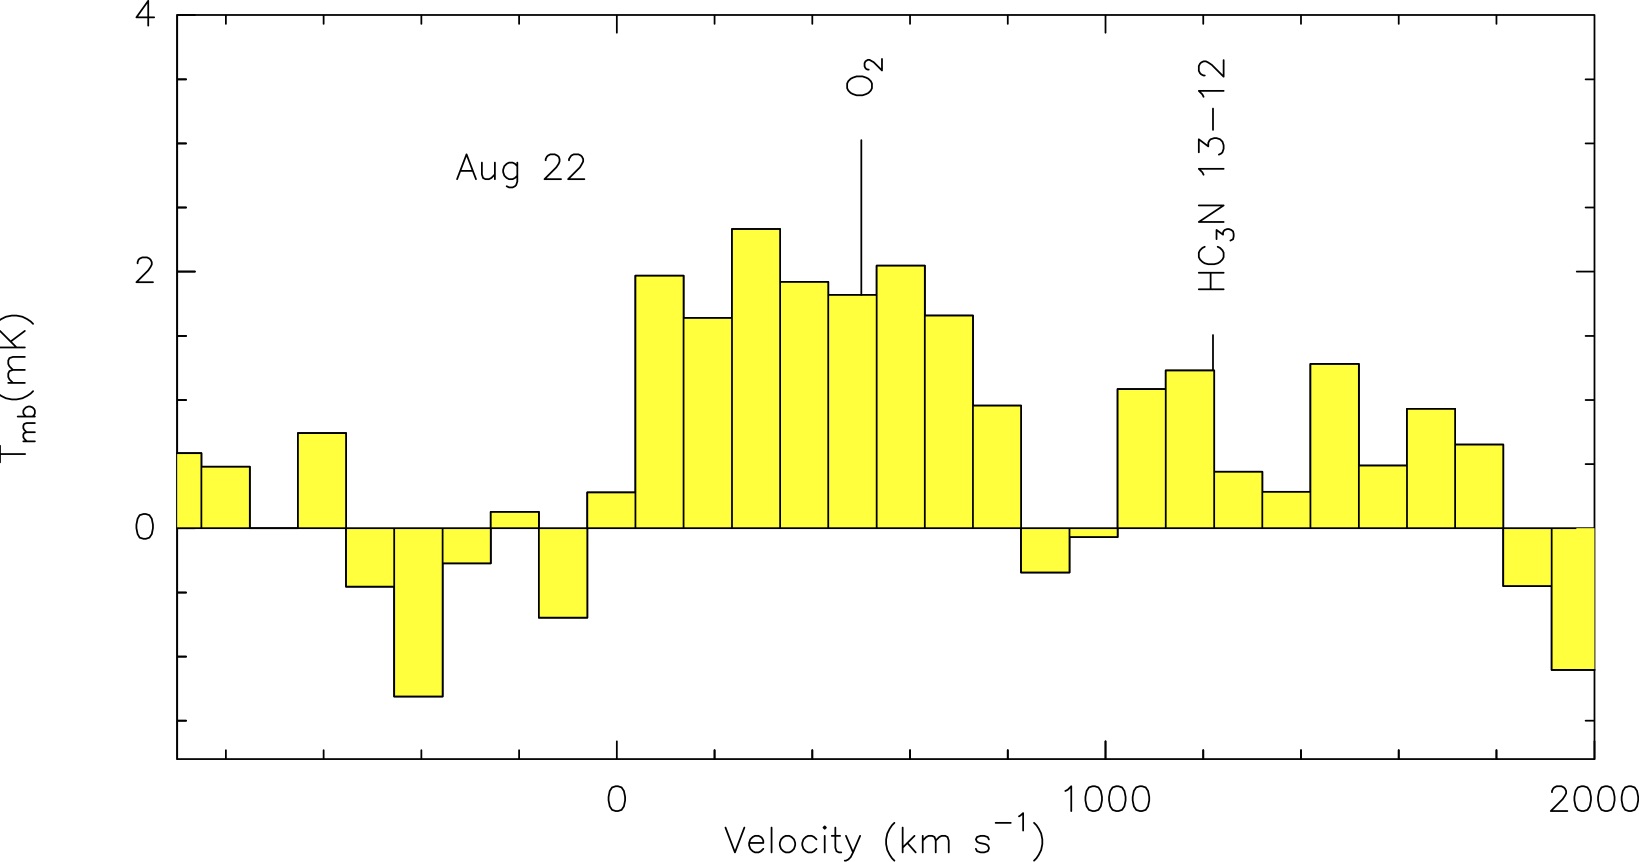
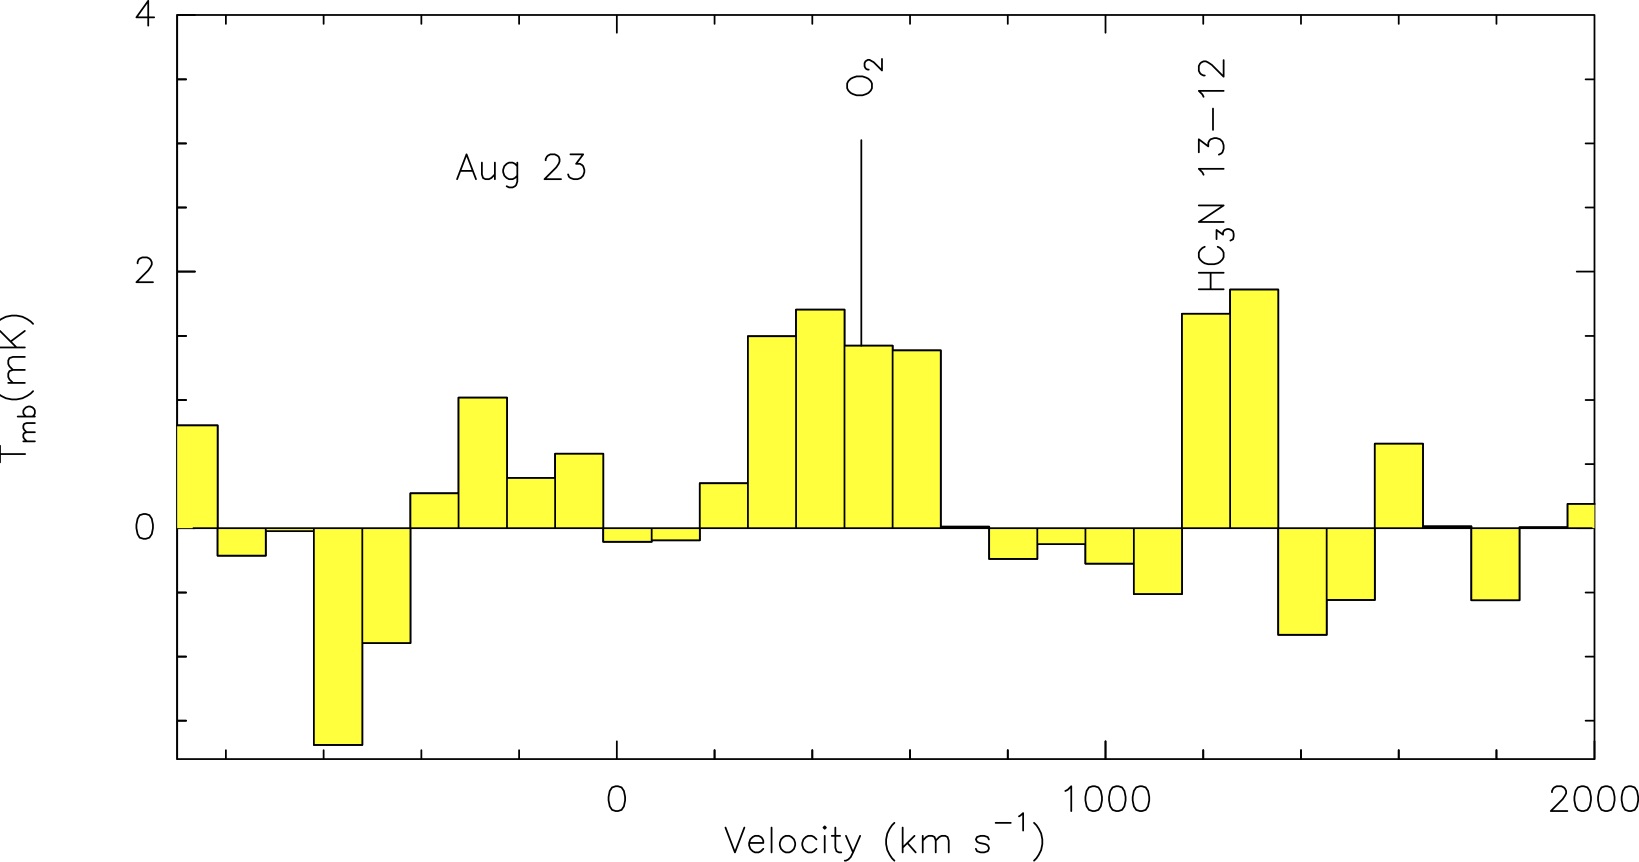
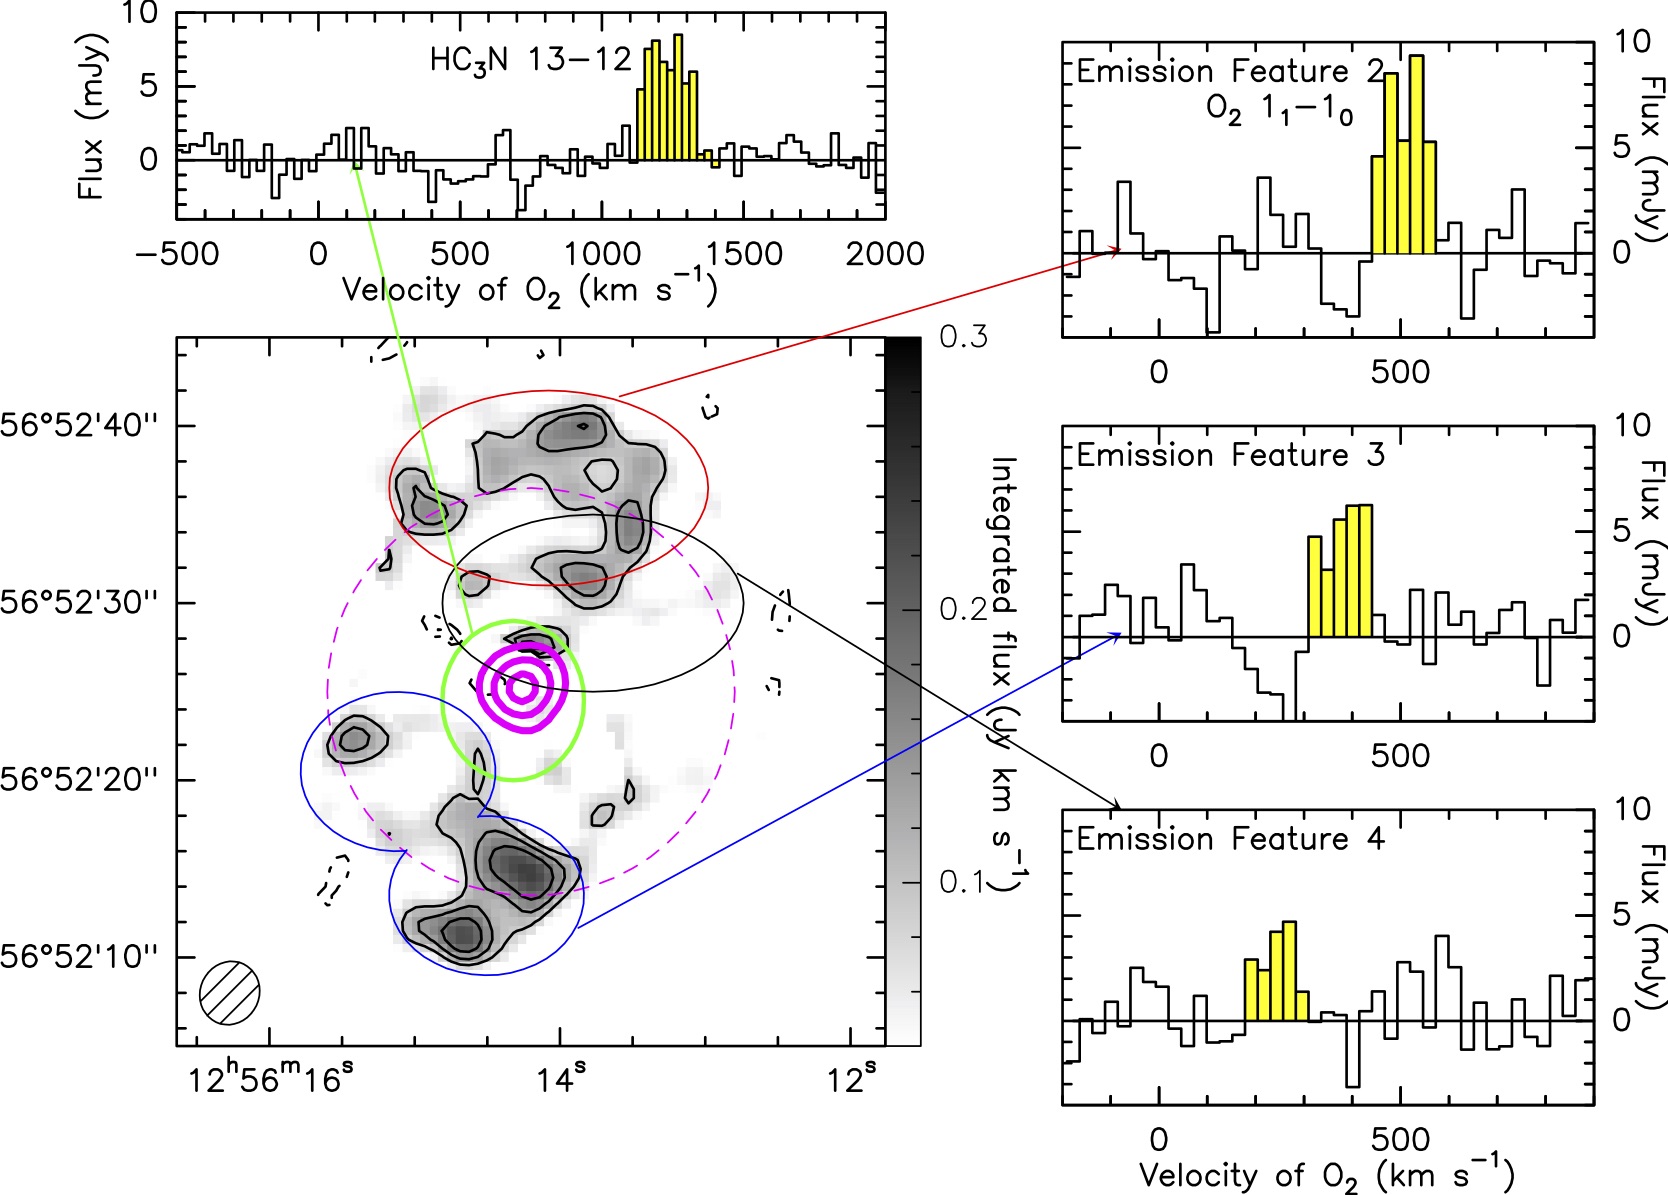
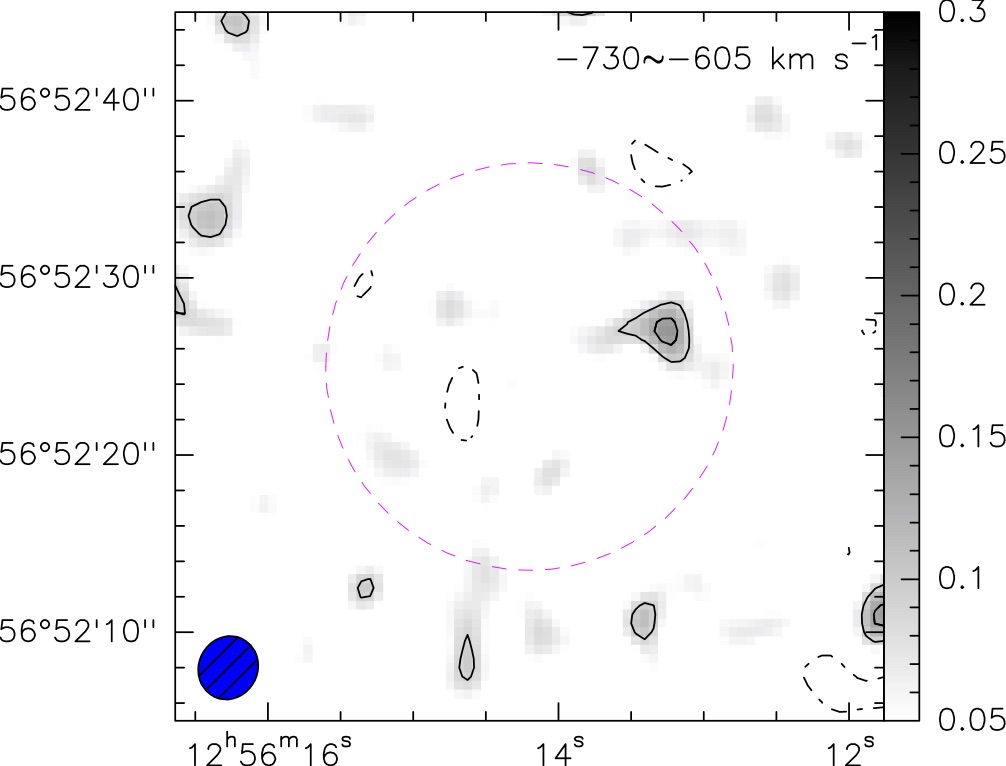
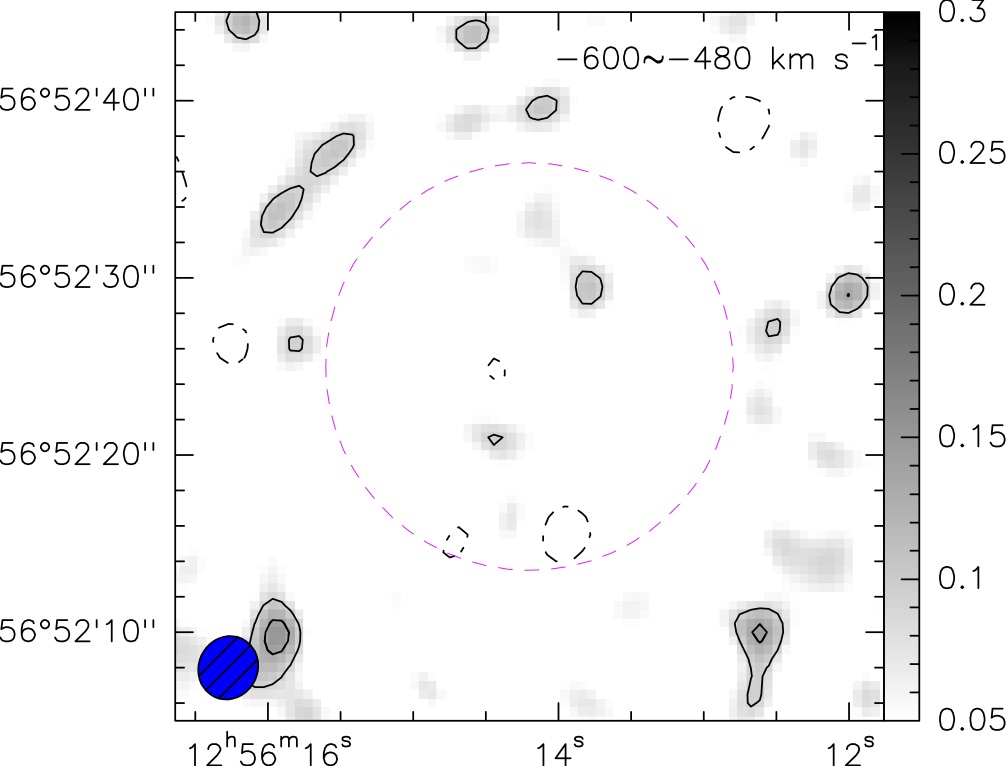
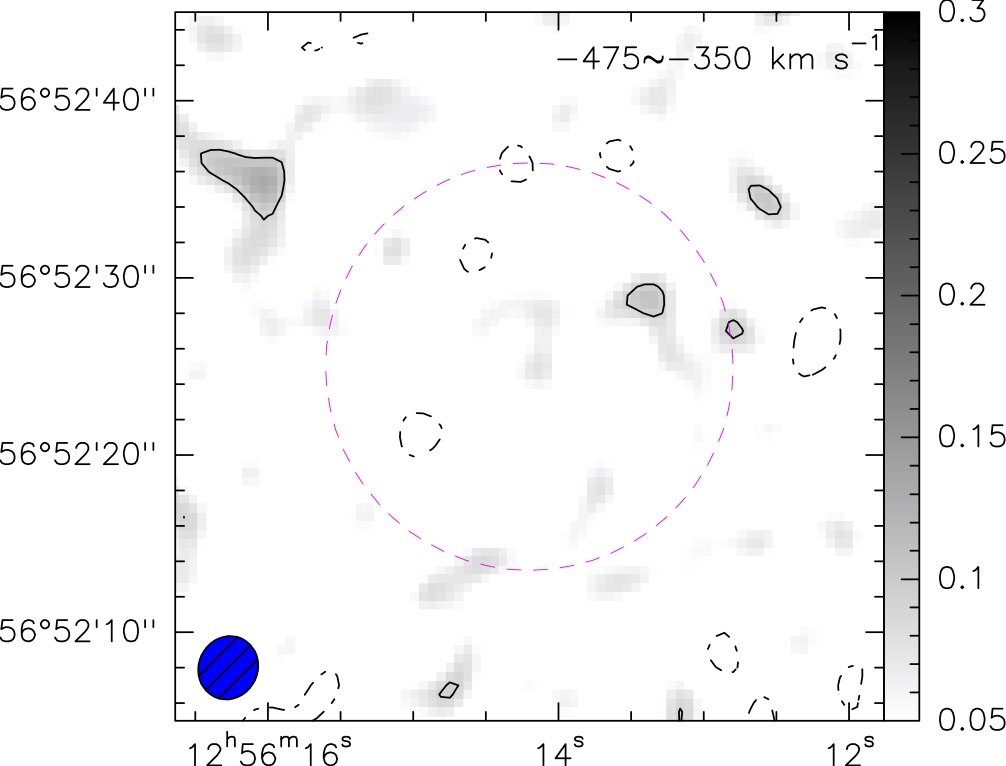
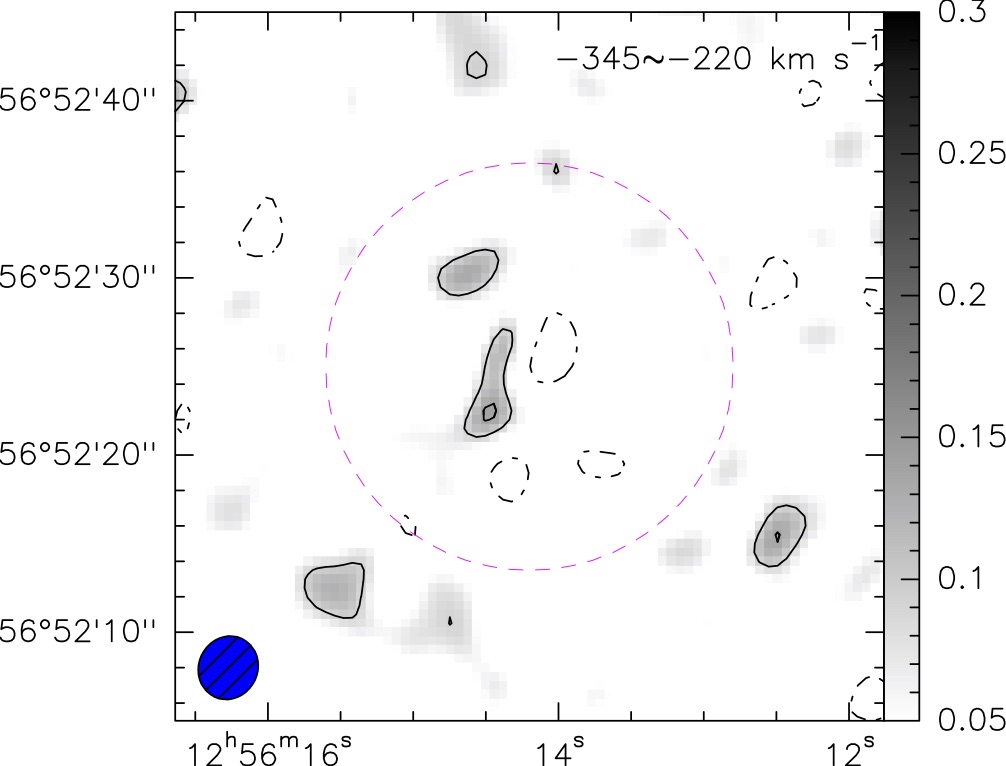
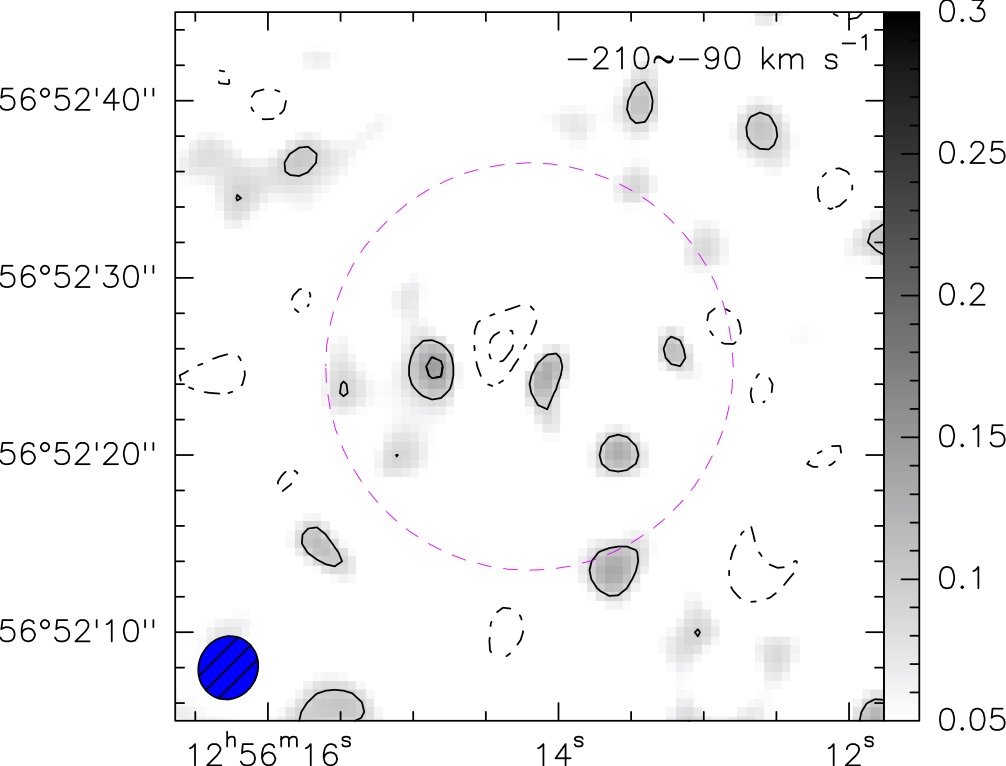
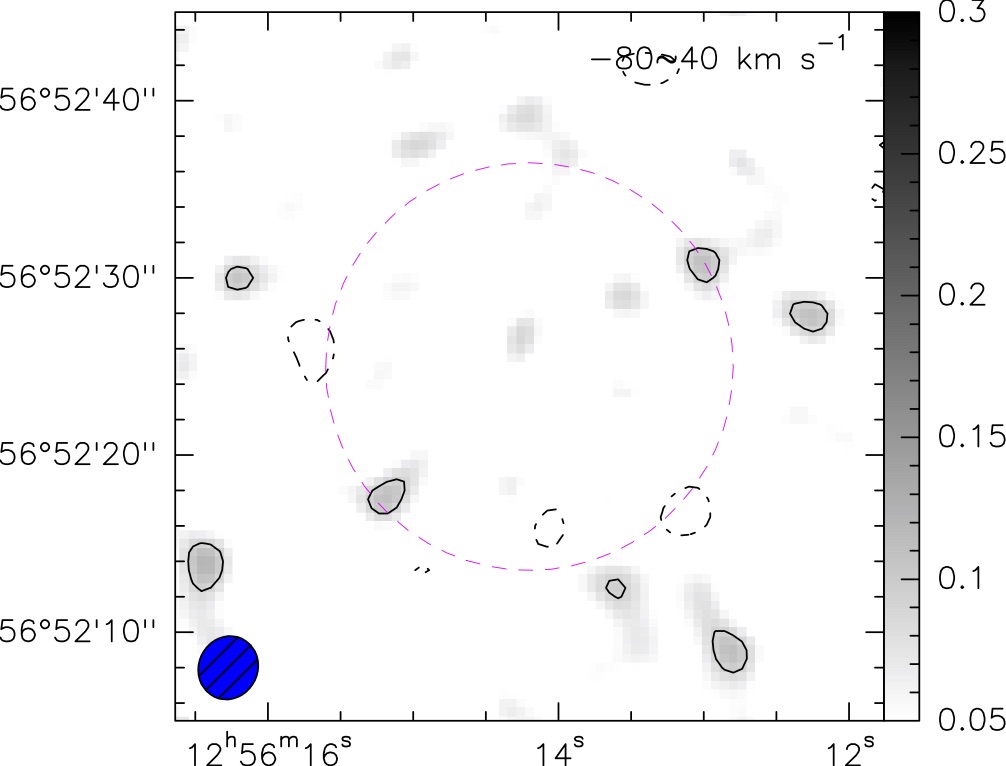
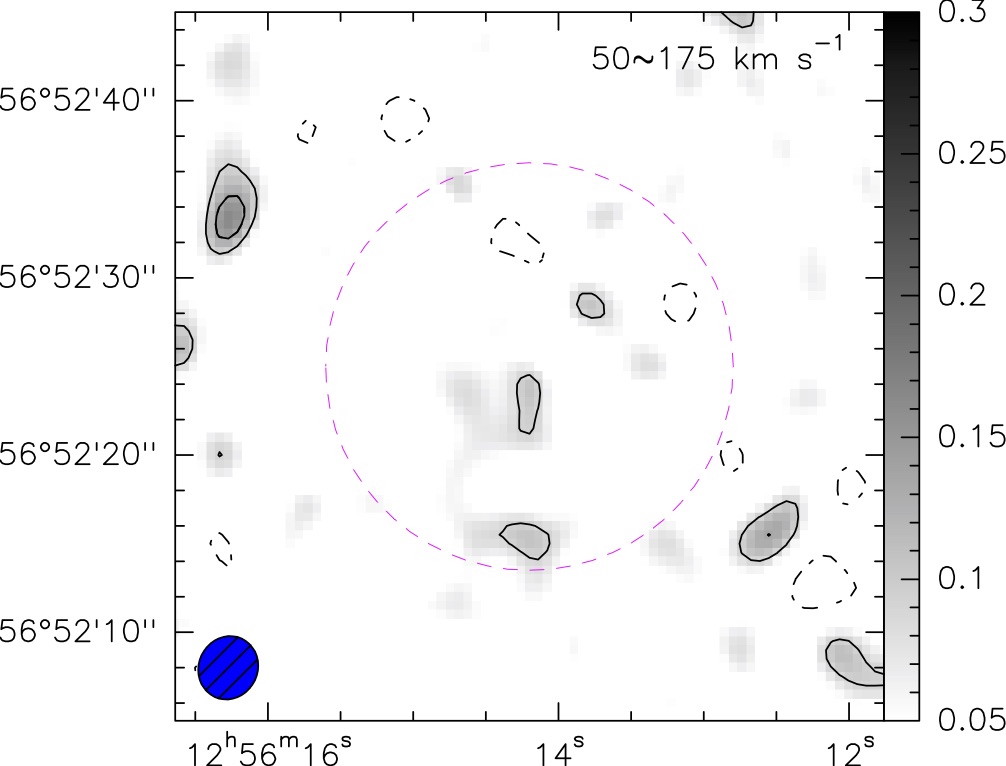
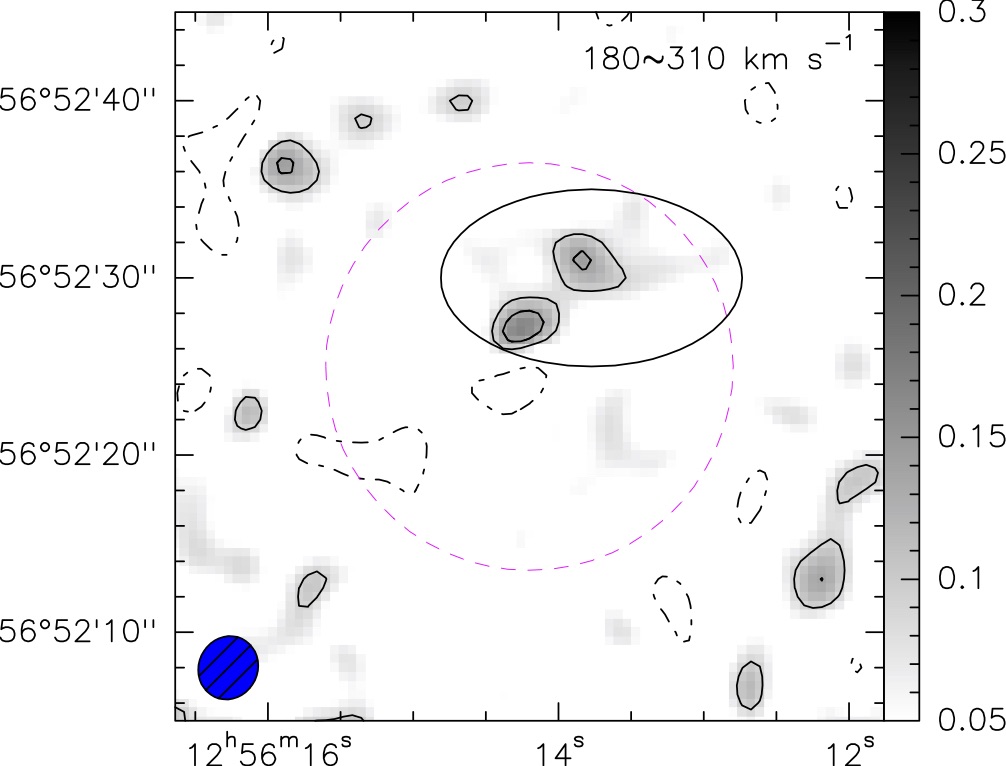
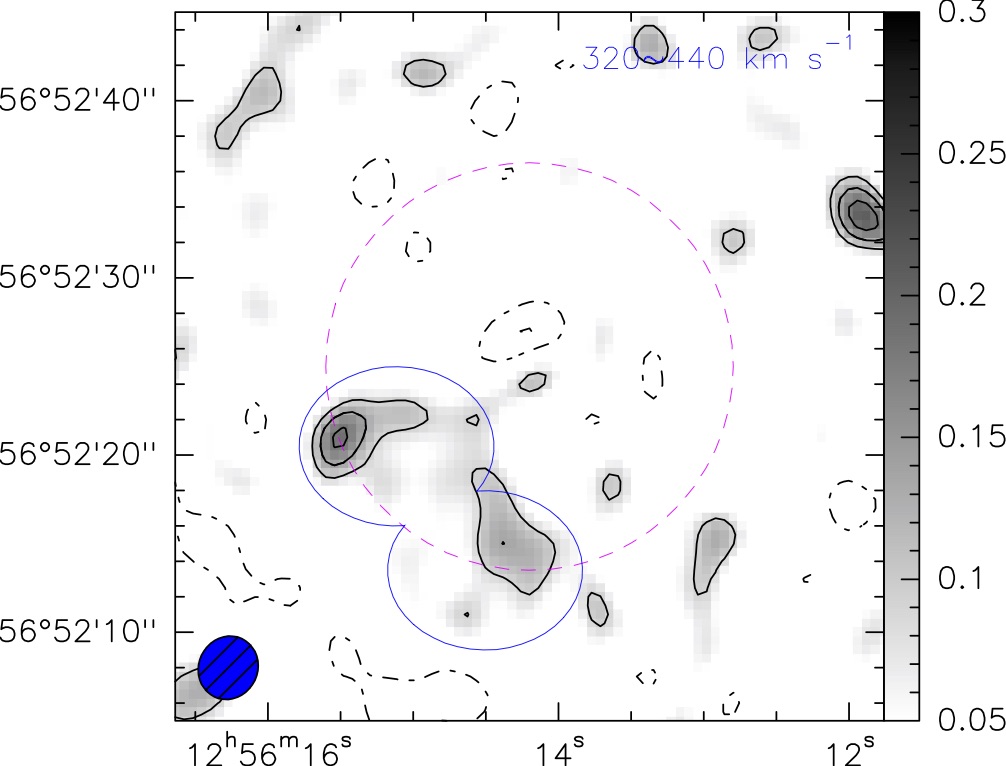
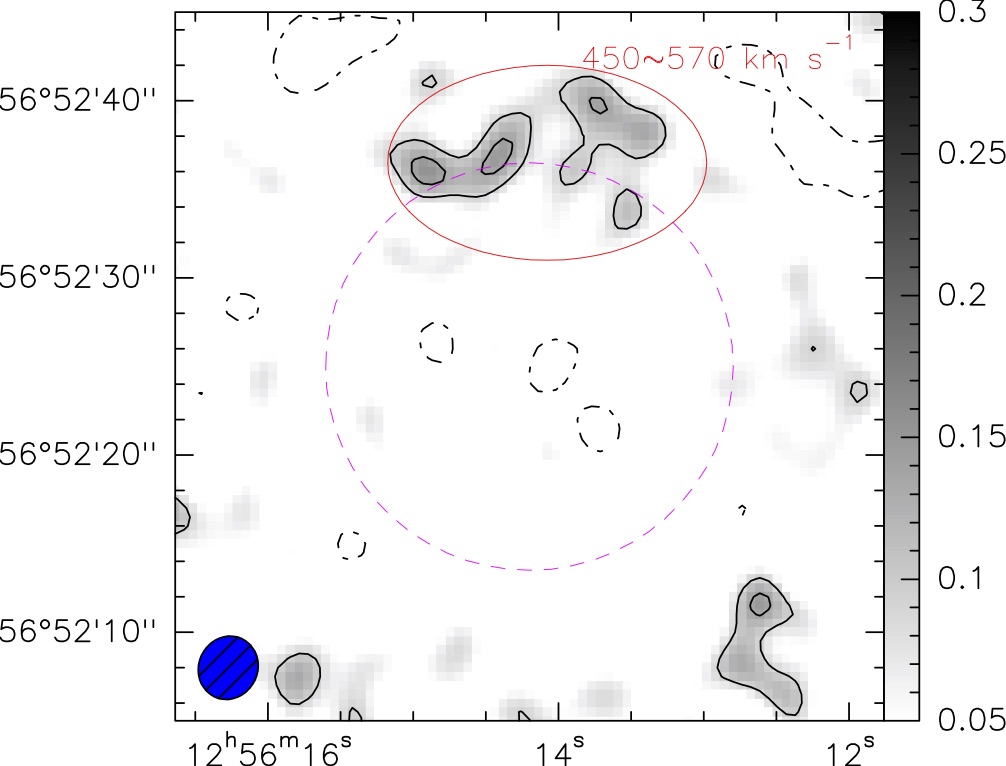
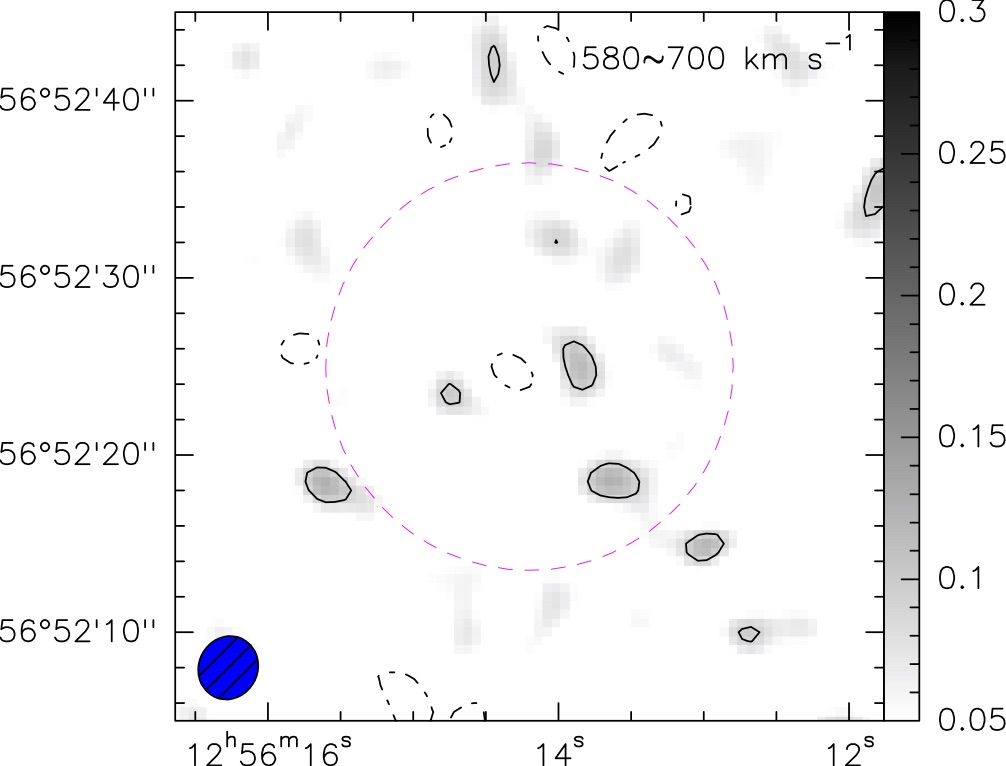

Table 1. Emission features of O2 =- detected with the IRAM 30 meter and NOEMA
| Emission Feature | Flux | Line Center | Line Width | Telecope |
|---|---|---|---|---|
| Jy km s-1 | km s-1 | km s-1 | ||
| 1 | 3.70.3 | 418.747.9 | 456.0107.1 | 30 meter |
| 2 | 0.800.13 | 511.58.1 | 93.513.1 | NOEMA |
| 3 | 0.700.12 | 391.59.7 | 98.816.7 | NOEMA |
| 4 | 0.360.10 | 248.511.9 | 77.624.7 | NOEMA |
Note: The errors only include the deviation from Gaussian fitting. About 10 to 20% of the velocity-integrated flux should be also considered as the uncertainty for comparison with other observations, arising from the uncertainties in the absolute flux calibration and pointing errors for the single dish observations. Emission features 2, 3, and 4 correspond to the three spectra in the right of Figure 4, while emission feature 1 corresponds to the spectrum in Figures 1 and 2.
Table 2. O2 detections and best upper limits
| Source | O2 to H2 abundance ratio | Telescope | References |
|---|---|---|---|
| Orion | 1 | Herschel | Goldsmith et al. (2011) |
| Oph | 5 | Odin | Larsson et al. (2007) |
| NGC 6240 | IRAM 30 meter | Combes et al. (1991) | |
| B0218+357 | NRAO12 meter | Combes et al. (1997) | |
| Mrk231 (central 2kpc) | IRAM NOEMA | This work | |
| Mrk231 (outflow) | IRAM 30 meter and NOEMA | This work |
Note: We present the CO 1-0 to O2 line ratio to estimate O2/H2 abundance ratio only for sources with detected CO emission or an upper limit (Mrk 231 O2 emitting region). 1 is used for upper or lower limits. The O2/H2 abundance ratios in the two Galactic sources (Orion and Oph) were estimated using optically thin isotopologues instead of CO, while the ratio for B0218+357 was estimated based on an absorption spectrum.
References
- Aalto et al. (2012) Aalto, S., Garcia-Burillo, S., Muller, S., et al. 2012, A&A, 537, A44
- Bergin et al. (1998) Bergin, E. A., Melnick, G. J., Neufeld, D. A., 1998, ApJ, 499, 777
- Bryant & Scoville (1996) Bryant, P. M. & Scoville, N. Z., 1996, ApJ, 457, 678
- Carilli, Wrobel & Ulvestad (1998) Carilli, C. L., Wrobel, J. M., Ulvestad, J. S., 1998, AJ, 115, 928
- Chen et al. (2014) Chen, J.-H., Goldsmith, P. F., Viti, S., et al. 2014, ApJ, 793, 111
- Cicone et al. (2012) Cicone, C., Feruglio, C., Maiolino, R., et al. 2012, A&A, 543, A99
- Cicone et al. (2014) Cicone, C., Maiolino, R., Sturm, E., et al. 2014, A&A, 562, A21
- Combes et al. (1991) Combes, F. Casoli, F., Encrenaz, P., et al. 1991, A&A, 248, 607
- Combes et al. (1997) Combes, F., Wiklind, T., Nakai, N., 1997, A&A, 327, L17
- Falgarone et al. (2017) Falgarone, E., Zwaan, M. A., Godard, B., et al. 2017, Nature, 548, 430
- Feruglio et al. (2015) Feruglio, C., Fiore, F., Carniani, S., et al. 2015, A&A, 583, A99
- Feruglio et al. (2010) Feruglio, C., Maiolino, R., Piconcelli, E., et al. 2010, A&A, 518, L155
- Fischer et al. (2010) Fischer, J., Sturm, E., González-Alfonso, E., et al. 2010, A&A, 516, L41
- Fluetsch et al. (2019) Fluetsch, A., Maiolino, R., Carniani, S., et al. 2019, MNRAS, 483, 4586
- Frayer et al. (1998) Frayer, D. T., Seaquist, E. R., Thuan, T. X., Sievers, A. 1998, ApJ, 503, 231
- Godard et al. (2019) Godard, B., Pineau des Forêts, G., Lesaffre, P., et al. 2019, A&A, 622, A100
- Goldsmith& Langer (1978) Goldsmith, P. F. & Langer, W. D., 1978, ApJ, 222, 881
- Goldsmith et al. (1982) Goldsmith, P. F., Snell, R. L., Deguchi, S., et al. 1982, ApJ, 260, 147
- Goldsmith et al. (2002) Goldsmith, P. F., Li, D., Bergin, E. A., et al. 2002, ApJ, 576, 814
- Goldsmith et al. (2011) Goldsmith, P. F., Liseau, R., Bell, T. A., et al. 2011, ApJ, 737, 96
- Goldsmith et al. (2000) Goldsmith, P. F., Melnick, G. J., Bergin, E. A., et al. 2000, ApJ, 539, 123
- Goldsmith & Young (1989) Goldsmith, P. F. & Young, J. S., 1989, ApJ, 341, 718
- Hollenbach et al. (2009) Hollenbach, D., Kaufman, M. J., Bergin, E. A., Melnick, G. J., 2009, ApJ, 690, 1497.
- Jiang et al. (2011) Jiang, X., Wang, J., Gu, Q., 2011, MNRAS, 418, 1753
- Kanekar & Meier (2015) Kanekar, N. & Meier, D. S., 2015, ApJ, 811, 23
- Langer & Graedel (1989) Langer, W. D. & Graedel, T. E., 1989, A&AS, 69, 241
- Larsson et al. (2007) Larsson, B., Liseau, R., Pagani, L., et al. 2007, A&A, 466, 999
- Liseau et al. (2012) Liseau, R., Goldsmith, P. F., Larsson, B., et al. 2012, A&A, 514, A73
- Liseau et al. (2005) Liseau, R., O2din Team, 2005, IAU Symposium, 231, 301
- Liszt (1985) Liszt, H. S., 1985, ApJ, 298, 281
- Melnick& Kaufman (2015) Melnick, G. J. & Kaufman, M. J., 2015, ApJ, 806, 227
- Muller et al. (2001) Müller, H. S. P., Thorwirth, S., Roth, D. A., Winnewisser, G., 2001, A&A, 370, L49
- Neufeld et al. (2014) Neufeld, D. A., Gusdorf, A., Güsten, R., et al. 2014, ApJ, 781, 102
- Pagani et al. (2003) Pagani, L., Olofsson, A. O. H., Bergman, P., et al. 2003, A&A, 402, L77
- Pickett et al. (1998) Pickett, H. M., Poynter, R. L., Cohen, E. A., et al. 1998, J. Quant. Spectrosc. & Rad. Transfer, 60, 883
- Rupke, & Veilleux (2011) Rupke, D. S. N., & Veilleux, S. 2011, ApJ, 729, L27
- Sandqvist et al. (2008) Sandqvist, A., Larsson, B., Hjalmarson, Å, et al. 2008, MNRAS, 482, 849
- Veilleux et al. (2014) Veilleux, S., Teng, S. H., Rupke, D. S. N., et al. 2014, ApJ, 790, 116