DES16C3cje: A low-luminosity, long-lived supernova
Abstract
We present DES16C3cje, a low-luminosity, long-lived type II supernova (SN II) at redshift 0.0618, detected by the Dark Energy Survey (DES). DES16C3cje is a unique SN. The spectra are characterized by extremely narrow photospheric lines corresponding to very low expansion velocities of km s-1, and the light curve shows an initial peak that fades after 50 days before slowly rebrightening over a further 100 days to reach an absolute brightness of M mag. The decline rate of the late-time light curve is then slower than that expected from the powering by radioactive decay of 56Co, but is comparable to that expected from accretion power. Comparing the bolometric light curve with hydrodynamical models, we find that DES16C3cje can be explained by either i) a low explosion energy (0.11 foe) and relatively large 56Ni production of 0.075 M☉ from a M☉ red supergiant progenitor typical of other SNe II, or ii) a relatively compact M☉ star, explosion energy of 1 foe, and 0.08 M☉ of 56Ni. Both scenarios require additional energy input to explain the late-time light curve, which is consistent with fallback accretion at a rate of M⊙ s-1.
keywords:
supernovae: general — supernovae: individual (DES16C3cje)1 Introduction
Recent wide-field sky surveys have revealed a significant diversity in the observed properties of supernovae (SNe). These events have covered a wide range of observed characteristics: transients with extremely bright luminosities (e.g., superluminous SNe, Gal-Yam, 2012); transients with a rapid temporal evolution spanning a range of luminosities (e.g., Perets et al., 2010; Kasliwal et al., 2012; Drout et al., 2014; Pursiainen et al., 2018), and a heterogeneous population of transients with a slow temporal evolution (e.g., Taddia et al., 2016; Arcavi et al., 2017; Terreran et al., 2017). These new SN discoveries have in turn created new challenges for the SN field, particularly concerning the SN progenitor and the physics of the explosion.
In the canonical picture of a core-collapse SN, the explosion releases erg of energy (1 foe), and a fraction of the progenitor’s material is burned into various intermediate-mass and iron-peak elements. The early emission from SNe, defined as the cooling phase, is powered by the release of shock deposited energy, while the power source from the peak to late-phases is provided by the decay of 56Ni into 56Co and subsequently 56Fe. In slow- and fast-declining hydrogen-rich SNe (historical SNe IIP and SNe IIL, respectively), the cooling phase is followed by a hydrogen recombination phase, where the luminosity evolves more slowly until it becomes dominated by the energy released during the decay of radioactive material. However, some core-collapse SNe have larger luminosities, which typically require an additional source of energy to explain them (see review, and references therein, of Moriya et al., 2018a). Pair-Instability SNe (PISNe; e.g. Heger & Woosley 2002; Gal-Yam et al. 2009), magnetars (e.g. Kasen & Bildsten, 2010; Bersten & Benvenuto, 2016), accretion power (e.g. Moriya et al., 2010; Dexter & Kasen, 2013), and pulsational pair-instability (PPI; e.g. Woosley et al. 2007; Woosley 2017) have all been proposed as a source of additional energy, but as yet there is no clear consensus about the relative importance of each source nor associations to specific transients.
Recently, two peculiar type II SNe (SNe II) have been studied in detail: iPTF14hls (Arcavi et al., 2017; Sollerman et al., 2019) and OGLE-2014-SN-073 (Terreran et al., 2017). iPTF14hls is a SN with very little spectral evolution over days, and with a light curve that shows multiple re-brightening events. OGLE-2014-SN-073 is a very bright SN with an unusually broad light curve, combined with high ejecta velocities in its spectra. Both objects exploded in low-luminosity galaxies and require an extra source of power (beyond shock energy and radioactivity) to explain their unusual evolution.
Popular scenarios invoked to explain the peculiar behaviour of these two transients are a magnetar (Dessart, 2018; Orellana et al., 2018; Woosley, 2018), PISNe (Woosley, 2018), circumstellar interaction (Andrews & Smith, 2018; Woosley, 2018) and fallback accretion (Arcavi et al., 2017; Moriya et al., 2018b; Wang et al., 2018). Moriya et al. (2018b) found the latter scenario can reproduce the shape of the light curve, luminosity and photospheric velocities of OGLE-2014-SN-073, while Arcavi et al. (2017) and Wang et al. (2018) proposed that iPTF14hls may be powered by intermittent fallback accretion. The idea of fallback in SNe was introduced by Colgate (1971), and has been broadly studied to determine its effects on the central remnant (e.g. Chevalier, 1989; Woosley & Weaver, 1995; Fryer, 1999), and on SN light curves (e.g. Fryer et al., 2009; Moriya et al., 2010; Dexter & Kasen, 2013). Dexter & Kasen (2013) showed that the accretion power may be relevant to explain peculiar and rare SNe.
In this paper, we present the photometry and spectra of DES16C3cje, an unusual SN II discovered by the Dark Energy Survey Supernova Program (DES-SN; Bernstein et al., 2012). We discuss its peculiar characteristics and examine the late-time light curve under the fallback scenario. In Section 2 we describe our observations of DES16C3cje and measurements. We analyse the spectral and photometric properties and compare them with other similar events in Section 3, and then discuss the progenitor scenarios that could explain the event in Section 4. We discuss and conclude in Section 5. Throughout, we assume a flat CDM universe, with a Hubble constant of km s-1 Mpc-1, and 0.3.
2 Observations
DES16C3cje was detected by DES using the wide-field Dark Energy Camera (DECam; Flaugher et al., 2015) instrument in an -band image taken on 2016 October 11 (JD = 2457673.3) with an apparent magnitude of mag. The transient was located at , (J2000.0) in a faint host galaxy ( mag) at a redshift of 0.0616. The previous non-detection with DES was obtained on 2016 October 7 (), with a detection limit of mag. This limit places a constraint on the explosion epoch of days; we adopt 2016 October 9 (the intermediate epoch; d) as the explosion date. Further information on the DES-SN difference-imaging search pipeline and machine-learning algorithms to identify transient objects can be found in Kessler et al. (2015) and Goldstein et al. (2015).
Photometric coverage of DES16C3cje was acquired by DES-SN in filters from 2016 October until 2017 February, and then from 2017 August to 2018 February. Between 2017 February and 2017 July, additional photometric data were obtained by the extended Public European Southern Observatory (ESO) Spectroscopic Survey for Transient Objects (ePESSTO; Smartt et al., 2015) and other collaborators with the ESO Faint Object Spectrograph and Camera 2 (EFOSC2; Buzzoni et al., 1984) at the 3.6m ESO New Technology Telescope (NTT), with the FOcal Reducer/low dispersion Spectrograph 2 (FORS2; Appenzeller et al., 1998) at the ESO Very Large Telescope (VLT), with the Low Dispersion Survey Spectrograph 3 (LDSS3; Osip et al., 2004) on the Magellan Clay 6.5-m telescope, and with the the Gamma-Ray Burst Optical/Near-Infrared Detector (GROND; Greiner et al., 2008), at the 2.2-m MPG telescope at the European Southern Observatory (ESO) La Silla Observatory.
The NTT data were reduced using the PESSTO pipeline (Smartt et al., 2015), while for the FORS2 images we used the esoreflex pipeline (Freudling et al., 2013). Reductions for data obtained with LDSS3 were performed with Image Reduction and Analysis Facility (iraf; Tody, 1986) using standard routines. Images from the MPG were reduced with the GROND pipeline (Krühler et al., 2008). The DES photometric measurements were made using the pipeline discussed by Papadopoulos et al. (2015) and Smith et al. (2016), which has also been extensively used in the literature (e.g., Firth et al., 2015, and references therein). This pipeline subtracts a deep template image from each individual DES image to remove the host-galaxy light using a point-spread-function (PSF) matching routine. SN photometry is then measured from the difference image using a PSF-fitting technique. The photometry of DES16C3cje is reported in Appendix A1.
DES16C3cje was observed spectroscopically on six epochs from to days (throughout the paper, we give all epochs relative to the explosion epoch). These observations were obtained with four different instruments: The AAOmega spectrograph at the Anglo-Australian Telescope (AAT), X-SHOOTER (Vernet et al., 2011) and FORS2 at the VLT, and Gemini Multi-Object Spectrograph (GMOS-S; Hook et al. 2004) at the Gemini Observatory. A log of the spectroscopic observations of DES16C3cje is reported in Table 1. Spectroscopic reductions for X-SHOOTER were performed using the esoreflex pipeline, FORS2 data were reduced with iraf using standard routines, while for GMOS-S we used the Gemini iraf package, combined with idl routines to flux calibrate the data and remove telluric lines.
| UT date | MJD | Rest-frame phase⋆ | Telescope | Range | Grism/Grating/ |
|---|---|---|---|---|---|
| (days) | (days) | + Instrument | (Å) | Arm | |
| 20161127 | 57719.7 | 47 | AAT+AAOmega | 3750 – 9000 | 580V+385R |
| 20170102 | 57755.6 | 80 | Gemini+GMOS-S | 5700 – 7500 | R400-G5305 |
| 20170129 | 57782.0 | 105 | VLT+XSHOOTER | 3100 – 10400 | UV/VIS/NIR |
| 20170221 | 57805.0 | 127 | VLT+XSHOOTER | 3100 – 10400 | UV/VIS/NIR |
| 20170731 | 57965.3 | 278 | VLT+FORS2 | 4300 – 9500 | 300V+GG435 |
| 20171116 | 58074.2 | 380 | VLT+XSHOOTER | 3600 – 9600 | UV/VIS/NIR |
-
⋆ The phase is relative to the estimated explosion date, MJD d.
3 Characterizing DES16C3cje
3.1 Host galaxy properties
The host galaxy of DES16C3cje was identified as PGC3243310, a low-luminosity galaxy (M mag111http://leda.univ-lyon1.fr/) at a redshift of 0.0618222Redshift obtained from the narrow emission lines of the host galaxy. Adopting the recessional velocity corrected into the CMB frame333http://ned.ipac.caltech.edu/ (v km s-1), we obtain a distance of 275.95 Mpc, which corresponds to . The galactic reddening in the direction of PGC3243310 is mag (Schlafly & Finkbeiner, 2011). Due to the faintness of the galaxy and the absence of the absorption Na i D lines in the SN spectra, we assume the host extinction negligible.
Using a spectrum obtained by OzDES with the AAOmega at the AAT (see Sec. 3.4) and a spectrum from the 2dF Galaxy Redshift Survey (Colless et al., 2003), we estimate the integrated oxygen abundance. The lack of [N ii] suggests a very low metallicity. Setting the upper limits of the flux ratio of H[N ii] and measuring the ratio of [O iii]H, we estimate the upper limit of the metallicity. Applying the O3N2 diagnostic method from Marino et al. (2013), we obtain an oxygen abundance of . With the luminosity of H and the equation of Kennicutt & Evans (2012), we calculate the SFR to be 0.042 M☉ yr-1.
3.2 Light curves
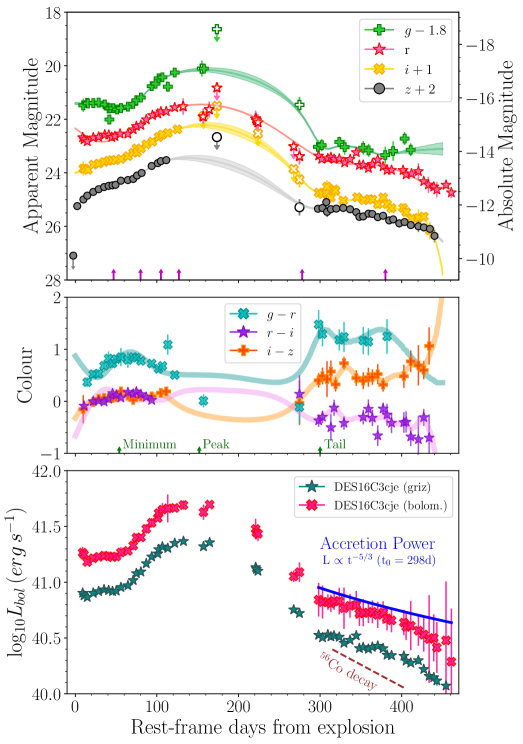
The unusual photometric evolution of DES16C3cje from to days is presented in Figure 1 (top panel). The light curves show an initial increase in brightness for the first 20 days followed by a decrease, particularly in the bluer filters, as observed in some SNe II (e.g., SN 2004em, SN 2004ek; Taddia et al., 2016). In the redder bands, the luminosity increase monotonically, with a change in the slope at days. After 60 days, the -band increases mag over 70 days versus mag in .
We use Gaussian processes (GPs) to interpolate the observed light curves (see de Jaeger et al., 2017; Inserra et al., 2018b; Angus et al., 2019, for more details). The interpolation was performed with the Python package GEORGE (Ambikasaran et al., 2016) using the Matern 3/2 kernel. We find that DES16C3cje reaches a peak brightness of mag at days in the -band. The long rise is reminiscent of SN 1987A, but over a longer scale; this behavior has not previously been observed in a SN II light curve. During the later phases (after days), the light curves show a linear decline in and a flat evolution in the -band. The slope of the decline in the -band light curve is 0.70 mag per 100 days, smaller than that expected from the full trapping of gamma-ray photons and positrons from the decay of 56Co (0.98 mag per 100 days; Woosley et al., 1989).
In the middle panel of Figure 1, the colour curves are presented. During the first 65 days (in the plateau), DES16C3cje becomes redder, changing from to . The SN then evolves to bluer colours. At late-phases ( days), the object has a redder colour than during the first two months, but its evolution is relatively flat.
3.3 Bolometric luminosity and Nickel mass
Using the photometric data, we compute the pseudo-bolometric and bolometric light curves for DES16C3cje (Figure 1, bottom panel) following the prescriptions presented by Inserra et al. (2018a). In this method, the bands are converted into fluxes at the effective filter wavelengths, and then corrected for the Milky Way extinction (presented in Section 3.1). A spectral energy distribution (SED) is then computed over the wavelengths covered and the flux under the SED is integrated assuming zero flux beyond the integration limits. Fluxes are converted to luminosities using the adopted distance (275.95 Mpc). We determined the points on the pseudo-bolometric light curves at epochs when were available simultaneously. Magnitudes from the missing bands were generally estimated by interpolating or extrapolating the light curves using low-order polynomials (n3) and assuming constant colours from nearest epochs. Therefore, we obtain a peak luminosity of erg s-1, and L erg s-1.
As expected based on the photometric data, the bolometric light curves decline slowly at late phases. This decline rate is slower than the radioactive decay of 56Co, but comparable to that expected from accretion power. Although the light curve tail does not follow the 56Co decay, we can still use the luminosity at late times to estimate an upper limit to the 56Ni mass. Comparing the bolometric light curve of DES16C3cje to that of SN 1987A, we estimate the 56Ni mass, , as follows:
| (1) |
where M(56Ni) M☉ is the 56Ni mass synthesised by SN 1987A (Arnett, 1996) and is the bolometric luminosity at a comparable epoch. This comparison gives M☉, a comparatively large value for typical SN II, but within the range of SN 1987A-like objects (Müller et al., 2017; Anderson, 2019).
3.4 Spectral evolution
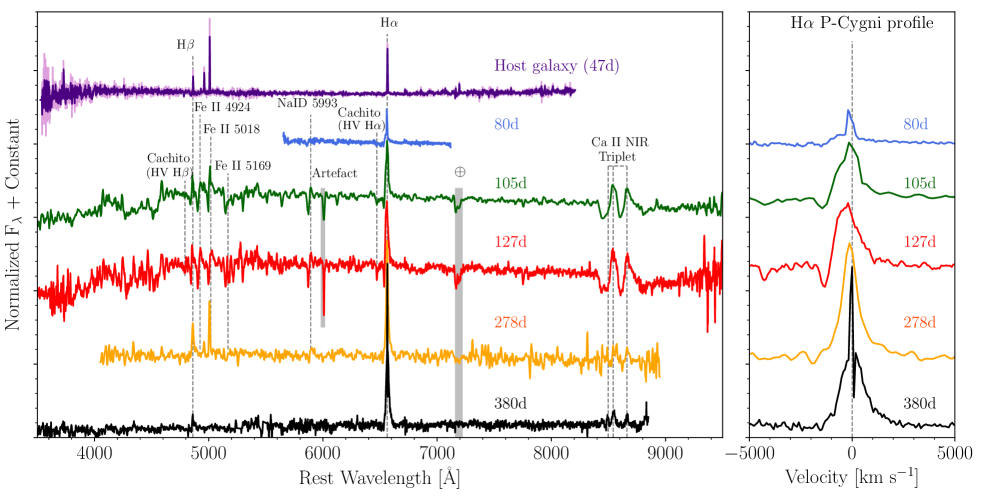
In Figure 2, we present the optical spectra obtained for DES16C3cje between d and d. At 47 d, the spectrum is completely dominated by the emission lines from the host galaxy, with no traces of the SN. From 80 d, the spectra show that DES16C3cje is a SN II with very narrow photospheric lines. At 80 d and 127 d, DES16C3cje presents characteristic P-Cygni profiles of H, H, Fe ii , Fe ii , Fe ii , Na i D and the Ca ii near-IR triplet, together with a lack of Sc ii and Ba ii lines. The ‘Cachito’ feature, related to high velocity (HV) spectra components (Gutiérrez et al., 2017), are also visible at these epochs, suggesting an interaction between the SN ejecta and circumstellar material (CSM). The later spectra are dominated by H, with a weak contribution of the Ca ii near-IR triplet in emission. There is no evidence of forbidden lines (e.g., [O i] 6300, 6363, [Fe ii] and [Ca ii] 7291, 7323), which are typical of core-collapse SNe at late phases. The lack of these lines could suggest either a high density associated with a large mass and low-velocity or an interaction between the SN ejecta and the CSM (Sec. 5).
DES16C3cje shows a complex H P-cygni profile (Figure 2, right panel). At early times (spectra between 80 d and 127 d), the absorption component increases in strength with time, from Å to Å; however, at 278 d and 380 d, this component is absent. The emission component at earlier times shows a Gaussian profile with an extra narrow emission line, caused by a contaminating H ii region. At late times, the H emission has a Lorentzian profile with a FWHM velocity of km s-1 at 295 d, increasing to km s-1 at 403 d. The absence of the absorption component, and the Lorentzian profile in emission, further indicate interaction between the ejecta and the CSM (Chugai et al., 2004). At 380 d, on the top of the emission component of the H, a small notch is observed; upon close examination this was revealed to be residuals from the galaxy subtraction444The expansion velocities and the pseudo-equivalent-widths were measured removing the contribution of the host galaxy..
Based on the width of the lines observed in the SN spectra, we infer very low expansion velocities. The velocity obtained for H decreases from km s-1 at 80 d, to km s-1 at 127 d. The velocities found for other lines show a similar behavior: low expansion velocities ( km s-1), and little evolution.
3.5 Comparison to other supernovae

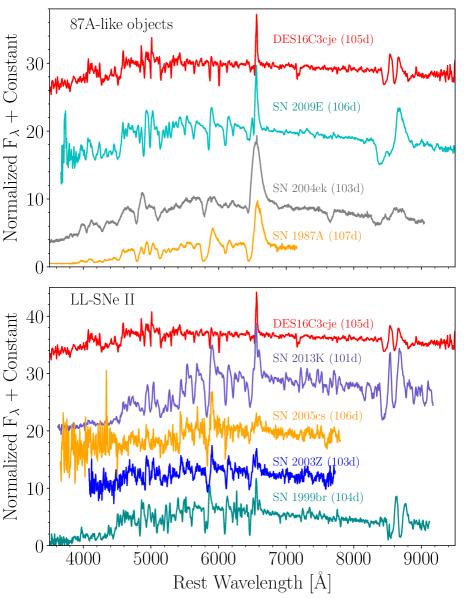
The slow rise of DES16C3cje is reminiscent of SN 1987A-like objects, whereas its low luminosity and low expansion velocities are a common characteristic in low luminosity (LL) SNe II. In Figure 3, we show the photometric and spectral comparison of DES16C3cje with these two classes of events. For the SN 1987A-like objects we compared with SN 1987A (Bouchet et al., 1989; Hamuy & Suntzeff, 1990), which is the best observed and studied SN II; SN 2004ek (Taddia et al., 2016) and SN 2004em (Taddia et al., 2016), which both show a plateau before the main peak; SN 2005ci (Taddia et al., 2016) and SN 2009E (Pastorello et al., 2012), which are the faintest clones of SN 1987A. For the LL SNe II, we select objects with spectra at around 110 days: SN 1999br (Pastorello et al., 2004; Galbany et al., 2016; Gutiérrez et al., 2017), which is the faintest slowly-declining SN II; SN2003Z (Spiro et al., 2014; Faran et al., 2014), SN 2005cs (Pastorello et al., 2006, 2009), and SN 2013K (Tomasella et al., 2018), which all have good photometric coverage in the first 150 days. The long rise to peak is common between the SN1987A-like events and DES16C3cje; however, the rise is even longer for DES16C3cje.
The full light curve evolution shows that DES16C3cje, from explosion to 60 d, exhibits a initial ‘plateau’. Although this plateau is not common in SN1987A-like objects, two other SNe do show it: SN 2004ek (in the and -bands) and SN 2004em (in the band, Taddia et al. 2016). Taddia et al. (2016) suggest that these two SNe are an intermediate case between SN 1987A and normal SNe II. Pastorello et al. (2012) argue that these plateaus are due to shock cooling. DES16C3cje also has the lowest luminosity within the SN1987A-like group, around 1 mag fainter than SN 1987A and mag fainter than the low-luminosity SN 2009E.
Comparing to the LL-SNe II sample, the initial evolution of DES16C3cje is consistent with typical SNe II for d; however a sudden increase in luminosity transforms a ‘typical SN II’ to a SN1987A-like event. The post-peak light curve evolution also differs, where all SN1987A-like and LL-SNe follow the rate of 56Co decay. In the case of DES16C3cje, the decay at late-times is slower, again suggesting an extra source of energy is needed. We also note that SN 2005cs shows a slow decline soon after the plateau (between 140 and days; Pastorello et al. 2009). One possible explanation for this flattening was given by Utrobin (2007), who suggested that it is produced by a residual contribution from radiation energy. Giving that this effect is predicted for typical slow-declining SNe II soon after the plateau phase, we explore an alternative scenario to explain the decay at the late-times in DES16C3cje.
To distinguish between the scenarios of 56Co decay and accretion power (L ) as explanations for the light curves, we compare the reduced chi-squared () values (shown in Table A2) of the corresponding fits to the SNe with data at late-time (between 280 and 500 days; DES16C3cje, SN 1987A, SN 2005cs and SN 2009E). Out of these, only for DES16C3cje does the power law provides a better fit (), supporting the idea of an extra source of energy. Because of the large uncertainties in the bolometric light curve of DES16C3cje, we test this result using a Monte Carlo resampling with random draws (assuming a Gaussian distribution). The results obtained support our previous findings.
Figure 3 also presents the spectral comparison at d from explosion. The comparison with SN1987A-like objects and LL-SNe II again shows that DES16C3cje is a unique object. None of the other SNe have lines as narrow as DES16C3cje. SN 1999br has the narrowest lines, but its spectrum also shows Ba ii and Sc ii, together with a multiple component H P-Cygni profile, characteristic of LL-SNe II.
4 Light curve modelling
We now consider some models that can be used to understand and explain the physical origin and unusual features of DES16C3cje. For these models, we use the one-dimensional Lagrangian hydrodynamical code presented in Bersten et al. (2011). This code simulates a SN explosion, and produces bolometric light curves and photospheric velocities to characterize the progenitor and explosion properties. There are two particular challenges to this modelling: the early photometric behavior (before peak) and the low expansion velocities, and the late-time decline rate. We begin with the former.
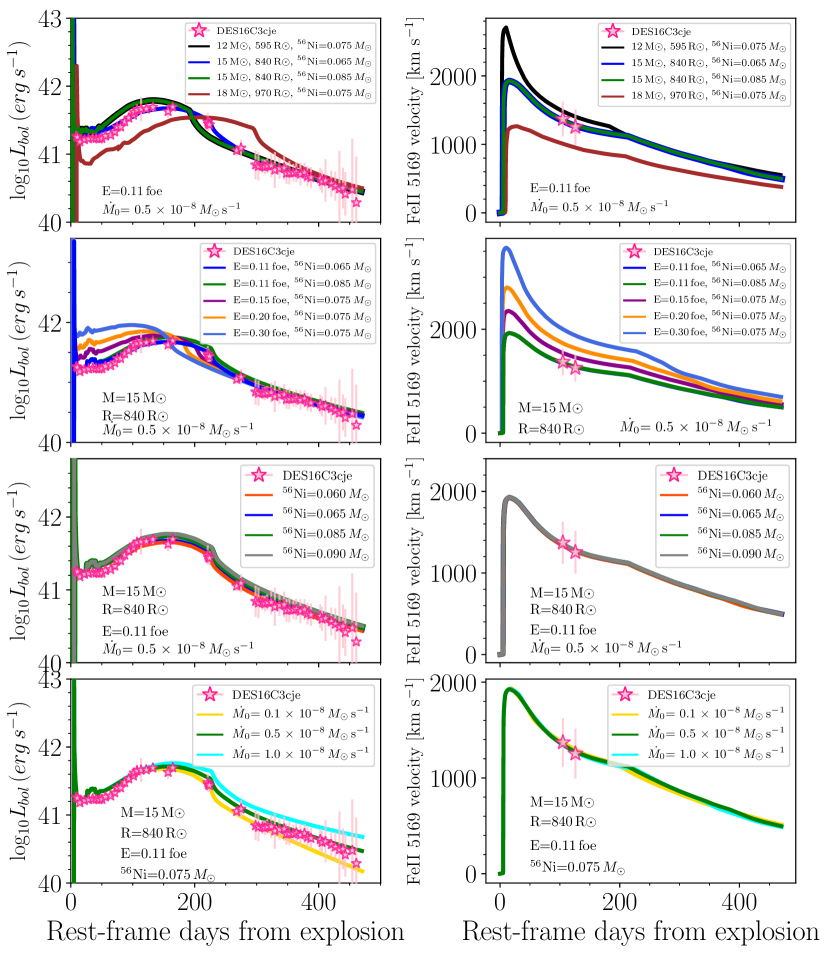
There is a degree of degeneracy between the progenitor (pre-SN) mass and radius (, ) and the explosion energy (), which can be partially reduced by modeling the luminosity evolution together with the expansion velocity evolution. For DES16C3cje, the expansion velocities imply a low ratio. We found that for a progenitor with similar characteristics to those used for SN 1987A (i.e., a blue supergiant star with R☉, M☉ and foe), there is no model that simultaneously matches the light curve and velocity evolution, as a low energy is needed to reproduce the latter. The low energy required leads to a much fainter and broader light curve than that observed. We found that explosion energies of foe are needed to reproduce the expansion velocities of DES16C3cje.
Therefore, we calculated a grid of hydrodynamical models with values of close to foe. Our pre-SN models were computed using the stellar evolution code MESA version 10398 (Paxton et al., 2011; Paxton et al., 2013, 2015, 2018). The stars were evolved from the pre-main-sequence to the time of core collapse, defined as when any part of the collapsing core exceeds an infall velocity of km s-1, and assuming solar metallicity. Our models cover the range of M☉ in intervals of 1 M☉(which corresponds to progenitor radii between 480 and 1050 R☉), and explosion energies between 0.1 and 0.5 foe with the exception of the largest masses and lower energies due to numerical difficulties.
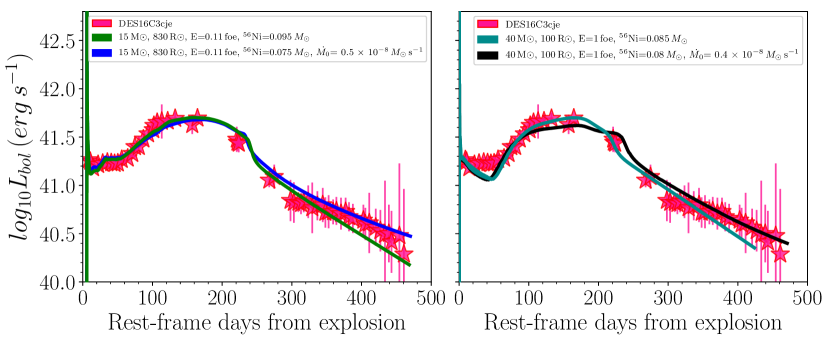
After exploring several configurations (see Figure B.1 in the Appendix), we found a model that reproduced the observations relatively well. This model is presented on the left panel of Figure 4 and has the following physical parameters: a M☉, a pre-SN mass of M☉, R☉ and foe. We also consider 56Ni masses in the range of 0.01 and 0.1 M☉ and find that a relatively large 56Ni mass of 0.095 M☉ is required to reproduce the light curve observed after the initial plateau. This material was mixed up to 0.75 of the pre-SN mass, and therefore a not too extreme mixing was required as is common in several 87A-like objects in order to produce the initial plateau and the long rise to the peak. In this scenario, the peculiar light curve shape of DES16C3cje can be understood as a combination of a low explosion energy and a relatively large 56Ni production, while its progenitor has a red supergiant (RSG) structure typical of other SN II objects.
We now turn to the late-time light curve. Despite the good agreement between the model and observations at early times, there are clear differences in the slopes during the light curve tail (green curve in Figure 4). As discussed above, DES16C3cje does not follow the behavior expected by radioactive decay of 56Co, but instead is consistent with a power law , compatible with the decline rate expected from accretion power (or ‘fallback’ 555The canonical power-law index, , is produced by a simple ballistic fallback model (Rees, 1988). However, standard viscous disc descriptions extend the duration of the emission, with an index closer to (see Balbus & Mummery, 2018, and references therein). This suggests that the index value changes depending on the conditions of the disc.; Michel 1988; Chevalier 1989). Under some conditions, for example if the SN explosion is not powerful enough, some material may not acquire sufficient energy to escape and will eventually be accreted onto the compact remnant. These accretions are usually associated with powerful energy outflows. A fraction of this energy can be thermalised within the SN ejecta and thus power the light curve (Dexter & Kasen, 2013).
We have included this extra energy in our 1D Lagrangian code to explore if this can improve the differences between the model and observations during the latter part of the light curve. The rate input of energy due to the accretion can be written as: L where is the fallback accretion rate, is the speed of light and is the efficiency factor, estimated to be of the order of (Dexter & Kasen, 2013). Analytic estimates (Chevalier, 1989), as well as numerical simulations (Zhang et al., 2008; Dexter & Kasen, 2013), have shown that the accretion rate can be assumed to be , where is the accretion rate onto the remnant at a time when the fallback episode begins. The fallback energy is instantaneously deposited after the explosion, near the center of the progenitor, and we assume full trapping.
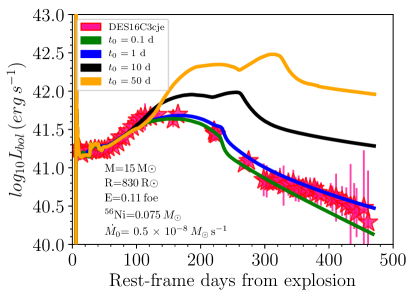
In our treatment, and are free parameters to be determined by comparison with the observations. We again calculate a grid of simulations, but this time vary in the range of and between 0.1 d and 50 d after the onset of the simulation, finding a set of parameters that can reproduce the behaviour of the light-curve tail of DES16C3cje. In the lower panel of Figure B.1, we show the effect on the light curve and velocities as a result of the variation of , while in Figure B.2, the changes in the light curve produced by different are presented. The fallback parameters found are: s-1 and d. These calculations were performed assuming the same progenitor and explosion energy as the RSG model presented above, and the combined model is shown in Figure 4 (left panel). The inclusion of fallback energy clearly improves the modelling during the tail, with almost no effect in other phases. However, we note a slightly smaller amount of 56Ni is needed when fallback energy is added; a good match is found using 0.075 of 56Ni. The value of is small compared with that usually found in the literature (Zhang et al., 2008; Moriya et al., 2018a). The reason is the low luminosity of this SN: larger accretion rates inject more energy and produce brighter light curves.
We emphasise that even though we try to model the light curve peak assuming that it was powered by fallback accretion instead of 56Ni, we are unable to find any set of fallback parameters that can reproduce it. Larger accretion rates produce more luminous light curves and earlier plateaus than observed. In addition, a delayed deposition of the fallback energy is not a solution as despite the low accretion rate, a time delay factor produces an extremely luminous plateau (similar to figure 2 of Moriya et al. 2019) and a brighter light curve tail.
The parameters of our preferred model point to a normal RSG progenitor that has experienced a low energy explosion leading to the fallback process. The peculiar light curve shape of DES16C3cje can then be explained as a combination of a low explosion energy, a relatively large 56Ni mass but not extremely mixing, and extra energy due to the accretion of material onto the compact remnant.
There is strong evidence of the existence of a correlation between the explosion energy and the amount of 56Ni (see for example Pejcha & Prieto, 2015), in the sense that more energetic events produce larger amount of 56Ni. This relation is also supported by theoretical studies. The low explosion energy and the relatively large 56Ni production found in our modelling does not follow the expected correlation. We note a low explosion energy was mainly required to reproduce the low-expansion velocities.
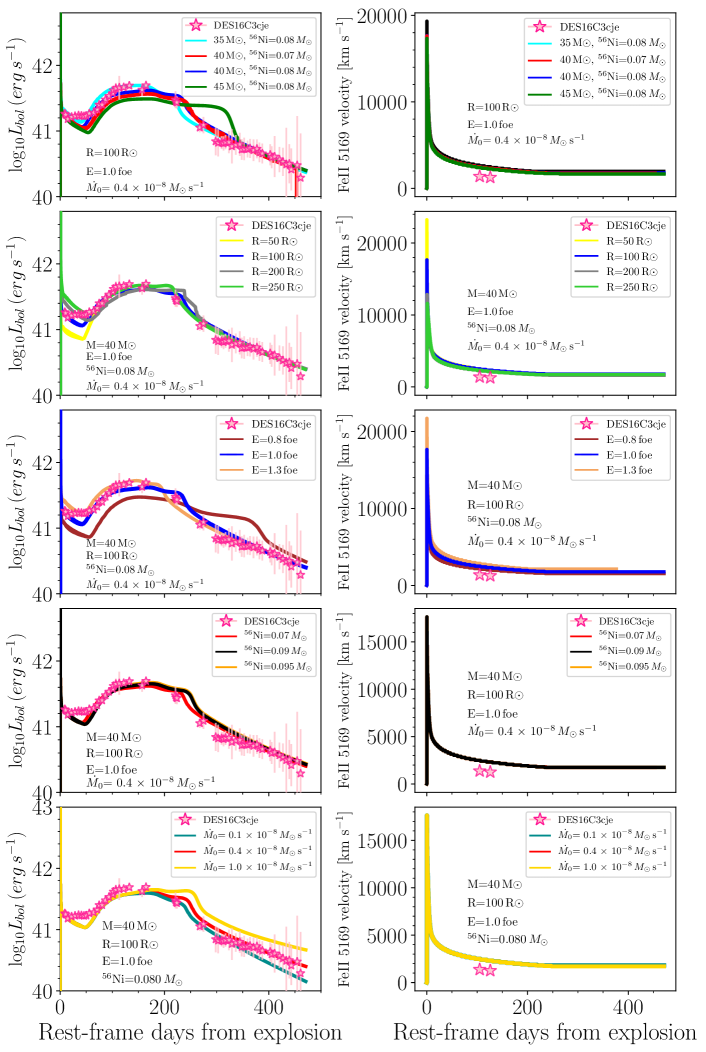
DES16C3cje has only two measurements of the expansion velocity available at d and d, and thus the expansion velocity during the first weeks of evolution is not unambiguously known, and the measurements around d may not represent the photospheric velocities of the ejecta. We experiment with relaxing the condition to reproduce the expansion velocity, and find an alternative model that reproduces relatively well the observed light curve with a progenitor with 40 M☉, an explosion energy of 1 foe and M☉ of 56Ni (Figure 4). Here, we used a polytropic model to describe the structure of the star before explosion. The fallback parameters needed to reproduce the tail are similar to that in the previous model, i.e, M☉ s-1 and d. The higher energy of this model is then more consistent with known correlations between 56Ni production and explosion energy. Figure B.3 shows the different configurations explored for this case. The parameters of the best-fit models are presented in Table A3.
5 Discussion and conclusions
DES16C3cje is a low-luminosity and low-velocity type II supernova (SN II). Its light curves show a plateau for days, followed by a long rise time, reminiscent of SN 1987A, but on a longer time-scale. The initial faint plateau can be explained by hydrogen recombination, while the broad peak is powered by radioactive decay. After 300 days, the tail presents a decline rate comparable to that expected from accretion power (). The narrow lines observed in the spectra imply low expansion velocities, and thus, low explosion energies. Taken together, these characteristics suggest an unusual explosion.
Modelling the light curve of DES16C3cje and its velocity evolution with hydrodynamical calculations, we have shown that the SN is consistent with the explosion of a RSG star with a mass of 15 M☉, an energy of foe, and synthesising a 56Ni mass of 0.075 M☉. Because of the low energy in the explosion, some material is accreted by the compact remnant with an accretion rate of M s-1. Although this scenario reproduces the light curve and velocities, at first sight the required 56Ni mass appears relatively large for two main reasons: 1) low energy explosions are observed to produce small amounts of 56Ni, and 2) in the fallback scenario, some amount of the 56Ni is expected to be accreted on to the central remnant.
However, Chevalier (1989) discussed the expectation that an ejection of substantial 56Ni would imply little mass fallback, and showed this is not valid for accretion after the passage of the reverse shock wave, when the 56Ni is expected to mix with outer core layers. Heger & Woosley (2010) further showed that a considerable amount of 56Ni comes out when mixing precedes fallback. The mixing in RSGs is larger than in compact objects as perturbations have more time to grow before freezing out. Under these considerations, it is not unusual to find SNe that both experienced some fallback and have a relatively large amount of 56Ni.
Nonetheless, we also consider an alternative scenario by assuming that the velocities measured from the absorption lines at 105 and 126 days do not represent the photospheric velocities of the ejecta. We then find that DES16C3cje can be modelled as the explosion of a relatively compact star ( R☉), with a mass of M☉, an explosion energy of foe, and a 56Ni mass of M☉.
Both models can reproduce the overall evolution of the light curve of DES16C3cje; however, the low-energy explosion of a RSG fits the early part of the light curve better, and provides a good agreement with expansion velocities.
A further possibility to explain the late-time light curve of DES16C3cje is interaction with CSM. Interacting objects (e.g. SNe IIn, SN 2009ip-like objects; Stritzinger et al., 2012; Fraser et al., 2015; Elias-Rosa et al., 2016; Pastorello et al., 2018) often have flattened late-time light curves, with decline rates slower than that expected for 56Co decay. The flat evolution in the light curves of DES16C3cje, together with the lack of [O ii] 6300, 6363, [Fe ii] and [Ca ii] 7291, 7323 emission lines, offer some support for this scenario. However, this evidence for interaction only appears at around 300 days from explosion with no evidence for interaction prior to this epoch, in turn suggesting a significant mass loss during the progenitor star evolution.
Theoretical models have also shown that stars with masses below 40 M☉ at low-metallicities undergo very little mass loss due to stellar winds (e.g. Woosley et al., 2007; Meynet et al., 2013). Assuming that the progenitor mass favored by our hydrodynamical models (15 and 40M☉) is correct, we would expect a low mass loss. The location of our object supports this argument: DES16C3cje exploded in a low-luminosity (low-metallicity, Sec. 3.1) host, and models predict low-metallicity stars have less mass loss and bigger hydrogen envelopes when they explode (e.g. Heger et al., 2003).
While the late-time light curve of DES16C3cje is following a decline rate close to , we cannot rule out a scenario involving interaction with CSM. Moriya et al. (2019) briefly discuss the possibility of CSM interaction in fallback SN and the need to study this issue in the future.
In summary, we have shown that the fallback SN scenario can naturally explain the slow decline in the late-time light curve. However, further investigations are needed to interpret the origin of these peculiar objects, the signatures required to identify the explosion scenario, and the role of the 56Ni mass and interaction with CSM.
Acknowledgements
We are grateful to Pedro Lacerda for performing some of the observations used in this work. We thank the anonymous referee for useful suggestions.
CPG and MS acknowledge support from EU/FP7-ERC grant No. [615929]. LG was funded by the European Union’s Horizon 2020 research and innovation programme under the Marie Skłodowska-Curie grant agreement No. 839090. TWC acknowledgments the funding provided by the Alexander von Humboldt Foundation. MF is supported by a Royal Society – Science Foundation Ireland University Research Fellowship. MG is supported by the Polish NCN MAESTRO grant 2014/14/A/ST9/00121. MN is supported by a Royal Astronomical Society Research Fellowship.
This work used data collected at the European Organisation for Astronomical Research in the Southern Hemisphere, Chile, under program IDs: 299.D-5040(A), 299.D-5040(B), 0100.D-0461(A), 194.C-0207(I), and as part of PESSTO, (the Public ESO Spectroscopic Survey for Transient Objects Survey) ESO program 197.D-1075, 199.D-0143.
Some of the data presented here were obtained at the Gemini Observatory, which is operated by the Association of Universities for Research in Astronomy, Inc., under a cooperative agreement with the NSF on behalf of the Gemini partnership: the National Science Foundation (United States), the National Research Council (Canada), CONICYT (Chile), Ministerio de Ciencia, Tecnología e Innovación Productiva (Argentina), and Ministério da Ciência, Tecnologia e Inovação (Brazil). Gemini observations were obtained under programme NOAO GS-2016B-Q-9.
Funding for the DES Projects has been provided by the U.S. Department of Energy, the U.S. National Science Foundation, the Ministry of Science and Education of Spain, the Science and Technology Facilities Council of the United Kingdom, the Higher Education Funding Council for England, the National Center for Supercomputing Applications at the University of Illinois at Urbana-Champaign, the Kavli Institute of Cosmological Physics at the University of Chicago, the Center for Cosmology and Astro-Particle Physics at the Ohio State University, the Mitchell Institute for Fundamental Physics and Astronomy at Texas A&M University, Financiadora de Estudos e Projetos, Fundação Carlos Chagas Filho de Amparo à Pesquisa do Estado do Rio de Janeiro, Conselho Nacional de Desenvolvimento Científico e Tecnológico and the Ministério da Ciência, Tecnologia e Inovação, the Deutsche Forschungsgemeinschaft and the Collaborating Institutions in the Dark Energy Survey.
The Collaborating Institutions are Argonne National Laboratory, the University of California at Santa Cruz, the University of Cambridge, Centro de Investigaciones Energéticas, Medioambientales y Tecnológicas-Madrid, the University of Chicago, University College London, the DES-Brazil Consortium, the University of Edinburgh, the Eidgenössische Technische Hochschule (ETH) Zürich, Fermi National Accelerator Laboratory, the University of Illinois at Urbana-Champaign, the Institut de Ciències de l’Espai (IEEC/CSIC), the Institut de Física d’Altes Energies, Lawrence Berkeley National Laboratory, the Ludwig-Maximilians Universität München and the associated Excellence Cluster Universe, the University of Michigan, the National Optical Astronomy Observatory, the University of Nottingham, The Ohio State University, the University of Pennsylvania, the University of Portsmouth, SLAC National Accelerator Laboratory, Stanford University, the University of Sussex, Texas A&M University, and the OzDES Membership Consortium.
Based in part on observations at Cerro Tololo Inter-American Observatory, National Optical Astronomy Observatory, which is operated by the Association of Universities for Research in Astronomy (AURA) under a cooperative agreement with the National Science Foundation.
Part of the funding for GROND (both hardware as well as personnel) was generously granted from the Leibniz-Prize to Prof. G. Hasinger (DFG grant HA 1850/28-1).
This paper includes data gathered with the 6.5 meter Magellan Clay Telescope located at Las Campanas Observatory, Chile under the programme 100type IA Supernovae (100IAS) survey.
This work has been partially supported by the Spanish grant PGC2018-095317-B-C21 within the European Funds for Regional Development (FEDER).
The DES data management system is supported by the National Science Foundation under Grant Numbers AST-1138766 and AST-1536171. The DES participants from Spanish institutions are partially supported by MINECO under grants AYA2015-71825, ESP2015-66861, FPA2015-68048, SEV-2016-0588, SEV-2016-0597, and MDM-2015-0509, some of which include ERDF funds from the European Union. IFAE is partially funded by the CERCA program of the Generalitat de Catalunya. Research leading to these results has received funding from the European Research Council under the European Union’s Seventh Framework Program (FP7/2007-2013) including ERC grant agreements 240672, 291329, and 306478. We acknowledge support from the Brazilian Instituto Nacional de Ciênciae Tecnologia (INCT) e-Universe (CNPq grant 465376/2014-2).
This research used resources of the National Energy Research Scientific Computing Center (NERSC), a U.S. Department of Energy Office of Science User Facility operated under Contract No. DE-AC02-05CH11231.
This manuscript has been authored by Fermi Research Alliance, LLC under Contract No. DE-AC02-07CH11359 with the U.S. Department of Energy, Office of Science, Office of High Energy Physics. The United States Government retains and the publisher, by accepting the article for publication, acknowledges that the United States Government retains a non-exclusive, paid-up, irrevocable, world-wide license to publish or reproduce the published form of this manuscript, or allow others to do so, for United States Government purposes.
References
- Ambikasaran et al. (2016) Ambikasaran S., et al., 2016, IEEE Trans. Pattern Anal. Mach. Intell., 38
- Anderson (2019) Anderson J. P., 2019, A&A, 628, A7
- Andrews & Smith (2018) Andrews J. E., Smith N., 2018, MNRAS, 477, 74
- Angus et al. (2019) Angus C. R., et al., 2019, MNRAS, p. 1302
- Appenzeller et al. (1998) Appenzeller I., et al., 1998, The Messenger, 94, 1
- Arcavi et al. (2017) Arcavi I., et al., 2017, Nature, 551, 210
- Arnett (1996) Arnett D., 1996, Supernovae and Nucleosynthesis: An Investigation of the History of Matter from the Big Bang to the Present
- Balbus & Mummery (2018) Balbus S. A., Mummery A., 2018, MNRAS, 481, 3348
- Bernstein et al. (2012) Bernstein J. P., et al., 2012, ApJ, 753, 152
- Bersten & Benvenuto (2016) Bersten M. C., Benvenuto O. G., 2016, Boletin de la Asociacion Argentina de Astronomia La Plata Argentina, 58, 246
- Bersten et al. (2011) Bersten M. C., Benvenuto O., Hamuy M., 2011, ApJ, 729, 61
- Bouchet et al. (1989) Bouchet P., Moneti A., Slezak E., Le Bertre T., Manfroid J., 1989, A&AS, 80, 379
- Buzzoni et al. (1984) Buzzoni B., et al., 1984, The Messenger, 38, 9
- Chevalier (1989) Chevalier R. A., 1989, ApJ, 346, 847
- Chugai et al. (2004) Chugai N. N., et al., 2004, MNRAS, 352, 1213
- Colgate (1971) Colgate S. A., 1971, ApJ, 163, 221
- Colless et al. (2003) Colless M., et al., 2003, VizieR Online Data Catalog, p. VII/226
- Dessart (2018) Dessart L., 2018, A&A, 610, L10
- Dexter & Kasen (2013) Dexter J., Kasen D., 2013, ApJ, 772, 30
- Drout et al. (2014) Drout M. R., et al., 2014, ApJ, 794, 23
- Elias-Rosa et al. (2016) Elias-Rosa N., et al., 2016, MNRAS, 463, 3894
- Faran et al. (2014) Faran T., et al., 2014, MNRAS, 442, 844
- Firth et al. (2015) Firth R. E., et al., 2015, MNRAS, 446, 3895
- Flaugher et al. (2015) Flaugher B., et al., 2015, AJ, 150, 150
- Fraser et al. (2015) Fraser M., et al., 2015, MNRAS, 453, 3886
- Freudling et al. (2013) Freudling W., Romaniello M., Bramich D. M., Ballester P., Forchi V., García-Dabló C. E., Moehler S., Neeser M. J., 2013, A&A, 559, A96
- Fryer (1999) Fryer C. L., 1999, ApJ, 522, 413
- Fryer et al. (2009) Fryer C. L., et al., 2009, ApJ, 707, 193
- Gal-Yam (2012) Gal-Yam A., 2012, Science, 337, 927
- Gal-Yam et al. (2009) Gal-Yam A., et al., 2009, Nature, 462, 624
- Galbany et al. (2016) Galbany L., et al., 2016, AJ, 151, 33
- Goldstein et al. (2015) Goldstein D. A., et al., 2015, AJ, 150, 82
- Greiner et al. (2008) Greiner J., et al., 2008, PASP, 120, 405
- Gutiérrez et al. (2017) Gutiérrez C. P., et al., 2017, ApJ, 850, 89
- Hamuy & Suntzeff (1990) Hamuy M., Suntzeff N. B., 1990, AJ, 99, 1146
- Heger & Woosley (2002) Heger A., Woosley S. E., 2002, ApJ, 567, 532
- Heger & Woosley (2010) Heger A., Woosley S. E., 2010, ApJ, 724, 341
- Heger et al. (2003) Heger A., Fryer C. L., Woosley S. E., Langer N., Hartmann D. H., 2003, ApJ, 591, 288
- Hook et al. (2004) Hook I. M., Jørgensen I., Allington-Smith J. R., Davies R. L., Metcalfe N., Murowinski R. G., Crampton D., 2004, PASP, 116, 425
- Inserra et al. (2018a) Inserra C., et al., 2018a, MNRAS, 475, 1046
- Inserra et al. (2018b) Inserra C., Prajs S., Gutierrez C. P., Angus C., Smith M., Sullivan M., 2018b, ApJ, 854, 175
- Kasen & Bildsten (2010) Kasen D., Bildsten L., 2010, ApJ, 717, 245
- Kasliwal et al. (2012) Kasliwal M. M., et al., 2012, ApJ, 755, 161
- Kennicutt & Evans (2012) Kennicutt R. C., Evans N. J., 2012, ARA&A, 50, 531
- Kessler et al. (2015) Kessler R., et al., 2015, AJ, 150, 172
- Krühler et al. (2008) Krühler T., et al., 2008, ApJ, 685, 376
- Marino et al. (2013) Marino R. A., et al., 2013, A&A, 559, A114
- Meynet et al. (2013) Meynet G., Eggenberger P., Ekström S., Georgy C., Groh J., Maeder A., Saio H., Moriya T., 2013, in Alecian G., Lebreton Y., Richard O., Vauclair G., eds, EAS Publications Series Vol. 63, EAS Publications Series. pp 373–383 (arXiv:1308.5797), doi:10.1051/eas/1363042
- Michel (1988) Michel F. C., 1988, Nature, 333, 644
- Moriya et al. (2010) Moriya T., Tominaga N., Tanaka M., Nomoto K., Sauer D. N., Mazzali P. A., Maeda K., Suzuki T., 2010, ApJ, 719, 1445
- Moriya et al. (2018a) Moriya T. J., Sorokina E. I., Chevalier R. A., 2018a, Space Sci. Rev., 214, 59
- Moriya et al. (2018b) Moriya T. J., Terreran G., Blinnikov S. I., 2018b, MNRAS, 475, L11
- Moriya et al. (2019) Moriya T. J., Müller B., Chan C., Heger A., Blinnikov S. I., 2019, ApJ, 880, 21
- Müller et al. (2017) Müller T., Prieto J. L., Pejcha O., Clocchiatti A., 2017, ApJ, 841, 127
- Orellana et al. (2018) Orellana M., Bersten M. C., Moriya T. J., 2018, A&A, 619, A145
- Osip et al. (2004) Osip D. J., et al., 2004, in Moorwood A. F. M., Iye M., eds, Society of Photo-Optical Instrumentation Engineers (SPIE) Conference Series Vol. 5492, Proc. SPIE. pp 49–59, doi:10.1117/12.552414
- Papadopoulos et al. (2015) Papadopoulos A., et al., 2015, MNRAS, 449, 1215
- Pastorello et al. (2004) Pastorello A., et al., 2004, MNRAS, 347, 74
- Pastorello et al. (2006) Pastorello A., et al., 2006, MNRAS, 370, 1752
- Pastorello et al. (2009) Pastorello A., et al., 2009, MNRAS, 394, 2266
- Pastorello et al. (2012) Pastorello A., et al., 2012, A&A, 537, A141
- Pastorello et al. (2018) Pastorello A., et al., 2018, MNRAS, 474, 197
- Paxton et al. (2011) Paxton B., Bildsten L., Dotter A., Herwig F., Lesaffre P., Timmes F., 2011, The Astrophysical Journal Supplement Series, 192, 3
- Paxton et al. (2013) Paxton B., et al., 2013, The Astrophysical Journal Supplement Series, 208, 4
- Paxton et al. (2015) Paxton B., et al., 2015, ApJS, 220, 15
- Paxton et al. (2018) Paxton B., et al., 2018, ApJS, 234, 34
- Pejcha & Prieto (2015) Pejcha O., Prieto J. L., 2015, ApJ, 799, 215
- Perets et al. (2010) Perets H. B., et al., 2010, Nature, 465, 322
- Phillips et al. (1988) Phillips M. M., Heathcote S. R., Hamuy M., Navarrete M., 1988, AJ, 95, 1087
- Pursiainen et al. (2018) Pursiainen M., et al., 2018, preprint, (arXiv:1803.04869)
- Rees (1988) Rees M. J., 1988, Nature, 333, 523
- Schlafly & Finkbeiner (2011) Schlafly E. F., Finkbeiner D. P., 2011, ApJ, 737, 103
- Smartt et al. (2015) Smartt S. J., et al., 2015, A&A, 579, A40
- Smith et al. (2016) Smith M., et al., 2016, ApJ, 818, L8
- Sollerman et al. (2019) Sollerman J., et al., 2019, A&A, 621, A30
- Spiro et al. (2014) Spiro S., et al., 2014, MNRAS, 439, 2873
- Stritzinger et al. (2012) Stritzinger M., et al., 2012, ApJ, 756, 173
- Taddia et al. (2016) Taddia F., et al., 2016, A&A, 588, A5
- Terreran et al. (2017) Terreran G., et al., 2017, Nature Astronomy, 1, 713
- Tody (1986) Tody D., 1986, in Crawford D. L., ed., Society of Photo-Optical Instrumentation Engineers (SPIE) Conference Series Vol. 627, Instrumentation in astronomy VI. p. 733, doi:10.1117/12.968154
- Tomasella et al. (2018) Tomasella L., et al., 2018, MNRAS, 475, 1937
- Utrobin (2007) Utrobin V. P., 2007, A&A, 461, 233
- Vernet et al. (2011) Vernet J., et al., 2011, A&A, 536, A105
- Wang et al. (2018) Wang L. J., et al., 2018, ApJ, 865, 95
- Woosley (2017) Woosley S. E., 2017, ApJ, 836, 244
- Woosley (2018) Woosley S. E., 2018, ApJ, 863, 105
- Woosley & Weaver (1995) Woosley S. E., Weaver T. A., 1995, ApJS, 101, 181
- Woosley et al. (1989) Woosley S. E., Pinto P. A., Hartmann D., 1989, ApJ, 346, 395
- Woosley et al. (2007) Woosley S. E., Blinnikov S., Heger A., 2007, Nature, 450, 390
- Zhang et al. (2008) Zhang W., Woosley S. E., Heger A., 2008, ApJ, 679, 639
- de Jaeger et al. (2017) de Jaeger T., et al., 2017, MNRAS, 472, 4233
Appendix A Tables
| UT date | MJD | Rest-frame phase | Instrument | ||||
|---|---|---|---|---|---|---|---|
| (days) | (mag) | (mag) | (mag) | (mag) | |||
| 20161011 | 57673.3 | 2.9 | – | – | – | DECam | |
| 20161018 | 57680.3 | 9.5 | – | – | – | DECam | |
| 20161019 | 57681.1 | 10.3 | – | DECam | |||
| 20161020 | 57682.1 | 11.2 | – | – | DECam | ||
| 20161024 | 57686.3 | 15.2 | – | DECam | |||
| 20161025 | 57687.2 | 16.0 | – | – | DECam | ||
| 20161101 | 57694.1 | 22.5 | DECam | ||||
| 20161108 | 57701.1 | 29.1 | DECam | ||||
| 20161115 | 57708.2 | 35.8 | DECam | ||||
| 20161121 | 57714.1 | 41.3 | DECam | ||||
| 20161122 | 57715.1 | 42.3 | – | – | – | DECam | |
| 20161123 | 57716.2 | 43.3 | – | – | – | DECam | |
| 20161126 | 57719.2 | 46.1 | DECam | ||||
| 20161201 | 57724.1 | 50.8 | DECam | ||||
| 20161207 | 57730.1 | 56.4 | DECam | ||||
| 20161216 | 57739.2 | 65.0 | DECam | ||||
| 20161223 | 57746.1 | 71.5 | DECam | ||||
| 20161227 | 57750.2 | 75.3 | – | DECam | |||
| 20161228 | 57751.1 | 76.2 | – | – | DECam | ||
| 20170102 | 57756.1 | 80.9 | DECam | ||||
| 20170109 | 57763.1 | 87.5 | – | – | DECam | ||
| 20170116 | 57770.1 | 94.1 | DECam | ||||
| 20170121 | 57775.2 | 98.9 | – | – | – | DECam | |
| 20170124 | 57778.1 | 101.6 | – | – | DECam | ||
| 20170125 | 57779.1 | 102.6 | – | – | DECam | ||
| 20170128 | 57782.1 | 105.4 | – | – | DECam | ||
| 20170130 | 57784.1 | 107.3 | – | – | DECam | ||
| 20170204 | 57789.1 | 112.0 | – | – | DECam | ||
| 20170206 | 57791.1 | 113.9 | – | – | DECam | ||
| 20170215 | 57800.1 | 122.3 | – | – | DECam | ||
| 20170218 | 57803.5 | 125.5 | – | – | – | DECam | |
| 20170227 | 57811.5 | 133.1 | – | – | – | EFOSC2 | |
| 20170325 | 57837.5 | 157.6 | – | EFOSC2 | |||
| 20170402 | 57845.5 | 165.1 | – | – | – | EFOSC2 | |
| 20170412 | 57855.5 | 174.5 | GROND | ||||
| 20170531 | 57905.4 | 221.5 | – | – | – | EFOSC2 | |
| 20170601 | 57906.4 | 222.5 | – | – | – | EFOSC2 | |
| 20170603 | 57908.4 | 224.3 | – | – | EFOSC2 | ||
| 20170720 | 57955.9 | 269.1 | – | – | LDSS3 | ||
| 20170727 | 57962.4 | 275.2 | FORS2 | ||||
| 20170821 | 57987.3 | 298.6 | DECam | ||||
| 20170826 | 57992.3 | 303.4 | DECam |
| UT date | MJD | Rest-frame phase | Instrument | ||||
|---|---|---|---|---|---|---|---|
| (days) | (mag) | (mag) | (mag) | (mag) | |||
| 20170831 | 57997.3 | 308.1 | – | – | – | DECam | |
| 20170901 | 57998.2 | 308.9 | – | – | DECam | ||
| 20170902 | 57999.3 | 309.9 | – | – | DECam | ||
| 20170906 | 58003.3 | 313.7 | – | DECam | |||
| 20170910 | 58007.4 | 317.6 | – | – | DECam | ||
| 20170912 | 58009.4 | 319.5 | – | – | DECam | ||
| 20170917 | 58014.2 | 324.0 | – | – | DECam | ||
| 20170923 | 58020.3 | 329.7 | DECam | ||||
| 20171001 | 58028.2 | 337.2 | – | – | DECam | ||
| 20171009 | 58036.3 | 344.8 | – | DECam | |||
| 20171013 | 58040.3 | 348.6 | – | – | DECam | ||
| 20171018 | 58045.3 | 353.3 | DECam | ||||
| 20171025 | 58052.1 | 359.7 | DECam | ||||
| 20171030 | 58057.2 | 364.5 | – | DECam | |||
| 20171106 | 58064.2 | 371.1 | – | DECam | |||
| 20171113 | 58071.2 | 377.7 | – | DECam | |||
| 20171118 | 58076.3 | 382.5 | – | DECam | |||
| 20171121 | 58079.1 | 385.1 | – | – | – | DECam | |
| 20171124 | 58082.2 | 388.0 | – | – | DECam | ||
| 20171126 | 58084.3 | 390.0 | – | – | DECam | ||
| 20171204 | 58092.2 | 397.4 | – | – | – | DECam | |
| 20171210 | 58098.2 | 403.1 | DECam | ||||
| 20171213 | 58101.2 | 405.9 | – | – | DECam | ||
| 20171219 | 58107.2 | 411.6 | DECam | ||||
| 20171229 | 58117.1 | 420.9 | – | DECam | |||
| 20180105 | 58124.1 | 427.5 | – | DECam | |||
| 20180112 | 58131.1 | 434.1 | – | DECam | |||
| 20180118 | 58137.1 | 439.7 | – | – | DECam | ||
| 20180122 | 58141.1 | 443.5 | – | – | – | DECam | |
| 20180203 | 58153.1 | 454.8 | – | – | – | DECam | |
| 20180210 | 58160.0 | 461.3 | – | – | – | DECam |
-
Notes: The magnitudes have not been corrected for extinction. DECam: Dark Energy Camera at Blanco 4-m telescope; EFOSC2: ESO Faint Object Spectrograph and Camera at the 3.5-m ESO New Technology Telescope (NTT); GROND: Gamma-Ray Burst Optical/Near-Infrared Detector at the 2.2-m MPG telescope; LDSS3: Low Dispersion Survey Spectrograph at the Magellan Clay 6.5-m telescope; FORS2: FOcal Reducer/low dispersion Spectrograph 2 at the ESO Very Large Telescope (VLT).
| SN | Power-law | Exponential |
|---|---|---|
| (accretion power) | (56Co decay) | |
| DES16C3cje | 0.710 | 2.384 |
| SN 1987A | 14.060 | 2.551 |
| SN 2005cs | 5.871 | 0.249 |
| SN 2009E | 2.510 | 0.116 |
| Model | Mass | Radius | Energy | Ni mass | Reference | |
|---|---|---|---|---|---|---|
| (M☉) | (R☉) | (Foe) | (M☉) | (M☉ s-1) | (Colour) | |
| RSG | 15 | 830 | 0.11 | 0.095 | … | Green line |
| RSG | 15 | 830 | 0.11 | 0.095 | Blue line | |
| BSG | 40 | 100 | 1.0 | 0.085 | … | Cyan line |
| BSG | 40 | 100 | 1.0 | 0.080 | Black line |
Appendix B Figures
1 Department of Physics and Astronomy, University of Southampton, Southampton, SO17 1BJ, UK
2 Facultad de Ciencias Astronómicas y Geofísicas, Universidad Nacional de La Plata, Paseo del Bosque S/N, B1900FWA, La Plata, Argentina
3 Instituto de Astrofísica de La Plata (IALP), CCT-CONICET-UNLP. Paseo del Bosque S/N, B1900FWA, La Plata, Argentina
4 Kavli Institute for the Physics and Mathematics of the Universe (WPI), The University of Tokyo, 5-1-5 Kashiwanoha, Kashiwa, Chiba 277-8583, Japan
5 School of Physics & Astronomy, Cardiff University, Queens Buildings, The Parade, Cardiff, CF24 3AA, UK
6 European Southern Observatory, Alonso de Córdova 3107, Casilla 19, Santiago, Chile
7 Division of Science, National Astronomical Observatory of Japan, 2-21-1 Osawa, Mitaka, Tokyo 181-8588, Japan
8 INAF – Osservatorio Astronomico di Padova, Padova, Italy.
9 Departamento de Física Teórica y del Cosmos, Universidad de Granada, E-18071 Granada, Spain
10 Lawrence Berkeley National Laboratory, 1 Cyclotron Road, Berkeley, CA 94720, USA
11 University of Copenhagen, Dark Cosmology Centre, Juliane Maries Vej 30, 2100 Copenhagen O, Denmark
12 The Oskar Klein Centre, Department of Astronomy, Stockholm University, AlbaNova, 10691 Stockholm, Sweden.
13 INAF, Astrophysical Observatory of Turin, I-10025 Pino Torinese, Italy
14 Max-Planck-Institut für Extraterrestrische Physik, Giessenbachstraße 1, 85748, Garching, Germany
15 School of Mathematics and Physics, University of Queensland, Brisbane, QLD 4072, Australia
16 Capodimonte Observatory, INAF-Naples , Salita Moiariello 16, 80131-Naples, Italy.
17 European Southern Observatory, Karl-Schwarzschild-Str. 2, D-85748 Garching b. München, Germany.
18 Santa Cruz Institute for Particle Physics, Santa Cruz, CA 95064, USA
19 School of Physics, O’Brien Centre for Science North, University College Dublin, Dublin, Ireland.
20 Institute of Cosmology and Gravitation, University of Portsmouth, Portsmouth, PO1 3FX, UK
21 CENTRA, Instituto Superior Técnico, Universidade de Lisboa, Av. Rovisco Pais 1, 1049-001 Lisboa, Portugal
22 Astronomical Observatory, University of Warsaw, Al. Ujazdowskie 4, 00-478 Warszawa, Poland
23 Tuorla Observatory, Department of Physics and Astronomy, University of Turku, FI-20014 Turku, Finland
24 Observatories of the Carnegie Institution for Science, 813 Santa Barbara Street, Pasadena, CA 91101, USA
25 Sydney Institute for Astronomy, School of Physics, A28, The University of Sydney, NSW 2006, Australia
26 School of Physics, Trinity College Dublin, The University of Dublin, Dublin 2, Ireland.
27 Université Clermont Auvergne, CNRS/IN2P3, LPC, F-63000 Clermont-Ferrand, France
28 Las Campanas Observatory, Carnegie Observatories, Casilla 601, La Serena, Chile
29 Institute for Astronomy, University of Edinburgh, Royal Observatory, Blackford Hill, EH9 3HJ, UK
30 Birmingham Institute for Gravitational Wave Astronomy and School of Physics and Astronomy, University of Birmingham, Birmingham B15 2TT, UK
31 The Research School of Astronomy and Astrophysics, Australian National University, ACT 2601, Australia
32 Departamento de Física Matemática, Instituto de Física, Universidade de São Paulo, CP 66318, São Paulo, SP, 05314-970, Brazil
33 Laboratório Interinstitucional de e-Astronomia - LIneA, Rua Gal. José Cristino 77, Rio de Janeiro, RJ - 20921-400, Brazil
34 Fermi National Accelerator Laboratory, P. O. Box 500, Batavia, IL 60510, USA
35 Instituto de Fisica Teorica UAM/CSIC, Universidad Autonoma de Madrid, 28049 Madrid, Spain
36 CNRS, UMR 7095, Institut d’Astrophysique de Paris, F-75014, Paris, France
37 Sorbonne Universités, UPMC Univ Paris 06, UMR 7095, Institut d’Astrophysique de Paris, F-75014, Paris, France
38 Department of Physics & Astronomy, University College London, Gower Street, London, WC1E 6BT, UK
39 Kavli Institute for Particle Astrophysics & Cosmology, P. O. Box 2450, Stanford University, Stanford, CA 94305, USA
40 SLAC National Accelerator Laboratory, Menlo Park, CA 94025, USA
41 Centro de Investigaciones Energéticas, Medioambientales y Tecnológicas (CIEMAT), Madrid, Spain
42 Department of Astronomy, University of Illinois at Urbana-Champaign, 1002 W. Green Street, Urbana, IL 61801, USA
43 National Center for Supercomputing Applications, 1205 West Clark St., Urbana, IL 61801, USA
44 Institut de Física d’Altes Energies (IFAE), The Barcelona Institute of Science and Technology, Campus UAB, 08193 Bellaterra (Barcelona) Spain
45 INAF-Osservatorio Astronomico di Trieste, via G. B. Tiepolo 11, I-34143 Trieste, Italy
46 Institute for Fundamental Physics of the Universe, Via Beirut 2, 34014 Trieste, Italy
47 Observatório Nacional, Rua Gal. José Cristino 77, Rio de Janeiro, RJ - 20921-400, Brazil
48 Department of Physics, IIT Hyderabad, Kandi, Telangana 502285, India
49 Department of Astronomy/Steward Observatory, University of Arizona, 933 North Cherry Avenue, Tucson, AZ 85721-0065, USA
50 Jet Propulsion Laboratory, California Institute of Technology, 4800 Oak Grove Dr., Pasadena, CA 91109, USA
51 Institut d’Estudis Espacials de Catalunya (IEEC), 08034 Barcelona, Spain
52 Institute of Space Sciences (ICE, CSIC), Campus UAB, Carrer de Can Magrans, s/n, 08193 Barcelona, Spain
53 Kavli Institute for Cosmological Physics, University of Chicago, Chicago, IL 60637, USA
54 Department of Astronomy, University of Michigan, Ann Arbor, MI 48109, USA
55 Department of Physics, University of Michigan, Ann Arbor, MI 48109, USA
56 Department of Physics, Stanford University, 382 Via Pueblo Mall, Stanford, CA 94305, USA
57 Center for Cosmology and Astro-Particle Physics, The Ohio State University, Columbus, OH 43210, USA
58 Department of Physics, The Ohio State University, Columbus, OH 43210, USA
59 Center for Astrophysics Harvard & Smithsonian, 60 Garden Street, Cambridge, MA 02138, USA
60 Australian Astronomical Optics, Macquarie University, North Ryde, NSW 2113, Australia
61 Lowell Observatory, 1400 Mars Hill Rd, Flagstaff, AZ 86001, USA
62 Department of Physics and Astronomy, University of Pennsylvania, Philadelphia, PA 19104, USA
63 Institució Catalana de Recerca i Estudis Avançats, E-08010 Barcelona, Spain
64 Department of Astrophysical Sciences, Princeton University, Peyton Hall, Princeton, NJ 08544, USA
65 Brandeis University, Physics Department, 415 South Street, Waltham MA 02453
66 Computer Science and Mathematics Division, Oak Ridge National Laboratory, Oak Ridge, TN 37831
67 Universitäts-Sternwarte, Fakultät für Physik, Ludwig-Maximilians Universität München, Scheinerstr. 1, 81679 München, Germany
68 Cerro Tololo Inter-American Observatory, National Optical Astronomy Observatory, Casilla 603, La Serena, Chile
69 Department of Physics and Astronomy, Pevensey Building, University of Sussex, Brighton, BN1 9QH, UK