NCVis: Noise Contrastive Approach for Scalable Visualization
Abstract.
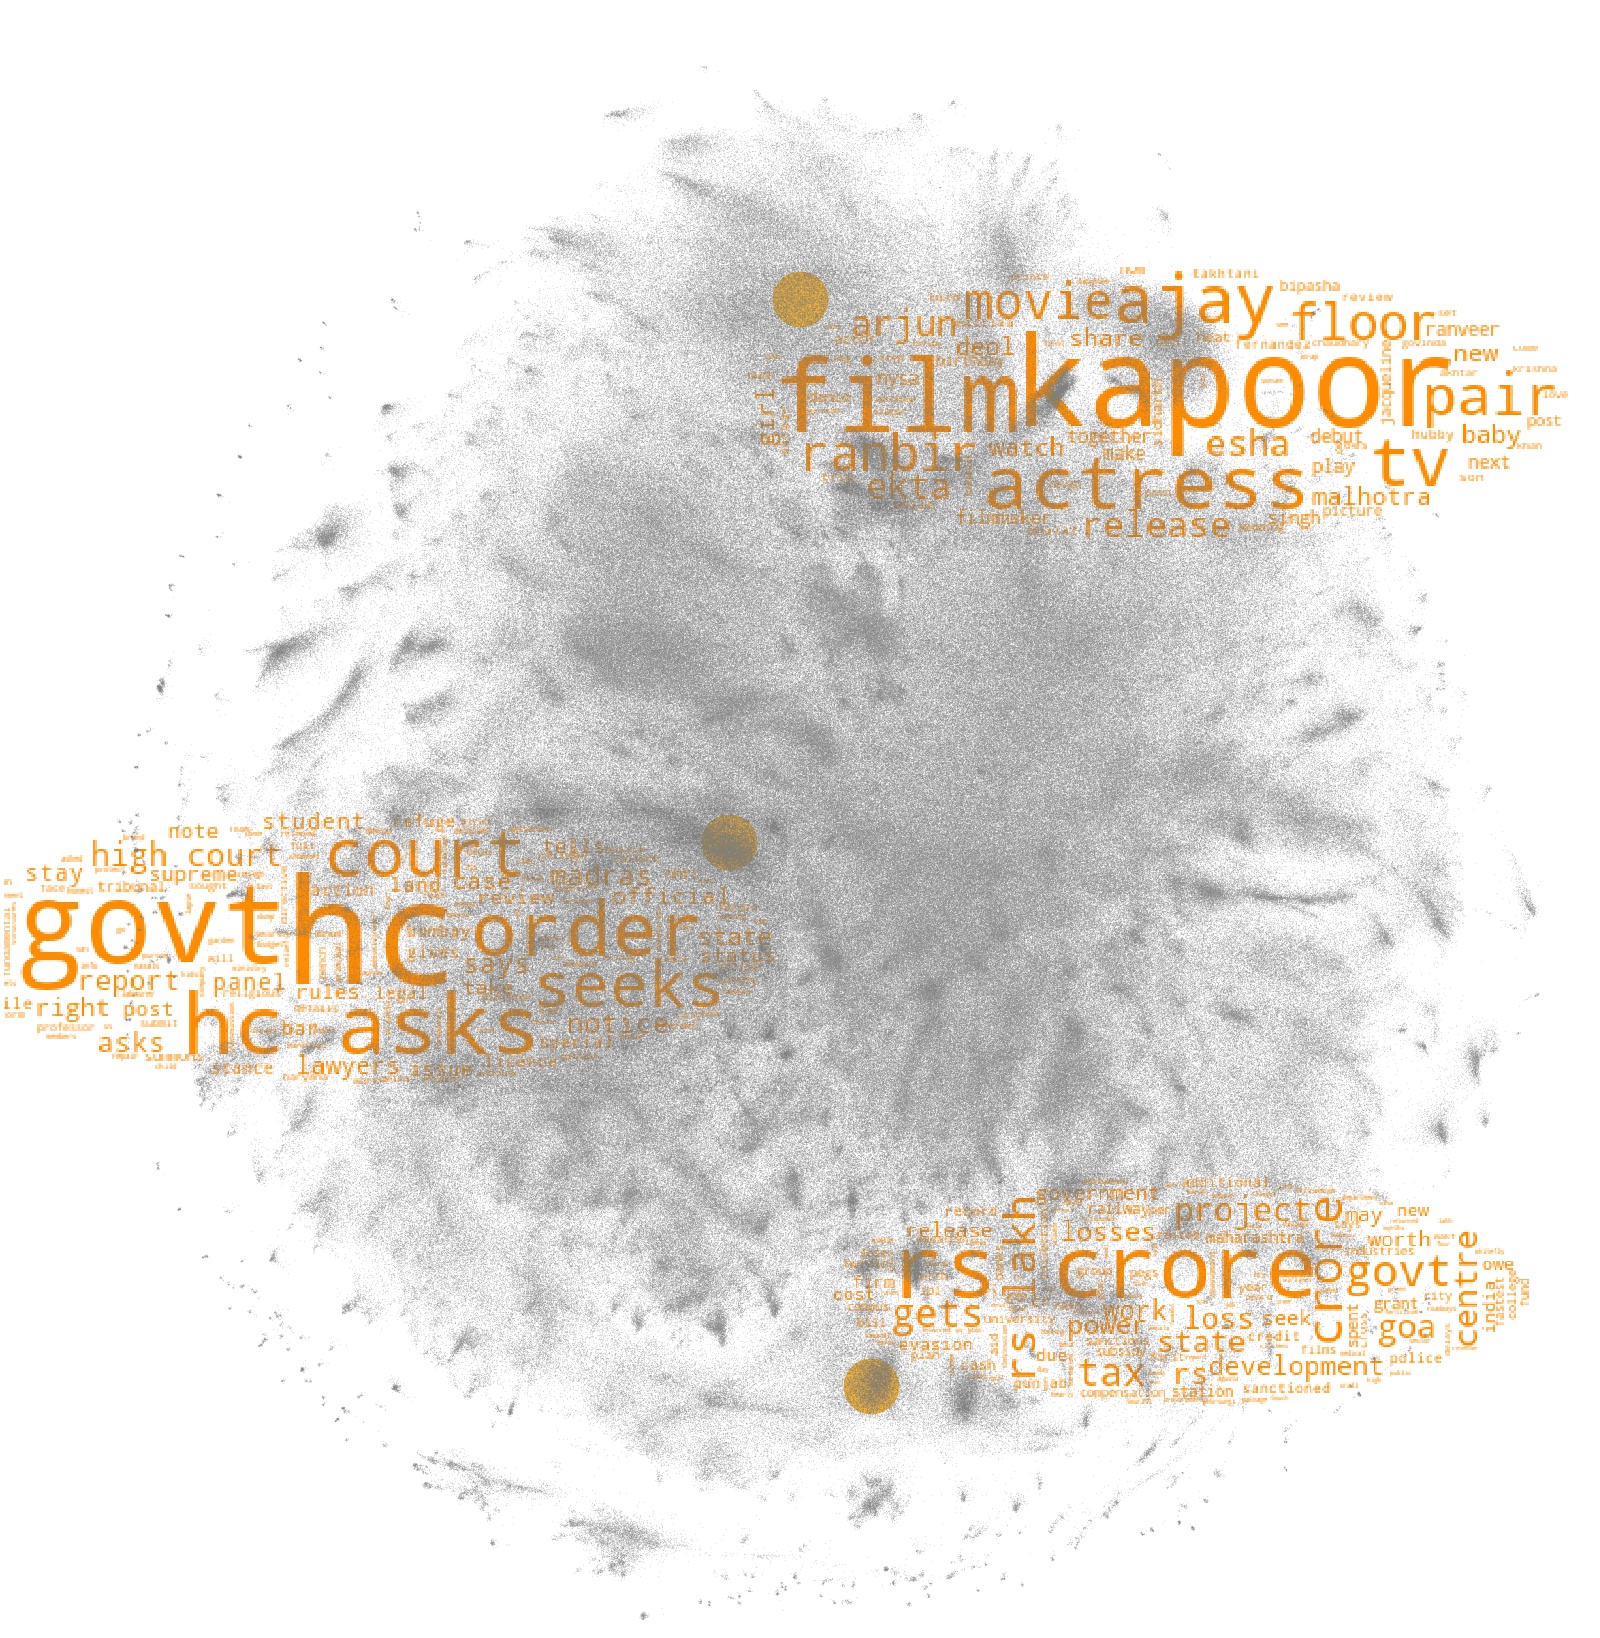
Modern methods for data visualization via dimensionality reduction, such as t-SNE, usually have performance issues that prohibit their application to large amounts of high-dimensional data. In this work, we propose NCVis – a high-performance dimensionality reduction method built on a sound statistical basis of noise contrastive estimation. We show that NCVis outperforms state-of-the-art techniques in terms of speed while preserving the representation quality of other methods. In particular, the proposed approach successfully proceeds a large dataset of more than 1 million news headlines in several minutes and presents the underlying structure in a human-readable way. Moreover, it provides results consistent with classical methods like t-SNE on more straightforward datasets like images of hand-written digits. We believe that the broader usage of such software can significantly simplify the large-scale data analysis and lower the entry barrier to this area.
1. Introduction
With the growth of the internet, extensive data sets became ubiquitous. However, it is not always feasible to tag every sample as there are too many of them. Even though we cannot perform a specific labeling procedure, this does not mean that there is no underlying structure in the data. On the contrary, such a structure is almost always present but requires a thorough study to be retrieved. The classical approach is to focus on a considerably smaller subset and try to find patterns there. But, intuitively, we can benefit from using the data, especially when one recalls the advances of statistical methods.
The classical linear approaches to dimensionality reduction, such as Principal Component Analysis (PCA; (Hotelling1933; Jolliffe2011; Jolliffe2016)), are computationally efficient and widely used for data preprocessing and feature extraction. However, their linearity usually does not allow them to obtain high-quality low-dimensional representations that would be useful for visualization. Though the development of nonlinear dimensionality reduction methods such as Multidimensional scaling (MDS; (Torgerson1952)), Isomap (Tenenbaum2000), Locally Linear Embedding (LLE; (Roweis2000)), Laplacian Eigenmaps (Belkin2002) and Local Tangent Space Alignment (LTSA; (Zhang2004)) allowed to improve the quality of low-dimensional embeddings, their strong performance on artificial data is often not supported by comparable results on real-world high-dimensional data.
The situation has changed when t-SNE (maaten2008visualizing) – an approach focused on interpretable dimensionality reduction – was introduced and was quickly considered to be a de-facto standard for data visualization via dimensionality reduction. The computational performance of t-SNE is enough to provide a positive user experience with small to medium-sized data, but its poor scalability does not allow for processing large data sets. Several optimizations (van2014accelerating; linderman2019fast) were proposed to solve this problem, but none of them were able to provide a considerable improvement of its performance. The recently introduced LargeVis (tang2016visualizing) and Umap (mcinnes2018umap) focus on the usage of stochastic optimization for the objective function similar to the one of t-SNE. Both these methods achieve a considerable speedup as compared to their competitors, but still are based on a large set of heuristics, which results in difficulties with understanding the underlying idea and practical usage.
In this paper, we formulate a statistical approach to design high-performance dimensionality reduction algorithms. In this case, the need for heuristics is minimized, so the efficacy can be granted for free. Our approach is based on the theory of Noise Contrastive Estimation (NCE; (gutmann2010noise; gutmann2012noise)) and proceeds from the assumption that though many representations may have structural similarities with the target object, only a few of them avoid including unnecessary details. This variant of Occam’s razor can be interpreted in the following way: while maximizing the correspondence with real data, also minimize the similarity with noise.
When applied to the dimensionality reduction problem, NCE approach allows us to introduce Noise Contrastive Visualization (NCVis) — a highly-scalable method for visualization via dimensionality reduction. The main issue which prevents the efficient batch training of t-SNE is the necessity to re-normalize the distribution in embedding space at every step. NCVis allows to avoid this issue and its scalability becomes the direct consequence of self-normalizing properties of NCE (gutmann2010noise; gutmann2012noise).
Our main contributions can be summarized as follows:
-
•
We propose a principled statistical approach NCVis to obtain scalable dimensionality reduction algorithms basing on Noise Contrastive Estimation methodology. The approach allows for efficiently parallelizable batch training of embeddings.
-
•
We implement NCVis as a multi-platform Python package111https://github.com/stat-ml/ncvis providing a stable out-of-the-box experience.
-
•
Experiments have proved that NCVis outperforms state-of-the-art methods for visualization via dimensionality reduction in terms of speed without losing a high visualization quality.
-
•
Due to the parallel nature of the algorithm, NCVis gains significant benefits from hardware leveraging which allows us to visualize millions of high-dimensional objects in several minutes using a standard multi-core PC.
2. Problem Statement
In this paper, we address the problem of building a low-dimensional representation of high-dimensional data: {EQA}[c] {^z_i ∈ℝ^M}_i=1^N →{z_i ∈ℝ^m}_i=1^N, where m ≪M. We also suppose that some distance function can be defined for each pair of vectors from the set . We assume that the value of this function should increase as the dissimilarity between the points goes up. That is why there is no demand for metric properties except for non-negativity: .
3. Noise Contrastive Visualization
In this paper, we introduce Noise Contrastive Visualization (NCVis) — a highly-scalable method for visualization via dimensionality reduction based on the Noise Contrastive Estimation (NCE) approach. Its implementation is based on a special optimization procedure, which makes it well suited for parallelization.
An informal overview of the method goes as follows. One can select pairs of neighbors from the original high-dimensional data set. Suppose, that this is done in random manner: the higher the distance between points, the lower the probability for them to be selected. Now suppose that we also given a low-dimensional representation of the original data points, so we can perform a similar procedure there. It seems reasonable, that a good representation should induce the same pairs that were observed in the original data. Note that in order to build such a representation, we need to compute all the pairwise distances in the embedding. This will allow us to compare them and use terms “large” and “small” properly. However, we can reformulate the objective. Consider noisy representation where all the neighbors probabilities are almost equal. We can now use them as reference to mark lower-dimensional probabilities as either large or small. In this case we do not need to gather information about all the pairs of neighbors, it will be enough to know the scale of lower-dimensional probabilities with respect to the noisy probabilities.
3.1. Noise Contrastive Estimation
We start by describing NCE approach and establishing the notations to be used further. Noise Contrastive Estimation (NCE) was introduced in (gutmann2010noise) and developed in a more recent work (gutmann2012noise). Let be a data distribution with density and samples coming from this distribution. Consider also noise distribution with density and corresponding samples . Unite the two sets: , and assign a binary label to each element : if and if . We also define noise ratio as . Our initial goal is to obtain an approximation of with some model . It is important to notice that normalization is included in the parameters , so, generally speaking, the model is unnormalized. NCE objective is then given by the principle of maximum likelihood:
{EQA}[c]
J_T(θ) →max_θ,
where
{EQA}
J_T(θ)
&=
1Td{ ∑_i=1^T_d logpm(xi; θ)pm(xi;θ) + νpn(xi)
+
∑_i=1^T_n logνpn(yi)pm(yi;θ) + νpn(yi)}.
In order to apply the law of large numbers, we can also rewrite it as
{EQA}
J_T(θ)
& =
1Td∑_i=1^T_d logpm(xi; θ)pm(xi;θ) + νpn(xi)
+ ν1Tn∑_i=1^T_n logνpn(yi)pm(yi;θ) + νpn(yi).
Assume that both and have a finite mean. When tends to infinity (and also tends to infinity as ) the following objective is obtained using the weak law of large numbers:
{EQA}
J(θ)
& =
𝔼_x∼P_d [ logpm(x; θ)pm(x;θ) + νpn(x) ]
+
ν𝔼_y∼P_n[logνpn(y)pm(y;θ) + νpn(y)].
Due to a stochastic nature of the objective function, the first order batch optimization methods can be beneficial in the case of the large number of parameters . The explicitly written gradient with respect to the vector of parameters is given by
{EQA}[c]
∂∂θi J(θ) = ∫