Detection of vibrational emissions from the helium hydride ion (HeH+) in the planetary nebula NGC 7027
Abstract
We report the detection of emission in the v (3.51629m) and (3.60776m) rovibrational lines of the helium hydride cation (HeH+) from the planetary nebula NGC 7027. These detections were obtained with the iSHELL spectrograph on NASA’s Infrared Telescope Facility (IRTF) on Maunakea. They confirm the discovery of HeH+ reported recently by Güsten et al. (2019), who used the GREAT instrument on the SOFIA airborne observatory to observe its pure rotational transition at 149.137m. The flux measured for the HeH+ v line is in good agreement with our model for the formation, destruction and excitation of HeH+ in NGC 7027. The measured strength of the pure rotational line, however, exceeds the model prediction significantly, as does that of the v line, by factors of 2.9 and 2.3 respectively. Possible causes of these discrepancies are discussed. Our observations of NGC 7027, covering the 3.26 – 3.93m spectral region, have led to the detection of more than sixty spectral lines including nine rovibrational emissions from CH+. The latter are detected for the first time in an astronomical source.
1 Introduction
The first astrophysical detection of the helium hydride ion (HeH+) was reported recently by Güsten et al. (2019; hereafter G19), who used the German Receiver for Astronomy at Terahertz Frequencies (GREAT) on the Stratospheric Observatory for Infrared Astronomy (SOFIA) to detect its fundamental rotational transition at 2010.184 THz (149.137m) toward the planetary nebula NGC 7027. This came more than four decades after HeH+ was first recognized as potentially-detectable interstellar molecule (Dabrowski & Herzberg 1978; Black 1978), and followed multiple unsuccessful searches at both infrared and far-infrared wavelengths (Moorhead et al. 1988; Dinerstein & Geballe 2001; Liu et al. 1997)
The HeH+ molecular ion had been discovered in the laboratory in 1925 (Hogness & Lunn 1925), when mass spectroscopy revealed the presence of an ion of charge-to-mass ratio produced by a discharge in a mixture of hydrogen and helium. HeH+ is isoelectronic with H2, with a ground state. Indeed, H2 and HeH+ constitute one example of several isoelectronic pairs or multiplets known in astrochemistry where exotic ionized species have been discovered that have a familiar neutral counterpart: other examples include CF+ (Neufeld et al. 2006) and CN- (Agundez et al. 2010), both isoelectronic with CO; as well as ArH+ (Barlow et al. 2013; Schilke et al. 2014), (Lis et al. 2010) and (Klemperer 1970), molecular ions that are isoelectronic with HCl, H2S and HCN respectively.
HeH+ was first mentioned as a potential interstellar molecule by Wildt (1949). Dabrowski & Herzberg (1976) subsequently suggested that HeH+ vibrational emissions might be responsible for spectral features that had been detected (Merrill et al. 1975) in low resolution infrared spectra of the young planetary nebula (PN) NGC 7027. While those spectral features were in fact associated with polycyclic aromatic hydrocarbons, the suggestion prompted several theoretical studies that investigated the formation of HeH+ in planetary nebulae Black 1978; Flower & Roeuff 1979; Roberge & Dalgarno 1982; Cecchi-Pestellini & Dalgarno 1993). These concluded that potentially-detectable HeH+ abundances might be formed by the radiative association of He+ with H in the transition regions of planetary nebulae (i.e. between the fully-ionized and neutral zones). In such environments surrounding a hot UV-emitting central star, there can be a small overlap between the region containing ionized helium and that containing neutral hydrogen. This (somewhat counterintuitive) possibility arises because the photoelectric absorption cross-section of hydrogen falls rapidly with energy above the ionization threshold (13.6 eV), so that ultraviolet photons with energies slightly greater than the ionization potential of He (24.6 eV) penetrate more deeply into the neutral zone than those with energies just above the ionization potential of H (13.6 eV); the helium Strömgren sphere therefore is slightly larger than the hydrogen Strömgren sphere, despite (in fact, because of) the higher ionization potential of He.
In addition to these theoretical studies of HeH+ in planetary nebulae (PNe), HeH+ has also been included in models for the formation of molecules in the primordial Universe, prior to the formation of stars and before the advent of stellar nucleosynthesis (e.g. Stancil et al. 1998). Current models (e.g. Galli & Palla 2013; their Figure 3c) predict HeH+ to be the very first molecule to form (followed rapidly by ) once helium atoms start to recombine at redshift . In the early Universe, HeH+ is formed primarily by the radiative association of He with H+, which is much slower than the reaction of He+ with H that dominates in planetary nebula. Here, the overlap is between He and H+; with its higher ionization potential, helium recombines before hydrogen in the cooling Universe. HeH+ plays an important role in the subsequent molecular evolution of the Universe, since it is destroyed primarily by proton transfer to atomic hydrogen. This reaction forms H, which can subsequently undergo charge transfer with H to form H2.
The theoretical studies addressing HeH+ in PNe motivated several observational searches for HeH+ emission from NGC 7027, a young PN that was recognized as a particularly promising target because of its very hot central star and the high density of the surrounding nebula. Upper limits on its emission were obtained from ground-based observatories operating in the infrared L-band by Moorhead et al. (1988), who searched for the rovibrational line at 3.364 m, and by Dinerstein & Geballe (2001), who targeted the (stronger) line at 3.608 m.
At far-infrared wavelengths, observations of NGC 7027 performed with the Infrared Space Observatory (ISO) revealed (Liu et al. 1997) an emission feature at m. Given the relatively-poor spectral resolution (m) of these observations, which were obtained with the Long Wavelength Spectrometer (LWS) in its grating mode, the wavelength of the observed emission feature was consistent with either the transition of HeH+ (149.14m) or the doublet transitions (149.09 and m) of CH. Indeed, the strength of the observed m emission feature was entirely consistent with that expected from CH, given the measured strength of another CH transition detected simultaneously at 180.7m. Accordingly, Liu et al. (1997) were only able to derive an upper limit on any contribution from HeH+ . It was the GREAT spectrometer on SOFIA that was the first instrument with the sensitivity and spectral resolution to detect the HeH+ fundamental rotational transition and discriminate it from the nearby CH doublet (G19).
To follow up the recent discovery of astrophysical HeH+, we have used the iSHELL spectrograph (Rayner et al. 2016) on NASA’s Infrared Telescope Facility (IRTF) to conduct a sensitive search for HeH+ vibrational emissions from NGC 7027. In Sections 2 and 3 below we describe the observations we performed and the methods used to reduce the data. In Section 4, we present the observational results, which provide a clear detection of HeH+ vibrational emissions. In Section 5, we compare our measurements of the HeH+ line fluxes with the predictions of a model for the source. A brief summary follows in Section 6. In Appendix A, we present the full m spectrum obtained using iSHELL on IRTF.
2 Observations
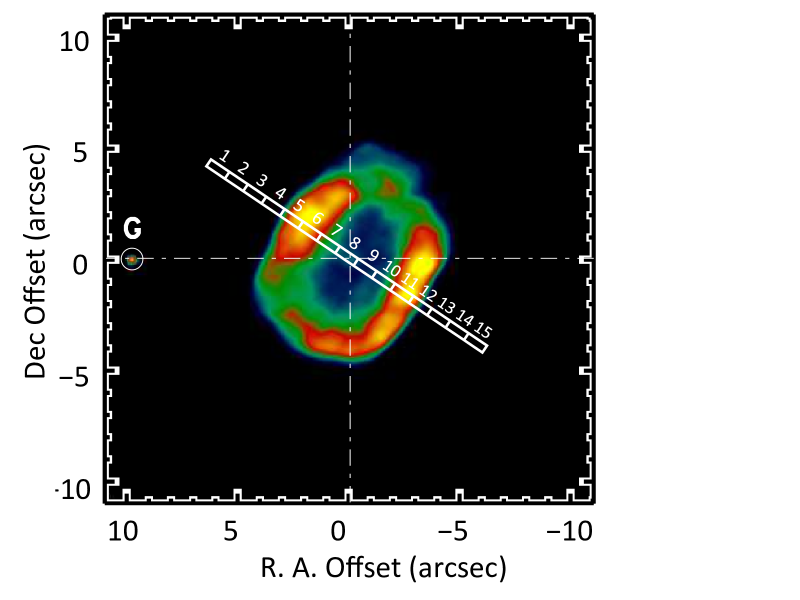
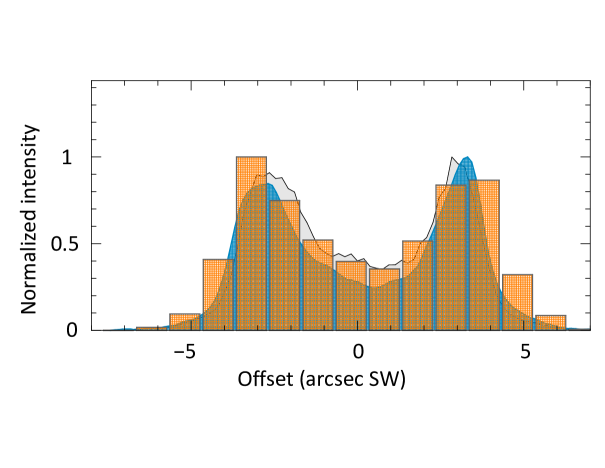
The observations were performed at the IRTF on the nights of 2019 July 13 and September 6 UT using the iSHELL spectrograph (Rayner et al. 2016). The Lp1 and Lp2 grating settings were used to cover the 3.265 to 3.656 m and 3.580 to 3.933 m spectral regions, respectively, on the first and second nights of observation. The former setting covers the HeH+ (1) (3.3021 m)111Here, and elsewhere in the paper, all wavelengths are given in vacuo, (0) (3.3641 m), (1) (3.5163 m) and (2) (3.6078 m) rovibrational lines, and the latter covers (2), (3) (3.7105 m), and (4) (3.8255 m) (Bernath & Amano 1982). The 0375 wide slit was used on both nights to deliver spectra with a spectral resolving power , corresponding to a velocity resolution of 3.75 km s-1. The slit, of length , was oriented at position angle 59° East of North (Figure 1) to cover the bright limbs of the nebula in the radial direction. A mag star (2MASSJ 21070267+4214099; marked with a “G” in Figure 1), located 10″ east of the center of the nebula, was used for guiding. The offsets shown in Figure 1 are relative to the position of the central star determined222Although the (Latter et al. 2000) central star was not apparent in the real-time image provided by the slit-viewing camera, it could be detected by co-averaging 600 camera frames, each of duration 1 sec, obtained during the spectroscopic observations on the -band slit-viewing camera: (J2000).
The guide star was kept on the same pixel of the detector on the slit-viewing camera throughout each integration. Because the angular size of the nebula is comparable to the slit length, blank sky emission could not be sampled by nodding the telescope while keeping the science target inside the slit. We moved the slit to 16″ east of the center of the nebula every 5 minutes to record the sky background spectrum, while keeping the guide star inside the field of view of the camera. The seeing was superb on the night of July 13, consistently below 04 at band, while on night of September 6th the seeing varied between and .
The total on-source integration time with the Lp1 setting was 106 minutes (not including the time for sampling the sky emission). The early-type standard stars HR 7001 (A0V) and HR 7557 (A7V) were observed every two hours with similar airmasses to that of NGC 7027. Flat fields were obtained using the calibration unit of the instrument prior to every change in the telescope pointing. Weather conditions were not optimal on the night of September 6, with high humidity and high cirrus clouds. The total on-source time for Lp2 was 66 minutes. The standard star HR 7557 was observed before the science observations.
3 Data Reduction
Data reduction was performed using the program suite Spextool ver. 5.0.2 (Cushing et al. 2004) adapted for the iSHELL data. Spextool coadds the raw frames, subtracts the spectrogram image of the offset sky, normalizes the pixel responses by dividing the spectrogram by the flat-field images, calculates the wavelength mapping on the detector with reference to atmospheric emission lines, and extracts one dimensional spectra from the given apertures. In order to measure the spatial variation of the emission lines, 15 extraction regions were defined along the slit length (Figure 1). The size and the separation of these regions were each 1″. Telluric lines were removed by dividing the science spectra by the spectra of the standard stars using the xtellcor code (Vacca et al. 2003) that is part of Spextool. The broad H I recombination lines of the early-type standard stars were removed at the same time. The one dimensional spectra consist of 17 strips each representing one diffraction order. The spectral strips were stitched together with xmergeorders within the Spextool suite.
The observed spectra of the standard star HR 7557 were used to flux calibrate the NGC 7027 spectra. When narrow slit observations of an extended source are flux calibrated against a point source such as a standard star, it is necessary to account for slit loss in the standard star observations. The required slit loss correction was determined by a comparison of standard star spectra obtained with narrow (0375) and wide (40) slits.
A band image of the nebula was constructed from the slit viewing images. The astrometry was established referring to the coordinates of three stars in the field, GAIA source ID 1969656406932827392 (the guide star in Figure 1), 1969656406922350848, and 1969656406922372480. The band image was sliced along the putative slit position, and the cross-cut of the image was cross-correlated with the spatial profile along the slit of the two dimensional spectrogram in order to calculate the accurate positions of the apertures on the image (Figure 2). This procedure indicated that the extraction region number X, counting from NE to SW as indicated in Figure 1, is centered at offset arcsec from the central star, where positive values of refer to offsets in the SW direction.
4 Results
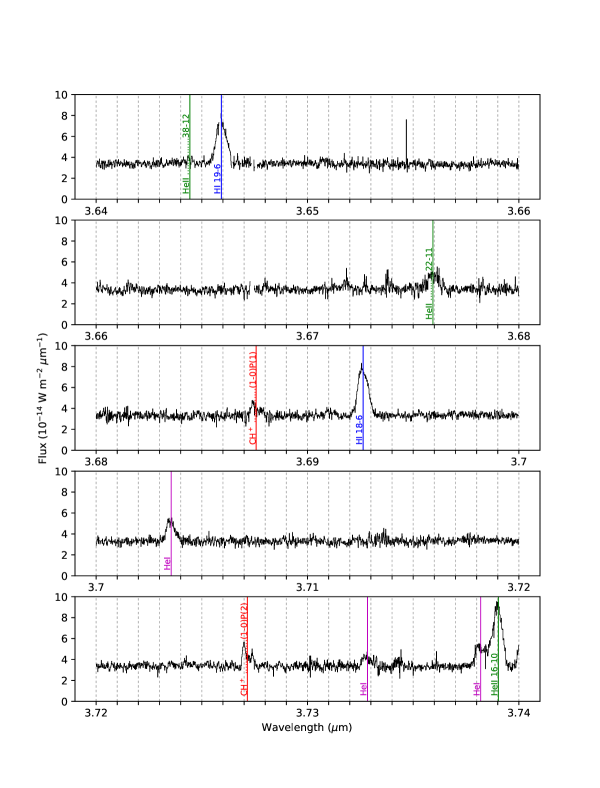
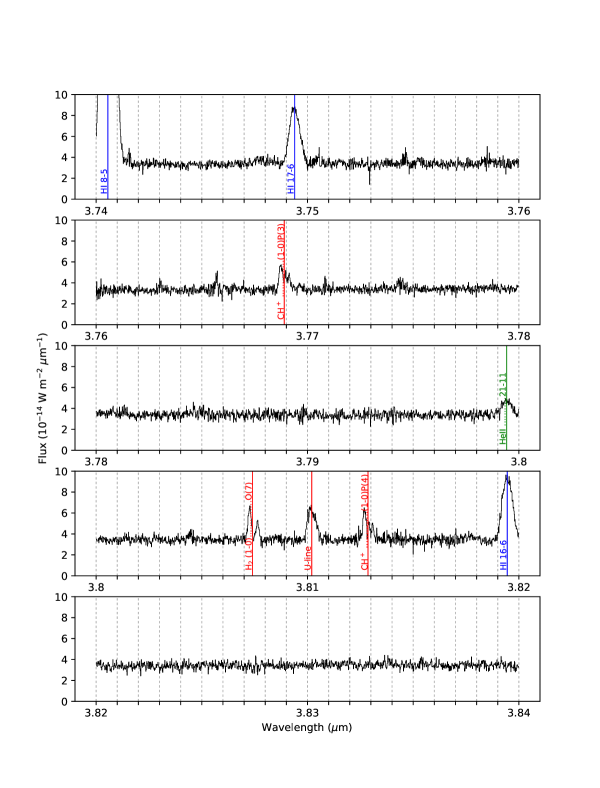
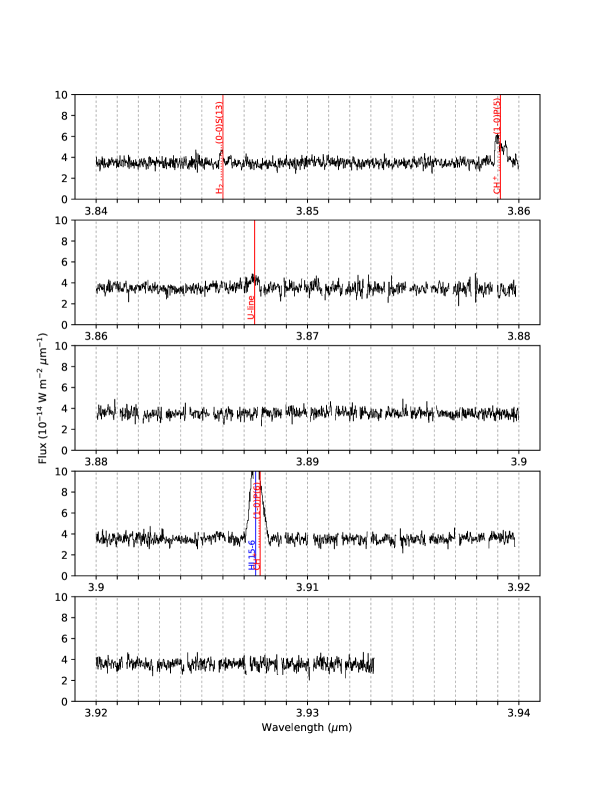
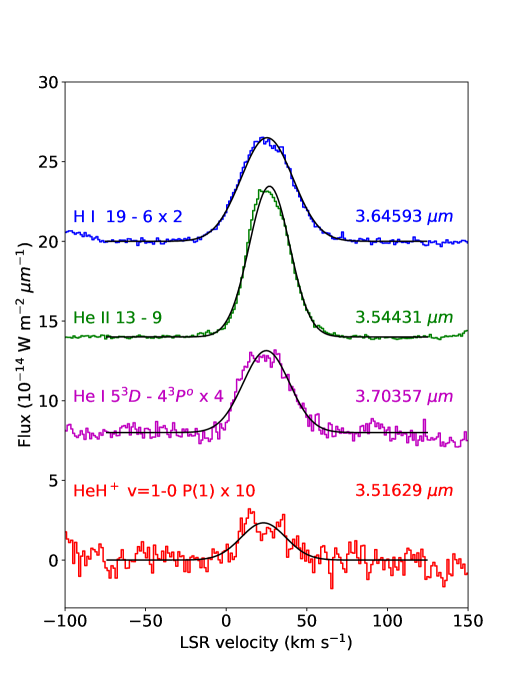
With its large simultaneous spectral coverage and its high spectral resolution, the iSHELL spectrograph provides a large amount of data in a single setting. In Appendix A, Figures A1 - A7, we present the complete spectrum obtained toward NGC 7027 and summed over the 11 central extraction regions (numbered 3 – 13 in Figure 1). As discussed in Appendix A, more than 60 identifiable spectral lines are detected unequivocally: these include recombination lines of H I, He I, and He II; vibrational lines of H2 and HeH+; a strong [Zn IV] fine structure line; and 9 rovibrational lines of CH+. The latter were detected for the first time in an astronomical source, following a recent measurement of their frequencies in the laboratory (Domenech et al. 2018), and will be analysed in a future publication. Figure 3 shows an expanded view of four spectral lines after subtraction of a linear baseline: the H I , He II , He I , and HeH+ lines at 3.64593, 3.54431, 3.70357, and m, respectively.
The spectra shown in Figure 3 were obtained from the sum of extraction regions 5, 6, 11, and 12, corresponding to offsets in the intervals and . These extraction regions cover the bright limbs on either side of the central source (see Fig. 1). Solid lines show Gaussian fits to the line profiles, obtained using the scipy.optimize.curvefit routine in python to fit the lines using the Levenberg-Marquardt algorithm. The line fluxes, widths, and centroids were allowed to vary freely and independently for each line, and are tabulated in Table 1 with their standard errors. The fit to the HeH+ line has a peak intensity of , implying a detection at the level.
| Line | Rest wavelength | Peak fluxa | Integrated flux | FWHMc | |
|---|---|---|---|---|---|
| (m) | () | () | () | ||
| H I | 3.64593 | ||||
| He II | 3.54431 | ||||
| He I | 3.70357 | ||||
| 3.51629 | |||||
| 3.60776 | Note (e) | Note (e) |
Based on the excitation model of HeH+ described in Section 5.2 below, we expect the v and transitions to be the strongest HeH+ rovibrational lines in the bandpass. All other lines are predicted to be weaker by a factor of or more. This behavior results from the facts that (1) at the densities of relevance here, most HeH+ molecules are in the ground state; and (2) electron-impact excitation from to and is strongly favored over excitation to states with , according to cross-sections computed by Čurík & Greene (2017).
The line lies close to a strong recombination line () of atomic hydrogen. In Figure 4, we show the line profile obtained for the H I line (blue histogram), together with that for H I (black histogram). Here, the H I line has been scaled by a factor 0.875, as needed to match the peak of the H I line. As in Figure 3, these spectra were obtained for the sum of extraction regions 5, 6, 11, and 12 as in Figure 3. The H I observations were affected by three narrow atmospheric absorption features within the spectral range that is shown here: the affected spectral channels have been excised, as indicated by the gaps in the spectra. Relative to the the H I line, which is very nearly Gaussian (Figure 3), a clear excess is observed in the red wing of the H I line. The red histogram shows this excess, with the velocity scale now shifted as appropriate for the HeH+ line wavelength. The regions affected by three narrow atmospheric absorption were similarly excised from the HeH+ spectrum (where they appear as gaps that are shifted relative to those in the blue histogram because of the different rest wavelength).
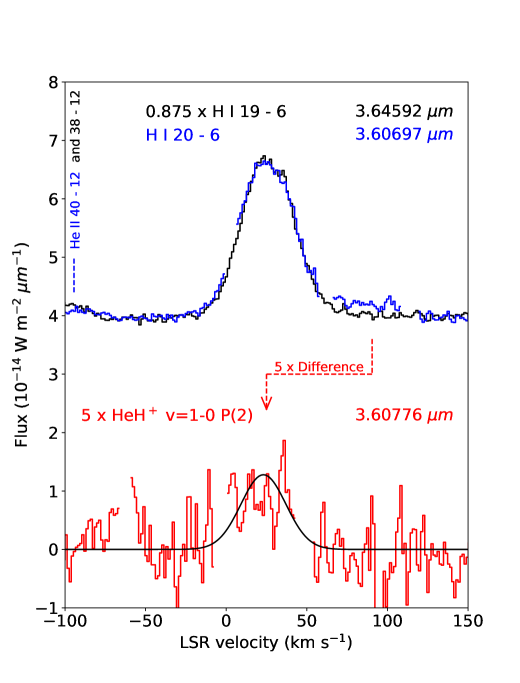
The solid line shows a Gaussian fit to these residuals, with the line width and centroid set equal to the values measured for the line; the HeH+ line is detected at the 8 level. As expected, no other rovibrational transitions of HeH+ were detected.
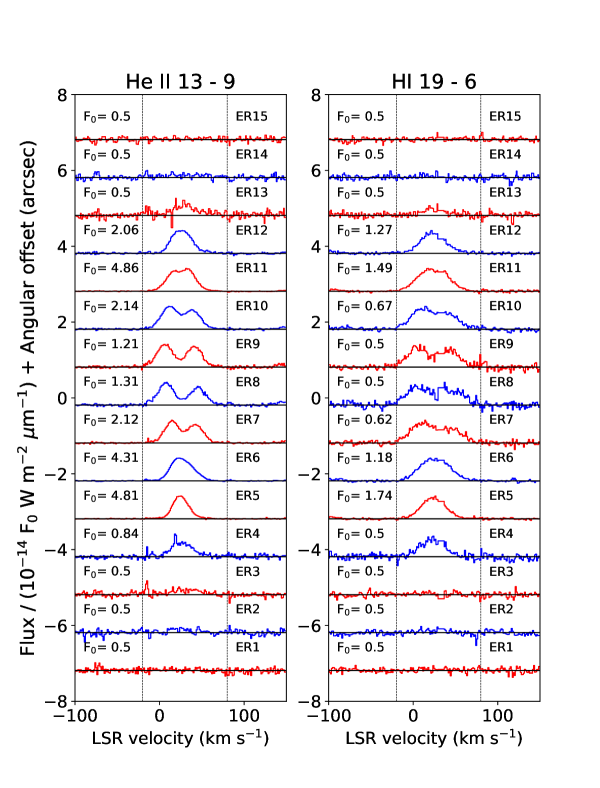
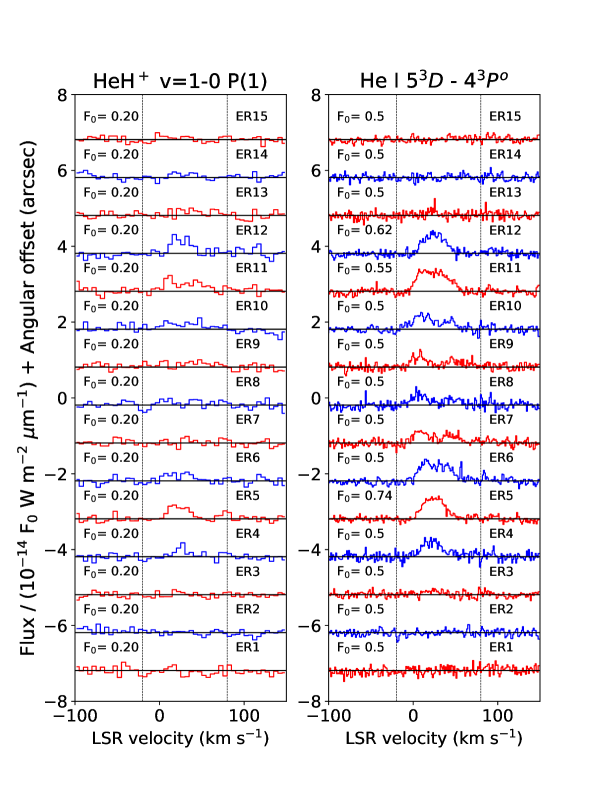
In Figures 5 and 6, we show the individual spectra obtained for each extraction region. Within the part of the slit that covers the nebula, the H I, He II and He I recombination lines are still detected at high signal-to-noise ratios (SNR) within the individual extraction regions of length . As expected for an expanding shell, the line profiles become double-peaked near the center of the nebula. The spectral lines were integrated over the –20 to 80 LSR velocity range to obtain the line flux for each extraction region. Figure 7 shows the velocity-integrated line fluxes obtained, as a function of position along the slit.
5 Discussion
5.1 Model for HeH+ in NGC 7027
| Parameter | Value |
|---|---|
| Distance | 980 pc |
| Inner angular radius | b |
| Outer angular radius | b |
| Stellar luminosity | |
| Stellar effective temperature | |
| Pressure/k | (constant)c |
| Helium abundance | 0.120 |
| Reaction | Rate coefficient | Reference/note | |
|---|---|---|---|
| () | |||
| (b,c) | |||
| Waibel et al. (1988)c | |||
| Novotný et al. (2019) | |||
| Esposito et al. (2015) | |||
| Fit to Jurek et al. (1995) | |||
| Fit to Loreau et al. (2013) | |||
| Le Padellec et al. (2017)c | |||
| Fit to Ramaker and Peak (1976) | |||
| Black (1978) | |||
| Karpas et al. (1979) | |||
| Schneider et al. 1994, 1997d | |||
| (see text) | Cross-section from Miyake et al. (2011) |
To interpret the observational results described above, we have used a model for NGC 7027 similar to that discussed in G19. The model parameters are given in Table 2. We used the CLOUDY photoionization code to model the temperature and densities of H, H+, H-, He, He(), He+, He++ and electrons as a function of position in the nebula down to a temperature of 800 K. We then computed the equilibrium abundance of HeH+ given the formation and destruction processes listed in Table 3. As in G19, our standard model was computed under the assumption of constant pressure. With an alternative assumption of constant density, we found that the H nucleus density needed to match the observed Strömgren radius was . The predicted line fluxes were not greatly altered: the H I, He II, He I, and HeH+ line flux predictions changed by , , and . The decrease in the predicted HeH+ line flux reflects the fact the HeH+ emission peaks within a shell near the Strömgren radius; because this region is somewhat cooler than the fully ionized region, the density is lower in the constant density model than in the constant pressure model. Because the sound crossing time is comparable to the age of the system, it is not clear which model is more appropriate.
Several changes to the chemistry from the analysis of G19 have been implemented as described below. For the rate coefficient for dissociative recombination (DR) of HeH+, which is a dominant destruction process, we now adopt the value obtained very recently from an experiment at the Cryogenic Storage Ring (CSR) in Heidelberg (Novotný et al. 2019). Although at low temperatures the DR rate was found to vary strongly with the rotational state of HeH+, the value at the temperatures (K) of present interest is independent of . It is, however, somewhat higher () than that adopted by G19. That value, , was based on an earlier experiment by Strömholm et al. (1996) after correction of an error in the original paper. (The two experimental results are consistent with each other given the likely systematic errors.) For the destruction of HeH+ in reaction with H, we adopt results obtained in the more recent calculations of Esposito et al. (2015), which are somewhat larger (by a factor ) than those (Bovino et al. 2011) we adopted previously. In addition, we have included the formation of HeH+ by the associative ionization of atomic H with He in the metastable 2 state [reaction ]. Based on more recent measurements (Waibel et al. 1988) of the cross-section for reaction , we obtained a rate coefficient five times as large as that estimated by Roberge & Dalgarno (1982); with this modification, the associative ionization reaction becomes a significant source of HeH+.
For completeness, we have also included four additional HeH+ formation pathways and one additional destruction process. These are (1) formation of HeH+ by radiative association of He with H+ [reaction ]; (2) formation of HeH+ by radiative association of He(23S) with H+ [reaction )]; formation of HeH+ by an associative ionization reaction of He+ with H- [reaction )]; (4) formation of H via radiative association of H and H+ [reaction ], followed by proton transfer to He [reaction ]; the efficiency of the latter pathway is reduced by reactions and that destroy H; and (5) photodissociation of HeH+ [reaction ], the rate of which is determined by the ultraviolet radiation field and was computed at each point in the nebula.
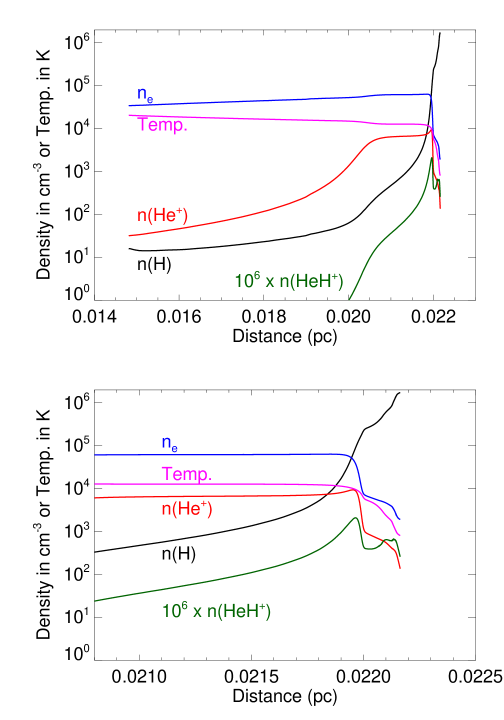
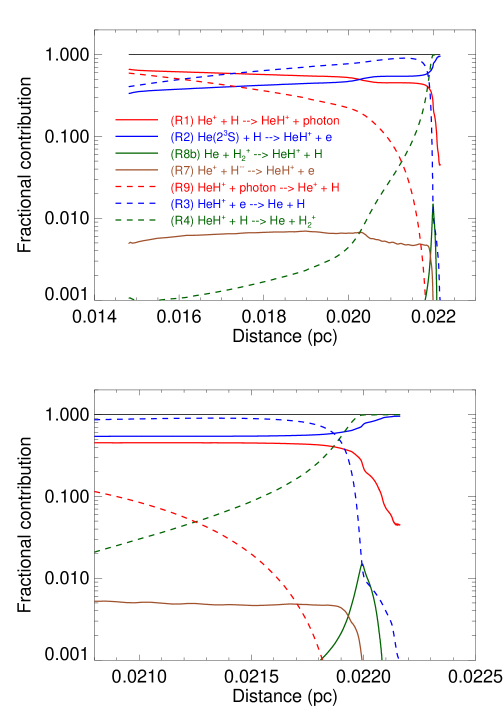
The combined effect of these changes is to increase the predicted HeH+ emission flux by a factor . Figure 8 shows the temperature and the density profiles for several key species (top panel with a zoomed view in the middle panel), now computed with these modifications to the HeH+ chemistry, while Figure 9 shows the fractional contributions of the various destruction and formation processes for HeH+. Reactions and never make a fractional contribution to the HeH+ formation rate that exceeds ; they therefore fail to appear in Figure 9.
5.2 Comparison of the observed line intensities with the model
The predicted fluxes for the strongest observed recombination lines of He+, He, and H are given in Table 4, along with their values measured in a region spanning the minor axis of the nebula (extraction regions 3 – 13 in Figure 1). Here, in contrast to Table 3, the measured values were obtained from direct integration over the –20 to 80 LSR velocity range, without any assumption that the line profile is Gaussian. The LSR velocity ranges –75 to –20 and 80 to 125 were used to define the continuum. The predictions for He+ and H were based on the Case B recombination line emissivities presented by Storey & Hummer (1995). In the case of the He recombination line, we made use of the emissivities computed by Bauman et al. (2005). For the recombination lines, the observed values are a factor times the model predictions. Given the uncertainties in the flux calibration and the approximations made in the model (most notably the assumption of spherical symmetry), this may be regarded as acceptable agreement.
| Line | Rest wavelength | Observed line fluxa | Predicted line flux | Ratio |
|---|---|---|---|---|
| (m) | () | () | (observed/predicted) | |
| H I | 3.64593 | b | 34.6 | |
| H II | 3.54431 | 108 | ||
| He I | 3.70357 | 12.8 | ||
| 3.51629 | 1.68 | |||
| 3.60776 | 0.89 | |||
| HeH+ | 149.137 | c | 56 c |
Table 4 also lists predictions for the HeH+ vibrational line fluxes and the integrated brightness temperature of the HeH+ pure rotational transition observed with SOFIA/GREAT (G19), together with the measured values. Given the high fractional ionization within the emission region, collisional excitation by electrons is expected to dominate excitation by any other collision partner. Moreover, formation pumping is expected to be relatively unimportant for states that are efficiently excited by collisions with electrons.333This follows from the facts that (1) within the HeH+ emission region, the formation rate of HeH+ is comparable to its destruction rate via dissociative recombination; and (2) the rate coefficient for dissociative recombination of HeH+ is typically smaller than those for electron-impact excitation (for the states that we observed and at the temperature in the emission region). For the excitation of rotational states within the ground vibrational state, we adopted the thermal rate coefficients for electron-impact excitation presented recently by Ayoub and Kokoouline (2019; hereafter AK19), which are in excellent agreement with those obtained in an independent recent calculation by Čurík & Greene (2017; hereafter CG17) over the more limited temperature range (up to 3000 K) for which CG17 presented results. Another recent calculation by Hamilton et al. (2016; hereafter H16) reported similar rate coefficients for most collisional-induced transitions, but a rate coefficient for the excitation from to that was times as large as that computed by AK19 and CG17. The calculations of CG19 and AK19 may be considered more reliable, however, because they accounted for the presence of rotational (and vibrational) resonances in the e-HeH+ spectrum.
We solved the equations of statistical equilibrium for the lowest five rotational states to determine the relative level populations and the emissivity in the pure rotational transition. At the electron densities of relevance in NGC 7027 (see Figure 8), the rotational excitation is predicted to be subthermal, with most HeH+ molecules in the ground rotational state. Because the rate coefficients for rovibrational excitation are roughly two orders of magnitude smaller than those for pure rotational excitation, the rotational level populations are not significantly affected by the effects of rovibrational excitation. For rovibrational excitation, we adopted the cross-sections calculated by CG17 (their Figure 7). Here, the cross-sections presented in CG17 were supplemented by results for all collisionally-induced transitions with and (Čurík 2019, private communication). We used these cross-sections to obtain thermal rate coefficients for , under the assumption that the excitation cross-sections were inversely proportional to energy for energies greater than ( eV) those computed by CG17. Combined with our solution for the rotational population in , these rovibrational rate coefficients could then be used to determine the emissivities for the vibrational transitions that we have observed.
As noted previously by G19, our model significantly underpredicts the brightness temperature of the HeH+ pure rotational line; with the modifications to the chemical network described above, the model predictions now lie a factor below the observed value (somewhat smaller than the factor 4 discrepancy given by G19). While the measured strength of the HeH+ v rovibrational line exceeds the model prediction by a similar factor (2.3), the flux measured for the HeH+ v line is in good agreement with our model prediction. The observed v line ratio of ( statistical error) is significantly smaller than the value of 1.9 predicted by the model. Because the v line lies in the wing of a much stronger H I recombination line and is affected by narrow atmospheric absorption features, there may be significant systematic uncertainties in our determination of the line ratio. Nevertheless, a discrepancy of this magnitude likely points to inaccuracies in the rate coefficients for vibrational excitation that are adopted in the model. The v ratio, in particular, is primarily determined by the relative collisional rate coefficients and depends only very weakly on the gas temperature and density.
For all collisionally-induced transitions within the ground vibrational state, AK19, CG17, H16 and Rabadan et al. 1998 obtained excitation rate coefficients for electron impact that were in good agreement with each other except for the transition from to . For this transition, as discussed previously, the H16 results are larger by a factor 3; if we use those results in place of those given by AK17, the predicted line intensity increases by a factor and is in closer agreement with the observations. However, for the reasons given above, the calculations presented by AK19 and CG17 may be considered more reliable from the molecular physics standpoint. For collisionally-induced transitions from to , the only rotationally-resolved calculations of the excitation rates are those of CG17. Further calculations of electron-impact excitation cross-sections for HeH+ could be very valuable in understanding the discrepancies discussed above, particularly for vibrational transitions at collision energies above 0.2 eV.
If we assume the rate coefficients for collisionally-induced transitions within the ground vibrational state to be the most reliable, based on the excellent agreement between the independent calculations of CG17 and AK19, the flux measured for the pure rotational line may suggest that the chemical model underestimates the HeH+ abundance by a factor . The two main destruction mechanisms [reactions and ] have each been the subject of two independent investigations that yielded similar results [experimental in the case of and theoretical in the case of ]. These considerations suggest that the rate coefficients for the formation reactions and/or have been underestimated, or that some important HeH+ formation or excitation mechanism has been overlooked. Alternatively, or in addition, it may reflect approximations in our (spherically-symmetric) physical model for the source, or uncertainties in the rate coefficients we adopted for rotational excitation of HeH+ in collisions with electrons.
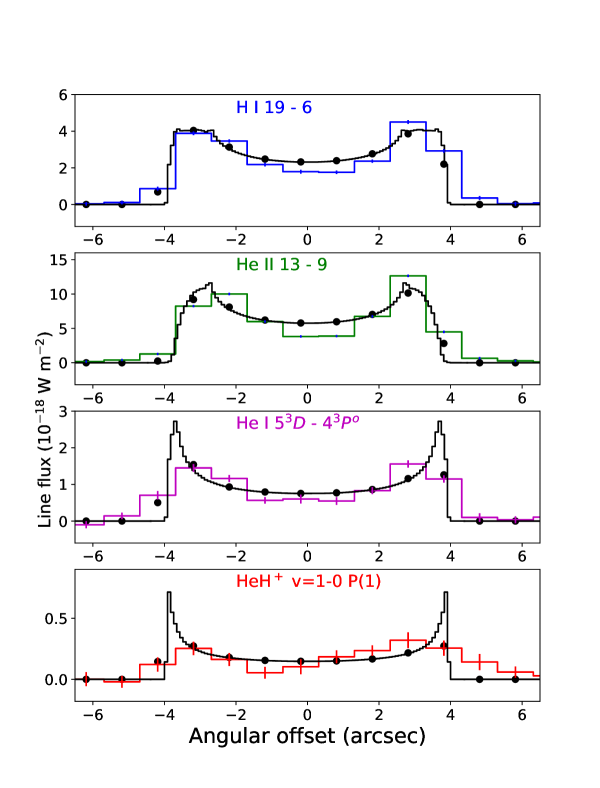
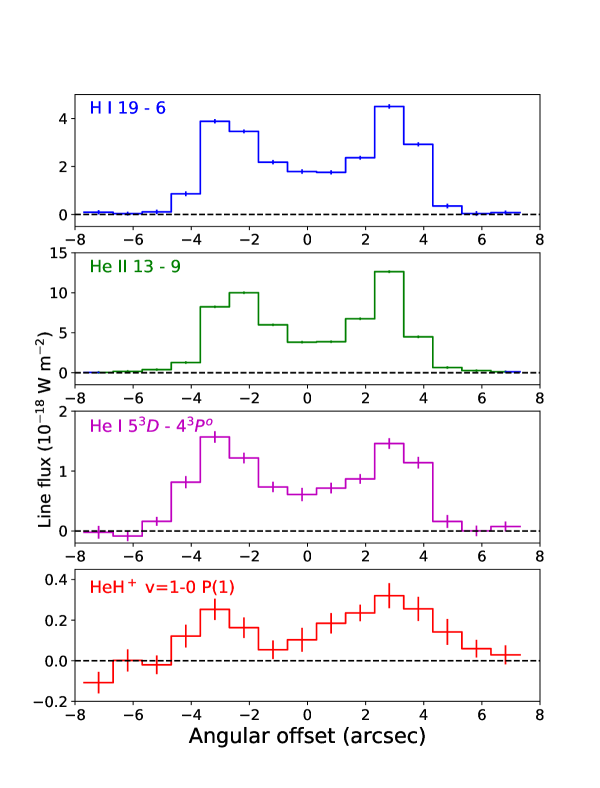
Based on our model for NGC 7027, we have also obtained predictions for the spatial variation of the emission line intensities along the slit. In Figure 10, we show how the intensities of several observed emission lines are predicted to vary with angular position. As in Figure 7, the colored histograms show the observed spectral line fluxes as a function of position along the minor axis. Because our model for the nebula makes the approximation of spherical symmetry and is adjusted to match the average of the semi-minor and semi-major axes, a scaling is needed to match the spatial profile along the minor axis. Based on a fit to the strongest line (He II ) we observed, we determined that scaling the predicted offsets by a factor of 0.86 was optimal. Because the purpose of Figure 10 is to investigate the spatial variation of the line intensities rather than their absolute values, we also scaled the predicted fluxes separately for each line to optimize the fit to the observed profiles. The black histogram shows the predicted spatial profiles, after the horizontal compression and vertical scalings decribed above. The results plotted in the black histogram were averaged over bins. The HeH+ line and the He recombination line are predicted to be the most strongly limb brightened, because HeH+ and He+ are only abundant near the outer edge of the nebula. To facilitate a comparison between the model predictions and the observed spatial profiles, we have rebinned the predictions onto the extraction regions to obtain the black points in Figure 10.
In the case of the He II and H I recombination lines, both of which were observed with a high SNR, the model clearly overestimates the intensities at the center of the nebula (or, equivalently, underestimates the degree of limb brightening). This behavior has been noted previously, e.g. in a study of radio continuum observations published by Masson (1986). In that study, models for a spherically-symmetric emitting shell were shown to be incapable of fitting the width of the limb emission at the same time as reproducing the large degree of limb brightening; this inconsistency could be resolved by models in which the ionized shell was assumed to be elongated along the line-of-sight to the observer, such that the ultraviolet flux near the projected center of the nebula was diminished and the associated free-free radio emission reduced. This effect may also explain why the total observed line fluxes for the recombination lines (Table 4) are somewhat smaller than the model predictions. For the weaker He I and HeH+ emission lines, the spatial profiles are not measured with a sufficient SNR to allow strong conclusions about limb brightening to be reached.
6 Summary
1) We have detected emission in the 3.51629m v and 3.60776m v rovibrational lines of the helium hydride cation (HeH+) toward the planetary nebula NGC 7027. The v line lies in the wing of a much stronger H recombination line, but could be readily separated thanks to the high spectral resolution of iSHELL.
2) The flux measured for the HeH+ v line is in good agreement with our model for the formation, destruction and excitation of HeH+ in NGC 7027, while the measured strength of the HeH+ v rovibrational line exceeds the model predictions by a factor of 2.3. The HeH+ v line ratio predicted by our model is a factor ( statistical error) larger than the measured value. Because the v line lies in the wing of a much stronger H I recombination line and is affected by narrow atmospheric absorption features, there may be significant systematic uncertainties in our determination of the line ratio. Nevertheless, a discrepancy of this magnitude likely points to inaccuracies in the rate coefficients for vibrational excitation that are adopted in the model.
3) Our model also underpredicts the pure rotational line strength (Güsten et al. 2019) by a factor 2.9. This disagreement may suggest that the rate coefficients for one or both of the dominant HeH+-forming reactions and/or have been underestimated, or that some important HeH+ formation or excitation mechanism has been overlooked. Alternatively, or in addition, it may reflect approximations in our (spherically-symmetric) physical model for the source, or uncertainties in the rate coefficients we adopted for rotational excitation of HeH+ in collisions with electrons.
4) Our observations of NGC 7027, performed with iSHELL and covering the 3.26 - 3.93m spectral region, led to the detection of more than sixty spectral lines; in addition to the HeH+ v and lines, these include multiple recombination lines of H I, He I and He II, rovibrational emissions from H2, a fine structure line of [Zn IV], and nine rovibrational emissions from CH+. The latter were detected for the first time in an astronomical source (although CH+ pure rotational emissions had been detected previously toward this source by Cernicharo et al. 1997). The identification of CH vibrational lines was made possible by recent laboratory spectroscopy performed by Domenech et al. (2018), and the implications of their discovery will be considered in a future publication. There are several emission lines that have not yet been identified, the two strongest of which are at wavelengths of 3.2817 and 3.8102m.
5) The observations provide information about the spatial distribution of the various line emissions along the minor axis of NGC 7027. As expected, all the spectral lines we have considered are limb brightened. For recombination lines of H I, and He II, the degree of limb brightening is somewhat larger than the predictions obtained for a spherically-symmetric model of the nebula; as discussed in previous studies, this probably arises because the nebula is elongated along the line-of-sight. The SNR obtained for the He I and HeH+ lines is not sufficient to constrain strongly the degree of limb brightening for those transitions.
References
- Agúndez et al. (2010) Agúndez, M., Cernicharo, J., Guélin, M., et al. 2010, A&A, 517, L2
- Ayouz, & Kokoouline (2019) Ayouz, M., & Kokoouline, V. 2019, Atoms, 7, 67
- Barlow et al. (2013) Barlow, M. J., Swinyard, B. M., Owen, P. J., et al. 2013, Science, 342, 1343
- Bauman et al. (2005) Bauman, R. P., Porter, R. L., Ferland, G. J., et al. 2005, ApJ, 628, 541
- Bernath, & Amano (1982) Bernath, P., & Amano, T. 1982, Phys. Rev. Lett., 48, 20
- Black (1978) Black, J. H. 1978, ApJ, 222, 125
- Bovino et al. (2011) Bovino, S., Tacconi, M., Gianturco, F. A., et al. 2011, A&A, 529, A140
- Cecchi-Pestellini, & Dalgarno (1993) Cecchi-Pestellini, C., & Dalgarno, A. 1993, ApJ, 413, 611
- Cernicharo et al. (1997) Cernicharo, J., Liu, X.-W., González-Alfonso, E., et al. 1997, ApJ, 483, L65
- Čurík, & Greene (2017) Čurík, R., & Greene, C. H. 2017, J. Chem. Phys., 147, 054307
- Cushing et al. (2004) Cushing, M. C., Vacca, W. D., & Rayner, J. T. 2004, PASP, 116, 362
- DH (1978) Dabrowski, I., & Herzberg, G. 1978, Ann. NY Acad. Sci. 38, 14.
- Dinerstein, & Geballe (2001) Dinerstein, H. L., & Geballe, T. R. 2001, ApJ, 562, 515
- Doménech et al. (2018) Doménech, J. L., Jusko, P., Schlemmer, S., et al. 2018, ApJ, 857, 61
- Esposito et al. (2015) Esposito, F., Coppola, C. M., & De Fazio, D. 2015, Journal of Physical Chemistry A, 119, 12615
- Flower, & Roueff (1979) Flower, D. R., & Roueff, E. 1979, A&A, 72, 361
- Galli, & Palla (2013) Galli, D., & Palla, F. 2013, ARA&A, 51, 163
- Güsten et al. (2019) Güsten, R., Wiesemeyer, H., Neufeld, D., et al. 2019, Nature, 568, 357
- Hamilton et al. (2016) Hamilton, J. R., Faure, A., & Tennyson, J. 2016, MNRAS, 455, 3281
- Hogness, & Lunn (1925) Hogness, T. R., & Lunn, E. G. 1925, Physical Review, 26, 44
- Juřek et al. (1995) Juřek, M., Špirko, V., & Kraemer, W. P. 1995, Chemical Physics, 193, 287
- Karpas et al. (1979) Karpas, Z., Anicich, V., & Huntress, W. T. 1979, J. Chem. Phys., 70, 2877
- Klemperer (1970) Klemperer, W. 1970, Nature, 227, 1230
- Latter et al. (2000) Latter, W. B., Dayal, A., Bieging, J. H., et al. 2000, ApJ, 539, 783
- Le Padellec et al. (2017) Le Padellec, A., Launoy, T., Dochain, A., et al. 2017, Journal of Physics B Atomic Molecular Physics, 50, 095202
- Lis et al. (2010) Lis, D. C., Pearson, J. C., Neufeld, D. A., et al. 2010, A&A, 521, L9
- Liu et al. (1997) Liu, X.-W., Barlow, M. J., Dalgarno, A., et al. 1997, MNRAS, 290, L71
- Loreau et al. (2013) Loreau, J., Vranckx, S., Desouter-Lecomte, M., et al. 2013, Journal of Physical Chemistry A, 117, 9486
- Masson (1989) Masson, C. R. 1989, ApJ, 336, 294
- Merrill et al. (1975) Merrill, K. M., Soifer, B. T., & Russell, R. W. 1975, ApJ, 200, L37
- Miyake et al. (2011) Miyake, S., Gay, C. D., & Stancil, P. C. 2011, ApJ, 735, 21
- Moorhead et al. (1988) Moorhead, J. M., Lowe, R. P., Maillard, J.-P., et al. 1988, ApJ, 326, 899
- Neufeld et al. (2006) Neufeld, D. A., Schilke, P., Menten, K. M., et al. 2006, A&A, 454, L37
- Novotný et al. (2019) Novotný, O., Wilhelm, P., Paul, D., et al. 2019, Science, 365, 676
- Ramaker, & Peek (1976) Ramaker, D. E., & Peek, J. M. 1976, Phys. Rev. A, 13, 58
- Rayner et al. (2016) Rayner, J., Tokunaga, A., Jaffe, D., et al. 2016, Proc. SPIE, 990884
- Roberge, & Dalgarno (1982) Roberge, W., & Dalgarno, A. 1982, ApJ, 255, 489
- Schilke et al. (2014) Schilke, P., Neufeld, D. A., Müller, H. S. P., et al. 2014, A&A, 566, A29
- Schneider et al. (1994) Schneider, I. F., Dulieu, O., Giusti-Suzor, A., et al. 1994, ApJ, 424, 983 (Erratum: 486, 580)
- Stancil et al. (1998) Stancil, P. C., Lepp, S., & Dalgarno, A. 1998, ApJ, 509, 1
- Storey, & Hummer (1995) Storey, P. J., & Hummer, D. G. 1995, MNRAS, 272, 41
- Strömholm et al. (1996) Strömholm, C., Semaniak, J., Rosén, S., et al. 1996, Phys. Rev. A, 54, 3086
- Vacca et al. (2003) Vacca, W. D., Cushing, M. C., & Rayner, J. T. 2003, PASP, 115, 389
- Vranckx et al. (2013) Vranckx, S., Loreau, J., Desouter-Lecomte, M., et al. 2013, Journal of Physics B Atomic Molecular Physics, 46, 155201
- Waibel et al. (1988) Waibel, H., Ruf, M.-W., & Hotop, H. 1988, Zeitschrift fur Physik D Atoms Molecules Clusters, 9, 191
- Wildt (1949) Wildt, R. 1949, AJ, 54, 139
- Zijlstra et al. (2008) Zijlstra, A. A., van Hoof, P. A. M., & Perley, R. A. 2008, ApJ, 681, 1296
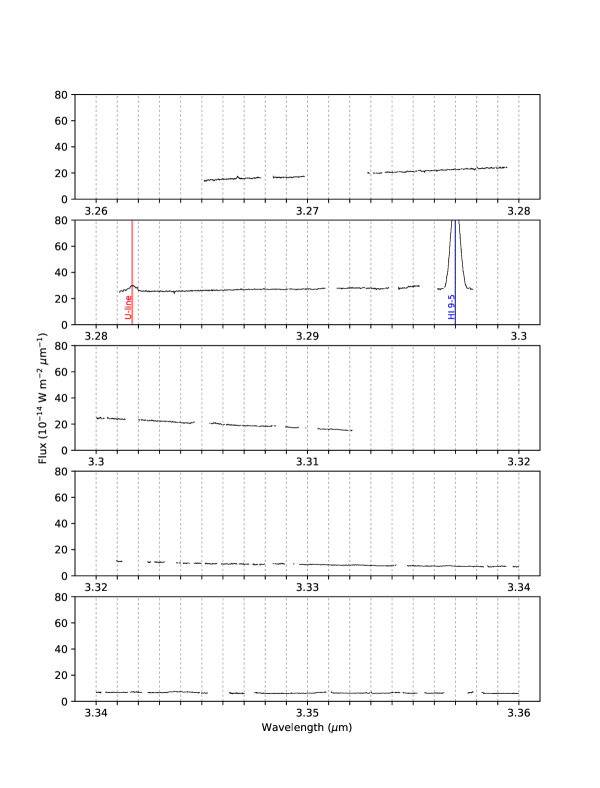
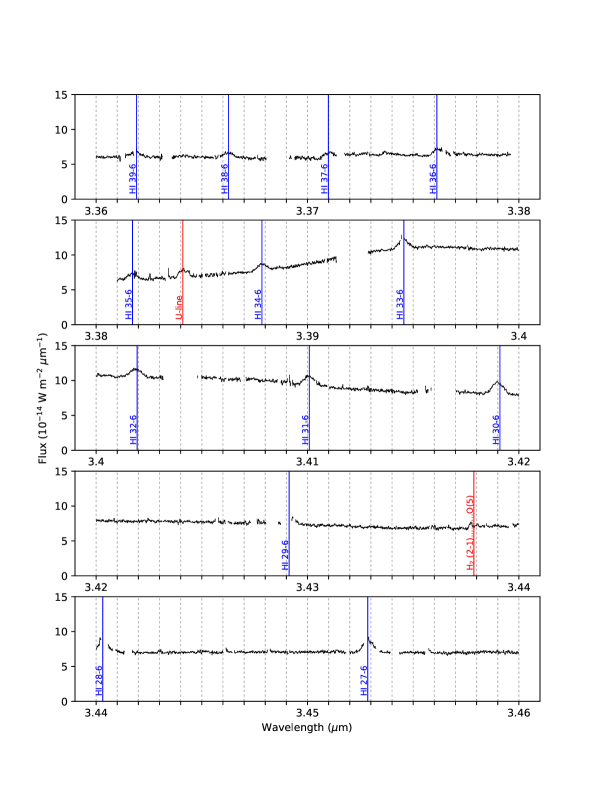
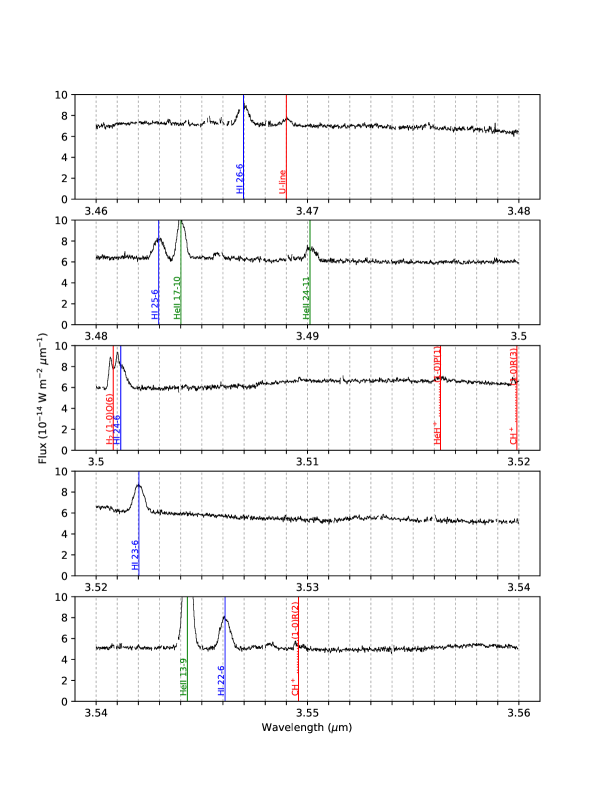
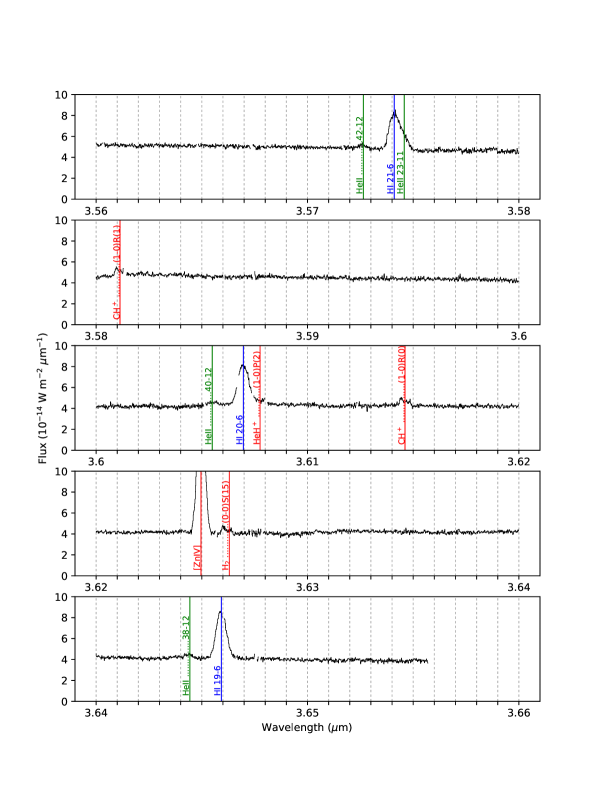
Appendix A: Full 3.26 - 3.93m spectrum obtained toward NGC 7027
In Figures A1 – A7, we present all the spectra obtained toward NGC 7027, with labels indicating the 62 spectral features that have been detected. These spectra were obtained by summing over the 11 central extraction regions (numbered 3 – 13 in Figure 1). Spectral regions that were severely affected by atmospheric absorption have been excised, resulting in the gaps that are apparent (particularly in Figures A1 and A2). In the case of the Lp2 spectra (Figures A5 – A7), obtained under less favorable meteorological conditions, atmospheric emission lines were still apparent in the sky-subtracted spectra. Their presence points to sky emission that was significantly variable over the timescale on which the telescope was nodded to the reference position. We corrected for this effect by subtracting the sky spectrum observed in the four outermost extraction regions (1, 2, 14, and 15), at the cost of a decreased SNR.
The lines detected include
(1) A set of 27 H I recombination lines, consisting of the Pfund and Pfund lines along with all Humphreys lines () with upper state principal quantum numbers between 15 and 39.
(2) 10 recombination lines of He II
(3) 3 recombination lines of He I
(4) The v and transitions of HeH+
(5) A set of 5 H2 lines, comprising the v and and rovibrational lines; the v line, and the and pure rotational transitions
(6) A line at 3.62496 m, previously identified by Dinerstein & Geballe as a fine structure transition of [Zn IV]
(7) 5 lines as yet unidentified
(8) 9 rovibrational lines of CH+: the v and lines
In Table A1, we list a subset of 52 lines for which the line fluxes could be determined reliably, along with the measured fluxes. Here, as in Table 4, the measured values were obtained from direct integration over the line, without any assumption that the line profile is Gaussian.
| Line | Rest wavelength | Flux |
|---|---|---|
| (m) | () | |
| Unidentified | 3.2817 | a |
| H I 9–5 | 3.29699 | |
| H I 38–6 | 3.36626 | |
| H I 37–6 | 3.37099 | |
| H I 36–6 | 3.37612 | |
| Unidentified | 3.3841 | |
| H I 34–6 | 3.38784 | |
| H I 32–6 | 3.40194 | |
| H I 31–6 | 3.41009 | |
| H I 30–6 | 3.41911 | |
| H2 (2–1) | 3.43787 | |
| H I 27–6 | 3.45285 | |
| H I 26–6 | 3.46697 | |
| Unidentified | 3.4690 | |
| H I 25–6 | 3.48296 | |
| He II 17–10 | 3.48401 | |
| He II 24–11 | 3.49012 | |
| H2 (1–0) | 3.50081 | Blend b |
| H I 24-6 | 3.50116 | c |
| HeH+ (1–0) | 3.51629 | |
| H I 23–6 | 3.52203 | |
| He II 13–9 | 3.54432 | |
| H I 22–6 | 3.54610 | |
| CH+ (1–0) | 3.54958 | |
| H I 21–6 | 3.57410 | Blend b |
| He II 23–11 | 3.57458 | c |
| CH+ (1–0) | 3.58113 | |
| H I 20-6 | 3.60697 | |
| HeH+ (1–0) | 3.60776 | |
| CH+ (1–0) | 3.61461 | |
| Zn IV | 3.62496 | |
| H2 (0–0) | 3.6263 | |
| H I 19-6 | 3.64592 | |
| He II 22–11 | 3.67594 | |
| CH+ (1–0) | 3.68757 | |
| H I 18-6 | 3.69263 | |
| He I | 3.70355 | |
| CH+ (1–0) | 3.72716 | |
| He II 16–10 | 3.73903 | |
| H I 8–5 | 3.74056 | |
| H I 17–6 | 3.74939 | |
| CH+ (1–0) | 3.76890 | |
| He II | 3.79942 | |
| H2(1–0) | 3.80740 | |
| Unidentified | 3.8102 | |
| CH+ (1–0) | 3.81286 | |
| H I 16–6 | 3.81945 | |
| H2 (0–0) | 3.8460 | |
| CH+ (1–0) | 3.85912 | |
| Unidentified | 3.8675 | |
| H I 15–6 | 3.90755 | Blend b |
| CH+ (1–0) | 3.90776 | c |