Simulating Kilonovae in the CDM Universe
Abstract
Kilonovae are optical flashes produced in the aftermath of neutron star-neutron star mergers (NNMs) or neutron star-black hole mergers (NBMs). The multi-messager observation of the recent gravitational wave event GW170817 confirms that it originated from a NNM and triggered a kilonova. In this work, we use the Millennium Simulation, combined with a semi-analytic galaxy formation model–GABE (Galaxy Assembly with Binary Evolution) which adopts binary stellar population synthesis models, to explore the cosmic event rate of kilonovae, and the properties of their host galaxies in a cosmological context. We find that model with supernova kick velocity of fits the observation best, in agreement with the exception of some formation channels of binary neutron star. This indicates that NNMs prefer to originate from binary systems with low kick velocities. With , the cosmic event rate of NNMs and NBMs at are and , respectively, marginally consistent with the constraint from LVC GWTC-1. For Milky Way-mass galaxies, we predict the NNM rate is , which is also in good agreement with the observed properties of binary neutron stars in the Milky Way. Taking all the NNMs into account in the history of Milky Way-mass galaxies, we find that the averaged r-process elements yield with in a NNM and NBM event should be to be consistent with observation. We conclude that NGC 4993, the host galaxy of GW170817, is a typical host galaxy for NNMs. However, generally NNMs and NBMs tend to reside in young, blue, star-forming, late-type galaxies, with stellar mass and gaseous metallicity distribution peaking at and , respectively. By studying kilonovae host galaxies in the cosmological background, it is promising to constrain model details better when we have more events in the forthcoming future.
keywords:
galaxies: general – binaries: close – neutron star mergers – black hole - neutron star mergers – supernovae: general – nuclear reactions, nucleosynthesis, abundances1 Introduction
When a neutron star-neutron star merger (NNM) happens, neutron-rich material is ejected subrelativistically and a black hole or a neutron star is left over as a remnant (Abbott et al., 2017d; Yu et al., 2018). The neutron-rich expanding ejecta provides an excellent nursery for rapid neutron capture (r-process) nucleosynthesis. The decay radiation of these newly-formed r-process elements is the so-called kilonova (Li & Paczyński, 1998; Metzger et al., 2010; Metzger, 2017), which is expected to appear days after merger and peak at ultraviolet, optical, or near-infrared wavelengths, depending on the opacity of ejecta (Li & Paczyński, 1998; Kasen et al., 2013; Tanaka & Hotokezaka, 2013; Barnes & Kasen, 2013). Kilonova was first directly observed through infrared emission excess about one week after SGRB 130603B (Tanvir et al., 2013; Berger et al., 2013). Note that theoretically, neutron star-black hole mergers (NBMs) can also eject neutron-rich matter with sub-relativistic velocity and trigger kilonovae (e.g. Lattimer & Schramm, 1974; Surman et al., 2008).
On August 17th, 2017, the first directly detected NNM, GW170817, was observed by advanced LIGO detectors (LIGO Scientific Collaboration et al., 2015; Abbott et al., 2017a). This was the only NNM event observed in the first (O1) and second (O2) observing run of advanced LIGO (O1 spanned four months, and O2 spanned nine months). Other detection were all black hole-black hole mergers (BBMs), with 10 confidently identified detection (Abbott et al., 2019b). No NBMs were detected. Considering all available data from O1 and O2, LIGO Scientific Collaboration and Virgo Collaboration (LVC) infer that the cosmic event rate of NNMs is with confidence, and the upper limit of the cosmic event rate of NBMs is (Abbott et al., 2019a).
Not only was GW170817 detected in gravitational waves (GWs), its counterparts in -ray, X-ray, UV, optical, infrared, and radio bands were also recognized in the sky area constrained by advanced LIGO and advanced Virgo (summarized in Abbott et al., 2017b). Its electromagnetic (EM) emission peaked in ultraviolet, indicating a blue component with low opacity, and then slowly shifted towards near-infrared days after merger, which can be fitted with a two-component kilonova model (Tanvir et al., 2017; Cowperthwaite et al., 2017; Nicholl et al., 2017; Waxman et al., 2018; Li, 2019). With much higher accuracy on localization than GW detection, these multi-bands observations confirmed that NGC 4993 is the host galaxy of GW170817. NGC 4993 is an old elliptical galaxy with stellar mass of and median mass-weighted age of as measured by Blanchard et al. (2017). Troja et al. (2017) reported a similar stellar mass, , but with a younger age of . As the spectra of long-lived stars evolve quite slowly, the age estimation of stellar populations of old galaxies has large systematic errors.
The third (O3) observing run of LVC111https://gracedb.ligo.org/superevents/public/O3/ began on 1st April, 2019 and is planned to end on 30th April, 2020. Till the end of 2019, with nine months’ observation, three NNMs and two NBMs (probability ) have been detected. Among them, S190425z (LIGO Scientific Collaboration & VIRGO Collaboration, 2019) has a probability to be a NNM, with a false alarm rate (FAR) of 1 per 69834 years. s and s later, a weak -ray burst which consisted of two pulses was detected by INTEGRAL, in the northern region of the localization proposed by LVC (Pozanenko et al., 2019). However, following observations have not yet confirmed any optical counterpart of S190425z (Hosseinzadeh et al., 2019; Lundquist et al., 2019; Coughlin et al., 2019; Antier et al., 2019). S190814bv222https://gracedb.ligo.org/superevents/S190814bv/view/ has a probability to be a NBM, with an extremely low FAR of 1 per years. Unfortunately, no EM counterparts were confirmed in the following observing campaign till the end of 2019 (Gomez et al., 2019; Andreoni et al., 2019; Dobie et al., 2019). Information about candidates and host galaxies of other events are not public yet. As O3 is still going on and its updates on NNMs and NBMs event rate and host galaxies have not been published, we stick to the observational result of LVC O1 and O2 as the comparison with our model prediction in this work.
From the modelling point of view, the traditional way to estimate the NNM event rate in stars of a certain galaxy is to convolve the NNM event rates of simple stellar populations which are derived from stellar population synthesis models with a hypothetical star formation history. For instance, based on observational results (e.g. Gilmore, 2001), a constant star formation rate of that lasts for is usually assumed to estimate the NNM event rate in the Milky Way (Portegies Zwart & Yungelson, 1998; Belczynski et al., 2002; Voss & Tauris, 2003; Belczynski et al., 2007; Dominik et al., 2012; Belczynski et al., 2016; Chruslinska et al., 2018; Belczynski et al., 2018a, b). The cosmic event rate density can then be derived by considering the number density of Milky Way-type galaxies (Belczynski et al., 2007; Belczynski et al., 2016). The cosmic event rate density can also be estimated (Dominik et al., 2013; Chruslinska et al., 2018; Boco et al., 2019) using fitting formulas of the history of cosmic star formation density (Strolger et al., 2004; Madau & Dickinson, 2014). In recent years, due to the fast development of cosmological hydrodynamic simulations, star formation histories from cosmological hydrodynamic simulations are more frequently used to estimate NNM event rate (Mapelli & Giacobbo, 2018; Mapelli et al., 2018, 2019; Toffano et al., 2019; Artale et al., 2019a, b). Star formation histories of various galaxies derived from semi-empirical models (Behroozi et al., 2019) are also used (Adhikari et al., 2020).
In this work, we use semi-analytic models of galaxy formation to estimate the cosmic event rate of kilonova events, triggered by both NNMs and NBMs (hereafter denoted as compact object mergers, COMs), and study the properties of their host galaxies. Combined with N-body merger trees of dark matter haloes, semi-analytic models trace how galaxies form and evolve in haloes, by implementing simplified models or empirical relations that describe physical processes including reionization, gas cooling, star formation, supernova feedback, black hole growth, AGN feedback, galaxy mergers etc, and have recovered a large amount of observations in the local universe and at high redshift (e.g. White & Frenk, 1991; Kauffmann et al., 1999; Croton et al., 2006; De Lucia & Blaizot, 2007; Guo et al., 2011; Henriques et al., 2015). With semi-analytic models, the star formation histories of galaxies in a large mass range, from dwarf satellite galaxies to BCGs (the Brightest Cluster Galaxy), are specified from first principle, which allows us to derive NNM and NBM event rates for each galaxy, and to explore the relationship between kilonovae and their host galaxies. Besides, semi-analytic models consume much less computational time than cosmological hydrodynamic simulations, which allows us to generate galaxy catalogue for a larger volume.
The semi-analytic model we use in this study is GABE (Galaxy Assembly with Binary Evolution; Jiang et al., 2019), which includes a full set of galaxy formation recipes and has reproduced a large body of observational results. Compared with previous semi-analytic models, GABE for the first time modelled binary star evolution by adopting Yunnan-II stellar population synthesis model, which includes various interactions of binaries. Therefore, it is able to use GABE to make direct predictions of binary population in the simulated galaxies. In particular, the remnants of binary stars, i.e. all kinds of double compact objects, including double neutron stars (NS-NS), neutron star-black hole (NS-BH) and double black holes (BH-BH), can be modelled and predicted in detail.
The structure of this paper is as follows. In section 2, we first introduce briefly the semi-analytic model GABE and Yunnan-II stellar population synthesis model we use, then describe our method to calculate NNM and NBM event rates in simple stellar population and in galaxies. In section 3.1 and 3.2, we show the event rates of NNMs and NBMs for both simple stellar population and for modeled galaxies in a cosmological point of view. Section 3.3 shows the prediction of r-process elements produced by COMs in the lifetimes of galaxies. In section 4, properties of COM host galaxies are presented. We summarize our conclusions in section 5.
2 Models and methods
2.1 Semi-analytic model
The semi-analytic galaxy formation model used in this work is GABE (Galaxy Assembly with Binary Evolution, Jiang et al., 2019), which includes detailed modelling of binary star evolution by adopting Yunnan-II stellar population synthesis model (introduced later in section 2.2). More details about the model can be found in Jiang et al. (2019).
The Millennium Simulation (Springel et al., 2005) is used to implement GABE in this work. The cosmological parameters adopted are: (matter density) , (baryon density) , (dark energy density) , (spectral index) , (linear predictions for the amplitude of fluctuations within 8) and (Hubble constant) , derived from a combined analysis of the 2dFGRS (Colless et al., 2001) and the first-year WMAP data (Spergel et al., 2003). Dark matter haloes and subhaloes in the simulation are identified with a friends-of-friends group finder (Davis et al., 1985) and SUBFIND (Springel et al., 2001), respectively. The merger trees are derived by following the formation and merger history of each halo/subhalo with the D-Tree algorithm (Jiang et al., 2014), based on which GABE is applied to.
The simulation has a boxsize of on a side, which is large enough compared to the detectable horizon of current ground based GW detectors, ranging from to for NNMs (Abbott et al., 2017a). The mass resolution of dark matter particle in the Millennium Simulation is , allowing GABE to generate a complete galaxy catalogue for galaxies more massive than .
2.2 Stellar population synthesis models
Yunnan-II stellar population synthesis model (Zhang et al., 2004, 2005; Zhang et al., 2010) is used to model binary evolution in GABE. Yunnan-II is a stellar population synthesis model developed by the Group of Binary Population Synthesis of Yunnan Observatories. It is built based on the rapid binary star evolution (BSE) algorithm of Hurley et al. (2002), which modeled various binary interactions including mass transfer, mass accretion, common-envelope evolution, collisions, supernova kicks, tidal evolution and angular momentum loss through GWs. In Zhang et al. (2010), the evolutionary population synthesis models of Han et al. (2007) which considered sub dwarf B stars (sdBs) are also included. With the help of Yunnan-II model, instead of only modeling single star evolution as in Bruzual & Charlot (2003), properties of binary stars in galaxies can be studied.
The setting of initial parameters of Yunnan-II model and updated model parameters can be found in section 2.4.1 of Jiang et al. 2019. Here we briefly describe the changes we have made in this work based on the fiducial Yunnan-II model. 1) The range of the initial mass of the primary star in a binary is changed from to , to focus on binaries that can have remnants of neutron stars and black holes that we are studying. 2) The initial mass function (IMF) of Chabrier 2003 is used, replacing the approximated IMF given by Eggleton et al. 1989. 3) The maximum mass of neutron star is set to be , rather than in the oiriginal BSE. 4) The kick velocities of supernovae333The distribution of kick velocity of supernovae in stellar evolution model is generally fitted with a Maxwellian distribution. In this work, the parameter represents the dispersion of this Maxwellian distribution. applies to both the first and second supernovae during the formation of NNMs or NBMs. See Appendix A1 of Hurley et al. 2002 for more details., which are the natal velocities of the remnants after supernovae due to the asymmetry of explosion, are set to be able to vary in the range from to , instead of the fixed value of in the fiducial Yunnan-II model. As we find that the value of kick velocity influence the merger rate a lot ( magnitude, see Fig. 1 below). Large kick velocities will enlarge the orbital separations after supernova and delay the coalescence. Binary systems could even be tore apart with larger kick velocities. Thus increasing kick velocities will lower the merger rate. Besides, there are studies indicate that kick velocities in binary systems could be lower than ones of single stars in some cases (Podsiadlowski et al. 2004; Dewi et al. 2005; Tauris et al. 2015; Tauris et al. 2017; see section 3.2 for more details). Four values of are applied and checked in section 3.1 and 3.2. From section 3.3, is chosen to build our fiducial model, since with this value the predicted cosmic event rate density is more consistent with the observational constraint of LVC in the local Universe, as can be seen in Fig. 3 and section 3.2.
Note that apart from the kick velocity of supernovae, other model parameters of stellar population synthesis model, such as common envelope parameter and mass transfer parameter, could also affect the merger rate (e.g. Dominik et al., 2012; Chruslinska et al., 2018). While the focus of this work is the evolution of COMs and their host galaxies. A full exploration of the parameter space is beyond the scope of this paper. We leave this question in future works.
2.3 Calculating event rates
For a simple stellar population (SSP)444A simple stellar population represents a set of stars formed together at the same time, having the same age and metallicity. “Simple” is used to be distinguished from the so-called complex stellar population, which is composed of multiple simple stellar populations., during the running of BSE algorithm as described in section 2.2, we record every NNM and NBM event that occurs in the evolution process. By doing so, we get the compact object merger event rate for a SSP of certain age and metallicity.
For a galaxy that is comprised of millions to billions of stars with different mass, age and metallicity, the total COM rate in a galaxy at a certain time , , can be calculated as the sum of the COM rate for all the SSPs in the galaxy:
| (1) |
where is the star formation rate of the galaxy at time for stars with metallicity , is the COM rate for a SSP of mass with metallicity and age .
In this work, we use the discretized version of Equ. (1) to calculate in a galaxy at time :
| (2) |
where is the total number of SSPs in this galaxy, and , , are the initial mass, metallicity and formation time of the SSP respectively.
We assume that all NNMs and NBMs can produce kilonovae. In this case, the observed event rate of kilonovae can be written as:
| (3) | |||||
and are the event rates of NNMs and NBMs respectively. is the beaming factor. As shown by Metzger & Berger (2012), the ejecta of kilonova has a rather isotropic structure and can be observed from a broad angle range. Therefore we adopt in this work.
Compared with NNM (see Baiotti & Rezzolla 2017 for a review), the mechanism and EM counterpart of NBM is much more ambiguous and still under debate. If the mass ratio of black hole over neutron star is very large, the neutron star will be swallowed into the black hole as a whole, and no EM emission is expected. Otherwise, the neutron star will be disrupted tidally beyond the Schwarzschild radius of the black hole and produce EM emission (Shibata et al., 2009). Besides, even in the large mass ratio case, if the neutron star is highly magnetized or the black hole is charged, certain EM emission could be produced (Mingarelli et al., 2015; D’Orazio et al., 2016; Zhang, 2019; Dai, 2019). On the observation side, several NBM candidates have been detected during the LVC O3. Among them, S190814bv is the most attracting one, as its false alarm rate is 1 per years. However, no EM counterpart of S190814bv has been found so far (Andreoni et al., 2019; Gomez et al., 2019; Dobie et al., 2019). The possible reasons may be that S190814bv is actually a BBM rather than a NBM, or the mass ratio of BH-NS is too large for EM emission as mentioned above, or the GW signal of S190814bv is a reflected one which arrives the Earth much latter than its EM signals (Wei & Feng, 2019). In summary, we assume all NNMs and NBMs can produce kilonovae for simplicity. Which kind of NBMs can produce kilonovae and the fraction of them are still unclear, both theoretically and observationally.
3 COM event rate and r-process production
In this section, we show first the merger event rates of SSP for both NNMs and NBMs in the Yunnan-II stellar population synthesis model. Then we study the cosmic COM rate density predicted in our GABE semi-analytic model, by combining the of Yunnan-II model with star formation histories using Equ. (2) for each galaxy. In section 3.3, we present the amount of r-process elements produced by NNMs and NBMs in the lifetimes of galaxies.
3.1 Event rate in SSP
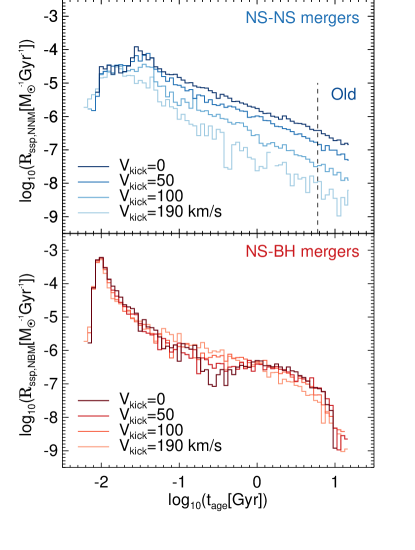
Fig. 1 shows the event rates we derive from the Yunnan-II stellar population synthesis model for SSPs, as a function of the age of the stellar population. and are event rates of NNMs and NBMs, and are presented in the upper and lower panel respectively. In each case, results for four different values of supernovae kick velocities are shown, and are all for solar metallicity.
In the upper panel of Fig. 1, for , we see that NNMs start to appear at after the birth of the stellar population. The event rate peaks at and then decreases as , consistent with the theoretical expectation of the delay time distribution of COMs (Maoz et al., 2014; Toonen et al., 2012; Yungelson, 2013). For different , in general decreases as increases. The difference is small for , and can be as large as 2 dex at late times. In the lower panel of Fig. 1, we see that at all ages the event rates are similar for different values of , except that for , with is obviously lower than the one with .
We have checked the model in detail and found two reasons responsible for the dependence of event rates on : 1) In Yunnan-II model, the supernova which leaves a black hole as its remnant does not have kick velocity to the binary system, while the supernova which forms a neutron star has natal kick. Therefore changing has smaller influence on than on . 2) For , peaks at and also at . During the helium burning regime of the secondary star of a binary, if the star overfills the Roche-lobe, a common envelope forms. The orbital energy is then used to overcome the binding energy of common envelope, decreasing the separation tremendously. This NS-BH binary will coalesce in , which corresponds to the peak at . Otherwise, the secondary evolves to a neutron star independently and form a NS-BH binary with relatively large separation. The orbital energy is dissipated through GWs, and this NS-BH would coalesce in scale. Increasing extends the time scales for mergers to happen, and makes the two peaks less distinct.
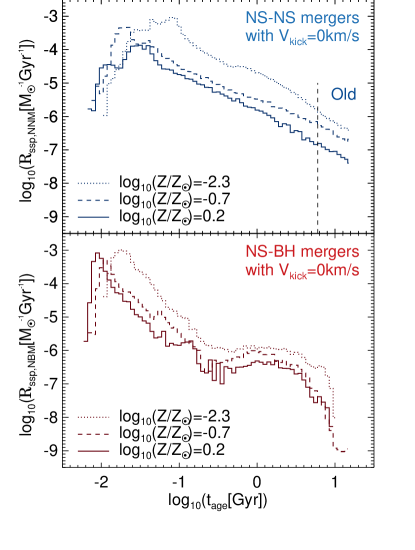
In Fig.2, we show the dependence of on metallicity for . We see that the event rates peak at earlier ages for higher metallcity, indicating shorter timescales of mergers to happen. Nevertheless, the dependence on metallicity for both COM rates is relatively weak (less than about a magnitude), much less than the dependence on age.
As mentioned in section 1, the first directly detected NNM event is GW170817. The timescale from star formation to coalescence of this binary is larger than with confidence according to the stellar mass build-up history of its host galaxy NGC 4993, which is inferred from its best-fit spectral energy distribution (SED) model (Blanchard et al., 2017). To be compared with this specific observed event and check whether GW170817 in NGC 4993 is a typical NNM event, we study in particular the “Old” NNMs, defined as the NNMs that have survived longer than before mergers happen, as shown in the upper panels of Fig. 1 and Fig. 2. From these panels we see that the “Old” NNMs that are like GW170817 are only a small fraction () of all NNMs. For NBMs, the lower pannels of Fig. 1 and Fig. 2 show that drops quickly in old SSPs (), corresponding to few “Old” NBMs predicted in the model.
3.2 Cosmic event rate density
In the previous subsection we show COM event rates in SSPs. From this subsection, we will use the semi-analytic model to predict the total event rate from the cosmological point of view, including galaxies with different star formation histories comprised of complex stellar populations, using the method described in section 2.3.
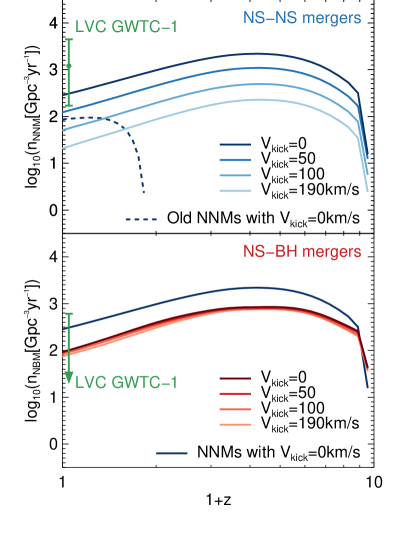
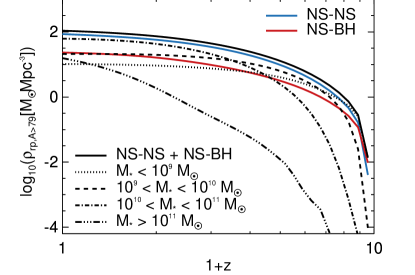
When accounting for all galaxies in the output of the semi-analytic model, Fig. 3 gives the cosmic COM rate density as a function of redshift, where results from the NNMs and NBMs are shown in the upper and lower panels respectively. From the upper panel, we see that the NNM cosmic rate peaks at and decreases gradually towards , closely following the trend of the cosmic star formation rate density which peaks at in GABE, with a short time delay in general (). The time delay agrees with the delay time distribution of NNMs as shown in Fig. 1. With different , varies by a factor of dex. The number density with at is , marginally agree with the observational result of LVC GWTC-1 (Abbott et al., 2019a), which is , as shown by the green dot with error bar in the upper panel of Fig. 3. Results with higher predict lower event rate densities, due to the generally lower event rate in SSP as shown in Fig. 1. Therefore, we choose , i.e. , as our fiducial model, which our following analysis is based on. Compared with other works before, our fiducial model falls into their plausible ranges (, Chruslinska et al. 2018; , Mapelli & Giacobbo 2018; , Artale et al. 2019b).
Blue dashed line in the upper panel of Fig. 3 shows of Old NNMs (as defined in section 3.1) with . Old NNMs start to appear at low redshift () when some stellar populations become older than , and have a larger fraction in all NNMs towards lower redshift. At , Old NNMs is about of all NNMs. According to Blanchard et al. (2017), GW170817 is found in an old galaxy, and is probably an old NNM. While our result shows that younger NNMs have higher event rate density than Old NNMs in the local universe. More younger NNMs should be discovered (and in younger galaxies) with future observations, especially when GW detectors go to higher redshifts (the horizon of LIGO H1 during O2 is , i.e. ).
In the lower panel of Fig. 3, the evolution of the event rate density of NBMs, , is shown. The trend is similar as for the evolution of shown in the upper panel, and also follows the trend of star formation rate density closely. The results do not vary much with different , consistent with the results of SSPs as shown in the lower panel of Fig. 1. For , the NBM rate density is in general lower than the NNM rate density. At , is , about a third of , which is consistent with the upper limit proposed by LVC GWTC-1 shown as the green arrow.
| Virgo | LIGO L1 | LIGO H1 | |||
| NNMs | |||||
| 50 | 123 | 0.100 | 0.629 | 5.32 | |
| 100 | 51 | 0.041 | 0.26 | 2.2 | |
| 190 | 21 | 0.017 | 0.11 | 0.90 | |
| LVC GWTC-1 | |||||
| NBMs | |||||
| LVC GWTC-1 |
The cosmic event rate densities at for NNMs and NBMs in different models are listed in Table. LABEL:tab:nCOM. We also show the event number per year that is predicted to be detected by Virgo and LIGO detectors, by assuming the detector horizons of NNMs and NBMs are , and for Virgo, LIGO L1 and LIGO H1 respectively (Abbott et al., 2017a).
Our models prefer a low kick velocity () for the progenitors of NNMs. Whereas, the observation of pulsar proper motions claim a much larger kick velocity: (Hansen & Phinney, 1997), and (Hobbs et al., 2005). This inconsistency may shed some light on understanding the different formation routes of the isolated neutron stars and the ones in the pairs. Recent studies have proposed two formation channels for neutron stars with low kick velocity in binaries: 1) Podsiadlowski et al. (2004) found that stars with initial mass in binary systems are likely to undergo an electron-capture supernova, rather than a neutrino-driven supernova as the case for a single star. Accretion induced collapse of massive white dwarfs with O/Ne/Mg cores can also lead to electron-capture supernovae. Electron-capture supernova is almost symmetric, short-duration and has smaller explosion energy (Gessner & Janka, 2018; Dessart et al., 2006), which naturally leads to an explosion with smaller kick velocity. 2) Tauris et al. (2015); Tauris et al. (2017) concluded that ultra-stripped supernovae (the second supernova in the formation of NS-NS and whose progenitor is an almost naked helium star) in close binaries generally have small kick velocities, due to the low mass () and low binding energy of the helium envelope. However, these channels have relatively strict requirement for the initial parameters of binaries. For instance, electron-capture supernova only works for stars with initial mass , and ultra-stripped supernova require the pre-supernova orbital period to be . The fraction of ultra-stripped supernovae of all supernovae Ic is small (, Tauris et al. 2013).
Note that LVC GWTC-1 only constrains the merged NS-NSs, rather than the whole population. The initial conditions of such merged NS-NSs, as well as their evolutionary tracks and kick velocities, could be different from ones that not merged. It may be not appropriate to quantify kick velocities by using one parameter. A more refined and physical model for the determination of kick velocities may be needed. This is beyond the scope of this paper and we leave it to future works. More detection and better constraint from LVC O3 may also alleviate this inconsistency.
3.3 r-process elements production
The ejected neutron-rich wind during a NNM or NBM provides an excellent environment for r-process nucleosynthesis, which is a nuclear process responsible for the production of about half of the elements heavier than iron (Burbidge et al., 1957; Cameron, 1957; Meyer, 1994). The ejecta is extremely neutron-rich (with electron fraction ), which allows nuclei to capture neutrons on a timescale faster than -decay, and some neutron-rich isotopes can only be produced through r-process. r-process elements can be produced not only in NNMs and NBMs, but may also be produced in core collapse supernovae (Wheeler et al., 1998; Argast et al., 2004; Arnould et al., 2007) and high entropy winds from young neutron stars (Woosley & Hoffman, 1992). In this work, we focus on the r-process in NNMs and NBMs, and do not account for all other possible formation and reduction channels.
We calculate the total r-process elements mass produced by NNMs and NBMs in a galaxy as:
| (4) |
where and are the total number of NNMs and NBMs in the whole life of a galaxy, which are derived from GABE directly.
and are the mass of produced r-process elements in one NNM and NBM event, or the “yield” of r-process elements. The uncertainties of the yields are huge. For NNMs with different neutron star masses, the ejecta masses can vary by a factor of 5, from to , and can be larger or smaller than the ones of NBMs (Korobkin et al., 2012). For NBMs with different black hole spin, the ejecta masses vary by a factor of (Bauswein et al., 2014). Besides, the equation of state of the neutron star, and detailed disk-ejecta configuration can also influence nucleosynthesis efficicy of NBMs by a factor of a few (Tanaka et al., 2014; Fernández et al., 2017). Here in this work, for simplicity, we assume that NNMs and NBMs have the same yield, and are the same as the observational constrains of the ejacta mass of GW170817 (Côté et al., 2018)555Their Table. 1 and Table. 2 are compilations of various literatures (Abbott et al., 2017c; Arcavi et al., 2017; Cowperthwaite et al., 2017; Chornock et al., 2017; Evans et al., 2017; Kasen et al., 2017; Kasliwal et al., 2017; Nicholl et al., 2017; Perego et al., 2014; Rosswog et al., 2018; Smartt et al., 2017; Tanaka et al., 2017; Tanvir et al., 2017; Troja et al., 2017).. The value we adopt is , for r-process elements with .
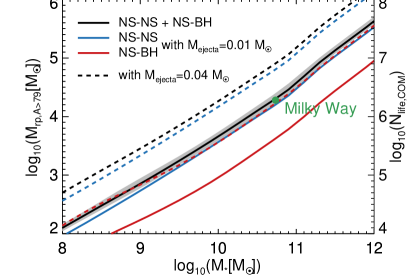
Fig. 4 gives the total mass of r-process elements with in a galaxy, , as a function of galaxy stellar mass at in our fiducial model. The solid and dashed lines are the predicted by assuming and respectively, representing the lower and upper limits of our model prediction. The relation follows a power law with a scatter of only dex, indicating that stellar mass determines the mass of r-process elements predominantly, much more than colors, star formation rates, metallicities, morphology, etc. The contributions from NNMs and NBMs are and at almost all stellar masses.
By adopting the r-process mass fraction in the solar r-process residual, (Arnould et al., 2007; Côté et al., 2018), and the Milky Way mass, (McMillan, 2017), the observed mass of r-process elements in the Milky Way is , as indicated by the green dot in Fig. 4. This observed value is in good agreement with our model prediction of , which is for Milky Way-mass galaxies (with ). The model of (dashed lines) overestimates the amount of r-process elements in Milky Way-mass galaxies. If the yield is indeed , NBMs alone can provide sufficient amount of r-process elements in the Milky Way (the red dashed line).
In Fig. 5, we show the cosmic density evolution of the amount of r-process elements with predicted in our model. Only the model with is shown here, considering that adopting a different yield would not change the general trend of the result. As stellar mass is a good indicator of r-process elements as seen in Fig. 4, the amount of r-process elements accumulated gradually as the universe evolves towards low redshift. About of r-process elements nowadays already existed at , and about r-process elements nowadays formed before . The contributions from NNMs and NBMs are always and respectively, except for the earliest redshifts, due to the fact that NBMs have higher event rate than NNMs in young stellar populations (as shown in Fig. 1). We also explore the amount of r-process elements in galaxies with different stellar masses, as shown by black lines with different line styles. At , most r-process elements () are stored in galaxies with , which means Milky Way-mass galaxies are the main sites for historical r-process nucleosynthesis.
Our fiducial model ( and ) with matches the observed abundance of the Milky Way very well. Note that we have only calculated the r-process nucleosynthesis through NNMs and NBMs in the model. On the other hand, heavy elements abundances are usually measured through meteorite, solar spectra, and stellar spectra (e.g. Anders & Grevesse, 1989; Kappeler et al., 1989), which are all in stellar component. However, a substantial fraction of heavy elements could stay in gas phase, which may cause the underestimation of heavy elements production efficiency in current observation. Besides, due to the spread delay time distribution of NNMs, the lifetime of some NS-NSs can be comparable with the age of the Universe. Thus the offset between the location of coalescence and star-forming region can be (Fong & Berger, 2013), which would also lower the amount of observed heavy elements leaving in galaxies.
4 Properties of COM Host Galaxy
4.1 Stellar mass and age
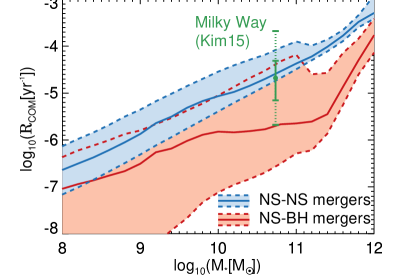
Fig. 6 shows the total event rates of NNMs and NBMs in a galaxy as a function of galaxy stellar mass at in our fiducial model with . The median of the relation can be well fitted by a power law, while deviates from a single power law and has larger scatter. Compared with NNMs, there are more NBMs in young SSPs (, as shown in Fig. 1). Therefore is more sensitive to recent star formation activities, which results in larger scatter.
The observational result of Kim et al. (2015) for the NNM rate in the Milky Way () is shown as the green dot with error bars in Fig. 6. At the Milky Way mass of (McMillan, 2017), the predicted in our model is , in good agreement with the observation. The predicted for Milky Way-like galaxies is much lower, with .
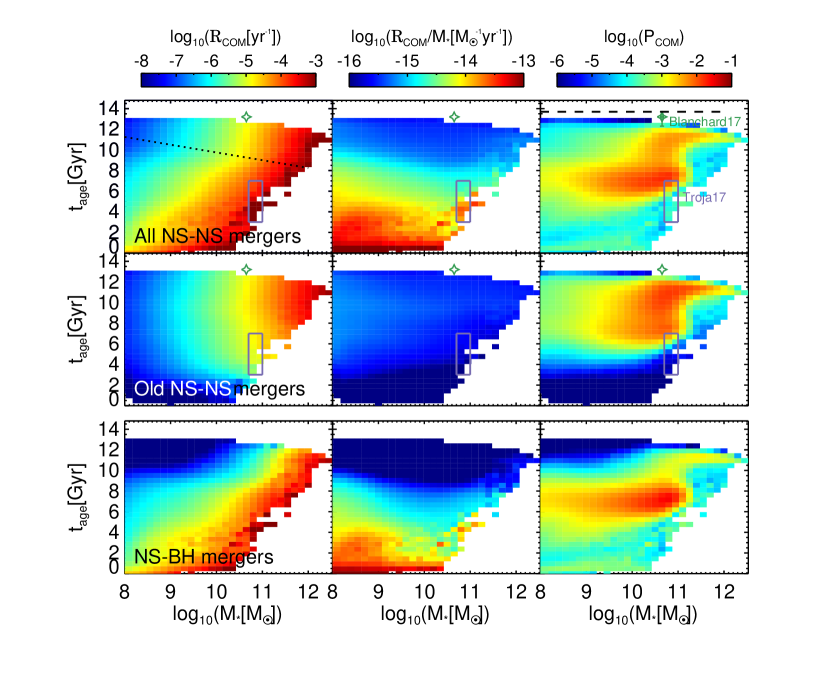
As seen in Fig. 2, age influences COM event rate the most for SSP, so we check also the dependence of on the age of host galaxies666The age of a galaxy in this work is the so-called “mass weighted age”, i.e. the mean value of ages of all the simple stellar populations, weighted by the initial mass of each stellar population.. In the left column of Fig. 7, the distributions of COM event rates in galaxies at of our fiducial model are plotted, in the stellar mass – galaxy age plane. The upper left panel is the result of , which shows that massive/young galaxies generally have higher than small/old galaxies, consistent with expectation as young stellar populations have higher event rate. The distribution can be divided into two populations as shown by the dotted line: for old galaxies above the line, there is almost no dependence on age; for galaxies younger, there exists clear dependence on both stellar mass and age.
The distribution of event rates for Old NNMs is shown in the middle left panel of Fig. 7. For the youngest galaxies with , the event rates of Old NNMs are always low, independent of galaxy stellar mass. For galaxies with , of Old NNMs have strong dependence on stellar mass but almost no dependence on age. Compared with the case for all NNMs, the old galaxies above the dotted line in the upper left panel is mainly contributed by Old NNMs. The distribution of is shown in the lower left panel of Fig. 7, which has similar trend as that of , except that without Old NBMs as shown in section 3.1, the distribution of always depends both on age and stellar mass.
In the middle column of Fig. 7, we show the distribution of specific event rate defined as divided by stellar mass. The dependence on stellar mass is largely reduced in this case. For both NNMs and NBMs, the specific event rate is slightly higher for less massive galaxies at given galaxy age. This is because low mass galaxies tend to have lower metallicity, while low metallicity results in relatively higher as shown in Fig.2.
In order to compare our results with observation, we need to figure out the probability to observe a COM event in a certain kind of galaxies, considering the number density of galaxies into account. We calculate the probability to detect a certain kind of galaxies as the host galaxy of a COM event as:
| (5) |
where the subscript stands for a certain kind of galaxies. is the mean COM rate and is the number density of this kind of galaxies. For example, the number densities of galaxies with certain stellar mass and age are presented in Fig. 11 for GABE (see Appendix A for details). Note that in this work we do not consider the selection effect in observations, and assume all the host galaxies of COMs can be observed, which may overestimate the number of small host galaxies. The influence of selection effect will be explored in future works.
The predicted distributions of as a function of stellar mass and age are shown in the right column of Fig. 7. We find that galaxies with and are most likely detected as the host of a NNM event, as well as of a NBM. In the upper right panel of Fig. 7, compared with the observational results of NGC 4993, the host galaxy of GW170817 (green star: Blanchard et al. 2017, hereafter Blacnchard17; purple rectangle: Troja et al. 2017, hereafter Troja17), we see that the peak of our prediction is marginally consistent with Troja17. Blanchard17 gives similar stellar mass, but the age is much older (close to the age of the Universe, as represented by the horizontal dashed line).
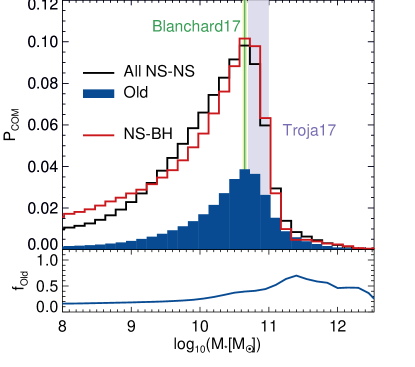
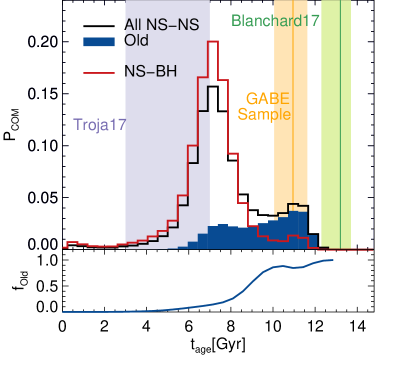
By integrating along () , we can derive the stellar mass (age) distribution of the host galaxy of COMs, and the results are shown in Fig. 8 (Fig. 9). From Fig. 8, we see that the distributions of host galaxies of both NNMs and NBMs peak at around , decreasing fast towards low mass end and even faster towards high mass end. The contribution of Old NNMs is about for galaxies with . For more massive galaxies, Old NNMs contribute more, with a fraction as high as . The observational results of Blanchard17 and Troja17 of NGC 4993 are shown by green and purple shadow in Fig. 8, both lying around the peak of model prediction.
As presented in Fig. 9, the age distribution of host galaxies of NNMs is bimodal, with two peaks of around and . The latter is mainly contributed by Old NNMs. Observationally, the age provided by Blanchard17 and Troja17 differs a lot from each other, which reflects the huge systematic uncertainties in determining age through galaxy spectrum. Unlike the age distribution of the host galaxies of NNMs, the one of NBMs only has the young peak because there is few Old NBMs in the model.
The main results of this subsection is that young and massive galaxies have higher COM rate. The age dependence is mainly caused by young COMs. Considering number densities of galaxies into account, COMs are most likely to be observed in galaxies with and , .
4.2 Colors, sSFR, metallicity and morphology
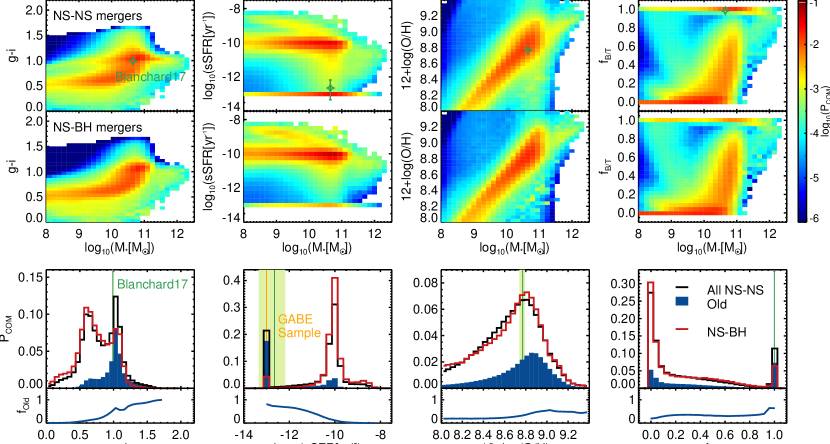
Following the analysis on galaxy stellar mass and age as shown in Fig. 7-9, in this subsection, we further explore the dependence of on color, specific star formation rate (sSFR)777In this work, for model galaxies with sSFR lower than , we set their sSFR to be , in order to make comparison with observations., gas phase metallicity and bulge-to-total stellar mass ratio () for host galaxies of COMs. The results are presented in Fig. 10. The upper two rows of Fig. 10 show the distributions of and respectively, on the planes of galaxy properties and galaxy stellar mass. The host galaxies of NNMs and NBMs have similar distributions for all the galaxy properties investigated.
By Integrating along stellar mass, we can derive the distributions of color, sSFR, metallicity and morphology for COM host galaxies in our model, as shown in the lower panels of Fig. 10. The distributions of color, sSFR and morphology have two peaks, a red/quiescent/early-type sequence, and a blue/star-forming/late-type sequence that includes more galaxies, for both NNMs and NBMs. Therefore it is more likely to detect COMs in blue/star-forming/late-type galaxies. As expected, Old NNMs contribute more in red/quiescent/early-type sequence of all NNMs. The gas metallicity has a wide distribution and peaks at around , which is comparable to solar metallicity (the solar metallicity in unit of is ). Old NNMs contribute more in metal rich NNMs galaxies.
| Property | Blanchard17 | Troja17 | GABE Sample |
|---|---|---|---|
| age() | |||
| g-i | |||
For NGC 4993 that is observed to host GW170817, we list in Table. LABEL:tab:NGC4993 its properties derived by Blanchard17 and Troja17, and over-plot the values from Blanchard17 in Fig. 10 to be compared with model predictions. The observed values are always at or close to the peaks of the model distributions.
As listed in Table. LABEL:tab:NGC4993, the observed stellar mass, color and metallicity of NGC 4993 have small errors, much smaller than that of age and sSFR. Based on these “accurate” properties, we define elliptical galaxies () with , and as NGC 4993-like galaxies. We find 7604 such galaxies from GABE galaxy catalogue at , and construct a NGC 4993-like galaxies sample. Their median age and scatter is , as shown by the orange region in Fig. 9, which locates right at the old peak of the model predicted distribution, closer to the result of Blanchard17 than that of Troja17. of the selected NGC 4993-like galaxies have little star formation. Their median sSFR is , as shown by the orange line in the lower panel of Fig. 10.
5 Conclusion
In this work, we use the semi-analytic model of galaxy formation GABE which includes modeling of binary evolution by adopting Yunnan-II stellar population synthesis model to derive the neutron star-neutron star merger (NNM) and neutron star-black hole merger (NBM) event rates for different kinds of galaxies. After presenting the NNM and NBM event rates in different simple stellar populations (SSPs) predicted by the Yunnan-II model, we study the predicted cosmic NNM and NBM event rate density, r-process elements produced through these mergers, and the properties of host galaxies of the mergers. Here are the main results:
-
•
In Yunnan-II stellar population synthesis model that models binary evolution, the value of natal kick velocity of supernovae assumed in the model affects the NNM rates in SSPs, and also affect the cosmic NNM rate density, by as much as one magnitude, when changing the value from to . The cosmic NNM rate density predicted with (which we choose as the fiducial model) fits the observational result of LIGO Scientific Collaboration and Virgo Collaboration (LVC) best. However, the observation of single pulsar proper motions claims a much larger kick velocity (, Hansen & Phinney 1997). This inconsistency may indicate that the evolutionary tracks and kick velocities of neutron stars in binary systems could be different from single neutron stars, and a more refined and physical model for kick velocities in binary evolution may be needed. Note that we have not done the full exploration of parameter space, which is beyound the scope of this work. Thus this result should be treated with caution. In our model, NNMs prefer to originate from binary systems with low kick velocities. Whereas, the NBM event rate density is almost independent of value of kick velocity in our model.
-
•
The predicted cosmic NNM events rate density at of our fiducial model is , marginally in agreement with the value constrained by LVC GWTC-1 (). The NNMs that have similar old age as GW170817 are about of all NNMs at . We expect that more NNMs in young galaxies should be observed in the future. The predicted cosmic event rate density of NBMs at of our fiducial model is , about a third of the one of NNMs, which is also consistent with the upper limit proposed by LVC GWTC-1 ().
-
•
The predicted total number of NNMs and NBMs in the whole life of a Milky Way-mass galaxy is . By assuming yield mass , the corresponding amount of r-process elements with is , comparable to the observational constraint (). Milky Way-mass galaxies are the main sites for historical r-process nucleosynthesis.
-
•
For a Milky Way-mass galaxy at z=0, the predicted NNM rate is , in a good agreement with the observational result of the Milky Way (, Kim et al. 2015). In general, young and massive galaxies have higher NNM and NBM rate. NNMs and NBMs are most possible to be detected in galaxies with and metallicity of , and are more in young, blue, star-forming and disk galaxies. The properties of NGC 4993, the host galaxy of GW170817, are mostly at or near the peaks of model predicted distrbutions, indicating that NGC 4993 is a typical host galaxy for NNMs.
During LVC O1 and O2, only one NNM event and corresponding host galaxy was detected. LVC O3 began on 1st April, 2019 and is planned to end on 30th April, 2020. Three NNMs and two NBMs (probability ) have been detected till the end of 2019. Though not all the electromagnetic counterparts can be confirmed, the growth of event number is very inspiring. With larger observational sample coming in the future, we can switch the study mode from case study to statistics. The observational distributions of binary compact objects and host galaxies’ properties can be used to constrain all the physical models involved, helping us have a better understanding of stellar evolution, compact objects and galaxy formation.
Acknowledgements
We acknowledge Hailiang Chen for reading our draft and providing some very useful comments and suggestions. J.W. acknowledges the support from the National Natural Science Foundation of China (NSFC) grant 11873051. F.Z. is supported by NSFC grants 11573062, 11973081, 11521303, the YIPACAS Foundation grant 2012048, and the Yunnan Foundation grant 2011CI053. L.X.L. is supported by NSFC grants 11373012, 11973014. R.L. is supported by NSFC grants 11773032, 118513, and the NAOC Nebula Talents Program. L.G. is supported by the National Key R&D Program of China (NO. 2017YFB0203300), and the Key Program of NFSC through grant 11733010. Z.H. is partly supported by NSFC grants 11521303, 11733008. J.P. acknowledges support from the National Basic Research Program of China (program 973 under grant no. 2015CB857001).
References
- Abbott et al. (2017a) Abbott B. P., et al., 2017a, Physical Review Letters, 119, 161101
- Abbott et al. (2017b) Abbott B. P., et al., 2017b, ApJ, 848, L12
- Abbott et al. (2017c) Abbott B. P., et al., 2017c, ApJ, 850, L39
- Abbott et al. (2017d) Abbott B. P., Abbott R., Abbott T. D., Acernese F., et al. 2017d, ApJ, 851, L16
- Abbott et al. (2019a) Abbott B. P., Abbott R., Abbott T. D., Abraham S., et al. 2019a, Physical Review X, 9, 031040
- Abbott et al. (2019b) Abbott B. P., Abbott R., Abbott T. D., Abraham S., et al. 2019b, ApJ, 882, L24
- Adhikari et al. (2020) Adhikari S., Fishbach M., Holz D. E., Wechsler R. H., Fang Z., 2020, arXiv e-prints, p. arXiv:2001.01025
- Anders & Grevesse (1989) Anders E., Grevesse N., 1989, Geochimica Cosmochimica Acta, 53, 197
- Andreoni et al. (2019) Andreoni I., Goldstein D. A., Kasliwal M. M., et al. 2019, arXiv e-prints, p. arXiv:1910.13409
- Antier et al. (2019) Antier S., Agayeva S., Aivazyan V., Alishov S., et al. 2019, MNRAS, p. 2740
- Arcavi et al. (2017) Arcavi I., et al., 2017, Nature, 551, 64
- Argast et al. (2004) Argast D., Samland M., Thielemann F.-K., Qian Y.-Z., 2004, A&A, 416, 997
- Arnould et al. (2007) Arnould M., Goriely S., Takahashi K., 2007, Phys. Rep., 450, 97
- Artale et al. (2019a) Artale M. C., Mapelli M., Bouffanais Y., Giacobbo N., Pasquato M., Spera M., 2019a, MNRAS, p. 2787
- Artale et al. (2019b) Artale M. C., Mapelli M., Giacobbo N., Sabha N. B., Spera M., Santoliquido F., Bressan A., 2019b, MNRAS, 487, 1675
- Baiotti & Rezzolla (2017) Baiotti L., Rezzolla L., 2017, Reports on Progress in Physics, 80, 096901
- Barnes & Kasen (2013) Barnes J., Kasen D., 2013, ApJ, 775, 18
- Bauswein et al. (2014) Bauswein A., Ardevol Pulpillo R., Janka H.-T., Goriely S., 2014, ApJ, 795, L9
- Behroozi et al. (2019) Behroozi P., Wechsler R. H., Hearin A. P., Conroy C., 2019, MNRAS, 488, 3143
- Belczynski et al. (2002) Belczynski K., Kalogera V., Bulik T., 2002, ApJ, 572, 407
- Belczynski et al. (2007) Belczynski K., Taam R. E., Kalogera V., Rasio F. A., Bulik T., 2007, ApJ, 662, 504
- Belczynski et al. (2016) Belczynski K., Repetto S., Holz D. E., O’Shaughnessy R., Bulik T., Berti E., Fryer C., Dominik M., 2016, ApJ, 819, 108
- Belczynski et al. (2018a) Belczynski K., et al., 2018a, arXiv e-prints, p. arXiv:1812.10065
- Belczynski et al. (2018b) Belczynski K., et al., 2018b, A&A, 615, A91
- Berger et al. (2013) Berger E., Fong W., Chornock R., 2013, ApJ, 774, L23
- Blanchard et al. (2017) Blanchard P. K., Berger E., Fong W., Nicholl M., et al. 2017, ApJ, 848, L22
- Boco et al. (2019) Boco L., Lapi A., Goswami S., Perrotta F., Baccigalupi C., Danese L., 2019, ApJ, 881, 157
- Bruzual & Charlot (2003) Bruzual G., Charlot S., 2003, MNRAS, 344, 1000
- Burbidge et al. (1957) Burbidge E. M., Burbidge G. R., Fowler W. A., Hoyle F., 1957, Reviews of Modern Physics, 29, 547
- Cameron (1957) Cameron A. G. W., 1957, PASP, 69, 201
- Chabrier (2003) Chabrier G., 2003, PASP, 115, 763
- Chornock et al. (2017) Chornock R., Berger E., Kasen D., Cowperthwaite P. S., et al. 2017, ApJ, 848, L19
- Chruslinska et al. (2018) Chruslinska M., Belczynski K., Klencki J., Benacquista M., 2018, MNRAS, 474, 2937
- Colless et al. (2001) Colless M., Dalton G., Maddox S., Sutherland W., et al. 2001, MNRAS, 328, 1039
- Côté et al. (2018) Côté B., et al., 2018, ApJ, 855, 99
- Coughlin et al. (2019) Coughlin M. W., Ahumada T., Anand S., et al. 2019, ApJ, 885, L19
- Cowperthwaite et al. (2017) Cowperthwaite P. S., Berger E., Villar V. A., et al. 2017, ApJ, 848, L17
- Croton et al. (2006) Croton D. J., et al., 2006, MNRAS, 365, 11
- D’Orazio et al. (2016) D’Orazio D. J., Levin J., Murray N. W., Price L., 2016, Phys. Rev. D, 94, 023001
- Dai (2019) Dai Z. G., 2019, ApJ, 873, L13
- Davis et al. (1985) Davis M., Efstathiou G., Frenk C. S., White S. D. M., 1985, ApJ, 292, 371
- De Lucia & Blaizot (2007) De Lucia G., Blaizot J., 2007, MNRAS, 375, 2
- Dessart et al. (2006) Dessart L., Burrows A., Ott C. D., Livne E., Yoon S.-C., Langer N., 2006, ApJ, 644, 1063
- Dewi et al. (2005) Dewi J. D. M., Podsiadlowski P., Pols O. R., 2005, MNRAS, 363, L71
- Dobie et al. (2019) Dobie D., Stewart A., Murphy T., Lenc E., et al. 2019, ApJ, 887, L13
- Dominik et al. (2012) Dominik M., Belczynski K., Fryer C., Holz D. E., Berti E., Bulik T., Mandel I., O’Shaughnessy R., 2012, ApJ, 759, 52
- Dominik et al. (2013) Dominik M., Belczynski K., Fryer C., Holz D. E., Berti E., Bulik T., Mandel I., O’Shaughnessy R., 2013, ApJ, 779, 72
- Eggleton et al. (1989) Eggleton P. P., Fitchett M. J., Tout C. A., 1989, ApJ, 347, 998
- Evans et al. (2017) Evans P. A., Cenko S. B., Kennea J. A., Emery S. W. K., et al. 2017, Science, 358, 1565
- Fernández et al. (2017) Fernández R., Foucart F., Kasen D., Lippuner J., Desai D., Roberts L. F., 2017, Classical and Quantum Gravity, 34, 154001
- Fong & Berger (2013) Fong W., Berger E., 2013, ApJ, 776, 18
- Gessner & Janka (2018) Gessner A., Janka H.-T., 2018, ApJ, 865, 61
- Gilmore (2001) Gilmore G., 2001, in Funes J. G., Corsini E. M., eds, Astronomical Society of the Pacific Conference Series Vol. 230, Galaxy Disks and Disk Galaxies. pp 3–12 (arXiv:astro-ph/0011450)
- Gomez et al. (2019) Gomez S., et al., 2019, ApJ, 884, L55
- Guo et al. (2011) Guo Q., et al., 2011, MNRAS, 413, 101
- Han et al. (2007) Han Z., Podsiadlowski P., Lynas-Gray A. E., 2007, MNRAS, 380, 1098
- Hansen & Phinney (1997) Hansen B. M. S., Phinney E. S., 1997, MNRAS, 291, 569
- Henriques et al. (2015) Henriques B. M. B., White S. D. M., Thomas P. A., Angulo R., Guo Q., Lemson G., Springel V., Overzier R., 2015, MNRAS, 451, 2663
- Hobbs et al. (2005) Hobbs G., Lorimer D. R., Lyne A. G., Kramer M., 2005, MNRAS, 360, 974
- Hosseinzadeh et al. (2019) Hosseinzadeh G., et al., 2019, ApJ, 880, L4
- Hurley et al. (2002) Hurley J. R., Tout C. A., Pols O. R., 2002, MNRAS, 329, 897
- Jiang et al. (2014) Jiang L., Helly J. C., Cole S., Frenk C. S., 2014, MNRAS, 440, 2115
- Jiang et al. (2019) Jiang Z., Wang J., Gao L., Zhang F.-H., Guo Q., Wang L., Pan J., 2019, Research in Astronomy and Astrophysics, 19, 151
- Kappeler et al. (1989) Kappeler F., Beer H., Wisshak K., 1989, Reports on Progress in Physics, 52, 945
- Kasen et al. (2013) Kasen D., Badnell N. R., Barnes J., 2013, ApJ, 774, 25
- Kasen et al. (2017) Kasen D., Metzger B., Barnes J., Quataert E., Ramirez-Ruiz E., 2017, Nature, 551, 80
- Kasliwal et al. (2017) Kasliwal M. M., Nakar E., Singer L. P., Kaplan D. L., et al. 2017, Science, 358, 1559
- Kauffmann et al. (1999) Kauffmann G., Colberg J. M., Diaferio A., White S. D. M., 1999, MNRAS, 303, 188
- Kim et al. (2015) Kim C., Perera B. B. P., McLaughlin M. A., 2015, MNRAS, 448, 928
- Korobkin et al. (2012) Korobkin O., Rosswog S., Arcones A., Winteler C., 2012, MNRAS, 426, 1940
- LIGO Scientific Collaboration & VIRGO Collaboration (2019) LIGO Scientific Collaboration VIRGO Collaboration 2019, GRB Coordinates Network, 24168, 1
- LIGO Scientific Collaboration et al. (2015) LIGO Scientific Collaboration et al., 2015, Classical and Quantum Gravity, 32, 074001
- Lattimer & Schramm (1974) Lattimer J. M., Schramm D. N., 1974, ApJ, 192, L145
- Li (2019) Li L.-X., 2019, ApJ, 872, 19
- Li & Paczyński (1998) Li L.-X., Paczyński B., 1998, ApJ, 507, L59
- Lundquist et al. (2019) Lundquist M. J., Paterson K., Fong W., Sand D. J., et al. 2019, ApJ, 881, L26
- Madau & Dickinson (2014) Madau P., Dickinson M., 2014, ARA&A, 52, 415
- Maoz et al. (2014) Maoz D., Mannucci F., Nelemans G., 2014, ARA&A, 52, 107
- Mapelli & Giacobbo (2018) Mapelli M., Giacobbo N., 2018, MNRAS, 479, 4391
- Mapelli et al. (2018) Mapelli M., Giacobbo N., Toffano M., Ripamonti E., Bressan A., Spera M., Branchesi M., 2018, MNRAS, 481, 5324
- Mapelli et al. (2019) Mapelli M., Giacobbo N., Santoliquido F., Artale M. C., 2019, MNRAS, 487, 2
- McMillan (2017) McMillan P. J., 2017, MNRAS, 465, 76
- Metzger (2017) Metzger B. D., 2017, Living Reviews in Relativity, 20, 3
- Metzger & Berger (2012) Metzger B. D., Berger E., 2012, ApJ, 746, 48
- Metzger et al. (2010) Metzger B. D., et al., 2010, MNRAS, 406, 2650
- Meyer (1994) Meyer B. S., 1994, ARA&A, 32, 153
- Mingarelli et al. (2015) Mingarelli C. M. F., Levin J., Lazio T. J. W., 2015, ApJ, 814, L20
- Nicholl et al. (2017) Nicholl M., Berger E., Kasen D., Metzger B. D., et al. 2017, ApJ, 848, L18
- Perego et al. (2014) Perego A., Rosswog S., Cabezón R. M., Korobkin O., Käppeli R., Arcones A., Liebendörfer M., 2014, MNRAS, 443, 3134
- Podsiadlowski et al. (2004) Podsiadlowski P., Langer N., Poelarends A. J. T., Rappaport S., Heger A., Pfahl E., 2004, ApJ, 612, 1044
- Portegies Zwart & Yungelson (1998) Portegies Zwart S. F., Yungelson L. R., 1998, A&A, 332, 173
- Pozanenko et al. (2019) Pozanenko A. S., Minaev P. Y., Grebenev S. A., Chelovekov I. V., 2019, arXiv e-prints, p. arXiv:1912.13112
- Rosswog et al. (2018) Rosswog S., Sollerman J., Feindt U., Goobar A., Korobkin O., Wollaeger R., Fremling C., Kasliwal M. M., 2018, A&A, 615, A132
- Shibata et al. (2009) Shibata M., Kyutoku K., Yamamoto T., Taniguchi K., 2009, Phys. Rev. D, 79, 044030
- Smartt et al. (2017) Smartt S. J., Chen T.-W., Jerkstrand A., Coughlin M., et al. 2017, Nature, 551, 75
- Spergel et al. (2003) Spergel D. N., et al., 2003, ApJS, 148, 175
- Springel et al. (2001) Springel V., White S. D. M., Tormen G., Kauffmann G., 2001, MNRAS, 328, 726
- Springel et al. (2005) Springel V., et al., 2005, Nature, 435, 629
- Strolger et al. (2004) Strolger L.-G., et al., 2004, ApJ, 613, 200
- Surman et al. (2008) Surman R., McLaughlin G. C., Ruffert M., Janka H.-T., Hix W. R., 2008, ApJ, 679, L117
- Tanaka & Hotokezaka (2013) Tanaka M., Hotokezaka K., 2013, ApJ, 775, 113
- Tanaka et al. (2014) Tanaka M., Hotokezaka K., Kyutoku K., Wanajo S., Kiuchi K., Sekiguchi Y., Shibata M., 2014, ApJ, 780, 31
- Tanaka et al. (2017) Tanaka M., Utsumi Y., Mazzali P. A., Tominaga N., et al. 2017, PASJ, 69, 102
- Tanvir et al. (2013) Tanvir N. R., Levan A. J., Fruchter A. S., Hjorth J., Hounsell R. A., Wiersema K., Tunnicliffe R. L., 2013, Nature, 500, 547
- Tanvir et al. (2017) Tanvir N. R., Levan A. J., González-Fernández C., Korobkin O., Mandel I., Rosswog S., Hjorth J., et al. 2017, ApJ, 848, L27
- Tauris et al. (2013) Tauris T. M., Langer N., Moriya T. J., Podsiadlowski P., Yoon S. C., Blinnikov S. I., 2013, ApJ, 778, L23
- Tauris et al. (2015) Tauris T. M., Langer N., Podsiadlowski P., 2015, MNRAS, 451, 2123
- Tauris et al. (2017) Tauris T. M., et al., 2017, ApJ, 846, 170
- Toffano et al. (2019) Toffano M., Mapelli M., Giacobbo N., Artale M. C., Ghirlanda G., 2019, MNRAS, 489, 4622
- Toonen et al. (2012) Toonen S., Nelemans G., Portegies Zwart S., 2012, A&A, 546, A70
- Troja et al. (2017) Troja E., Piro L., van Eerten H., Wollaeger R. T., et al. 2017, Nature, 551, 71
- Voss & Tauris (2003) Voss R., Tauris T. M., 2003, MNRAS, 342, 1169
- Waxman et al. (2018) Waxman E., Ofek E. O., Kushnir D., Gal-Yam A., 2018, MNRAS, 481, 3423
- Wei & Feng (2019) Wei H., Feng M., 2019, arXiv e-prints, p. arXiv:1912.03466
- Wheeler et al. (1998) Wheeler J. C., Cowan J. J., Hillebrandt W., 1998, ApJ, 493, L101
- White & Frenk (1991) White S. D. M., Frenk C. S., 1991, ApJ, 379, 52
- Woosley & Hoffman (1992) Woosley S. E., Hoffman R. D., 1992, ApJ, 395, 202
- Yu et al. (2018) Yu Y.-W., Liu L.-D., Dai Z.-G., 2018, ApJ, 861, 114
- Yungelson (2013) Yungelson L. R., 2013, in Di Stefano R., Orio M., Moe M., eds, IAU Symposium Vol. 281, Binary Paths to Type Ia Supernovae Explosions. pp 244–247, doi:10.1017/S174392131201513X
- Zhang (2019) Zhang B., 2019, ApJ, 873, L9
- Zhang et al. (2004) Zhang F., Han Z., Li L., Hurley J. R., 2004, A&A, 415, 117
- Zhang et al. (2005) Zhang F., Han Z., Li L., Hurley J. R., 2005, MNRAS, 357, 1088
- Zhang et al. (2010) Zhang F., Han Z., Li L., Guo J., Zhang Y., 2010, Ap&SS, 329, 249
Appendix A Galaxy number density distribution in GABE
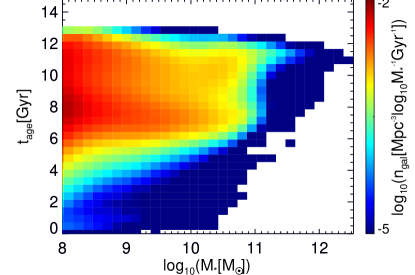
Fig. 11 presents the spacial number density distribution of all galaxies at in GABE, in a age – stellar mass plane. The distribution peaks at stellar mass and age . Benefit from the inclusion of almost all classical galactic physical processes, GABE provides us a fair complete star formation history library for the calculation of . Other properties of galaxies in GABE can be found in Jiang et al. (2019).