The QCD phase diagram and statistics friendly distributions
Abstract
The preliminary STAR data for proton cumulants for central collisions at are consistent with a two-component proton multiplicity distribution. We show that this two-component distribution is statistics friendly in that factorial cumulants of surprisingly high orders may be extracted with a relatively small number of events. As a consequence the two-component model can be tested and verified right now with the presently available STAR data from the first phase of the RHIC beam energy scan.
keywords:
QCD phase diagram , (net)-proton , fluctuations , factorial cumulants1 Introduction
One of the central question of strong interaction research is the possible existence of a first-order phase transition accompanied by a critical point. This phase transition, if it exists, is expected to be located in regions of high net-baryon density. Parts of the high density region of the QCD phase diagram is accessible to experiment through heavy ion collisions at not too high energy. Since the location of the phase transition and critical point is not known from first principle, the strategy to search for a phase transition is to scan the high density region of the phase diagram by measuring relevant observables for a whole range of collision energies. This is one of the main motivations of the RHIC beam energy scan (BES), the second phase of which (BES-II) is presently underway (for a recent review on this topic, see [2]). One of the more promising observables for the experimental detection of the QCD phase transition are fluctuations of conserved charges, most prominently those of the net-baryon number. Near the critical point (and the phase transition) these fluctuations are predicted to be enhanced [3] which would result in a non-monotonic behavior of the net baryon cumulants as a function of the collision energy. During the first phase of the RHIC beam energy scan (BES-I) the STAR collaboration has measured the cumulants of the (net)-proton distribution for a wide range of energies [4, 5]. For the most central collisions, these data show an interesting, non-monotonic behavior in the ratio of the fourth order over the second order cumulant . In addition, this ratio increases to rather large values at the lowest energy of . A further analysis of the STAR data for the lowest energies showed that they are consistent with very strong, and positive, four-proton as well as sizable, and negative, three-proton correlations, which both increase in magnitude with decreasing energy [6]. While a simple cluster model can describe the magnitude of these correlations [7] it fails to get the signs right. In [8] it was suggested that the observed correlations are consistent with a two-component or “bi-modal” proton multiplicity distribution consisting of a dominant binomial distribution with mean and another small component with strength and mean . Interestingly, such a distribution is akin to a multiplicity distribution one encounters for a sufficiently small system in the vicinity of a first order phase transition [8]. Clearly, additional measurements and analysis will be needed to verify this hypothesis. Here we will argue that this hypothesis can be tested right know with the presently available STAR data.
2 Two-component model as a statistics friendly distribution
The two-component distribution, which in Ref. [8] was found to reproduce the preliminary measurement of the proton cumulants by STAR for the most central collisions at 7.7 GeV [4], is
| (1) |
where . The distribution is given by a binomial (, ) and is a Poissonian (). The distribution is depicted as the red points in the right panel of Fig. 2. The four cumulants measured by STAR obviously do not sufficiently constrain this model, which in itself has three free parameters. However, as pointed out in [8], this distribution predicts a clear pattern for its factorial cumulants111We note that STAR uses to denote cumulants, which we denote them by .
| (2) |
or, in other words, from order to order the factorial cumulants alternate in sign and increase in magnitude by a factor of . This prediction of the two-component model can and should be tested by extracting higher order factorial cumulants from the data. And, as we shall elaborate below, if the factorial cumulants up to order 7 or 8 also agree with the model prediction it is very likely that we deal with a two-component distribution. If so, one may indeed have a system with two “phases” which can be further explored by measuring flow and other observables, as discussed in more detail in [8].
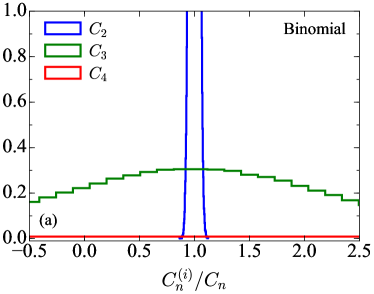
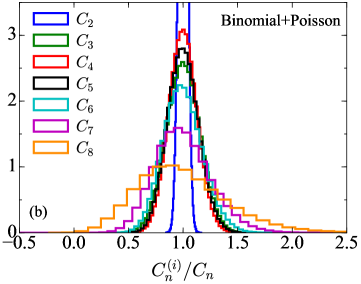
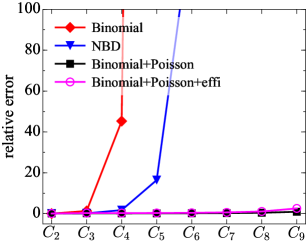
The task of extracting higher order factorial cumulants is helped considerably by the fact that the above distribution, Eq. (1), is statistics friendly [9]. By this we mean that a surprisingly small number of events is needed to extract factorial cumulants of high order. This property is due to the presence of the second component, even though it is rather small, , as we demonstrate in Fig. 1. There we show the distribution of extracted values for the factorial cumulants for “experiments” with events, approximately the number of events STAR has recorded for central collision at . The width of these distributions then give us the expected statistical error for a measurement with events. The left panel shows the distribution if we just sample a binomial distribution, i.e. the distribution , Eq. (1), without the small component, (this distribution is plotted as black dashed line in the right panel of Fig 2). The right panel of Fig. 1 shows the distribution with the small component included. Clearly, the expected statistical error is much smaller in the second case, even though we only have a very small admixture of the second component. This is more clearly seen in the left panel of Fig. 2, where we show the expected relative error for factorial cumulants up to ninth order for a binomial, negative binomial distribution as well as for the two-component distribution, Eq. (1). Also shown, in magenta (open circles), are the relative errors if we assume that the data are not efficiency corrected but still follow a two-component distribution (for details see [9]). We note that the numerically extracted statistical errors agree perfectly with those obtained from the so called delta method [10]. More precisely, the predicted values of the factorial cumulants up to eighth order are (the first four agree with the preliminary STAR data by construction):
| (3) |
for efficiency uncorrected data and
| (4) |
for efficiency corrected data. The errors quoted here are only due to the sample size and do not account for additional systematic uncertainties for example due to the efficiency corrections [10]. Also, the central values of our prediction are based on the central values of the preliminary STAR data for the proton cumulants. In other words we did not do any error propagation here.
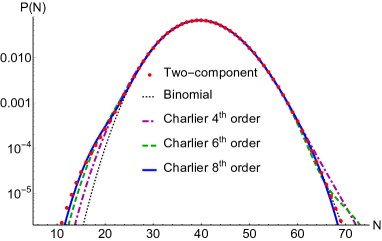
Given the small expected statistical errors, a measurement of factorial cumulants up to the eighth order should be possible if the data are efficiency corrected. If the factorial cumulants extracted from the STAR measurement agree with the above predictions, it will provide strong evidence that we are indeed dealing with a two-component multiplicity distribution.222We checked that the predicted values, Eq. (4), are practically impossible to result from a statistical fluctuation of a single binomial (or Poisson) distribution. For example, for a single binomial distribution with 150k events, the probability to obtain , , and is already about 0.04, and the probability to obtain numbers in the order of magnitude of Eq. (4) is practically zero. This can be easily understood since the absolute error of from a binomial distribution is close to [9] which is significantly smaller than the numbers quoted in Eqs. (3) and (4). This is demonstrated in the right panel of Fig. 2, where we show results of the Poisson-Charlier expansion for a probability distribution [11] at various orders. As discussed in more detail in [8], the Poisson-Charlier expansion of order generates a probability distribution based on the first factorial cumulants in such a way that it reproduces these first factorial cumulants. If we use only the first four factorial cumulants generated from the two-component distribution (which by construction agree with the STAR data), the resulting Poisson Charlier distribution (dot-dashed magenta line) does not agree with that of the two-component distribution (red points). This demonstrates that, as already pointed out, four cumulants hardly constrain a probability distribution. However, using the first six factorial cumulants (dashed green line), the Poisson-Charlier distribution is already very close. And with the first eight factorial cumulants the resulting Poisson-Charlier distribution (full blue line) is almost identical with that of the two-component model (red points). And, with the expected improved statistics from the second phase of the beam energy scan, the distribution could be constrained even further.
Of course, even if a two-component distribution is experimentally confirmed, one still needs to rule out other sources for such a distribution, such as a possible contamination of the data by events from a different centrality class etc.
3 Conclusions
In conclusion, we have shown that a two-component multiplicity distribution is statistics friendly in the sense that factorial cumulants of rather high order may be extracted even with limited statistics. This allows to test and confirm right now the hypothesis of a two-component model of Ref. [8] with the presently available statistics of the STAR measurement from BES-I. If this hypothesis is confirmed, and, if any possible experimental effects and backgrounds have been ruled out, we may actually have a first glimpse at the QCD phase transition. This can then be further tested by measuring other observables such as flow for events with small and large number of protons within the same centrality class.
4 Acknowledgements
A.B. was partially supported by the Ministry of Science and Higher Education, and by the National Science Centre, Grant No. 2018/30/Q/ST2/00101. V.K. and D.O. were supported by the U.S. Department of Energy, Office of Science, Office of Nuclear Physics, under contract number DE-AC02-05CH11231. D.O. also received support within the framework of the Beam Energy Scan Theory (BEST) Topical Collaboration. JS thanks the Samson AG and the BMBF through the ErUM-Data project for funding. The computational resources where in part provided by the LOEWE Frankfurt Center for Scientific Computing (LOEWE-CSC).
References
- [1]
- [2] A. Bzdak, S. Esumi, V. Koch, J. Liao, M. Stephanov, N. Xu, arXiv:1906.00936.
- [3] M. Stephanov, Phys.Rev.Lett. 102 (2009) 032301. arXiv:0809.3450, doi:10.1103/PhysRevLett.102.032301.
- [4] X. Luo, PoS CPOD2014 (2015) 019. arXiv:1503.02558.
- [5] J. Adam, et al., arXiv:2001.02852.
- [6] A. Bzdak, V. Koch, N. Strodthoff, Phys. Rev. C95 (5) (2017) 054906. arXiv:1607.07375, doi:10.1103/PhysRevC.95.054906.
- [7] A. Bzdak, V. Koch, V. Skokov, Eur. Phys. J. C77 (5) (2017) 288. arXiv:1612.05128, doi:10.1140/epjc/s10052-017-4847-0.
- [8] A. Bzdak, V. Koch, D. Oliinychenko, J. Steinheimer, Phys. Rev. C98 (5) (2018) 054901. arXiv:1804.04463, doi:10.1103/PhysRevC.98.054901.
- [9] A. Bzdak, V. Koch, Phys. Rev. C100 (5) (2019) 051902. arXiv:1811.04456, doi:10.1103/PhysRevC.100.051902.
- [10] X. Luo, Phys. Rev. C91 (3) (2015) 034907. arXiv:1410.3914, doi:10.1103/PhysRevC.91.034907.
- [11] K. Audenaert, arXiv:0809.4155.