The MASSIVE Survey XIV – Stellar Velocity Profiles and Kinematic Misalignments from 200 pc to 20 kpc in Massive Early-type Galaxies
Abstract
We use high spatial resolution stellar velocity maps from the Gemini GMOS integral-field spectrograph (IFS) and wide-field velocity maps from the McDonald Mitchell IFS to study the stellar velocity profiles and kinematic misalignments from pc to kpc in 20 early-type galaxies with stellar mass in the MASSIVE survey. While 80% of the galaxies have low spins () and low rotational velocities ( km s-1) in both the central region and the main body, we find a diverse range of velocity features and misalignment angles. For the 18 galaxies with measurable central kinematic axes, 10 have well aligned kinematic axis and photometric major axis, and the other 8 galaxies have misalignment angles that are distributed quite evenly from to the maximal value of . There is a strong correlation between central kinematic misalignment and galaxy spin, where all 4 galaxies with significant spins have well aligned kinematic and photometric axes, but only 43% of the low-spin galaxies are well aligned. The central and main-body kinematic axes within a galaxy are not always aligned. When the two kinematic axes are aligned (% of the cases), they are either also aligned with the photometric major axis or orthogonal to it. We find 13 galaxies to also exhibit noticeable local kinematic twists, and one galaxy to have a counter-rotating core. A diverse assembly history consisting of multiple gas-poor mergers of a variety of progenitor mass ratios and orbits is likely to be needed to account for the predominance of low spins and the wide range of central and main-body velocity features reported here for local massive ETGs.
1 Introduction
Integral field spectroscopic (IFS) surveys have made significant progress in measuring spatially-resolved kinematical properties of local early-type galaxies (ETGs) on typical scales of one effective radius, e.g., SAURON (de Zeeuw et al., 2002), ATLAS3D (Cappellari et al., 2011), SAMI (Croom et al., 2012), CALIFA (Sánchez et al., 2012), MASSIVE (Ma et al., 2014) and MaNGA (Bundy et al., 2015). An additional few wide-field IFS or multislit studies of a smaller sample of ETGs reached effective radii (e.g., Brodie et al. 2014; Raskutti et al. 2014; Edwards et al. 2016), and a few other IFS or long-slit studies specifically targeted brightest cluster galaxies (BCGs) or galaxies in dense environments (e.g., Loubser et al. 2008; Brough et al. 2011; Jimmy et al. 2013; Loubser et al. 2018; Krajnović et al. 2018).
A key result from these studies is the realization that the stellar kinematic properties of local ETGs depend strongly on the stellar mass . At , around 90% of the ETGs are fast rotators with a spin parameter above , regular velocity features, aligned kinematic and photometric axes, and intrinsic axisymmetry (e.g., Emsellem et al. 2007; Krajnovic et al. 2011; Weijmans et al. 2014; Fogarty et al. 2015; Brough et al. 2017; Foster et al. 2017). At , however, the ETGs become predominantly slow rotators with diverse kinematic features, misaligned kinematic and photometric axes, and intrinsic triaxiality (e.g., Veale et al. 2017a, b; Ene et al. 2018; Krajnović et al. 2018).
All the aforementioned IFS studies with the exception of Krajnović et al. (2018) probed galaxy kinematic properties above due to the limited spatial sampling scale of the instruments, e.g., , , and for the fiber diameter of SAMI, MaNGA, and CALIFA, respectively, and for the lenslet size of SAURON/ATLAS3D. For a subsample of 18 ETGs in the SAURON survey, McDermid et al. (2006) observed the central region using the OASIS IFS with a spatial sampling of . These lower-mass ETGs () are mainly fast rotators and many show emission lines. Their finely-resolved velocity maps revealed different types of kinematically distinct central components.
We designed the MASSIVE survey to study massive ETGs with located within 108 Mpc in the northern sky through a combination of high angular resolution and wide-field IFS and photometric observations (Ma et al., 2014). We presented the wide-field kinematics measured from IFS observations taken over a FOV in Veale et al. (2017b, a, 2018) and Ene et al. (2018). The latest MASSIVE paper (Ene et al., 2019) presented the first results from the high angular resolution part of the survey using the Gemini Multi Object Spectrograph (GMOS; Hook et al. 2004) on the Gemini North telescope. With a field of view (FOV) and spatial sampling, we obtained unprecedentedly detailed kinematic maps of the central kpc to 2 kpc regions of 20 MASSIVE galaxies. We found a prevalence of positive and rising velocity dispersion profiles towards small radii indicative of central black holes and velocity dispersion anisotropy at the center of these massive ETGs.
This paper is the second of the high-resolution MASSIVE papers in which we focus on the velocity profiles and kinematic axes of the same 20 MASSIVE galaxies as in Ene et al. (2019). We use the kinemetry method of Krajnović et al. (2006) to measure the misalignment between the kinematic axis and the photometric major axis and quantify substructures found in the velocity maps such as kinematic twists or kinematically distinct components.
The paper is structured as follows. In Section 2 we describe the galaxy sample and IFS observations. In Section 3 we explain how we derive the main kinematic properties such as the average and local kinematic position angles and the misalignment angles. Section 4 presents results for the velocity amplitudes and kinematic axes in both the central regions and the main bodies of the sample galaxies and examines the misalignments of the central kinematic axis, the main-body kinematic axis, and the photometric major axis. We analyze the local radially-dependent kinematic features in Section 5 and discuss six galaxies with distinctive kinematic features in Section 6. In Section 7 we discuss the assembly pathways for local massive ETGs in the broader context of numerical simulations. Section 8 summarizes our findings.
2 Observations and Data
In this paper we study the detailed velocity features of the central kpc of 20 galaxies in the MASSIVE survey (Ma et al., 2014). The list of 20 galaxies and their properties are given in Table 1. The galaxies are located between 54 Mpc and 102 Mpc distance (with a median distance of 70 Mpc) and all have stellar masses above . The individual distances and -band absolute magnitudes are listed in columns 2 and 3 of Table 1. Here we provide a brief description of the observations and data reduction procedures; an in-depth discussion is given in Ene et al. (2019).
2.1 High-angular resolution IFS observations
We observe the central region of each galaxy with the GMOS IFS on the 8.1 m Gemini North telescope. Each galaxy is observed multiple times in order to meet a minimum signal-to-noise ratio (S/N). The total exposure times range from 1 to 6 hrs, with most galaxies being observed for 3 hrs, on average. Each science exposure provides one spectrum per lenslet for each of the 1000 lenslets of spatial resolution. An additional 500 lenslets observe an empty sky field with a field of view (FOV) that is offset by from the science field. The spectra are in the wavelength range 7800 – 9330 Å and have an average spectral resolution of 2.5 Å full width at half maximum (FWHM).
We follow the standard GMOS data reduction procedure using the Gemini package within the image reduction and analysis facility (IRAF) software to obtain wavelength-calibrated and sky-subtracted one-dimensional spectra for each spatial position on the galaxy. We implement custom built routines to extract and combine the spectra from multiple exposures and spatially bin the data to S/N using the Voronoi binning routine of Cappellari & Copin (2003). The binning process generates between 50 and 300 spatial bins, depending on the galaxy, with an average of bins per galaxy.
We use the penalized pixel-fitting (pPXF) routine of Cappellari & Emsellem (2004) to measure the stellar LOSVD. This method convolves the observed galaxy spectrum with a set of stellar templates to obtain the best-fitting LOSVD which is modelled as a Gauss-Hermite series of order (Gerhard 1993; van der Marel & Franx 1993):
| (1) |
2.2 Wide-field IFS observations
The wide-field IFS data for 90 MASSIVE galaxies (which includes the 20 GMOS galaxies) are presented in Veale et al. (2017b, a). The observations were taken with the Mitchell/VIRUS-P IFU at the 2.7-m Harlam J. Smith Telescope at McDonald Observatory, which has a FOV of and a spatial sampling of . The spectra cover the wavelength range 3650 – 5850 Å with 5 Å FWHM average spectral resolution. Full details of the observing strategy and data reduction procedure are given in Ma et al. (2014) and Veale et al. (2017b). While Veale et al. (2017b) present ’folded’ maps of the kinematic moments (i.e in order to increase S/N the spectra are folded across the major photometric axis prior to binning), in Ene et al. (2018) we used the Mitchell IFS data to generate ’unfolded’ maps of the LOSVD moments. We then ran kinemetry on the unfolded velocity maps to measure the misalignment between the large scale () kinematics and photometry and presented radial profiles for several kinemetry coefficients.
2.3 Photometric data
We measured the surface brightness profiles and isophotal properties for a sample of 35 MASSIVE galaxies using observations taken with the Infrared Channel of the HST Wide Field Camera 3 (WFC3) in Goullaud et al. (2018). For 18 of the 20 galaxies studied here, we use the average photometric position angle, PAphot, determined in that work; the values and formal uncertainties are quoted in column 9 of Table 1. The galaxies NGC 2340 and NGC 4874 were not targeted by our program because they have archival HST observations. For these two galaxies, we use the PAphot values from the Two Micron All Sky Survey (2MASS; Skrutskie et al. 2006) catalogue for NGC 2340 and from the NASA-Sloan Atlas (NSA; York et al. 2000; Aihara et al. 2011) for NGC 4874. Neither catalogue provides uncertainties for the photometric PA, so we assume a fiducial error of .
Most galaxies in our sample show fairly regular photometric profiles where the isophotal position angle changes by less than across the radial extent of the WFC3 data (from kpc to kpc). A handful of galaxies have more complex photometric profiles, usually showing more pronounced isophotal twists of greater than . Among these galaxies, NGC 1129 has the most interesting photometric profile. Goullaud et al. (2018) report the luminosity-weighted average photometric PA (computed using all available isophotes) to be , but the detailed radial profile shows two distinct regions of constant PA: an inner component within with PA and an outer region with PA . In order to provide a fair comparison with the GMOS kinematics, we report PAphot using only isophotes corresponding to the inner component within .
We also report the half-light radius measured from deep K-band photometric data taken with WIRCam on the Canada-France-Hawaii Telescope (CFHT) as part of the MASSIVE survey (M. E. Quenneville et al., in preparation). The effective radius is measured using the photometry package ARCHANGEL (Schombert, 2007) which fits elliptical isophotes to the stacked image of each galaxy. The aperture luminosity for each isophote (as a function of radius) is used to construct a curve of growth. The total luminosity and half-light radius are then measured from the curve of growth. The values of for our sample of 20 galaxies are given in column 4 of Table 1. They range from to kpc, with the average being kpc.
3 Kinemetry Analysis
To analyze the velocity maps of our sample galaxies we use the kinemetry111http://davor.krajnovic.org/idl/ method (Krajnović et al., 2006). In the following sections we describe how we apply this method to measure global (Section 3.1) and local (Section 3.2) kinematic parameters.
| Galaxy | PA | PA | PAphot | Env | ||||||||
|---|---|---|---|---|---|---|---|---|---|---|---|---|
| [Mpc] | [mag] | [kpc] | [deg] | [deg] | [deg] | [deg] | [km s-1] | [km s-1] | ||||
| NGC0057 | 76.3 | 6.31 | 0.025 | 0.028 | 100 22 | – | 40.2 0.5 | 59.3 22.0 | 9 | 10 | I | |
| NGC0315 | 70.3 | 9.20 | 0.027 | 0.063 | 218 13 | 222 7 | 44.3 0.2 | 6.3 13.3 | 23 | 44 | B | |
| NGC0410 | 71.3 | 7.57 | 0.052 | 0.048 | 211 9 | 161 19 | 35.8 0.9 | 4.8 9.3 | 29 | 19 | B | |
| NGC0545 | 74.0 | 9.71 | 0.034 | 0.081 | 287 17 | – | 57.2 0.7 | 49.8 17.3 | 13 | 11 | B | |
| NGC0547 | 71.3 | 10.55 | 0.024 | 0.081 | 254 31 | – | 98.8 1.4 | 24.8 31.0 | 9 | 30 | S | |
| NGC0741 | 73.9 | 9.74 | 0.037 | 0.050 | 202 16 | – | 88.0 1.1 | 66.5 16.3 | 15 | 12 | B | |
| NGC0777 | 72.2 | 5.89 | 0.027 | 0.060 | 311 22 | 8 10 | 148.6 0.8 | 18.1 21.5 | 12 | 41 | B | |
| NGC0890 | 55.6 | 6.62 | 0.027 | 0.014 | 159 42 | 101 9 | 53.7 0.3 | 74.6 42.3 | 9 | 46 | I | |
| NGC1016 | 95.2 | 9.47 | 0.015 | 0.040 | – | 262 20 | 42.8 1.0 | – | 7 | 30 | B | |
| NGC1060 | 67.4 | 6.38 | 0.034 | 0.048 | 351 10 | 342 14 | 74.8 0.4 | 83.8 10.0 | 25 | 15 | B | |
| NGC1129 | 73.9 | 16.13 | 0.350 | 0.124 | 185 1 | 179 6 | 7.7 † 0.5 | 3.2 1.1 | 148 | 66 | B | |
| NGC1453 | 56.4 | 6.00 | 0.199 | 0.204 | 25 3 | 35 3 | 30.1 0.2 | 5.1 3.3 | 99 | 92 | B | |
| NGC1573 | 65.0 | 5.43 | 0.026 | 0.056 | 181 53 | 190 19 | 31.7 0.1 | 31.2 53.3 | 7 | 26 | B | |
| NGC1600 | 63.8 | 9.14 | 0.045 | 0.035 | 18 4 | – | 8.8 0.1 | 8.7 4.3 | 18 | 22 | B | |
| NGC1700 | 54.4 | 4.45 | 0.119 | 0.198 | 87 2 | 268 2 | 90.6 0.3 | 3.6 1.8 | 51 | 115 | B | |
| NGC2258 | 59.0 | 5.76 | 0.034 | 0.071 | 74 9 | 71 17 | 150.8 1.2 | 77.3 8.6 | 19 | 31 | B | |
| NGC2274 | 73.8 | 6.57 | 0.042 | 0.073 | 231 7 | 288 26 | 165.0 0.2 | 66.0 7.0 | 21 | 26 | B | |
| NGC2340 | 89.4 | 14.27 | 0.042 | 0.032 | 53 6 | – | 80.0 5.0 | 27.0 7.6 | 18 | 12 | S | |
| NGC2693 | 74.4 | 5.63 | 0.337 | 0.294 | 172 1 | 169 2 | 161.3 1.3 | 10.7 1.8 | 157 | 144 | I | |
| NGC4874 | 102.0 | 19.20 | 0.018 | 0.072 | – | 335 6 | 40.6 5.0 | – | 9 | 40 | S |
Note. — (1) Galaxy name. (2) Distance from Paper I (Ma et al., 2014). (3) Absolute -band magnitude from Paper I (Ma et al., 2014). (4) Effective radius from CFHT deep K-band photometry (M. E. Quenneville et al., in preparation). (5) Spin parameter within 1 kpc measured from GMOS IFS data reported in Paper XIII (Ene et al., 2019). (6) Spin parameter within one effective radius measured from Mitchell IFS data reported in Paper X (Ene et al., 2018). (7) Kinematic position angle (measured E of N to the receding part) within the FOV of the GMOS IFS. See Section 3.1 for details. (8) Kinematic position angle (measured E of N to the receding part) within the FOV of the Mitchell IFS reported in Paper X (Ene et al., 2018). See Section 3.1 for details. (9) Luminosity-weighted average photometric position angle from Paper IX (Goullaud et al., 2018). † The photometric PA for NGC 1129 shows a prominent twist beyond ; the quoted value here is measured within . See Fig. 7 and Sections 2.3 and 6.3 for details. The photometric PAs for NGC 2340 and NGC 4874 are taken from 2MASS and NSA, respectively. (10) Misalignment angle between GMOS kinematic axis and the photometric major axis. See Section 3.1 for details. (11) Maximum value of the velocity coefficient measured within the GMOS FOV ( kpc). (12) Maximum value of the velocity coefficient measured within the Mitchell FOV (). (13) Galaxy environmental types according to the 2MASS group catalog from Paper I (Ma et al., 2014): B for brightest group or cluster galaxy; S for satellites; I for isolated galaxies.
3.1 Global kinematic position angle
To identify any coherent kinematic structure in the GMOS velocity maps, we measure the global kinematic position angle, PA, using the fit_kinematic_pa222http://www-astro.physics.ox.ac.uk/mxc/software/ routine described in Appendix C of Krajnović et al. (2006). Briefly, the routine generates a bi-antisymmetric model velocity map for each possible value of kinematic position angle and compares it to the observed velocity map. The reported PAkin corresponds to the best-fitting model that minimizes the between the observed and model velocity maps. The routine also assigns error estimates to the best-fit PAkin as the range of angles for which , which corresponds to the confidence level for one parameter. The reported error bars anti-correlate with the amount of organized rotation: in cases with strong rotation, the error bars are very tight, while for cases with little or no organized rotation, the error bars approach .
The global kinematic position angle PA thus gives the average direction of rotation in the central few kpc of each galaxy. It is measured counterclockwise from north to the receding part of the galaxy within the GMOS FOV. The determination of PA enables us to measure the relative alignment angle between the GMOS kinematic axis and the photometric axis, following the convention of Franx et al. (1991):
| (2) |
The error bars on are computed as the quadrature sum of the errors on and . Our measurements of and are tabulated in Table 1 and discussed in Section 4.2.
3.2 Spatially-resolved velocity profiles
We measure the local kinematic features in the GMOS velocity maps using the kinemetry method of Krajnović et al. (2006). Kinemetry is an extension of isophotal analysis which models the maps of LOSVD moments as simple functional forms along ellipses: a constant for symmetric (even) moments and a cosine term for antisymmetric (odd) moments. In particular, kinemetry uses Fourier decomposition to model the velocity profile along an ellipse as the sum of harmonic terms:
| (3) |
where is the length of the semi-major axis of the ellipse, is the eccentric anomaly, is related to the systemic velocity of the galaxy, and and are the amplitude and phase coefficients, respectively. The leading term represents the amplitude of the rotational motion. The coefficient represents higher-order deviations from the simple cosine law assumption, where a high value indicates the presence of multiple kinematic components.
The main outputs of the kinemetry code are the kinematic coefficients , and two geometry coefficients that specify the local position angle and the flattening of the best-fitting ellipses along which velocity extraction was performed ( corresponds to velocity extraction along circles). The code determines these parameters in two steps. In the first step, a kinematic profile is extracted at each radius for each value of (, ) chosen from a finely-sampled grid. The best-fitting and are the ones found to minimize . Then, in the second step, the kinematic coefficients are computed through Fourier decomposition along the ellipse given by the best-fitting and of the previous step.
For our sample, we first let kinemetry perform velocity extraction along best-fitting ellipses. This is well suited for the handful of galaxies with high velocity gradients within the GMOS FOV: NGC 1129, NGC 1453, NGC 1700, and NGC 2693. Applying kinemetry to galaxies that rotate much slowly (the majority of our sample), however, is more complicated since the low velocity gradients introduce significant degeneracies between the position angle and flattening parameters. In order to reduce the degeneracy in such cases, we opt to rerun kinemetry along best-fitting circles (i.e., setting ).
4 Central and Main-body Rotation
The finely-resolved GMOS velocity map of the central few kpc for each of the 20 MASSIVE galaxies is shown in Figure 1. Below we discuss the amplitudes and axes of the detected rotations and analyze how the kinematic axis in the central region of each galaxy is oriented relative to its photometric major axis and its main-body rotation measured within an effective radius ( kpc).
4.1 Amplitude of rotation
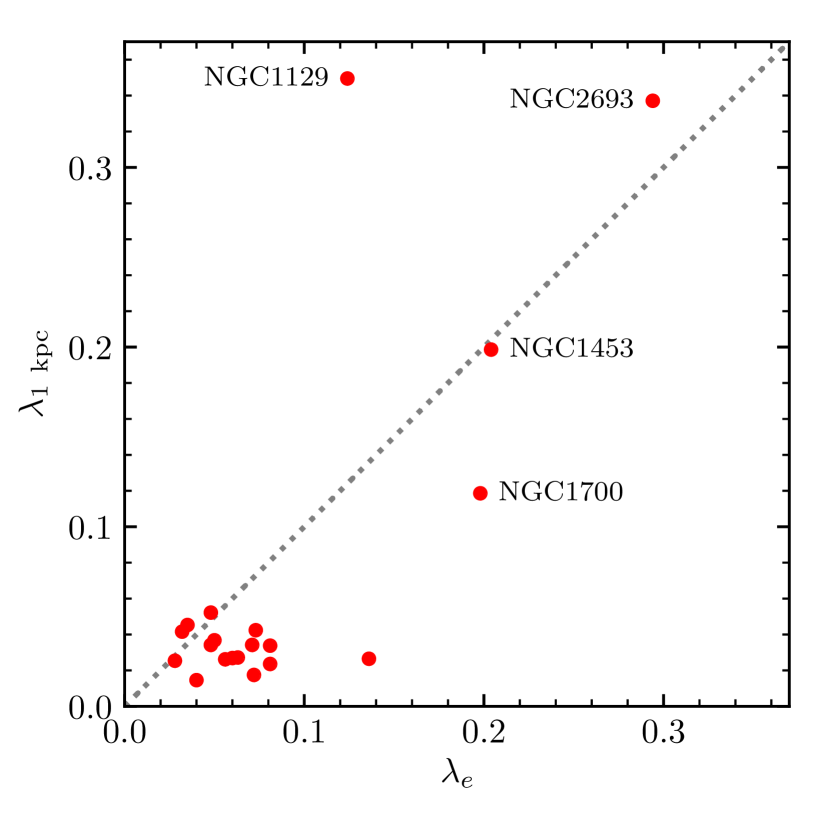
As a measure of the importance of rotation compared to velocity dispersion in each galaxy, we determine the spin parameter within a circular aperture of radius , defined as . The brackets denote luminosity-weighted average quantities. The spin parameters measured within 1 kpc from our GMOS data, , are listed in column 5 of Table 1 and plotted in the left panel of Figure 2. These values are compared to the main-body spins measured within one effective radius, , from our Mitchell IFS data (Ene et al. 2018; column 6 of Table 1).
All but four galaxies have low central spins as well as low main-body spins. Our earlier analysis of the main-body rotation in 370 galaxies in the MASSIVE and ATLAS3D surveys found a strong dependence of on stellar mass, where the mean declines from at to below 0.1 at (Veale et al., 2017a). Figure 2 shows that the low spin continues to the core in the majority of ETGs in the high mass regime.
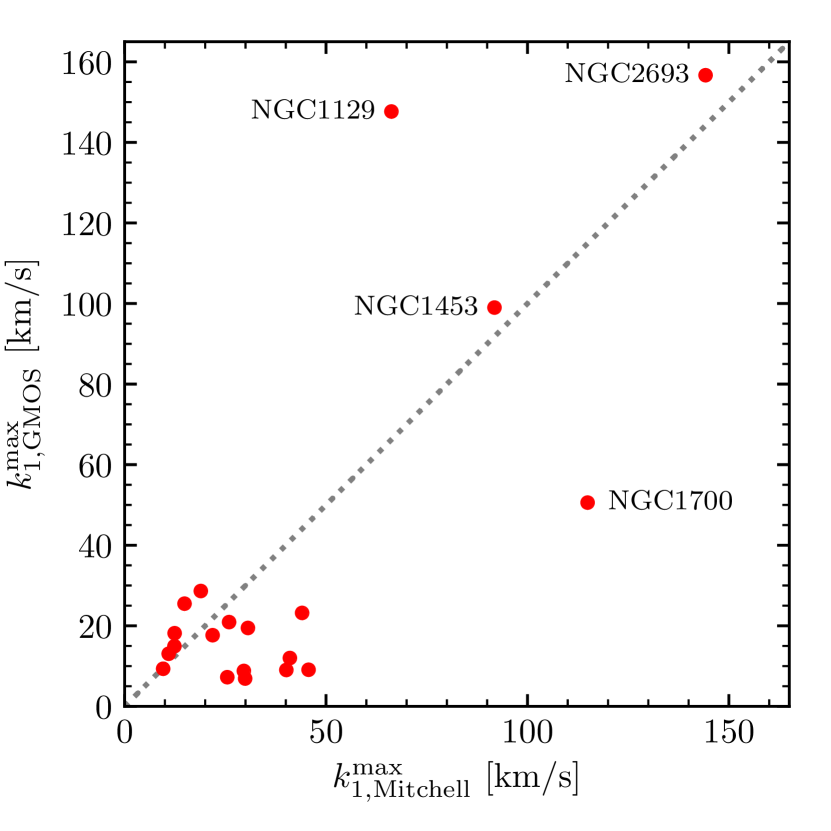
As another measure of rotation, the right panel of Figure 2 shows the maximum value of the velocity coefficient defined in Eq. (3). The individual values of and are listed in columns 11 and 12 of Table 1, respectively. The results are very similar to those in the left panel of Figure 2, where the same 16 galaxies with spins below also have km s-1 over the entire radial range of kpc to 20 kpc covered by our IFS data.
The four highlighted galaxies in Figure 2 have significantly higher spin and peak velocity than the rest of the sample. However, only two of them – NGC 1453 and NGC 2693 – lie along the diagonal in Figure 2 and are regular fast rotators in which the central part co-rotates with the main body of the galaxy. The other two galaxies – NGC 1129 and NGC 1700 – are unusual and have different central and main-body rotations. As we will discuss further in Section 6, the central region of NGC 1700 rotates in exactly the opposite direction as the main body, while the photometric PA in the central part of NGC 1129 twists by a striking relative to the main body.
4.2 Axis of rotation: kinematic versus photometric PA
For 18 of the 20 galaxies in the sample,333For two galaxies, NGC 1016 and NGC 4874, the algorithm could not find a well-defined kinematic axis, i.e., the errors on PA are . we are able to identify a kinematic axis for the stellar rotation within the GMOS FOV using the algorithm described in Section 3.1. The detected kinematic axes are represented by green lines in the GMOS velocity maps in Figure 1. The photometric major axis for each galaxy is overplotted for comparison (black line). Our measured values for the central kinematic PA , photometric PA and the misalignment angle (defined in Eq. 2) are given in columns 7, 9 and 10 in Table 1, respectively.
For NGC 1016 and NGC 4874, we do not detect any rotation in the GMOS maps shown in the bottom panel of Figure. 1.
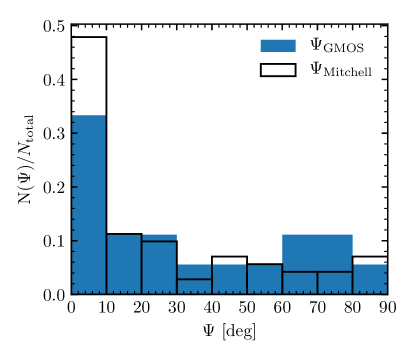
The distribution of the misalignment angle is plotted in Figure 3. It peaks at small values that corresponds to the standard scenario in which the galaxy rotates around its minor axis, i.e., the kinematic axis is aligned with the photometric major axis. The distribution has a long and relatively flat tail extending to the maximum misalignment of , which corresponds to rotation around the major axis sometimes referred to as “minor-axis rotation” or “prolate-like rotation”. We classify as aligned rotators the 10 galaxies (56% of the sample) that either have , or have but PA and PAphot agreeing within the (large) errors on the kinematic axis. We classify the other 8 galaxies as misaligned rotators.
We note that even though NGC 1573 is classified as “aligned”, it is a borderline case. The GMOS kinematic map shows interesting velocity structures in the inner (Fig. 1) and significant local kinematic twists (Fig. 6 below), resulting in large errors in the luminosity-averaged within the GMOS FOV. Further discussion is given in Sec. 5.2.
We have previously used a similar procedure to determine the misalignment angle between the main-body kinematic axis and the photometric major axis from the wide-field Mitchell data for 90 MASSIVE galaxies (Ene et al., 2018). The distribution of this main-body misalignment angle, , is plotted in Figure 3 for comparison. We note that while the Mitchell sample size is much larger than the GMOS sample, the shapes of the and distributions are qualitatively very similar. The larger peak at small misalignment angle in the Mitchell data is primarily driven by the presence of a larger fraction of fast rotators: 22 of the 71 galaxies with measurable Mitchell kinematic axis are fast rotators (defined to have ) in Ene et al. (2018), versus 3 fast rotators in the current sample of 18 galaxies with measurable GMOS kinematic axis.
Neither of our misalignment angle distributions shows a gap in the intermediate range of as seen in the MUSE sample of 25 massive ETGs in dense environments (Krajnović et al., 2018). Furthermore, more than 1/3 of their galaxies show prolate-like rotations (), while prolate-like rotators constitute only 20% of our GMOS sample and 10% of our Mitchell sample. These differences could be due to small-number statistics as well as differing galaxy environments for the two samples. The MUSE sample specifically targets ETGs in dense clusters and superclusters, whereas the MASSIVE sample is selected purely by and spans a wide range of galaxy environments, from brightest cluster galaxies to nearly isolated massive ETGs (Veale et al., 2017a, b). For the subsample of 20 galaxies studied here, the environmental types according to the 2MASS group catalog are given in column 13 of Table 1: 14 are brightest group or cluster galaxies, 3 are satellites in their respective groups, and 3 do not have neighbors. It would be very interesting to further assess the role of environments on kinematic misalignments with a larger sample of massive ETGs.
In Ene et al. (2018) we found a strong correlation between the main-body kinematic misalignment and spin parameter in MASSIVE galaxies: 91% of the fast rotators are aligned, whereas only 43% of the slow rotators are aligned with below . Despite the smaller sample here, we find a very similar trend for the central kinematics: all four galaxies with high central spins (Fig. 2) are very well aligned, while only 43% of the low-spin galaxies are aligned (Fig. 1(a)). Previous kinematic studies of lower mass ETGs were focused on main-body misalignment on scales of an effective radius and found similar trends: 83% of the 62 fast rotators and 38% of the 16 slow rotators are aligned in the SAMI survey (Fogarty et al., 2015), while 96% of the 224 fast rotators and 56% of the 36 slow rotators are aligned in the ATLAS3d survey (Krajnovic et al., 2011). Very few galaxies in these surveys, however, are in the high range probed by the MASSIVE survey.
In Ene et al. (2018) we used the observed main-body misalignment and ellipticity distributions to infer the intrinsic shape distribution of the MASSIVE slow rotators, which was found to be mildly triaxial with mean axis ratios of and . A larger sample than the current 20 GMOS galaxies would be needed to perform a similar statistical analysis to infer the intrinsic shape distribution in the central kpc region of the galaxies.
4.3 Axis of rotation: central versus main-body kinematic PA
In the previous two subsections we studied how the kinematic axes are aligned with the photometric axes. Here we examine the alignment between the central and main-body kinematic axes for the 12 galaxies that have sufficient rotations for the kinematic PAs to be determined in both GMOS and Mitchell observations (see Table 1).
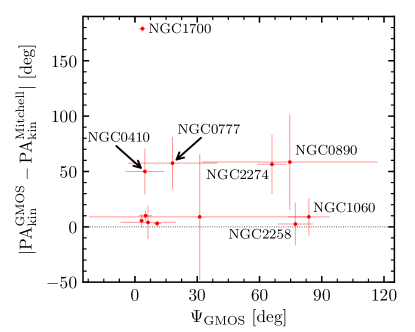
Figure 4 shows the difference in the two kinematic PAs as a function of the central misalignment angle . Overall, we find the central and main-body kinematic axes to be very well aligned in 7 of the 12 galaxies (). It is interesting to note, however, that only 5 of these galaxies also have aligned kinematic and photometric axes with small (i.e., lower-left corner of Fig, 4). These 5 objects (NGC 315, NGC 1129, NGC 1453, NGC 1573, and NGC 2693) are the most aligned galaxies in our sample and show regular (albeit frequently slow) rotation about the minor photometric axis, as is seen for a large fraction of lower-mass early-type galaxies and disk galaxies. The other two galaxies, NGC 1060 and NGC 2258, have aligned central and main-body kinematic axes, but both are misaligned from the photometric major axis, and the misalignment is near orthogonal (see Table 1 and Fig. 1). We will discuss these “minor-axis rotation” galaxies further in Sec. 6.1.
For the 5 of the 12 galaxies that have noticeably misaligned central and main-body kinematic axes in Figure 4 (), it is also interesting to ask whether either kinematic axis is aligned with the galaxy’s photometric axis. We again find diverse behaviors even within this small sample. For two galaxies (NGC 410 and NGC 777), the central kinematic axis is well aligned with the photometric axis, but the main-body kinematic axis is not. Both galaxies have very regular isophotes with nearly constant photometric PA out to in our HST WFC3 images (Figs. 8 and 16 of Goullaud et al. 2018). It is therefore the main-body rotation that show an intermediate-angle () misalignment. For two other galaxies (NGC 890 and NGC 2274), the three axes are all pointing in different directions. This implies at least some level of intrinsic triaxiality since it is unlikely to have observed kinematic misalignment between all three axes that is due solely to projection effects.
The last galaxy, NGC 1700, is a special case in which the inner kpc is a kinematically distinct component that is counter-rotating with respect to the main body of the galaxy (Ene et al., 2019). We will discuss NGC 1700 further below.
5 Local Kinematic Profiles
The kinematic PA presented in Section 4 quantifies the average orientation of stellar rotation measured within an aperture. The finely-resolved velocity maps from our GMOS IFS observations (Figure 1), however, often show intricate structures and contain more information than a single PA value. In this section we investigate these local features and analyze how the velocity (Section 5.1) and kinematic axis (Section 5.2) vary as a function of radius.
5.1 Velocity profiles
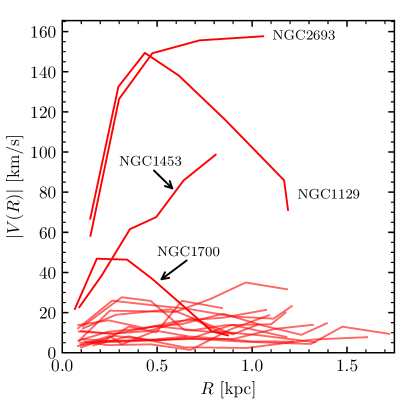
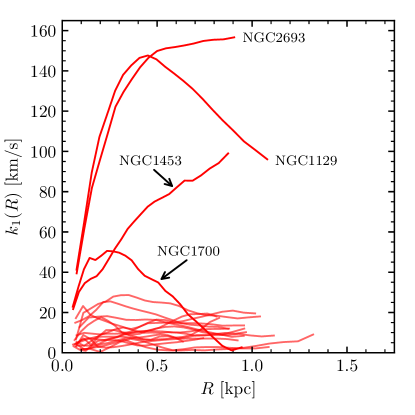
The top panel of Figure 5 shows the velocity profiles along the kinematic axis measured from the GMOS data. All but four galaxies rotate slowly (if at all) with km s-1, which is consistent with the results in Sec. 4.1. For comparison, the radial profile of the coefficient defined in Eq. (3) from the kinemetry analysis is shown in the bottom panel of Figure 5, where traces the velocity along the radially changing kinematic position angle . For galaxies with nearly constant profiles, and are nearly indistinguishable (the four labeled profiles). For the remaining galaxies with more complex velocity maps, there are subtle differences in the two profiles mainly because follows the velocity along a kinematic axis that can twist significantly with radius.
5.2 Kinematic position angle profiles
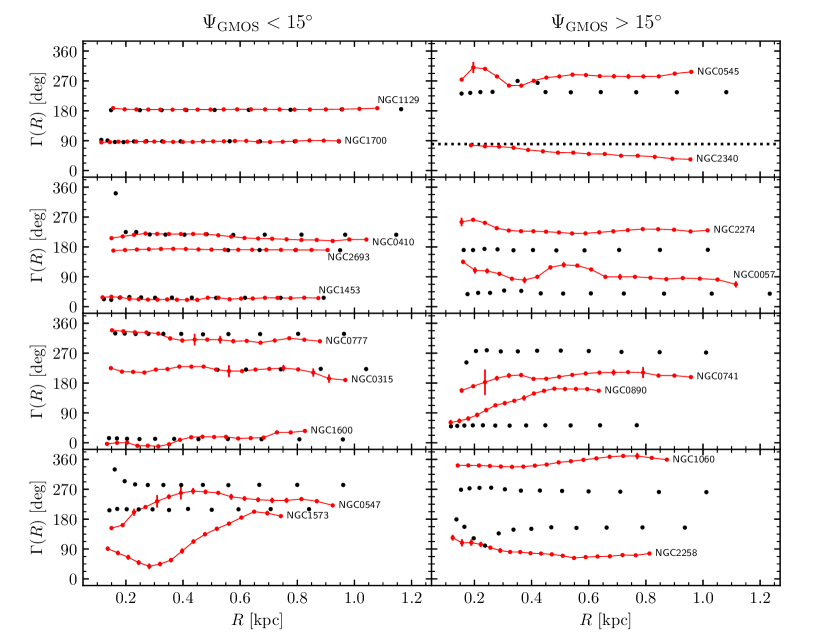
Figure 6 shows the local kinematic PA angle, , from the kinemetry analysis (Section 3.2) for the 18 galaxies with measurable GMOS rotation. The local photometric PA (black dots) determined from our HST WFC3 observations is also shown. Overall, we find that 5 out of 18 galaxies exhibit regular rotation across the GMOS FOV, while the remaining 13 show kinematic twists relative to the photometric axis to various extents.
The 10 galaxies classified as aligned rotators are shown in the left panels of Figure 6. Four of the five galaxies shown in the two top panels (NGC 1129, NGC 1453, NGC 1700, and NGC 2693) exhibit very regular profiles and tight alignment with the local photometry within the central kpc. The fifth galaxy, NGC 410, also shows regular rotation with varying by less than and the departure from the photometric profile is small, but more noticeable than in the previous cases. For the next three galaxies (NGC 315, NGC 777, NGC 1600), the kinematic axis twists by moderate amounts () around the photometric axis. On average, however, the kinematic axis is still aligned with the photometric axis.
The bottom panel shows the two aligned galaxies (NGC 547 and NGC 1573) where PA and PAphot agree within the large errors on the kinematic axis. Both galaxies show significant twisting in the kinematic axis of , and is misaligned from the local photometric axis for most of the radial extent. The amplitude of the detected rotation, however, is mostly below 10 km s-1. In the case of NGC 1573, we find a marginal drop in from km s-1 to 4 km s-1 around 0.5 kpc where shows strong twists. This is indicative of a KDC, but higher-resolution spectra would be needed to confirm it.
The remaining 8 galaxies have more complex GMOS velocity maps, where the kinematic axis twists with radius and the rotation is generally misaligned with the local photometric axis, as shown in the right panels of Figure 6. The majority show moderate kinematic twists of , with only NGC 57 and NGC 890 showing extreme twists of or larger. As mentioned earlier, such large twists in likely arise due to the very low velocities: is less than 9 km s-1 for both galaxies.
The detailed profiles show that massive ETGs often exhibit complex features in their velocity maps. These complex features are not fully captured by the simpler aligned/misaligned classification based on global kinematic properties (Section 4.2), as revealed by the fact that half of the aligned galaxies (left panel of Figure 6) actually show noticeable twists in the kinematic axis and deviations from the local photometric profile.
6 Distinct Kinematic Features
In this section we highlight six galaxies in the GMOS sample with distinct central kinematic features that indicate unusual assembly histories in their past. Four of them exhibit rotation around the photometric major axis rather than the typical minor axis. Two galaxies have distinct central versus main-body kinematic and photometric features. We discuss each of them here.
6.1 Minor-axis rotations
As Figure 1(b) and Figure 6 show, four galaxies in our sample – NGC 741, NGC 890, NGC 1060 and NGC 2258 – have central kinematic axis that is nearly orthogonal to the photometric major axis (with ). Furthermore, Figure 4 shows that NGC 1060 and NGC 2258 have aligned inner and outer kinematic axes; these two galaxies as a whole are therefore rotating along their respective photometric minor axes. Such cases where the rotation is primarily around the photometric major axis (equivalently along the photometric minor axis) are sometimes said to be exhibiting “minor-axis” or “prolate-like” rotation (e.g. Schechter & Gunn 1979; Davies & Birkinshaw 1986, 1988; Franx et al. 1989; Jedrzejewski & Schechter 1989).
Several recent studies have found that a significant fraction of massive ETGs show minor-axis rotation. In Ene et al. (2018) we find that 11 of 90 MASSIVE galaxies (%) with exhibit minor-axis rotation with and 7 galaxies with on scales of kpc. Tsatsi et al. (2017) identified minor-axis rotation in 8 massive galaxies from the CALIFA survey (Walcher et al., 2014). In their case, the minor-axis rotation occurs either in a kinematically distinct central component or in the galaxy as a whole. They find that among massive ETGs, minor-axis rotation is present in % of CALIFA galaxies and % of ATLAS3D galaxies with . For galaxies more massive than , Krajnović et al. (2018) find that 44% of their 25 MUSE galaxies show significant rotation around the photometric major axis. A detailed analysis of 900 simulated ETGs in the Magneticum cosmological simulations (box size 68 Mpc; force softening kpc) finds about 20 galaxies in the mass range of the MASSIVE survey; among them, 3 are classified as prolate rotators (Fig. B1 of Schulze et al. 2018). Within the small number statistics, this result is in line with our survey result for main-body kinematics. Simulations with better force softening would be needed to study the finer kinematic features observed in our GMOS data.
6.2 NGC 1700: counter-rotating core
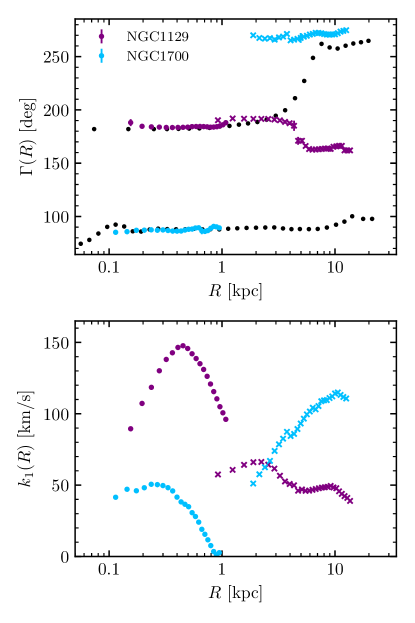
As seen in Figures 1(a) and 7 (top panel), both the inner (blue dots) and outer (blue crosses) kinematic axes of NGC 1700 are well aligned with its photometric major axis (black dots). All three axes show little radial variations except for an abrupt reversal in the rotational direction at kpc. The two distinct kinematic components are also clearly seen in the velocity amplitude profile, , in the bottom panel of Figure 7, where reaches a local maximum of km s-1 at kpc before dropping to zero at kpc. It then smoothly increases to km s-1 at kpc.
The counter-rotating core in NGC 1700 was not seen in our previous kinemetry analysis of the Mitchell observations (Ene et al., 2018) because this core region ( kpc or in radius) is below the resolution scale of the Mitchell IFS. Franx et al. (1989) saw a hint of a distinct core in NGC 1700 as the innermost two velocity points in their long-slit data changed signs, but they cautioned that the results “need confirmation.” This confirmation is now provided by our finely-resolved velocity map for 1700, which shows a striking and unambiguous counter-rotating core.
The distinct kinematic core of NGC 1700 also has a distinct younger stellar population compared to the main body, suggesting that NGC 1700 is a product of a minor merger between the main galaxy and a small companion galaxy on a retrograde orbit (Kleineberg et al., 2011). Our velocity dispersion map of NGC 1700 shows a single peak at the center (Fig. 23, Ene et al. 2019). It therefore is not a so-called 2 galaxy seen in a handful of lower-mass S0 galaxies (e.g., Krajnovic et al. 2011), which may have formed from a single major merger of two disk galaxies or via gas accretion (e.g., Crocker et al. 2009; Bois et al. 2011; Katkov et al. 2016; Pizzella et al. 2018).
6.3 NGC 1129
For NGC 1129, Figure 7 (top panel) shows that the local kinematic axis, , measured from our GMOS (magenta circles) and Mitchell (magenta crosses) data agrees well with each other in the inner kpc, and it shows little radial variations and is well aligned with the photometric major axis (upper black dots) in this region. The accompanying profile shows a strong velocity peak of km s-1 at kpc (bottom panel of Figure 7). Altogether, the inner few kpc of NGC 1129 resembles that of a typical fast regular rotator without any misalignment.
Between kpc and 8 kpc, however, the photometric PA of NGC 1129 shows a striking twist, which was first reported in our HST-WFC3 study (Goullaud et al., 2018). This transitional region was shown to be an inflection point in the ellipticity radial profile, which led us to suggest that NGC 1129 has recently undergone a major merger event. Now our kinemetry results give further support to this claim, as the top panel of Figure 7 shows that the kinematic axis (magenta crosses) also changes at kpc, albeit with a smaller amplitude of .
7 Discussion
The diversity in the spatial variations of stellar velocity features and in the degree of misalignment between kinematics and photometry found in this study suggests diverse assembly histories for the present-day massive ETGs. Comparison with results predicted by numerical simulations often offer insight into the details of galaxy merger histories.
For kinematic features, galaxy merger simulations find that gas-rich major mergers of disc galaxies typically result in axisymmetric oblate elliptical galaxies with little kinematic misalignment, while gas-poor major mergers preferentially produce triaxial or prolate shaped elliptical galaxies that show a wide distribution in the kinematic misalignment angle (e.g., Naab & Burkert 2003; Cox et al. 2006; Naab et al. 2014; Jesseit et al. 2009; Moody et al. 2014; Yang et al. 2019). These predictions are in broad agreement with our observational results that the distributions of both the central and main-body kinematic misalignment angles peak at small values and extend all the way up to maximal misalignment.
The observed distributions of kinematic misalignment and ellipticity can be used to infer the distribution of the intrinsic shapes of the galaxies. Our main-body data are found to be consistent with a population of mildly triaxial galaxies on average (Ene et al., 2018), but galaxy to galaxy variations are expected within the population of massive ETGs. Furthermore, numerical simulations find that higher mass galaxies are more likely to be intrinsically prolate and that prolate galaxies often show minor-axis rotation (Ebrova & Lokas, 2017; Li et al., 2018). We find 20% of the sample galaxies to exhibit significant minor-axis rotation in the central kpc, and previously we find 11 of the 90 MASSIVE galaxies to show minor-axis rotation out to (Ene et al., 2018). We note that while minor-axis rotation is consistent with a prolate shape, there is not a one-to-one correspondence between the two features. For instance, intrinsically prolate galaxies in the Illustris simulations are found to range from showing no rotation to being kinematically aligned (Li et al., 2018; Bassett & Foster, 2019).
Simulations find that mergers impart a cumulative effect, and galaxies that have experienced successive multiple mergers are more likely to have lower spins (Lagos et al., 2018). Furthermore, slow-rotating remnants from multiple mergers of disc galaxies are more likely to show kinematics twists, while remnants from binary mergers most often do not (Moody et al., 2014). The majority of galaxies in the MASSIVE sample have low spins in both the central region and the main body, and many of the low-spin galaxies in Figure 6 exhibit noticeable kinematic variations. These results are overall consistent with multiple gas-poor mergers as a main (albeit not only) formation pathway for massive ETGs.
A number of studies have investigated the origins of kinematic distinct components in ETGs. One scenario is a minor merger between the main galaxy and a small companion galaxy on a retrograde orbit, which would lead to a remnant hosting a counter rotating core (e.g., Kormendy 1984; Balcells & Quinn 1990). This is a plausible explanation for the central counter-rotating component in NGC 1700, since the central component was found to have a distinct, younger stellar population compared to the main body (Kleineberg et al., 2011). Other proposed explanations for kinematically distinct components include complex projection effects in the core of a triaxial system rather than a physically distinct entity (Statler, 1991; van den Bosch et al., 2008), a central component formed from the major merger of two disk galaxies (Schweizer et al., 1990; Hernquist & Barnes, 1991; Hoffman et al., 2010; Bois et al., 2011), and a central disk formed from counterrotating accreting gas (Franx & Illingworth, 1988; Bertola et al., 1998). The last formation scenario is likely the explanation for the small-scale ( kpc) kinematical cores in fast-rotating SAURON galaxies (McDermid et al., 2006).
8 Summary
In this paper we have presented a detailed study of stellar velocity features in the central few kpc of 20 ETGs in the MASSIVE survey. These galaxies are located at a median distance of Mpc and have stellar mass . The finely-resolved velocity map for each galaxy is obtained from high- () spectra from the Gemini GMOS IFS with a spatial sampling and FOV, covering a physical length scale of pc to kpc. This is a fraction of the typical effective radius of kpc for MASSIVE galaxies (column 4 of Table 1; Veale et al. 2017a; Goullaud et al. 2018). Prior characterizations of the spins and kinematic misalignments of ETGs have largely been based on measurements of stellar velocities over the main-body of the galaxies at scales of .
Combining these central kinematics with our wide-field () main-body kinematics of MASSIVE galaxies (Ene et al., 2018), we have analyzed the stellar velocity profiles and the relative alignments of the central kinematic axis, main-body kinematic axis and the photometric major axis.
Our main findings are:
- •
-
•
Only 4 galaxies have high km s-1 in both central and outer parts, with NGC 1453 and NGC 2693 showing similar values, and NGC 1129 and NGC 1700 showing very different values at the center versus at .
-
•
We measured the kinematic position angle PA for 18 of the 20 galaxies; the remaining two galaxies (NGC 1016 and NGC 4874) have no detectable central rotations. We found 10 of the 18 galaxies to have aligned central kinematic and photometric axes with small misalignment angle (). For the remaining 8 galaxies, is distributed quite evenly from to the maximum value of , where four galaxies (NGC 741, NGC 890, NGC 1060 and NGC 2258) exhibit “minor-axis” or “prolate-like” rotation with . This distribution of the central kinematic misalignment is very similar to that of the main-body misalignment angle for 71 MASSIVE galaxies presented in Ene et al. (2018).
-
•
We found a strong correlation between central kinematic misalignment and galaxy spin, again similar to our earlier main-body result (Ene et al., 2018). The clear trend is that % of galaxies with high spins () have well aligned kinematic and photometric axes, while only % of low-spin galaxies are well aligned.
-
•
Despite the similarities between the central and main-body rotation statistics above, the two kinematic axes within individual galaxies are not always aligned. Only 12 galaxies in our joint datasets exhibit sufficient rotations for us to determine both kinematic axes, but we observed a diverse range of alignment configurations even within this small sample. Only 7 of the 12 galaxies have aligned central and main-body kinematic axes. Among them, the two kinematic axes are also aligned with the photometric axis in 5 galaxies, whereas the two kinematic axes in the other 2 galaxies (NGC 1060 and NGC 2258) are almost perpendicular to the photometric axis and hence exhibit “minor-axis” rotations.
For the 5 galaxies with misaligned central and main-body kinematic axes, we observed three types: (1) central kinematic axis aligned with photometric axis but not with main-body kinematic axis (NGC 410 and NGC 777); (2) the two kinematic axes and the photometric axis are all different from one another (NGC 890 and NGC 2258); and (3) a counter-rotating inner core that is anti-aligned with the main-body rotation by (NGC 1700).
-
•
To make further use of the GMOS velocity maps beyond measuring the averaged central spin and kinematic axis, we analyzed the radial profile of the local kinemetry position angle , which traces the direction of rotation at a given radius. We found 13 galaxies to exhibit kinematic twists of in the central kpc. The kinematic twists are not limited to galaxies with large central misalignment angle. A handful galaxies with show noticeable local kinematic twists.
We have found that the central kpc regions of massive ETGs exhibit diverse velocity features that range from regular rotations to kinematically distinct components. These detailed features could be uncovered only with high- and high-resolution spectroscopic and photometric observations that span two orders of magnitude in radial coverage. The diversity of the observed kinematic features suggests that local massive ETGs have complex merger histories. Cosmological numerical simulations that properly capture the large-scale galaxy environments as well as resolve sub-kiloparsec scale kinematics at redshift 0 are needed for a full assessment of the formation pathways of massive ellipticals and for statistical comparisons with current observational results. The intricate velocity structures shown in this work further suggest that stellar orbit libraries containing all allowed orbital classes would be needed to fully sample the phase space of these massive ETGs and to perform dynamical mass modeling of the central supermassive black holes in these galaxies.
References
- Aihara et al. (2011) Aihara, H., Allende Prieto, C., An, D., et al. 2011, ApJS, 193, 29
- Balcells & Quinn (1990) Balcells, M., & Quinn, P. J. 1990, ApJ, 361, 381
- Bassett & Foster (2019) Bassett, R., & Foster, C. 2019, MNRAS, 487, 2354
- Bertola et al. (1998) Bertola, F., Cappellari, M., Funes, S. J., J. G., et al. 1998, ApJ, 509, L93
- Bois et al. (2011) Bois, M., Emsellem, E., Bournaud, F., et al. 2011, MNRAS, 416, 1654
- Brodie et al. (2014) Brodie, J. P., Romanowsky, A. J., Strader, J., et al. 2014, ApJ, 796, 52
- Brough et al. (2011) Brough, S., Tran, K. V., Sharp, R. G., von der Linden, A., & Couch, W. J. 2011, 414, L80
- Brough et al. (2017) Brough, S., van de Sande, J., Owers, M. S., et al. 2017, 844, 59
- Bundy et al. (2015) Bundy, K., Bershady, M. A., Law, D. R., et al. 2015, ApJ, 798, 7
- Cappellari & Copin (2003) Cappellari, M., & Copin, Y. 2003, MNRAS, 342, 345
- Cappellari & Emsellem (2004) Cappellari, M., & Emsellem, E. 2004, PASP, 116, 138
- Cappellari et al. (2011) Cappellari, M., Emsellem, E., Krajnović, D., et al. 2011, MNRAS, 413, 813
- Cox et al. (2006) Cox, T. J., Dutta, S. N., Di Matteo, T., et al. 2006, ApJ, 650, 791
- Crocker et al. (2009) Crocker, A. F., Jeong, H., Komugi, S., et al. 2009, MNRAS, 393, 1255
- Croom et al. (2012) Croom, S. M., Lawrence, J. S., Bland-Hawthorn, J., et al. 2012, MNRAS, 421, 872
- Davies & Birkinshaw (1986) Davies, R. L., & Birkinshaw, M. 1986, 303, L45
- Davies & Birkinshaw (1988) —. 1988, ApJS, 68, 409
- de Zeeuw et al. (2002) de Zeeuw, P. T., Bureau, M., Emsellem, E., et al. 2002, MNRAS, 329, 513
- Ebrova & Lokas (2017) Ebrova, I., & Lokas, E. L. 2017, ApJ, 850, 144
- Edwards et al. (2016) Edwards, L. O. V., Alpert, H. S., Trierweiler, I. L., Abraham, T., & Beizer, V. G. 2016, MNRAS, 461, 230
- Emsellem et al. (2007) Emsellem, E., Cappellari, M., Krajnović, D., et al. 2007, MNRAS, 379, 401
- Ene et al. (2019) Ene, I., Ma, C.-P., McConnell, N. J., et al. 2019, ApJ, 878, 57
- Ene et al. (2018) Ene, I., Ma, C.-P., Veale, M., et al. 2018, MNRAS, 479, 2810
- Fogarty et al. (2015) Fogarty, L. M. R., Scott, N., Owers, M. S., et al. 2015, MNRAS, 454, 2050
- Foster et al. (2017) Foster, C., van de Sande, J., D’Eugenio, F., et al. 2017, MNRAS, 472, 966
- Franx et al. (1991) Franx, M., Illingworth, G., & de Zeeuw, T. 1991, ApJ, 383, 112
- Franx et al. (1989) Franx, M., Illingworth, G., & Heckman, T. 1989, ApJ, 344, 613
- Franx & Illingworth (1988) Franx, M., & Illingworth, G. D. 1988, ApJ, 327, L55
- Gerhard (1993) Gerhard, O. E. 1993, MNRAS, 265, 213
- Goullaud et al. (2018) Goullaud, C. F., Jensen, J. B., Blakeslee, J. P., et al. 2018, ApJ, 856, 11
- Hernquist & Barnes (1991) Hernquist, L., & Barnes, J. E. 1991, Nature, 354, 210
- Hoffman et al. (2010) Hoffman, L., Cox, T. J., Dutta, S., & Hernquist, L. 2010, ApJ, 723, 818
- Hook et al. (2004) Hook, I. M., Jørgensen, I., Allington-Smith, J. R., et al. 2004, PASP, 116, 425
- Jedrzejewski & Schechter (1989) Jedrzejewski, R., & Schechter, P. L. 1989, 98, 147
- Jesseit et al. (2009) Jesseit, R., Cappellari, M., Naab, T., Emsellem, E., & Burkert, A. 2009, MNRAS, 397, 1202
- Jimmy et al. (2013) Jimmy, Tran, K.-V., Brough, S., et al. 2013, ApJ, 778, 171
- Katkov et al. (2016) Katkov, I. Y., Sil’chenko, O. K., Chilingarian, I. V., Uklein, R. I., & Egorov, O. V. 2016, MNRAS, 461, 2068
- Kleineberg et al. (2011) Kleineberg, K., Sánchez-Blázquez, P., & Vazdekis, A. 2011, ApJ, 732, L33
- Kormendy (1984) Kormendy, J. 1984, ApJ, 287, 577
- Krajnović et al. (2006) Krajnović, D., Cappellari, M., de Zeeuw, P. T., & Copin, Y. 2006, MNRAS, 366, 787
- Krajnović et al. (2018) Krajnović, D., Emsellem, E., den Brok, M., et al. 2018, MNRAS, 477, 5327
- Krajnovic et al. (2011) Krajnovic, D., Emsellem, E., Cappellari, M., et al. 2011, MNRAS, 414, 2923
- Lagos et al. (2018) Lagos, C. d. P., Schaye, J., Bahé, Y., et al. 2018, 476, 4327
- Li et al. (2018) Li, H., Mao, S., Emsellem, E., et al. 2018, MNRAS, 473, 1489
- Loubser et al. (2018) Loubser, S. I., Hoekstra, H., Babul, A., & O’Sullivan, E. 2018, MNRAS, 477, 335
- Loubser et al. (2008) Loubser, S. I., Sansom, A. E., Sánchez-Blázquez, P., Soechting, I. K., & Bromage, G. E. 2008, MNRAS, 391, 1009
- Ma et al. (2014) Ma, C.-P., Greene, J. E., McConnell, N., et al. 2014, ApJ, 795, 158
- McDermid et al. (2006) McDermid, R. M., Emsellem, E., Shapiro, K. L., et al. 2006, MNRAS, 373, 906
- Moody et al. (2014) Moody, C. E., Romanowsky, A. J., Cox, T. J., Novak, G. S., & Primack, J. R. 2014, MNRAS, 444, 1475
- Naab & Burkert (2003) Naab, T., & Burkert, A. 2003, ApJ, 597, 893
- Naab et al. (2014) Naab, T., Oser, L., Emsellem, E., et al. 2014, MNRAS, 444, 3357
- Pizzella et al. (2018) Pizzella, A., Morelli, L., Coccato, L., et al. 2018, A&A, 616, A22
- Raskutti et al. (2014) Raskutti, S., Greene, J. E., & Murphy, J. D. 2014, ApJ, 786, 23
- Sánchez et al. (2012) Sánchez, S. F., Kennicutt, R. C., Gil de Paz, A., et al. 2012, A&A, 538, A8
- Schechter & Gunn (1979) Schechter, P. L., & Gunn, J. E. 1979, ApJ, 229, 472
- Schombert (2007) Schombert, J. 2007, arXiv e-prints, astro
- Schulze et al. (2018) Schulze, F., Remus, R.-S., Dolag, K., et al. 2018, MNRAS, 480, 4636
- Schweizer et al. (1990) Schweizer, F., Seitzer, P., Faber, S. M., et al. 1990, ApJ, 364, L33
- Skrutskie et al. (2006) Skrutskie, M. F., Cutri, R. M., Stiening, R., et al. 2006, AJ, 131, 1163
- Statler (1991) Statler, T. S. 1991, ApJ, 375, 544
- Tsatsi et al. (2017) Tsatsi, A., Lyubenova, M., Van De Ven, G., et al. 2017, A&A, 606, A62
- van den Bosch et al. (2008) van den Bosch, R. C. E., van de Ven, G., Verolme, E. K., Cappellari, M., & de Zeeuw, P. T. 2008, MNRAS, 385, 647
- van der Marel & Franx (1993) van der Marel, R. P., & Franx, M. 1993, ApJ, 407, 525
- Veale et al. (2017a) Veale, M., Ma, C.-P., Greene, J. E., et al. 2017a, MNRAS, 471, 1428
- Veale et al. (2018) —. 2018, MNRAS, 473, 5446
- Veale et al. (2017b) Veale, M., Ma, C.-P., Thomas, J., et al. 2017b, MNRAS, 464, 356
- Walcher et al. (2014) Walcher, C. J., Wisotzki, L., Bekeraité, S., et al. 2014, A&A, 569, A1
- Weijmans et al. (2014) Weijmans, A.-M., de Zeeuw, P. T., Emsellem, E., et al. 2014, MNRAS, 444, 3340
- Yang et al. (2019) Yang, L., Xu, D., Mao, S., Springel, V., & Li, H. 2019, MNRAS, 489, 534
- York et al. (2000) York, D. G., Adelman, J., Anderson, Jr., J. E., et al. 2000, AJ, 120, 1579