Universal transition diagram from dormant to actively accreting supermassive black holes
Abstract
The vast majority of supermassive black holes (SMBHs) in the local universe exhibit levels of activity much lower than those expected from gas supplying rates onto the galactic nuclei, and only a small fraction of silent SMBHs can turn into active galactic nuclei. Revisiting observational data of very nearby SMBHs whose gravitational spheres of influence are spatially reached by the Chandra X-ray satellite, we find that the level of BH activity drastically increases from the quiescent phase when the inflow rate outside of the BH influence radius is higher than 0.1% of the Eddington accretion rate. We also show that the relation between the nuclear luminosity and gas accretion rate from the BH influence radius measured from X-ray observations is well described by the universal state transition of accreting SMBHs, as predicted by recent hydrodynamical simulations with radiative cooling and BH feedback. After the state transition, young massive stars should form naturally in the nucleus, as observed in the case of the nearest SMBH, Sagittarius A∗, which is currently quiescent but was recently active.
1 Introduction
Supermassive black holes (SMBHs) are ubiquitously harbored at the centers of massive nearby galaxies, and are believed to coevolve with their host galaxies through BH feeding and energetic feedback over cosmic time (Kormendy & Ho, 2013, hereafter KH13). Most SMBHs in the local universe are nearly quiescent, low-luminosity active galactic nuclei (AGNs) with bolometric luminosities , where is the Eddington luminosity (Ho, 2008, 2009). The radiatively inefficient accretion flow (RIAF) model has been proposed to explain the nature of low-luminosity accreting SMBHs (Ichimaru, 1977; Narayan & Yi, 1994; Stone et al., 1999; Narayan et al., 2000; Quataert & Gruzinov, 2000; Yuan & Narayan, 2014). Two notable examples are Sagittarius A∗ (Sgr A∗) and the SMBH at the center of the giant elliptical galaxy NGC 4486 (M87). Recently, the Event Horizon Telescope project pulled together observatories around the globe and succeeded in imaging the accretion flow onto the M87 SMBH and presumably its black hole shadow (Event Horizon Telescope Collaboration et al., 2019a, b). By comparing the observed image to those obtained by ray-traced general relativistic magnetohydrodynamic simulations of BH accretion, our understanding of gas dynamics in the strong-field regime of general relativity will be improved significantly (e.g., Dexter et al., 2012; Mościbrodzka et al., 2016; Ryan et al., 2018).
Observations of nearby SMBHs also provide a great opportunity to explore BH accretion dynamics at the BH gravitational influence radius (hereafter, Bondi radius), which is on the order of parsecs ( the event horizon scales), from which mass inflows occur at the so-called Bondi accretion rate . This Bondi accretion rate is supposed to be an upper limit of the BH feeding rate and lead to radiative output with . However, this level of energy release is far more luminous than actually observed, assuming a canonical value of 10% for the radiative efficiency (Shakura & Sunyaev, 1973) or an even lower value ( a few %) for RIAFs (Xie & Yuan, 2012; Ryan et al., 2017). The deficit of radiative luminosity suggests that only a fraction of inflowing matter from the Bondi scale actually feeds the BH and produces radiative/mechanical output that we observe in the nuclei of low-luminosity SMBHs. Therefore, drawing the relation between the mass inflow rate and radiative output is essential to understand the mechanisms governing the fate of the fuel reservoir, and to obtain a consistent picture to link quantitatively dormant SMBHs and more luminous AGNs.
In this paper, we revisit observational data of very nearby SMBHs for which the spatial resolution of the Chandra X-ray satellite reaches the Bondi scales, and report that the observational data clearly show the existence of a universal state transition for BH activity. The level of radiative output before the state transition and critical mass inflow rate for the transition can be described well by recent numerical simulations taking into account radiative processes and BH feedback.
2 Sample assembly
High-spatial resolution X-ray observations using the Chandra satellite give unique information on the properties of inflowing gas around the Bondi radius, where the gas is turned into hot and diffuse plasma with temperature and electron density cm-3. Even with the excellent spatial resolution of , the Bondi scale, at most on the order of pc, is resolvable only for a small number of sources at distances up to Mpc.
In this paper, we adopt the compilation by Pellegrini (2005), which contains a total of 50 X-ray-faint galaxies with X-ray luminosities erg s-1 in the 2–10 keV band, for which Chandra data are publicly available as of 2005. For 15 of these sources, the physical parameters of diffuse hot gas surrounding the nuclear regions, such as thermal temperature and electron density, have been directly measured with Chandra observations. We note that NGC 821, NGC 1553, and NGC 5128 are excluded from our sample because the electron densities for the first two sources in the literature are not observed values but just assumed to be , and the density for the third source is not measured by Chandra observations but XMM-Newton, which has a lower spatial resolution of . In addition, we collect some interesting sources whose Bondi scales are reported to be resolved. One is NGC 224 (M31), which is the nearest major galaxy to us and contains an SMBH in the center, and detailed Chandra observations are available (Dosaj et al., 2002; Garcia et al., 2005). The others are nearby galaxies that have been extensively studied: NGC 1332 (Humphrey et al., 2009), NGC 3115 (Wong et al., 2014), and NGC 1407 (Humphrey et al., 2006). Moreover, Russell et al. (2013, hereafter R13) compiled Chandra observations to discuss the Bondi accretion rates for the SMBHs in 13 nearby galaxies, providing us with eight new sources111 Note that NGC 4778, the brightest galaxy in HCG 62, is excluded because the BH mass measurement is not based on reliable methods (see §2.2).. Finally, we have added four galaxies (NGC 315, NGC 2681, NGC 4278, and NGC 5005) with clear hot diffuse gas emission (Younes et al., 2011). In total, we have added 16 more sources, resulting in the total number of 31 sources.
In what follows, we describe the manner of observational data assembly for the 31 low-luminosity SMBHs. The estimated physical quantities for those objects are summarized in Table 1.
2.1 Distance
It is crucial to obtain a homogeneous set of reliable distances for our sample. Since most of our sample are very nearby sources, redshift-independent distances are used whenever possible. We follow the priorities for the choices of distance from KH13 (see their Tables 2 and 3). For 23 out of the 31 sources, we use distances based on surface brightness fluctuation measurements for individual galaxies in the Virgo and Fornax clusters (Blakeslee et al., 2009, 2010). For NGC 1291, we adopt the distance based on the tip of the red giant branch (McQuinn et al., 2017). For Sgr A∗, we adopt the distance measured from resolved stellar dynamics (Genzel et al., 2010). Distances for the remaining six sources are taken from the mean values of several distance determinations listed in NED, mainly based on Cepheid variables, surface brightness fluctuations, tip of the red giant branch, and RR Lyrae stars.
2.2 Black Hole Mass
We collect the BH masses of 16 sources based on spatially resolved stellar or ionized gas kinematic observations, as compiled in KH13 and the references therein. Since the other 15 sources do not have reliable dynamical mass measurements, we estimate their BH masses using the empirical relation given in Eq. (7) of KH13,
| (1) |
where is the central velocity dispersion of the bulge stars, taken from the Hyperleda database (Paturel et al., 2003). The mean error of the BH masses for the sample is .
2.3 Bolometric Luminosity
Ideally, the AGN bolometric luminosities should be measured directly from their broadband spectral energy distributions (SEDs). In the case of Sgr A∗, an almost complete nuclear SED is available from the radio to X-ray band (Narayan et al., 1998), integration of which yields erg s-1.
Unfortunately, complete broadband nuclear SEDs are not available for most of our sources. One of the most secured indirect methods is to estimate from the 2–10 keV absorption-corrected X-ray luminosity () using a bolometric correction of (Ho, 2009). Since our targets are very faint, the X-ray data must be obtained with spatial resolution high enough to distinguish the nuclear source from the host galaxy. We collect the X-ray luminosities from Chandra observations achieving the best spatial resolution in the X-ray band. Note that there are six sources that have no X-ray core coincident with the assumed optical nucleus, have no power-law component in their nuclear spectra, or have a significant level of contamination from X-ray binaries (see Table 1). We treat their nuclear X-ray luminosities as upper limits in Figure 1.
It is quite difficult to evaluate the uncertainties of the estimated bolometric luminosities. A major concern is the possible underestimation of intrinsic absorption of the emergent X-ray radiation. Low-luminosity AGNs, however, generally suffer from very minimal intrinsic absorption (Ho, 2008), and this effect typically introduces an uncertainty only at the level of a factor of 2 to our luminosity estimates (Ho, 2009). Accordingly, we assign errors of 50% to .
The Eddington ratio is defined by , where erg s-1. We estimate the uncertainty of by propagating the errors on and .
2.4 Temperature and Electron Density
Both the temperature and electron density are key parameters needed to estimate the Bondi radius and the Bondi accretion rate. For each object in our sample, we select the deepest Chandra observations from the literature to obtain and of the diffuse hot gas in the nuclear region. Although the details of the analysis differ from study to study, the general methodology to estimate these two quantities follows a similar manner. Whenever possible, the diffuse component is extracted after removing point sources arising from X-ray binaries and the central nuclear component. Since the nuclear component usually has a characteristic power-law spectrum in the hard X-ray band above keV, this fact enables us to distinguish the nuclear emission from the diffuse emission that has a peak at keV. Therefore, contamination from the nuclear component is not a serious issue for obtaining the temperature of diffuse hot gas surrounding the SMBH.
The spatially resolved region containing diffuse gas is divided into radial annuli with sufficient counts for spectral fitting (see a typical example in Wong et al., 2014). The MEKAL (Mewe et al., 1985) and APEC (Smith et al., 2001) models are commonly used for spectral fitting, and both are implemented in the standard X-ray fitting tool XSPEC (Arnaud, 1996). The model fit yields the temperature from the peak of the thermal bump at keV, and the electron density from the spectral normalization, producing radial profiles of the two quantities. The literature does not always provide the uncertainties for estimating and . In such cases, we adopt the mean error of the sources with robust error estimates; and .
In Table 1, we list the temperatures and electron densities measured either at or at the inner-most radii that the Chandra observations can reach if the Bondi radii are not resolved. As exceptions, however, we present the electron densities extrapolated to the Bondi radii of seven unresolved sources studied in R13 (NGC 507, NGC 1316, NGC 4696, NGC 5044, NGC 5813, NGC 5846, and NGC 6166), for which the density profiles are fitted with three different models (a power-law model continuing a steep density gradient to , a -model flattening to a constant, and a shallow Sérsic profile with ) with errors arising from the different model assumptions.
2.5 Bondi Radius and Accretion Rate
The Bondi radius is the characteristic radius within which the gravitational force by the central BH dominates the thermal pressure gradient force of the gas surrounding the BH (Bondi & Hoyle, 1944; Bondi, 1952), defined by
| (2) |
where and . We emphasize that our definition of is smaller by a factor of 2 compared to the one in Pellegrini (2005), which uses the diameter instead of the radius. Note that the uncertainties in estimating the Bondi radius are mainly due to the uncertainties from the BH mass measurements, and the mean uncertainty is .
We divide the sample into two groups based on whether or not the angular size of the Bondi radius () within the estimated uncertainty is larger than , which is the best achievable resolution by Chandra. Based on this criterion, we define sources having sufficiently large Bondi radii () as resolved (see the first 11 sources labeled as “Bondi = Y” in Table 1). Note that the Bondi radius of the BH in NGC 4594 might be marginally resolved within the error of the BH mass measurement, but the spatial resolution of its Chandra observation reaches only (Pellegrini et al., 2003). Thus, we consider this source to be unresolved (see the remaining 20 sources labeled as “Bondi = N” in Table 1).
The Bondi accretion rate is defined as the mass inflow rate through the Bondi radius,
| (3) | |||||
where for and . The Bondi accretion rate normalized by the Eddington accretion rate is given as
| (4) |
For the unresolved sources (), their Bondi accretion rates are estimated by extrapolating the electron densities at from the measured values, namely by multiplying by a factor of with an assumed density profile of . The choice of the slope is consistent with the profiles for two well-resolved objects: for NGC 4486 (M87) (Russell et al., 2015) and for NGC 3115 (Wong et al., 2014). Note that the extrapolation has been taken into account for the seven unresolved sources studied by R13.
For NGC 1291 and NGC 4594, the extrapolated values of electron density are treated as lower limits because their nuclear regions are poorly resolved ( and , respectively; Irwin et al. 2002; Pellegrini et al. 2003). For NGC 221 (M 32), the electron density is the volume-averaged value within 30′′ and is thus treated as a lower limit (Ho et al., 2003). For convenience, we list the “uncorrected” Bondi accretion rate and the correction factor separately in Table 1, but show the “corrected” Bondi accretion rate in Figure 1. It is also worth noting that removing these three galaxies and five objects with no detection of nuclear X-ray emission from the unresolved sample, all of the other 12 unresolved sources are located in the transition region in Figure 1 within the errors.
Younes et al. (2011) did not provide for the four low-luminosity sources included in their study, only estimates of the emission measure for which the volume information is integrated. To derive the density from the emission measure, we assume that the volume contribution to the emission measure is inside a radius of and that the slope of the density profile is . The choice of radius is quite arbitrary, but the estimated value for NGC 315 ( cm-3) agrees well with the density reported by other studies (Worrall et al., 2003).
3 Results
Figure 1 presents the relation between the luminosity and Bondi accretion rate for the samples whose Bondi scales are resolved (blue) and unresolved (green). The luminosity and accretion rate are both normalized by their Eddington values, as BH accretion systems are characterized by these two dimensionless quantities, not by the actual physical scales. Assuming that the BH feeding rate is equal to the Bondi accretion rate, as in the original advection-dominated accretion flow model (gray thin dashed line), the radiative luminosity is expected to be much higher than the observed values by several orders of magnitude. While the luminosity discrepancy is large at lower Bondi rates (), the luminosity increases dramatically at and catches up to the lowest levels of the activity observed in low-luminosity AGNs (; orange symbols). Even in the face of uncertainties of electron density measurements for several unresolved objects, the overall trend covering many orders of magnitude in the phase diagram of Figure 1 is seen robustly.
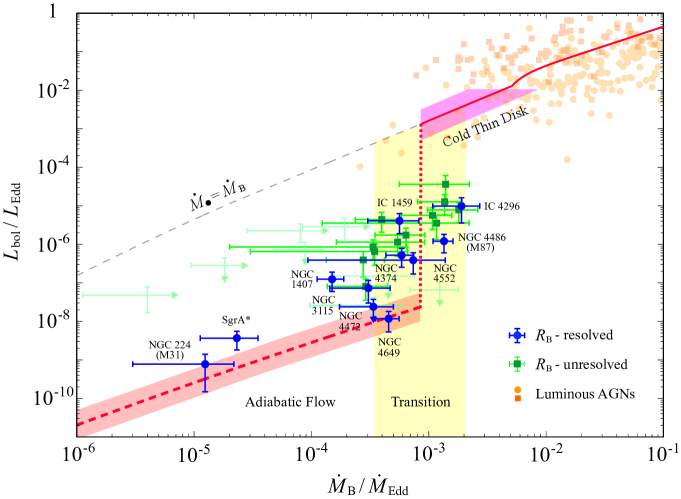
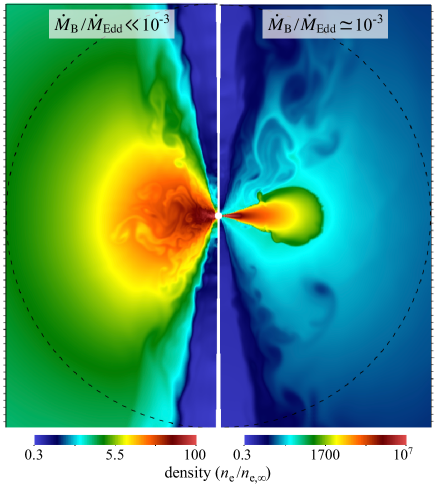
Figure 2 shows the two-dimensional distribution of the density distribution of rotating accretion flows onto an SMBH, obtained from two-dimensional hydrodynamical simulations with radiative processes and BH feedback (Inayoshi et al., 2019), where feedback is modeled with the prescription obtained by Sazonov et al. (2005) without injecting disk winds (see also Yuan et al. 2018)222 Several previous works proposed the importance of mass loss via winds to explain the nature of low-luminosity AGNs (e.g., Blandford & Begelman, 1999; Li et al., 2013; Bu et al., 2016). Unlike previous studies that have investigated accretion flows on smaller scales assuming a compact and gravitationally bound disk as the initial state, these numerical simulations focus on the accretion dynamics at larger scales covering the Bondi radius (dashed circles), where the gas is weakly bound initially. This type of simulation allows us to set plausible initial and boundary conditions, which can be directly measured in the nuclear regions surrounding quiescent SMBHs. For the lower density case with (left panel), radiative cooling is inefficient and viscous energy dissipation heats the gas, leading to a hot and turbulent accretion flow through a geometrically thick disk. Importantly, the inflow rate decreases toward the center as due to turbulent motion and results in a low value onto the central BH (Quataert & Gruzinov, 2000; Inayoshi et al., 2018). In such a hot accretion flow, thermal conductivity of electrons, instead of turbulence, transports energy outward at the inner region of . Since suppression of the accretion by turbulence ceases in the inner region, the final BH feeding rate is
| (5) |
where is the gas temperature, is the strength of viscosity, and is the conductivity suppression factor due to magnetic fields (Narayan & Medvedev, 2001). In other words, the BH feeding rate is reduced by orders of magnitude from the Bondi accretion rate. As a result, the radiative luminosity reduces to
| (6) |
where the radiative efficiency model for a hot accretion disk is adopted (Ryan et al. 2017; see also Figure 2 in Inayoshi et al. 2019). The level of radiative luminosity agrees well with the observational results for SMBHs accreting at , as shown in Figure 1 (red region). Note that the width of the red region reflects the uncertainties of the conductivity suppression factor, which has a range of .
By contrast, for the highest rate of the accreting gas collapses to the midplane and forms a geometrically thin disk because of radiative cooling (right panel). Since the entropy generated by viscosity is radiated away, turbulent gas motion ceases, and the gas accretion rate through the disk becomes as high as . This cooling transition dramatically increases the luminosity by several orders of magnitude (Figure 1, yellow region). We note that this critical rate required for the cooling transition around the BH influence radius, (Gaspari et al., 2015; Inayoshi et al., 2019) is orders of magnitude lower than the critical rate for a compact accretion disk near the BH (Yuan, 2001, 2003), the latter of which would be more relevant to the disk state transition for X-ray binaries.
4 Discussion
4.1 Relationship with local bright AGNs
Among the sample, 15 objects (five resolved and 10 unresolved ones) are located in the transition region of Figure 1 and are as luminous as . Those SMBHs bridge the gap between the adiabatic accretion flows and the faint end of Seyfert galaxies in the local universe (Ichikawa et al., 2019).
In order to extend the state transition diagram to the brighter end, we consider two well-defined and complementary samples of local AGNs selected by X-rays and UV/optical surveys (orange circles and squares, respectively). The X-ray-selected sample was derived from the all-sky 70-month Swift/Burst Alert Telescope (BAT; Baumgartner et al. 2013), whose m infrared (IR) properties have been investigated (Meléndez et al., 2014; Ichikawa et al., 2017) and quantified systematically from decomposition of the IR SED into the AGN and host galaxy components, i.e., star-formation activity (Ichikawa et al., 2019). The UV/optical-selected sample is based on the Palomar-Green (PG) quasar survey (Boroson & Green, 1992), and its star formation activity has also been investigated with decomposition of its IR SEDs (Shangguan et al., 2018). The rich multi-wavelength data sets of these objects enable us to estimate the bolometric luminosity and BH mass (i.e., Eddington luminosity and accretion rate), and also to study the statistical properties of their star formation rates (SFRs) on the host galaxy scales with the empirical relation (Kennicutt, 1998),
| (7) |
We restrict the sample to bright objects with far-infrared (FIR) luminosities because the empirical relation is valid for star-forming galaxies and the IR SED fitting model is based on SED templates of galaxies with FIR luminosities above this threshold.
We note that because of their large distances, the Bondi radii for the Swift/BAT and PG quasar samples are not resolved even with Chandra, and thus their Bondi accretion rates are not estimated properly. For the purpose of illustration in Figure 1, we replace the Bondi accretion rates on the horizontal axis with for all the 426 luminous AGNs. This factor of 0.01 is arbitrary but may be of a similar order of magnitude as the Bondi accretion rate for the following reasons. First, local Seyfert galaxies with high-angular resolution () mid-infrared spectroscopy indicate that the SFRs in the nuclear regions ( pc) are, on average, 5 times lower than those measured in the circumnuclear regions on kiloparsec scales (Esquej et al., 2014). Second, numerical simulations studying the structure of circumnuclear disks suggest that strong star formation activity leads to turbulence in the disk, and turbulent viscosity efficiently induces mass accretion onto the Bondi scale at a rate of 10% of the nuclear SFR (Wada & Norman, 2002; Inayoshi et al., 2019). With these simple assumptions, the bright AGN population seems to follow the red curve in Figure 1, which assumes with the radiative efficiency of a geometrically thin accretion disk.
4.2 Past Activity of Sgr A∗
Sgr A∗ is the SMBH in the center of the Milky Way with a mass of , whose activity is known to be very quiescent at present (). However, several lines of observational evidence suggest that its past AGN activity was higher (Kaifu et al., 1972; Koyama et al., 1996; Bland-Hawthorn & Cohen, 2003; Totani, 2006; Ryu et al., 2013). One of the most striking clues is the discovery of the Fermi bubbles, which are expanding above and below the Galactic plane with an age of roughly a few Myr (Su et al., 2010). A short episode of AGN activity lasting and injecting a total energy of order erg are required to create the bubbles. This level of energy injection is achieved by assuming that the past AGN luminosity was (, adopting a typical value of the bolometric correction for low-luminosity AGNs). The Bondi accretion rate required to explain the energy output is on the order of , which is presumably the accretion rate through the cold disk (i.e., ). In fact, the accretion rate is high enough for the disk to fragment into clumps and form stars by a spiral-mode gravitational instability, which is characterized by the Toomre parameter (Toomre, 1964):
| (8) | |||||
where is the effective viscous parameter caused by the spiral arms and is the sound speed of cold gas with a temperature of . The parameter range where the accretion disk would be gravitationally unstable after the transition is indicated with the magenta region in Figure 1 (Inayoshi et al. 2019, see also Menou & Quataert 2001). This process naturally explains the existence of young massive stars in a thin stellar disk in the Galactic center (Levin & Beloborodov, 2003). Major episodes of BH accretion with and star formation would likely blow away the accreting gas and quench the activity of Sgr A∗.
References
- Arnaud (1996) Arnaud, K. A. 1996, in Astronomical Society of the Pacific Conference Series, Vol. 101, Astronomical Data Analysis Software and Systems V, ed. G. H. Jacoby & J. Barnes, 17
- Baganoff et al. (2003) Baganoff, F. K., Maeda, Y., Morris, M., et al. 2003, ApJ, 591, 891
- Baumgartner et al. (2013) Baumgartner, W. H., Tueller, J., Markwardt, C. B., et al. 2013, ApJS, 207, 19
- Bender et al. (2005) Bender, R., Kormendy, J., Bower, G., et al. 2005, ApJ, 631, 280
- Blakeslee et al. (2010) Blakeslee, J. P., Cantiello, M., Mei, S., et al. 2010, ApJ, 724, 657
- Blakeslee et al. (2009) Blakeslee, J. P., Jordán, A., Mei, S., et al. 2009, ApJ, 694, 556
- Blakeslee et al. (2001) Blakeslee, J. P., Vazdekis, A., & Ajhar, E. A. 2001, MNRAS, 320, 193
- Blandford & Begelman (1999) Blandford, R. D., & Begelman, M. C., 1999, MNRAS, 303, L1
- Bland-Hawthorn & Cohen (2003) Bland-Hawthorn, J., & Cohen, M. 2003, ApJ, 582, 246
- Bondi (1952) Bondi, H. 1952, MNRAS, 112, 195
- Bondi & Hoyle (1944) Bondi, H., & Hoyle, F. 1944, MNRAS, 104, 273
- Boroson & Green (1992) Boroson, T. A., & Green, R. F. 1992, ApJS, 80, 109
- Bu et al. (2016) Bu, D.-F., Yuan, F., Gan, Z.-M., & Yang X.-H., 2016, ApJ, 818, 83
- Cappellari et al. (2002) Cappellari, M., Verolme, E. K., van der Marel, R. P., et al. 2002, ApJ, 578, 787
- Dexter et al. (2012) Dexter, J., McKinney, J. C., & Agol, E. 2012, MNRAS, 421, 1517
- Dosaj et al. (2002) Dosaj, A., Garcia, M., Forman, W., et al. 2002, in Astronomical Society of the Pacific Conference Series, Vol. 262, The High Energy Universe at Sharp Focus: Chandra Science, ed. E. M. Schlegel & S. D. Vrtilek, 147
- Emsellem et al. (1999) Emsellem, E., Dejonghe, H., & Bacon, R. 1999, MNRAS, 303, 495
- Esquej et al. (2014) Esquej, P., Alonso-Herrero, A., González-Martín, O., et al. 2014, ApJ, 780, 86
- Event Horizon Telescope Collaboration et al. (2019a) Event Horizon Telescope Collaboration, Akiyama, K., Alberdi, A., et al. 2019a, ApJ, 875, L1
- Event Horizon Telescope Collaboration et al. (2019b) Event Horizon Telescope Collaboration, Akiyama, K., Alberdi, A., et al. 2019b, ApJ, 875, L4
- Fabbiano et al. (2003) Fabbiano, G., Elvis, M., Markoff, S., et al. 2003, ApJ, 588, 175
- Ferrarese et al. (1996) Ferrarese, L., Ford, H. C., & Jaffe, W. 1996, ApJ, 470, 444
- Garcia et al. (2005) Garcia, M. R., Williams, B. F., Yuan, F., et al. 2005, ApJ, 632, 1042
- Gaspari et al. (2015) Gaspari, M., Brighenti, F., & Temi, P. 2015, A&A, 579, A62
- Gebhardt et al. (2011) Gebhardt, K., Adams, J., Richstone, D., et al. 2011, ApJ, 729, 119
- Genzel et al. (2010) Genzel, R., Eisenhauer, F., & Gillessen, S. 2010, Reviews of Modern Physics, 82, 3121
- González-Martín et al. (2006) González-Martín, O., Masegosa, J., Márquez, I., Guerrero, M. A., & Dultzin-Hacyan, D. 2006, A&A, 460, 45
- Ho (2008) Ho, L. C. 2008, ARA&A, 46, 475
- Ho (2009) Ho, L. C. 2009, ApJ, 699, 626
- Ho et al. (2003) Ho, L. C., Terashima, Y., & Ulvestad, J. S. 2003, ApJ, 589, 783
- Houghton et al. (2006) Houghton, R. C. W., Magorrian, J., Sarzi, M., et al. 2006, MNRAS, 367, 2
- Humphrey & Buote (2004) Humphrey, P. J., & Buote, D. A. 2004, ApJ, 612, 848
- Humphrey et al. (2009) Humphrey, P. J., Buote, D. A., Brighenti, F., Gebhardt, K., & Mathews, W. G. 2009, ApJ, 703, 1257
- Humphrey et al. (2006) Humphrey, P. J., Buote, D. A., Gastaldello, F., et al. 2006, ApJ, 646, 899
- Ichikawa et al. (2017) Ichikawa, K., Ricci, C., Ueda, Y., et al. 2017, ApJ, 835, 74
- Ichikawa et al. (2019) Ichikawa, K., Ricci, C., Ueda, Y., et al. 2019, ApJ, 870, 31
- Ichimaru (1977) Ichimaru, S. 1977, ApJ, 214, 840
- Inayoshi et al. (2019) Inayoshi, K., Ichikawa, K., Ostriker, J. P., & Kuiper, R. 2019, MNRAS, 486, 5377
- Inayoshi et al. (2018) Inayoshi, K., Ostriker, J. P., Haiman, Z., & Kuiper, R. 2018, MNRAS, 476, 1412
- Irwin et al. (2002) Irwin, J. A., Sarazin, C. L., & Bregman, J. N. 2002, ApJ, 570, 152
- Jardel et al. (2011) Jardel, J. R., Gebhardt, K., Shen, J., et al. 2011, ApJ, 739, 21
- Kaifu et al. (1972) Kaifu, N., Kato, T., & Iguchi, T. 1972, Nature Physical Science, 238, 105
- Kennicutt (1998) Kennicutt, Robert C., J. 1998, ARA&A, 36, 189
- Kormendy & Ho (2013) Kormendy, J., & Ho, L. C. 2013, ARA&A, 51, 511
- Koyama et al. (1996) Koyama, K., Maeda, Y., Sonobe, T., et al. 1996, PASJ, 48, 249
- Lanz et al. (2010) Lanz, L., Jones, C., Forman, W. R., et al. 2010, ApJ, 721, 1702
- Levin & Beloborodov (2003) Levin, Y., & Beloborodov, A. M. 2003, ApJ, 590, L33
- Li et al. (2013) Li, J., Ostriker, J. P., & Sunyaev, R., 2013, MNRAS, 767, 105
- Loewenstein et al. (2001) Loewenstein, M., Mushotzky, R. F., Angelini, L., Arnaud, K. A., & Quataert, E. 2001, ApJ, 555, L21
- Mathews & Brighenti (2003) Mathews, W. G., & Brighenti, F. 2003, ARA&A, 41, 191
- McCourt et al. (2011) McCourt, M., Parrish, I. J., Sharma, P., & Quataert, E. 2011, MNRAS, 413, 1295
- McQuinn et al. (2017) McQuinn, K. B. W., Skillman, E. D., Dolphin, A. E., Berg, D., & Kennicutt, R. 2017, AJ, 154, 51
- Meléndez et al. (2014) Meléndez, M., Mushotzky, R. F., Shimizu, T. T., Barger, A. J., & Cowie, L. L. 2014, ApJ, 794, 152
- Menou & Quataert (2001) Menou, K., & Quataert, E. 2001, ApJ, 552, 204
- Mewe et al. (1985) Mewe, R., Gronenschild, E. H. B. M., & van den Oord, G. H. J. 1985, A&AS, 62, 197
- Mościbrodzka et al. (2016) Mościbrodzka, M., Falcke, H., & Shiokawa, H. 2016, A&A, 586, A38
- Narayan et al. (2000) Narayan, R., Igumenshchev, I. V., & Abramowicz, M. A. 2000, ApJ, 539, 798
- Narayan et al. (1998) Narayan, R., Mahadevan, R., Grindlay, J. E., Popham, R. G., & Gammie, C. 1998, ApJ, 492, 554
- Narayan & Medvedev (2001) Narayan, R., Medvedev, M. V., 2001, MNRAS, 562, L129
- Narayan & Yi (1994) Narayan, R., & Yi, I. 1994, ApJ, 428, L13
- Nowak et al. (2008) Nowak, N., Saglia, R. P., Thomas, J., et al. 2008, MNRAS, 391, 1629
- Paggi et al. (2014) Paggi, A., Fabbiano, G., Kim, D.-W., et al. 2014, ApJ, 787, 134
- Paturel et al. (2003) Paturel, G., Petit, C., Prugniel, P., et al. 2003, A&A, 412, 45
- Pellegrini (2005) Pellegrini, S. 2005, ApJ, 624, 155
- Pellegrini et al. (2003) Pellegrini, S., Baldi, A., Fabbiano, G., & Kim, D.-W. 2003, ApJ, 597, 175
- Quataert & Gruzinov (2000) Quataert, E., & Gruzinov, A. 2000, ApJ, 539, 809
- Rusli et al. (2011) Rusli, S. P., Thomas, J., Erwin, P., et al. 2011, MNRAS, 410, 1223
- Rusli et al. (2013) Rusli, S. P., Thomas, J., Saglia, R. P., et al. 2013, AJ, 146, 45
- Russell et al. (2015) Russell, H. R., Fabian, A. C., McNamara, B. R., & Broderick, A. E. 2015, MNRAS, 451, 588
- Russell et al. (2013) Russell, H. R., McNamara, B. R., Edge, A. C., et al. 2013, MNRAS, 432, 530
- Ryan et al. (2017) Ryan, B. R., Ressler, S. M., Dolence, J. C., et al. 2017, ApJ, 844, L24
- Ryan et al. (2018) Ryan, B. R., Ressler, S. M., Dolence, J. C., Gammie, C., & Quataert, E. 2018, ApJ, 864, 126
- Ryu et al. (2013) Ryu, S. G., Nobukawa, M., Nakashima, S., et al. 2013, PASJ, 65, 33
- Sazonov et al. (2005) Sazonov S. Y., Ostriker J. P., Ciotti L., Sunyaev R. A., 2005, MNRAS, 358, 168
- Schulze & Gebhardt (2011) Schulze, A., & Gebhardt, K. 2011, ApJ, 729, 21
- Shakura & Sunyaev (1973) Shakura, N. I., & Sunyaev, R. A. 1973, A&A, 24, 337
- Shangguan et al. (2018) Shangguan, J., Ho, L. C., & Xie, Y. 2018, ApJ, 854, 158
- Shen & Gebhardt (2010) Shen, J., & Gebhardt, K. 2010, ApJ, 711, 484
- Smith et al. (2001) Smith, R. K., Brickhouse, N. S., Liedahl, D. A., & Raymond, J. C. 2001, ApJ, 556, L91
- Soria et al. (2006) Soria, R., Fabbiano, G., Graham, A. W., et al. 2006, ApJ, 640, 126
- Stone et al. (1999) Stone, J. M., Pringle, J. E., & Begelman, M. C. 1999, MNRAS, 310, 1002
- Su et al. (2010) Su, M., Slatyer, T. R., & Finkbeiner, D. P. 2010, ApJ, 724, 1044
- Tonry et al. (2001) Tonry, J. L., Dressler, A., Blakeslee, J. P., et al. 2001, ApJ, 546, 681
- Toomre (1964) Toomre, A. 1964, ApJ, 139, 1217
- Totani (2006) Totani, T. 2006, PASJ, 58, 965
- van den Bosch & de Zeeuw (2010) van den Bosch, R. C. E., & de Zeeuw, P. T. 2010, MNRAS, 401, 1770
- Wada & Norman (2002) Wada, K., & Norman, C. A. 2002, ApJ, 566, L21
- Walsh et al. (2010) Walsh, J. L., Barth, A. J., & Sarzi, M. 2010, ApJ, 721, 762
- Wong et al. (2014) Wong, K.-W., Irwin, J. A., Shcherbakov, R. V., et al. 2014, ApJ, 780, 9
- Worrall et al. (2003) Worrall, D. M., Birkinshaw, M., & Hardcastle, M. J. 2003, MNRAS, 343, L73
- Xie & Yuan (2012) Xie, F.-G., & Yuan, F. 2012, MNRAS, 427, 1580
- Younes et al. (2011) Younes, G., Porquet, D., Sabra, B., & Reeves, J. N. 2011, A&A, 530, A149
- Yuan (2001) Yuan, F. 2001, MNRAS, 324, 119
- Yuan (2003) Yuan, F. 2003, ApJ, 594, L99
- Yuan & Narayan (2014) Yuan, F., & Narayan, R. 2014, ARA&A, 52, 529
- Yuan et al. (2018) Yuan F., Yoon D., Li Y.-P., Gan Z.-M., Ho L. C., Guo F., 2018, MNRAS, 857, 121
- Zhang & Xu (2004) Zhang, Z.-L., & Xu, H.-G. 2004, Chinese J. Astron. Astrophys., 4, 221
| Name | (Mpc) | (K) | () | (pc) | (′′) | Bondi | Reference | ||||
|---|---|---|---|---|---|---|---|---|---|---|---|
| NGC 224 | – | Y | 1, 2, 3, 4 | ||||||||
| NGC 1407 | – | Y | 5, 6, 7, 8 | ||||||||
| NGC 3115 | – | Y | 5, 9, 10, 11 | ||||||||
| NGC 4374 | – | Y | 12, 13, 14, 15 | ||||||||
| NGC 4472 | – | Y | 12, 6, 16, 16 | ||||||||
| NGC 4486 | – | Y | 12, 17, 14, 11 | ||||||||
| NGC 4552 | – | Y | 5, 18, 14, 15 | ||||||||
| NGC 4649 | – | Y | 12, 19, 20, 20 | ||||||||
| IC 1459 | – | Y | 5, 21, 22, 22 | ||||||||
| IC 4296 | – | Y | 24, 18, 23, 25 | ||||||||
| Sgr A∗ | – | Y | 26, 26, 27, 27 | ||||||||
| NGC 221 | N | 28, 29, 30, 31 | |||||||||
| NGC 315 | N | 1, 18, 32, 32 | |||||||||
| NGC 507 | – | N | 1, 18, 10, 15 | ||||||||
| NGC 1291 | N | 33, 18, 34, 34 | |||||||||
| NGC 1316 | – | N | 12, 35, 36, 15 | ||||||||
| NGC 1332 | N | 5, 37, 38, 39 | |||||||||
| NGC 1399 | N | 12, 40, 16, 16 | |||||||||
| NGC 2681 | N | 5, 18, 32, 32 | |||||||||
| NGC 4261 | N | 5, 41, 14, 39 | |||||||||
| NGC 4278 | N | 24, 18, 32, 32 | |||||||||
| NGC 4438 | N | 1, 18, 14, 25 | |||||||||
| NGC 4594 | N∗ | 5, 42, 14, 23 | |||||||||
| NGC 4636 | N | 5, 18, 14, 16 | |||||||||
| NGC 4696 | – | N | 5, 18, 15, 15 | ||||||||
| NGC 4697 | N | 12, 43, 44, 44 | |||||||||
| NGC 5005 | N | 1, 18, 32, 32 | |||||||||
| NGC 5044 | – | N | 5, 18, 15, 15 | ||||||||
| NGC 5813 | – | N | 5, 18, 25, 15 | ||||||||
| NGC 5846 | – | N | 5, 18, 14, 15 | ||||||||
| NGC 6166 | – | N | 1, 18, 15, 15 |
Note. — Column 1: galaxy name; Column 2: distance; Column 3: BH mass; Column 4 and 5: electron temperature and density at the Bondi radius; Column 6: Bondi radius; Column 7: Bondi accretion rate normalized by the Eddington rate (); Column 8: Eddington ratio (); Column 9: angular size of the Bondi radius; Column 10: correction factor of density for unresolved sources; Column 11: Bondi resolved source = Y (the first 11 sources) and Bondi unresolved source = N (others); Column 12: references for the data of (, , , & ): (1) NED, (2) Bender et al. 2005, (3) Garcia et al. 2005, (4) Dosaj et al. 2002, (5) Tonry et al. 2001, (6) Rusli et al. 2013, (7) Zhang & Xu 2004, (8) Humphrey et al. 2006, (9) Emsellem et al. 1999, (10) Ho 2009, (11) Russell et al. 2015, (12) Blakeslee et al. 2009, (13) Walsh et al. 2010, (14) González-Martín et al. 2006, (15) Russell et al. 2013, (16) Loewenstein et al. 2001, (17) Gebhardt et al. 2011, (18) Kormendy & Ho 2013, (19) Shen & Gebhardt 2010, (20) Paggi et al. 2014, (21) Cappellari et al. 2002, (22) Fabbiano et al. 2003, (23) Pellegrini et al. 2003, (24) Blakeslee et al. 2001, (25) Pellegrini 2005, (26) Genzel et al. 2010, (27) Baganoff et al. 2003, (28) Blakeslee et al. 2010, (29) van den Bosch & de Zeeuw 2010, (30) Ho et al. 2003, (31) Mathews & Brighenti 2003, (32) Younes et al. 2011, (33) McCourt et al. 2011, (34) Irwin et al. 2002, (35) Nowak et al. 2008, (36) Lanz et al. 2010, (37) Rusli et al. 2011, (38) Humphrey & Buote 2004, (39) Humphrey et al. 2009, (40) Houghton et al. 2006, (41) Ferrarese et al. 1996, (42) Jardel et al. 2011, (43) Schulze & Gebhardt 2011, and (44) (Soria et al., 2006). Note that the angular size of the Bondi radius of the central SMBH in NGC 4594 might be marginally resolved within the error, but the spatial resolution of its Chandra observation reaches only .