Pressure tuning of structural and magnetic transitions in EuAg4As2
Abstract
We report temperature dependent measurements of ambient pressure specific heat, magnetic susceptibility, anisotropic resistivity and thermal expansion as well as in-plane resistivity under pressure up to 20.8 kbar on single crystals of EuAg4As2. Based on thermal expansion and in-plane electrical transport measurements at ambient pressure this compound has two, first order, structural transitions in 80 - 120 K temperature range. Ambient pressure specific heat, magnetization and thermal expansion measurements show a cascade of up to seven transitions between 8 and 16 K associated with the ordering of the Eu2+ moments. In-plane electrical transport is able to detect more prominent of these transitions: at 15.5, 9.9, and 8.7 K as well as a weak feature at 11.8 K at ambient pressure. Pressure dependent electrical transport data show that the magnetic transitions shift to higher temperatures under pressure, as does the upper structural transition, whereas the lower structural transition is suppressed and ultimately vanishes. A jump in resistivity, associated with the upper structural transition, decreases under pressure with an extrapolated disappearance (or a change of sign) by 30-35 kbar. In the 10 - 15 kbar range a kink in the pressure dependency of the upper structural transition temperature as well as the high and low temperature in-plane resistivities suggest that a change in the electronic structure may occur in this pressure range. The results are compared with the literature data for SrAg4As2.
I Introduction
Since the discovery of high temperature superconductivity in iron-arsenides, kam06a ; kam08a studies of the physical properties of large families of pnictide-based compounds have attracted a lot of attention. The interplay between different orders, such as the coexistence, competition and/or correlation of superconductivity, magnetism and structural phase transitions (or nematicity) in pnictides, ste11a ; chu15a ; zap17a ; boh17a made these families a playground for condensed matter physicists, chemists, and materials scientists. Europium - based pnictides occupy a special position in the family since they add local, Eu2+ magnetism to the complexity of the observed orders. zap17a
The new, trigonal, layered arsenide, EuAg4As2, and its non-magnetic counterpart, SrAg4As2, were first synthesized few years ago. sto12a In polycrystalline samples of EuAg4As2 a divalent nature of europium and antiferromagnetic order at K were determined from magnetization and 151Eu Mössbauer measurements. ger13a More recently, detailed structural, thermodynamic and transport studies of single crystals of EuAg4As2 revealed a complex physical picture that includes a structural distortion at 120 K and incommensurate, non-collinear long - range antiferromagnetism developing at 9 K. she18a The magnetic transition at K ger13a , based on detailed recent 151Eu Mössbauer data, rya19a was suggested to be a transition from paramagnetic state to an incommensurate sine-modulated long range order. Motivated by the complexity and interplay of different orders in EuAg4As2 as well as reported curious, non-monotonic pressure dependence of the structural transition in its non-magnetic analogue, SrAg4As2, she18b in this work we study tunability of magnetic and structural transitions in EuAg4As2 by hydrostatic pressure via in-plane resistivity measurements.
II Experimental details
Single crystals of EuAg4As2 were grown out of a high temperature melt with an excess of Ag2As. Details of of the synthesis can be found elsewhere. she18a Resulting plate-like single crystals ( - axis perpendicular to the plates) were of several mm in-plane dimensions and over a mm thick. In order to allow ambient pressure comparison, a detailed set of ambient pressure measurements was done on the particular batch of crystals that was later used for transport measurements under pressure. Ambient pressure, in-plane and -axis ac ( Hz) resistivity measurements were performed in a standard, linear, four-probe configuration using an ACT option of a Quantum Design Physical Property Measurement System (PPMS). Electrical contacts to the sample were made using Epotek H20 silver epoxy. Magnetization measurements were performed in a Quantum Design MPMS3 magnetometer. Low temperature heat capacity measurements were made using semi-adiabatic thermal relaxation technique as implemented in the heat capacity option of the Quantum Design PPMS. Anisotropic thermal expansion measurements were carried out using an OFCH copper capacitive dilatometer. sch06a
In-plane resistivity measurements under pressure were performed in a hybrid, Be-Cu / Ni-Cr-Al piston - cylinder pressure cell (modified version of the one used in Ref. bud86a, ) in the temperature environment provided by a PPMS instrument. A 40 : 60 mixture of light mineral oil and n-pentane was used as a pressure-transmitting medium.This medium solidifies at room temperature in the pressure range of 30 - 40 kbar, bud86a ; kim11a ; tor15a which is above the maximum pressure in this work. Elemental Pb was used as a low temperature pressure gauge. eil81a The measurements were performed both on increase and decrease of pressure and the results are reversible. It has been known its64a ; its67a ; bec76a ; fuj80a ; tho84a that in piston-cylinder pressure cells high temperature pressures are different from low temperature pressures and the temperature dependence of this pressure difference is non-trivial. Given that the temperature/pressure relation for this specific cell/pressure medium combination has not been established, here we simply use the Pb gauge pressure value. This may give rise to pressure differences, at higher temperatures, of up to 3 kbar.
III Results
III.1 Ambient Pressure
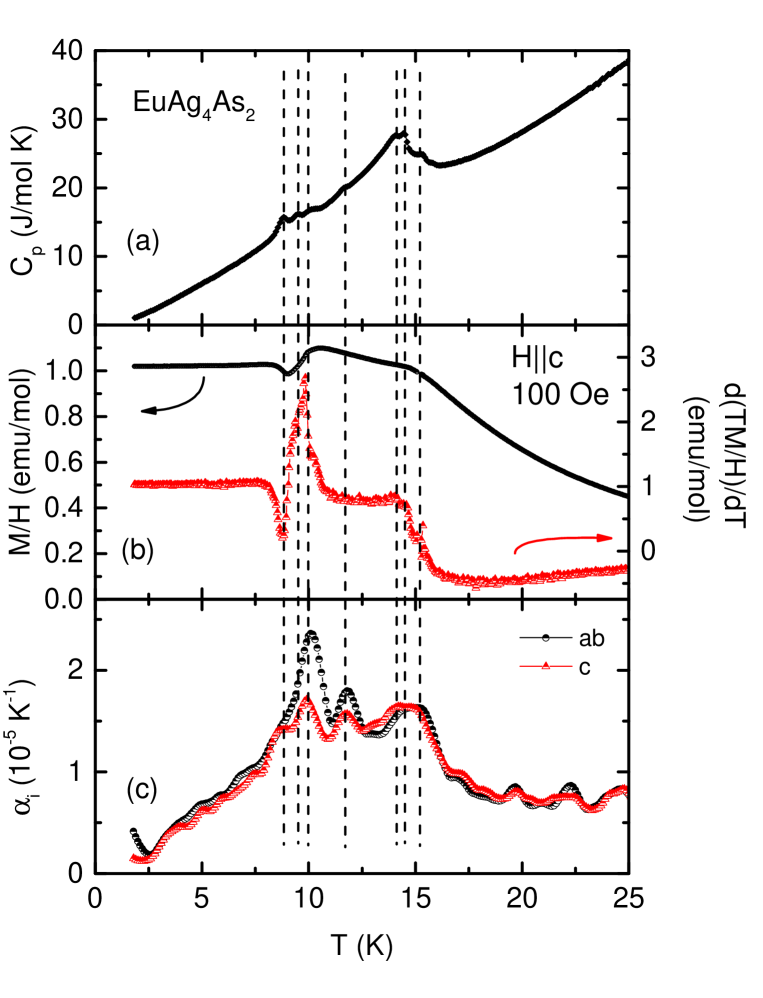
Low temperature heat capacity data are shown in Fig. 1(a). The data are complex and suggest up to seven transitions (marked with vertical dashed lines), occur in EuAg4As2 below 16 K as the Eu2+ moments order. Low temperature, low field magnetic susceptibility, and its derivative in a form of fis62a have anomalies at similar temperatures (Fig. 1(b)), although the one at K is not discernible, at least for . This identification of possible transition temperatures show fair agreement with the anisotropic thermal expansion data shown in Fig. 1(c). Altogether, three different thermodynamic measurements indicate as many as seven, closely spaced low temperature transitions. Such a density of transitions is remarkable, but not unprecedented; CeSb has seven transitions between 8 and 18 K in zero applied magnetic field and even and even larger number of additional transitions in applied fields. wie00a
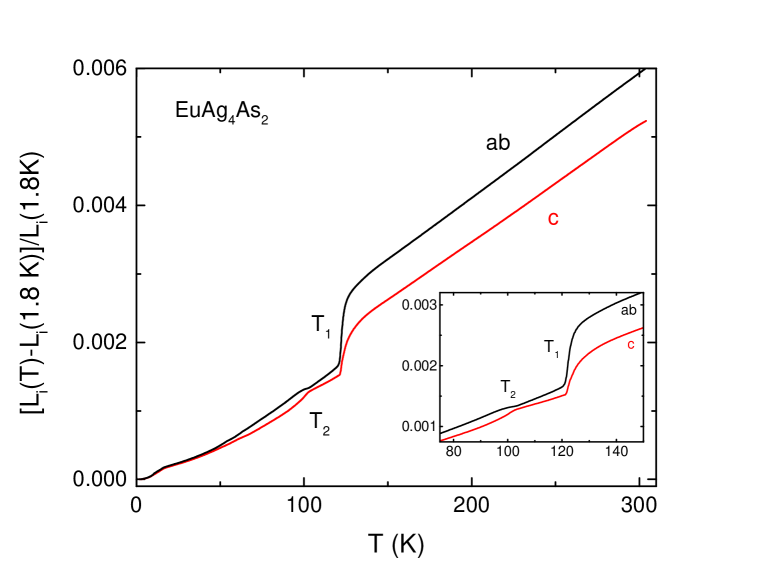
Anisotropic thermal expansion (Fig. 2) serves as a thermodynamic probe of the phase transitions (the structural ones in particular). Indeed, both structural phase transitions are clearly seen in the thermal expansion data, where is the sample’s length, either along the -axis or in - plane. Whereas the lattice change is large and in the same direction for both lattice parameters at the transition, the response smaller and is anisotropic for the transition. Below 17 K, up to five of the seven transitions detected in specific heat and magnetization data are also seen in the thermal expansion coefficients (Fig. 1(c)). The changes of the thermal expansion coefficients through the magnetic transitions are qualitatively similar for both orientations. There are no obvious anomalies in the anisotropic thermal expansion data at and above K, thus the anomaly detected in resistivity data in this temperature range is either associated with a very broad and subtle structural transition, or is some artifact pertinent to transport measurements. Additional studies are required to address this issue.
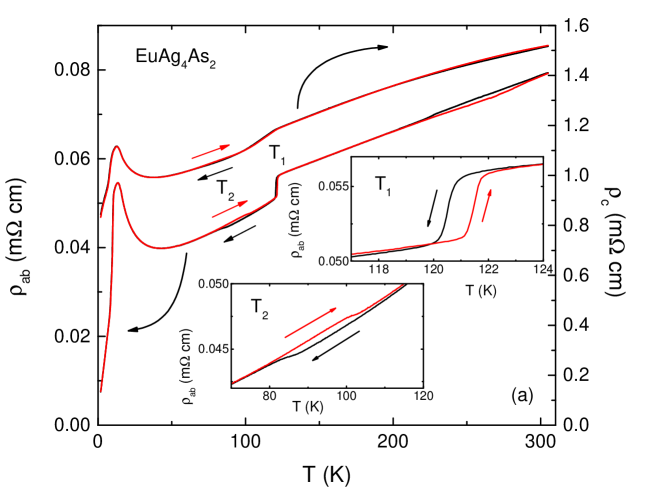
Anisotropic ambient pressure resistivity is shown in Fig. 3(a). There are several points of note. The in-plane residual resistivity ratio, in this work, is almost a factor of 2 higher than that in Ref. she18a, that suggests better crystallinity or fewer defects and impurities. The structural phase transition is sharper and K higher than reported. she18a Moreover, another, hysteretic, possibly structural transition can be detected in the 85 - 100 K range. These two transitions are also seen, although somewhat less clearly, in the - axis resistivity data. There might also be another, very broad and hysteretic, transition above K (Fig. 3(a)).
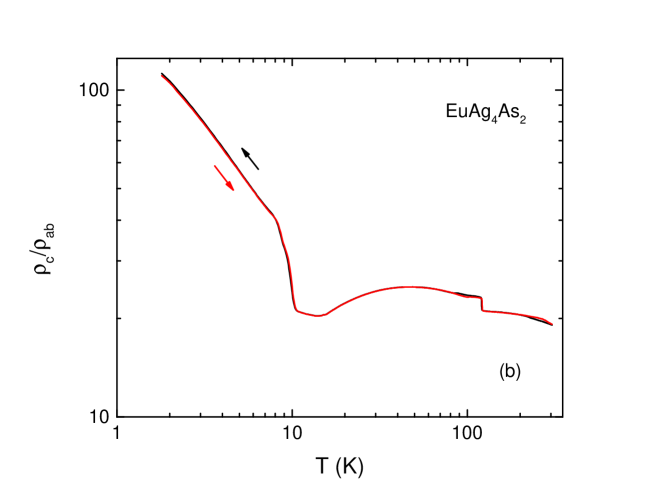
At room temperature the anisotropy of resistivity, is about 20 (Fig. 3(b)). This value changes significantly through the structural and magnetic transitions thus reflecting anisotropic contribution of related changes in scattering and electronic structure to the electronic transport properties. The value of reaches at the base temperature. This may be primary associated with the large residual resistivity, , term (smaller RRR value) found for the data. As expected, the behavior of is very similar, on log-log scale, for the data taken on cooling and on warming with slight differences seen for the transition and above K. An K difference is present in the data for the transition, even if it is not clearly seen on the large scale log-log plot of Fig. 3(b). Both in-plane and - axis resistivities have pronounced upturn above magnetic ordering. This upturn is probably due to scattering on magnetic fluctuations.
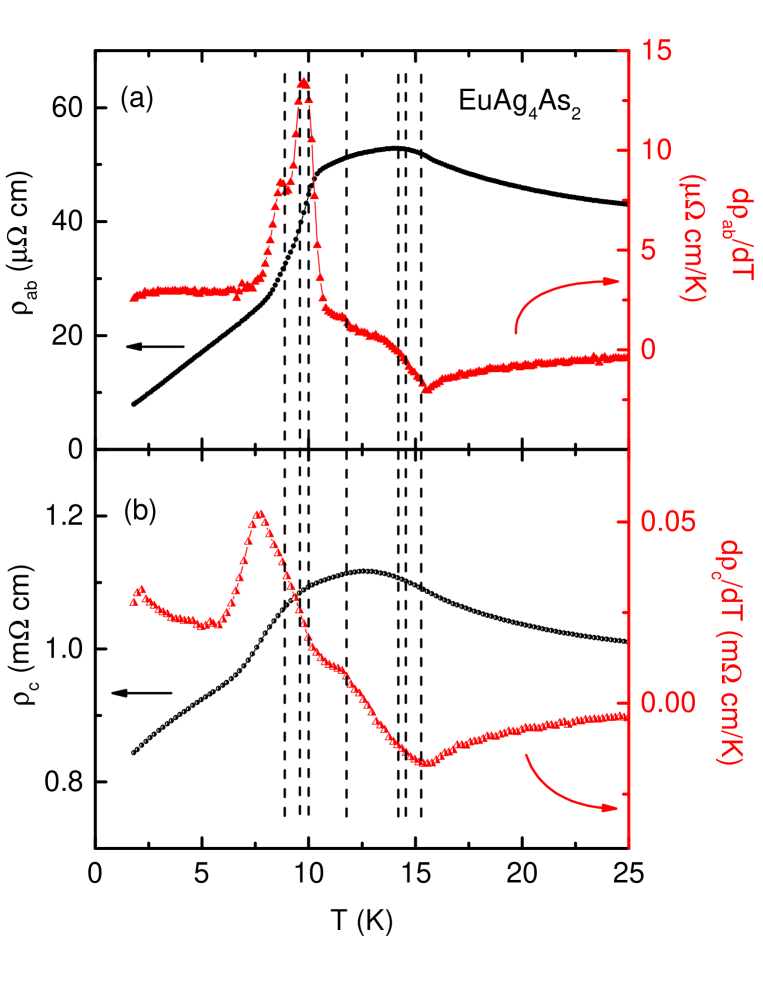
The low temperature part of the in-plane resistivities, and , together with their respective temperature derivatives, and are shown in Fig. 4(a),(b). There are three clear features in the , suggesting three transitions at 15.5 K, 9.9 K, and 8.7 K, fis68a as well as another, possibly spin reorientation transition, at about 11.7 K . The corresponding feature in and its derivative is rather subtle. The out-of-plane resistivity data give the same transition temperatures if for two lower transitions different criterion, the middle point of the increase in tau16a is utilized.
The comparison of low temperature thermodynamic (Fig. 1) and transport (Fig. 4) data leads to several conclusions. The feature in at K does not have its counterpart in any of the thermodynamic measurements presented in Fig. 1 so it does not seem to be related to a thermodynamic phase transition. Although the low temperature transitions seen in are only a subset of the transitions occurring in EuAg4As2, they do correlate with the primary features and span of the transitions detected and can serve as a caliper of how the magnetism in EuAg4As2 responds to pressure.
Based on the above, measurements of the in-plane resistivity allow for tracking of two high temperature structural transitions as well as of a subset of the low temperature magnetic transitions. In the following we present the measurements under pressure in order to provide an initial mapping of the phase diagram for EuAg4As2.
III.2 Resistivity under Pressure
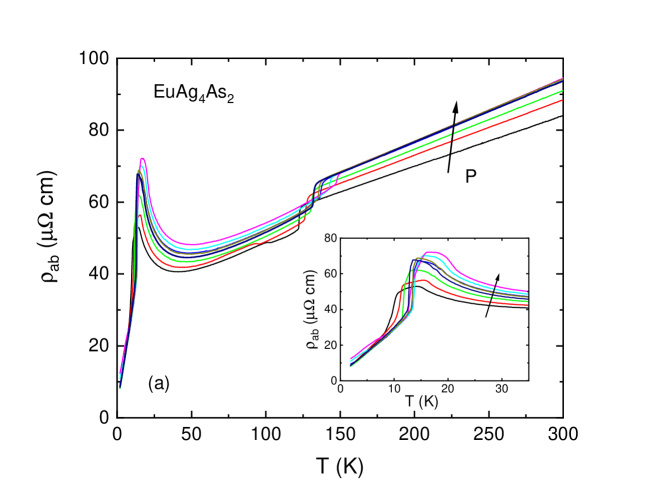
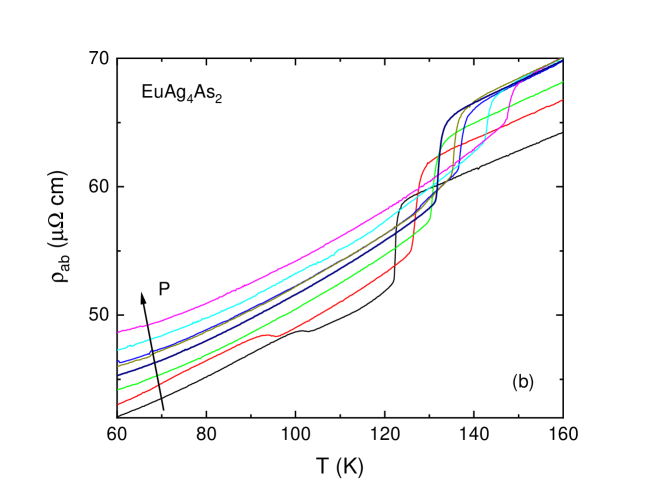
The evolution of the in-plane resistivity under pressure up to 20.8 kbar is shown in Fig. 5. With applied pressure, the upper structural transition moves up, as do the lower temperature, magnetic transitions. The lower structural transition appears to move down under pressure (Fif. 5(b)) and soon becomes undetectable. As pressure increases, the upturn above the magnetic transitions becomes more pronounced and, away from the phase transition temperatures, the resistivity generally increases too.
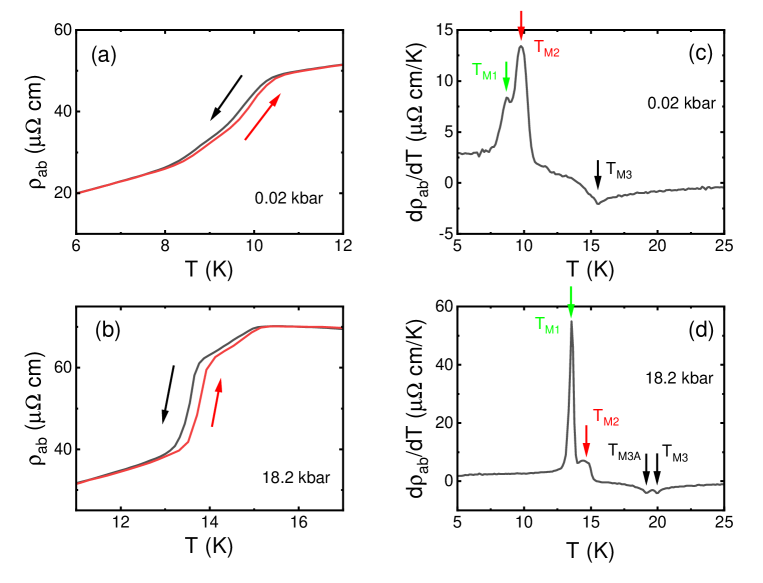
The low temperature resistivity for two representative pressures, 0.02 kbar and 18.2 kbar are shown in figures 6 (a),(b), respectively. (Note that the 0.02 kbar data are very close to the ambient pressure data taken outside the pressure cell, that suggests that for measurements protocol used the thermal mass of the pressure cell has no significant effect on the size of hysteresis.) At higher pressure the magnetic transitions are sharper and the hysteresis is larger. It should be noted that the upper magnetic transition () that appears as a single anomaly at low pressures (Fig. 6(c)) appears as two anomalies at higher pressures (Fig. 6(d)) indicating that either it splits under pressure or one of the neighboring, ambient pressure transitions becomes resolvable as pressure is increased (Fig. 7).
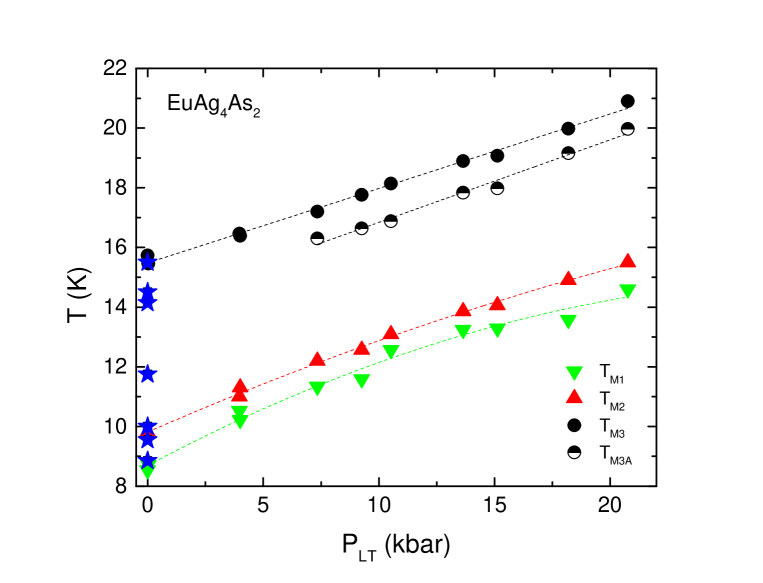
Figure 7 presents the pressure dependence of the three magnetic transitions as resolved by in-plane resistivity measurements. The two lower transition temperatures, and , increase under pressure, the higher one, , splits into two ( and ) at and above kbar. Whereas and , increase linearly under pressure with the pressure derivatives K/kbar and K/kbar, for the lower transitions, and , the behavior under pressure is better fit with the second order polynomial with the initial () values of the derivatives K/kbar and K/kbar.
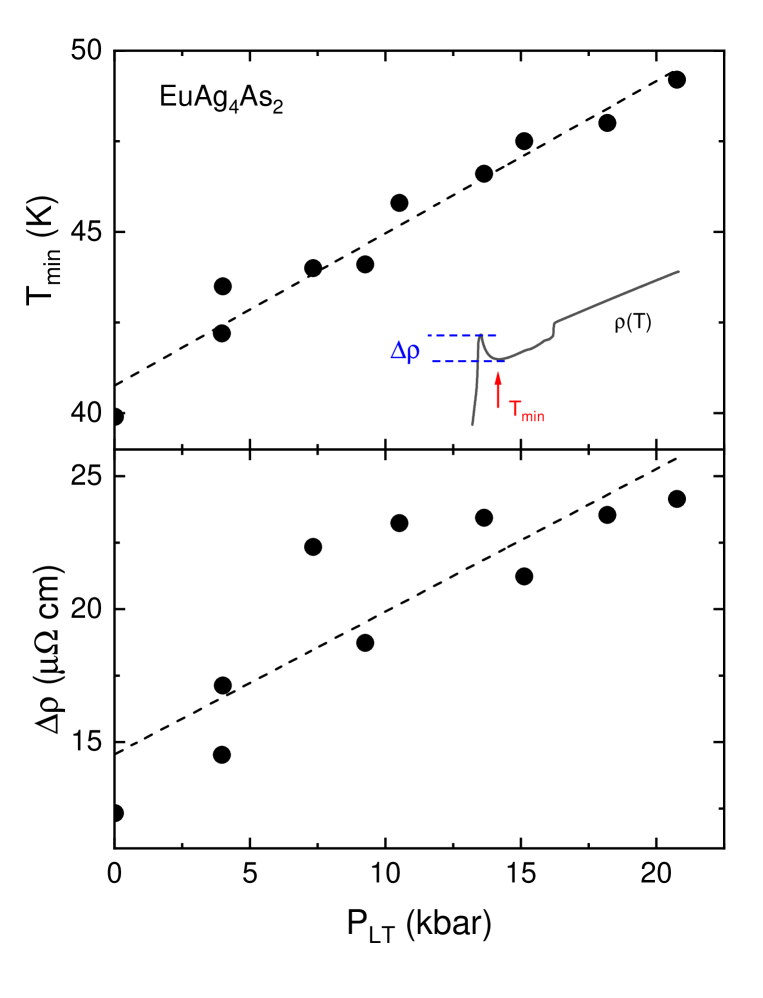
The resistivity minimum that precedes these magnetic transitions (Fig. 8) shifts to higher temperatures under pressure at the rate of 0.42 K/kbar, which is faster than the upper magnetic transition. The size of the resistivity upturn also increases under pressure (Fig. 8). At least in part this is simply due to the increase of the temperature range over which the upturn is observed.
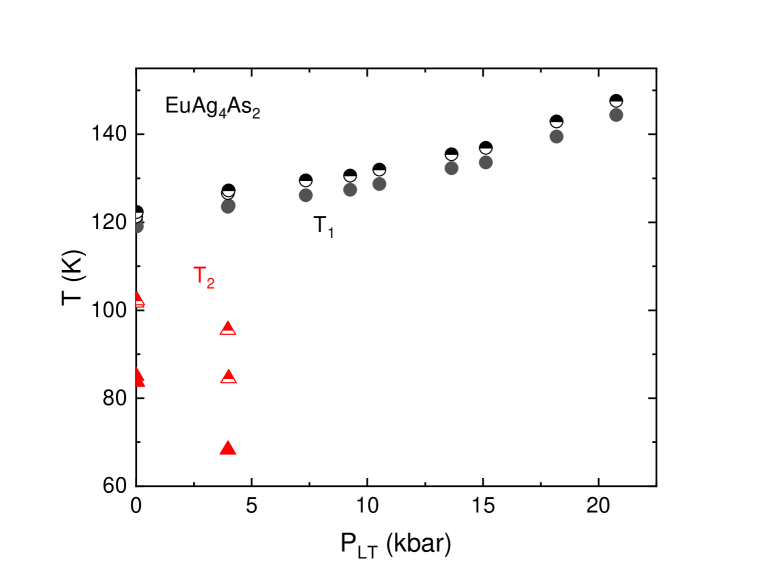
Now we turn to structural phase transitions under pressure. As seen in figures 5 and 9, the higher structural transition, , is observed in all pressure range of this work. The transition temperature increases under pressure. The behavior clearly changes between two pressure ranges: below kbar the is linear, with K/kbar, whereas above kbar the pressure derivative changes by factor of 2, to K/kbar. The thermal hysteresis, K is basically pressure independent. Lower structural transition, , initially decreases under pressure with the rate of in-between - 3 and -4 K/kbar. Its signature in , even at ambient pressure, is rather subtle and we are not able to detect it any more at and above kbar, possibly because rather strong, non-monotonic background.
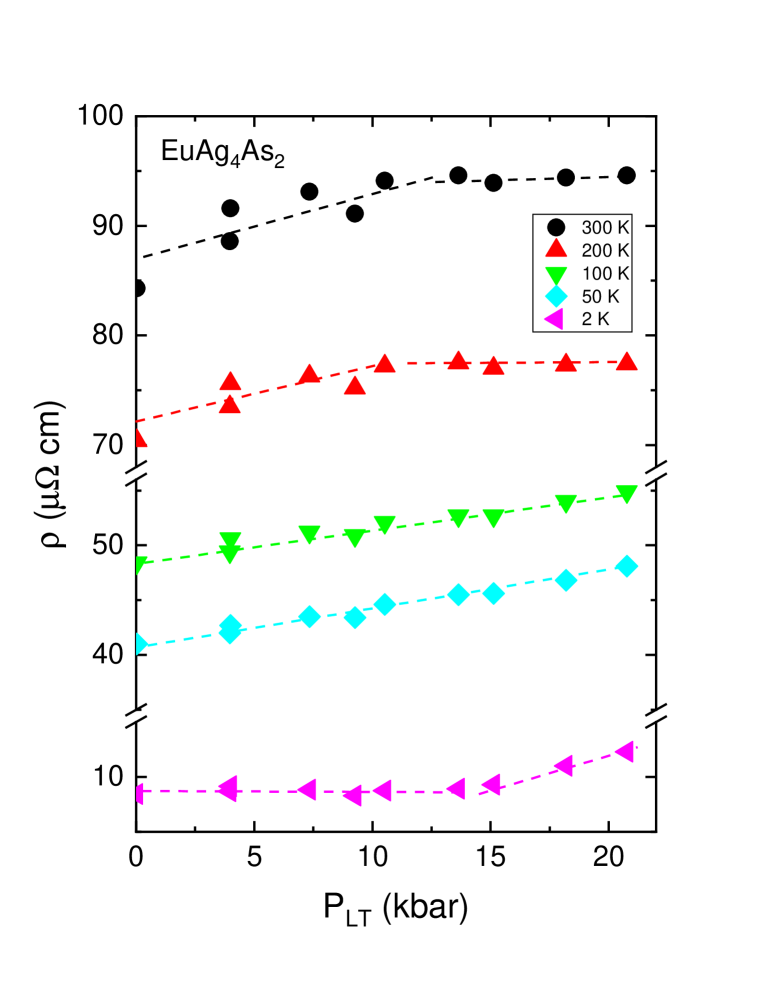
It is noteworthy, that a weak, but discernible, anomaly in the 10-15 kbar range is also observed in pressure dependencies of the high and low temperature resistivity data, both above and below all noted transition temperatures. (Fig. 10).
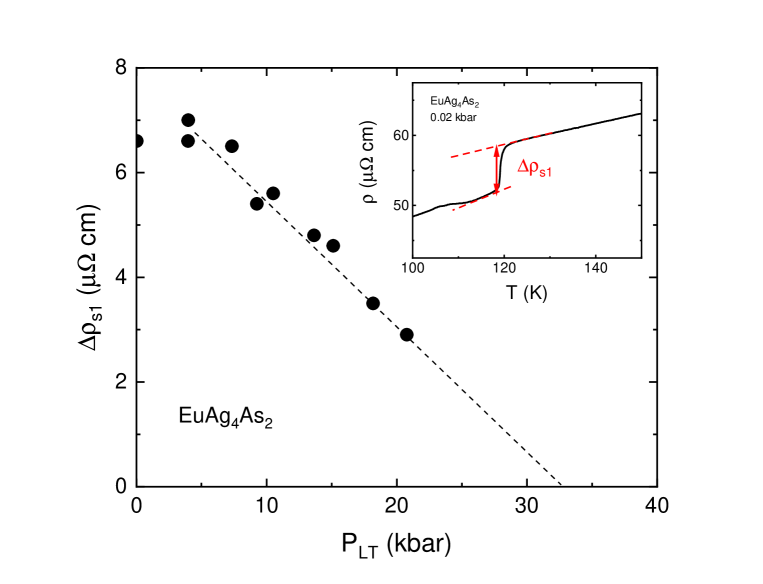
Finally, we can analyze the change the jump in resistivity at the upper structural transition as a function of pressure (Fig. 11). Its value decreases under pressure with linear extrapolation to at kbar, that would correspond the (extrapolated) value of K. There are several possible scenarios of what might happen above kbar. Most probably, the structural transition will continue to exist with the transition temperature increasing further under pressure, however either without discernible feature in , or with inversion of such feature (decrease of at on warming).
IV Discussion and Summary
Our resistivity measurements under pressure as well as ambient pressure thermodynamic and transport measurements further underscore the complexity of EuAg4As2 as a host for a multitude of structural and magnetic phases. In addition to documenting the evolution of different phases under pressure this work provides a roadmap for further studies, if undertaken.
The signs of the initial pressure derivatives of the structural and magnetic phase transitions are consistent with those inferred from the combination of the specific heat data and the thermal expansion data in this work via Clausius - Clapeyron (1st order phase transitions) or Ehrenfest (2nd order phase transitions) relations. bar99a It is curious though that given the anisotropic, trigonal structure of EuAg4As2, its in-plane and -axis thermal expansion evolution is similar for the higher structural () and all three magnetic transitions, and only at lower structural transition different signs of thermal expansion are observed (Fig. 2).
The resistivity of EuAg4As2 over wide temperature ranges increases under pressure, suggesting either pressure - induced decrease of the density of states at the Fermi level, or decrease of mobility (increase of effective mass). Note that for the related compound, SrAg4As2, the opposite trend, a decrease of the in-plane resistivity under pressure was reported. she18b
The magnetic transitions shift to higher temperatures under pressure. The values of the pressure derivatives are rather conventional.
The nature of the lower structural transition, , and its evolution under pressure above kbar would require careful scattering studies to better understand. It is of interest, assuming this transition can be suppressed down to K, if it has, even subtle, effect on the magnetic transitions.
The upper structural transition temperature, , increases under pressure with a kink in at kbar, whereas the jump in associated with it gets smaller. Linear extrapolation suggests that the jump will disappear at 30-35 kbar. This behavior is very different from that of the structural transition in SrAg4As2 she18b that has a minimum at kbar both in and in . Further studies are required to understand what will happen with the upper structural transition and its signature in the in-plane resistivity, and, broadly speaking, to the electronic structure, above kbar.
The anomaly in the higher temperature, structural phase transition, , behavior in the 10-15 kbar range is also present in the data both above and below all noted transition temperatures. Are these anomalies associated with changes in the electronic structure and what is the origin of these changes? This question will require further studies. Additionally, some understanding of the nature of the differences in pressure response of EuAg4As2 and SrAg4As2 would be desirable.
Acknowledgements.
The authors thank Dominic Ryan and Elena Gati for useful discussions. Work at the Ames Laboratory was supported by the U.S. Department of Energy, Office of Science, Basic Energy Sciences, Materials Sciences and Engineering Division. The Ames Laboratory is operated for the U.S. Department of Energy by Iowa State University under contract No. DE-AC02-07CH11358. L.X. was supported, in part, by the W. M. Keck Foundation. Work at UCLA was supported by the U.S. Department of Energy, Office of Science, Office of Basic Energy Sciences under Award Number DE-SC0011978.References
- (1) Yoichi Kamihara, Hidenori Hiramatsu, Masahiro Hirano, Ryuto Kawamura, Hiroshi Yanagi, Toshio Kamiya, and Hideo Hosono, J. Am. Chem. Soc. 128, 10012 (2006).
- (2) Yoichi Kamihara, Takumi Watanabe, Masahiro Hirano, and Hideo Hosono, J. Am. Chem. Soc. 130, 3296 (2008).
- (3) G. R. Stewart, Rev. Mod. Phys. 83, 1589 (2011).
- (4) A. Chubukov and P. J. Hirschfeld, Phys. Today 68, 46 (2015).
- (5) Sina Zapf and Martin Dressel, Rep. Prog. Phys. 80, 016501 (2017).
- (6) Anna E. Böhmer and Andreas Kreisel, J. Phys.: Cond. Mat. 30, 023001 (2017).
- (7) Stanislav S. Stoyko, Mansura Khatun, C. Scott Mullen, and Arthur Mar, J. Solid State Chem. 192, 325 (2012).
- (8) Birgit Gerke, Christian Schwickert, Stanislav S. Stoyko, Mansura Khatun, Arthur Mar, and Rainer Pöttgen, Solid State Sci. 20, 65 (2013).
- (9) Bing Shen, Chaowei Hu, Huibo Cao, Xin Gui, Eve Emmanouilidou, Weiwei Xie, and Ni Ni, preprint, arXiv:1809.07317 (2018).
- (10) D. H. Ryan, Sergey L. Bud’ko, Chaowei Hu, and N. Ni, AIP Advances 9, 125050 (2019).
- (11) Bing Shen, Eve Emmanouilidou, Xiaoyu Deng, Alix McCollam, Jie Xing, Gabriel Kotliar, Amalia I. Coldea, and Ni Ni, Phys. Rev. B 98, 235130 (2018).
- (12) G. M. Schmiedeshoff, A. W. Lounsbury, D. J. Luna, S. J. Tracy, A. J. Schramm, S. W. Tozer, V. F. Correa, S. T. Hannahs, T. P. Murphy, E. C. Palm, A. H. Lacerda, S. L. Bud’ko, P. C. Canfield, J. L. Smith, J. C. Lashley, and J. C. Cooley, Rev. Sci. Instrum. 77, 123907 (2006).
- (13) S. L. Bud’ko, A. N. Voronovskii, A. G. Gapotchenko, and E. S. ltskevich, Zh. Eksp. Teor. Fiz. 86, 778 (1984) [Sov. Phys. JETP 59, 454 (1984)].
- (14) S. K. Kim, M. S. Torikachvili, E. Colombier, A. Thaler, S. L. Bud’ko, and P. C. Canfield, Phys. Rev. B 84, 134525 (2011).
- (15) M. S. Torikachvili, S. K. Kim, E. Colombier, S. L. Bud’ko, and P. C. Canfield, Rev. Sci. Instrum. 86, 123904 (2015).
- (16) A. Eiling and J. S. Schilling, J. Phys. F: Met. Phys. 11, 623 (1981).
- (17) E. S. Itskevich, Cryogenics, 4, 365 (1964).
- (18) E. S. Itskevich, A. N. Voronovskii, A. F. Gavrilov, and V. A. Sukhaparov, Cryogenics 7, 359 (1967).
- (19) W.M. Becker, Kuong Hoo, and P.G. Winchell, Rev. Sci. Instrum. 47, 587 (1976).
- (20) Hiroshi Fujiwara, Hideoki Kadomatsu, and Kiyokazu Tohma, Rev. Sci. Instrum. 51, 1345 (1980).
- (21) J. D. Thompson, Rev. Sci. Instrum. 55, 231 (1984).
- (22) M. E. Fisher, Philos. Mag. 7, 1731 (1962).
- (23) T. A. Wiener and P. C. Canfield, J. Alloys Compd. 303-304, 505 (2000).
- (24) M. E. Fisher and J. S. Langer, Phys. Rev. Lett. 20, 665 (1968).
- (25) Valentin Taufour, Udhara S. Kaluarachchi, Rustem Khasanov, Manh Cuong Nguyen, Zurab Guguchia, Pabitra Kumar Biswas, Pietro Bonfà, Roberto De Renzi, Xiao Lin, Stella K. Kim, Eun Deok Mun, Hyunsoo Kim, Yuji Furukawa, Cai-Zhuang Wang, Kai-Ming Ho, Sergey L. Bud’ko, and Paul C. Canfield, Phys. Rev. Lett. 117, 037207 (2016).
- (26) T. H. K. Barron and G. K. White, Heat Capacity and Thermal Expansion at Low Temperatures (Kluwer, New York, 1999).