In-beam -ray and electron spectroscopy of 249,251Md
Abstract
The odd- 251Md nucleus was studied using combined -ray and conversion-electron in-beam spectroscopy. Besides the previously observed rotational band based on the configuration, another rotational structure has been identified using - coincidences. The use of electron spectroscopy allowed the rotational bands to be observed over a larger rotational frequency range. Using the transition intensities that depend on the gyromagnetic factor, a single-particle configuration has been inferred for this band, i.e., the ground-state band. A physical background that dominates the electron spectrum with an intensity of 60% was well reproduced by simulating a set of unresolved excited bands. Moreover, a detailed analysis of the intensity profile as a function of the angular momentum provided a method for deriving the orbital gyromagnetic factor, namely for the ground-state band. The odd- 249Md was studied using -ray in-beam spectroscopy. Evidence for octupole correlations resulting from the mixing of the and Nilsson orbitals were found in both 249,251Md. A surprising similarity of the 251Md ground-state band transition energies with those of the excited band of 255Lr has been discussed in terms of identical bands. Skyrme-Hartree-Fock-Bogoliubov calculations were performed to investigate the origin of the similarities between these bands.
pacs:
I Introduction
Despite significant and steady advances in the synthesis of the heaviest elements, reaching the predicted superheavy island of stability is still a distant objective, because of the ever-decreasing cross sections. Nevertheless, nuclear spectroscopy, mass measurements and laser spectroscopy of the heaviest nuclei have shown their effectiveness by providing information on the quantum nature of extreme mass nuclei Block et al. (2010); Theisen et al. (2015); Asai et al. (2015); Ackermann and Theisen (2017); Raeder et al. (2018), without which the nuclei would no longer be bound beyond . On the theoretical side, the island of enhanced stability has been predicted either around the proton number =114, 120, or 126 and neutron number =172 or 184 Ćwiok et al. (1996); Rutz et al. (1997); Bürvenich et al. (1998); Bender et al. (1999); Dobaczewski et al. (2015). The validity of these predictions in a region where the models are extrapolated is hence questionable, as is the concept of magic numbers in this region Bender et al. (2001). It is therefore essential to compare predictions to comprehensive, reliable and relevant spectroscopic data, in particular for deformed midshell nuclei where a large diversity of orbitals are accessible, some of which are involved in the structure of heavier spherical nuclei, i.e., placed just above and below the predicted superheavy spherical shell gaps.
The present study of the odd- 249,251Md nuclei is an integral part of this approach by providing inputs in terms of both proton single-particle and collective properties. We report on the previously unobserved ground-state (g.s.) band of 251Md, assign its single-particle configuration, and deduce the gyromagnetic factor. We also discuss the most intense transition observed in 251Md using both -ray and conversion-electron spectroscopy, and in 249Md using -ray spectroscopy alone, as being compatible with octupole correlations. Finally, a comparison of 251Md with the 255Lr nucleus revealed unexpected similarities between transition energies. The mechanism leading to these identical bands has been tested with Hartree-Fock-Bogoliubov (HFB) calculations using a Skyrme functional and several parametrizations of pairing correlations.
II Experimental details
The experiments were performed at the Accelerator Laboratory of the University of Jyväskylä. The 251Md nuclei were populated using the fusion-evaporation reaction 205Tl(48Ca,)251Md. The 48Ca beam was provided at 218 MeV, resulting in an energy at the middle of the target of 214 MeV, at which the fusion-evaporation cross section is about 760 nb Chatillon et al. (2007). An average beam intensity of 9 particle nA was delivered during 230 h of data taking. The 205Tl targets, 99.45 % enrichment, 300 g/cm2 thick, were sandwiched between a C backing of 20 g/cm2 and a C protection layer of 10 g/cm2.
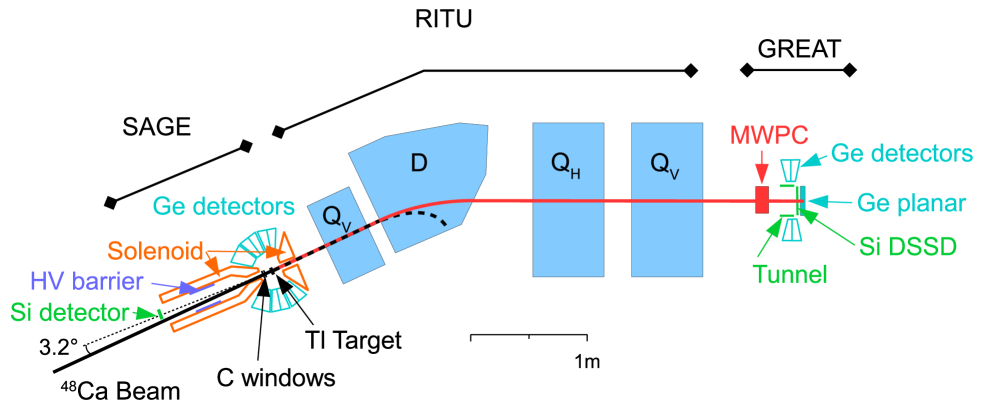
The experimental setup is schematically represented in Fig. 1. The 251Md nuclei were separated from the beam and other unwanted products using the Recoil Ion Transport Unit (RITU) gas-filled recoil separator Leino et al. (1995); Sarén et al. (2011) operated at a He gas pressure of 0.4 mbar. The recoiling nuclei were detected using the Gamma Recoil Electron Alpha Tagging (GREAT) focal plane spectrometer Page et al. (2003). After passing through a multiwire proportional chamber (MWPC), ions were implanted in a set of two side-by-side 300-m-thick double-sided silicon strip detectors (DSSDs). Each DSSD had a size of 6040 mm with 1-mm strips pitch in both and directions. The total DSSD counting rate was approximately 250 Hz. The amplification on the side was set to a high gain in order to optimize the detection of low-energy conversion electrons in a range of approximately 50-600 keV. The side was amplified using a lower gain in order to cover energies up to approximately 15 MeV. Besides the RITU filter, an additional selection of the ions of interest was made using a contour gate on the the energy-loss measured in the MWPC versus the time-of-flight (ToF) measured between the MWPC and the responding DSSD. The tunnel detectors and the planar and Clover Ge focal-plane detectors were operated during the experiment but not used in the present analysis. The combined transmission and detection efficiency for the 251Md residues was estimated at 30%. Formal identification using the characteristic decay (recoil-decay tagging) was not effective due to the low -decay branching ratio of 9.5% for 251Md Chatillon et al. (2006). Therefore only the recoil-tagging technique was used, which is adequate since only the reaction channel of interest is open.
Gamma-rays and conversion-electrons emitted at the target position were detected using an array known as Silicon And GErmanium (SAGE) Pakarinen et al. (2014): -rays were detected using Compton-suppressed HPGe detectors (20 coaxial and 24 clovers) having a total -ray photopeak efficiency of 10% at 200 keV and an average energy resolution of 2.8 keV FWHM at 1 MeV. A stack of 0.5-mm-thick Cu and 0.1-mm-thick Sn absorbers were placed in front of the Ge detectors to reduce the contribution of fission-fragments x-rays. The detection threshold was approximately 20 keV. The maximum counting rate of each coaxial (clover) crystal was kept below 30 (20) kHz. After being transported by a solenoid placed upstream the target and tilted 3.2∘ with respect to the beam axis, electrons were detected in a 90-fold segmented Si detector with a thickness of 1 mm and an active diameter of 48 mm. The electron detection efficiency peaks at 6% for an energy of 120 keV with an average energy resolution of 6.5 keV FWHM in the 50- to 400-keV energy range. Low-energy atomic electrons were partly suppressed using an electrostatic barrier biased at -35 kV. The separation between the He gas-filled region and the upstream beam line, including the electrostatic barrier region, was made using two 50-g/cm2 C foils. The maximum counting rate of each segment was kept below 15 kHz. The detection threshold was approximately 30 keV. Contour gates constraining SAGE time versus the ToF, and SAGE energy versus SAGE time were used to clean the spectra. These gates were left wide enough to favor the statistics when using - coincidences (Secs. III.1 and IV). For an analysis that requires intensity measurement, the gates were tightened to favor cleanliness (Secs. III.2 and III.3). This can lead, however, to a systematic error in the relative intensities of conversion electrons versus rays that was estimated at 20 %. Digital signal processing was used for the SAGE array (100 MHz, 14 bits) while signals from the MWPC and the DSSDs were processed using standard analog electronics and peak sensing analog to digital converters.
The experimental conditions for the study of 249Md were similar and are detailed in Ref. Briselet et al. (2019). In brief, the nuclei of interest were produced using the fusion-evaporation reaction 203Tl(48Ca,)249Md. The 203Tl targets, 97.08 % enrichment, 280 g/cm2 thick, were sandwiched between a C backing of 20 g/cm2 and a C protection layer of 11 g/cm2. The 48Ca beam was delivered at a beam energy of 219 MeV, resulting in an energy of 215 MeV in the middle of the target. Data were taken during 80 h with a beam intensity of 13 pnA. Only rays were collected.
III Rotational bands in 251Md
III.1 -ray spectroscopy
The -ray singles spectrum resulting from the recoil-tagging technique is shown in Fig. 2(a). The previously observed rotational band structure, interpreted as being built on the proton Nilsson orbital Chatillon et al. (2007), is shown in Fig. 2(b). The spectrum was created from a sum of gates on the peaks of interest, projected from a matrix of recoil-gated - coincidences. Compared to the previous work, we cannot confirm the proposed transition at the highest rotation frequency with an energy of 483(1) keV for which only six counts were observed Chatillon et al. (2007). We instead suggest a transition at 478(2) keV for which eight counts were collected in the present work. There is also evidence for an additional transition with an energy of 513(1) keV ( 12 counts). A structure with a -ray spacing of about half of the former has been found, and is therefore consistent with transitions within the two signature partners of a rotational structure [Fig. 2(c)]. Despite the low statistics, each transition resulting from the - analysis has been found in mutual coincidence with at least four other transitions in the same band. It should be noted that the transition at 334 keV is a doublet with the 335 keV transition of the band. For the sake of clarity, a partial level scheme summarizing the results of this work is provided in Fig. 3.
The single-particle configurations considered in the following for the previously unobserved band are those predicted at low energy by the macroscopic-microscopic models used in Ref. Heßberger et al. (2001); Ćwiok et al. (1994); Parkhomenko and Sobiczewski (2004); Shirikova et al. (2013) and the self-consistent models used in this work (see Sec. V.2) as well as those observed by decay spectroscopy in the neighboring Md isotopes Heßberger et al. (2001); Antalic et al. (2010), which reduces the alternatives to the ground-state and to the single-particle configurations.
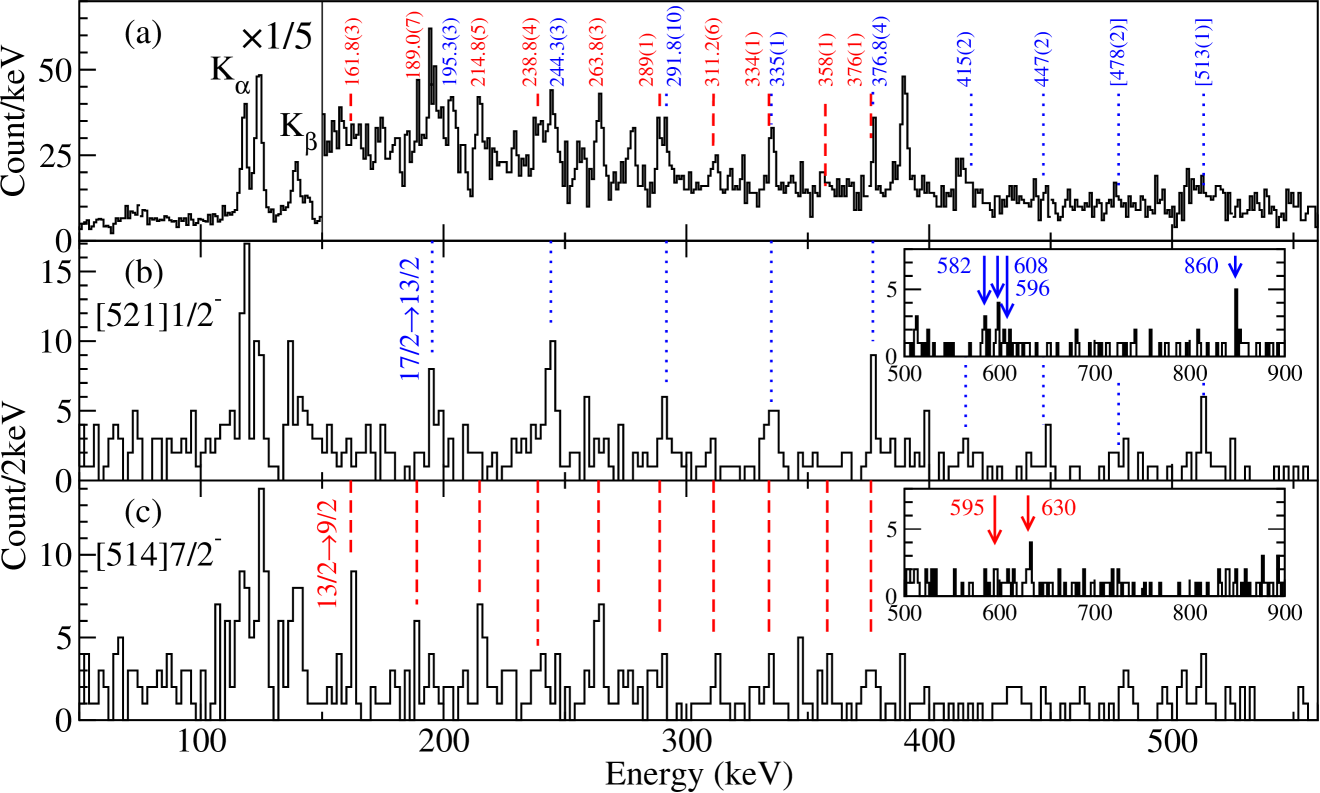
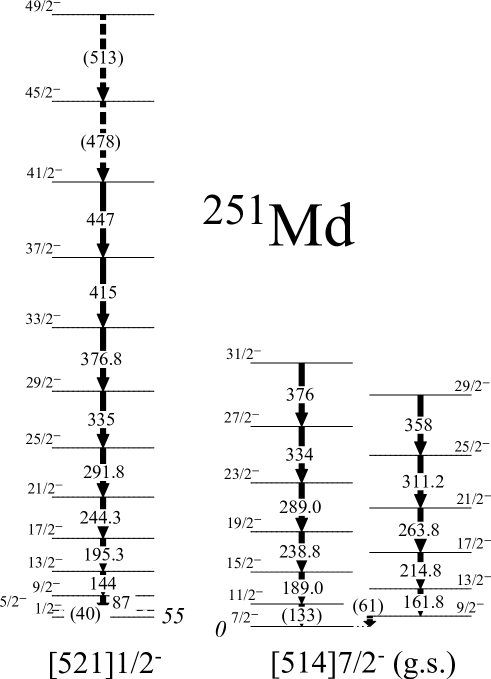
Considering therefore a band-head angular momentum for the new band, we can compare the experimental kinematic moment of inertia calculated using different angular momenta hypotheses for the transitions (or in other words the number of unobserved transitions), with the predictions of Chatillon et al. Chatillon et al. (2007), He et al. He et al. (2009) and Zhang et al. Zhang et al. (2012). The best agreement has been obtained using for the transition at 161.8 keV. Extrapolating the moment of inertia at lower rotational frequencies yields an energy of 133 keV for the unobserved transition, and an energy of 61 keV for the one. The latter is in perfect agreement with the decay spectroscopy of Asai et al. Asai et al. (2015), which provides an energy of 62 keV for the first member of the rotational g.s. band.
As shown in the inset of Figs. 2(b) and 2(c), the two rotational bands are in coincidence with rays around 582, 596, 608, and 860 keV and 595 and 630 keV, respectively. Although there are other candidate peaks visible in this region, only those listed here produce coincidences with the rotational band. In the even-even actinide nuclei, transitions in this energy range are typically observed in the de-excitation of vibrational states, e.g. states in 246Cm Shirwadkar et al. (2019), 250Fm Greenlees et al. (2008), or 252No Sulignano et al. (2012). Also, in the odd-proton 255Lr, de-excitation of high- rotational bands proceed via transition in this energy range Jeppesen et al. (2009). However, in our case, coincidences did not allow us to make the link with a collective structure at higher energy.
III.2 Electron spectroscopy
Turning to in-beam conversion electron spectroscopy, the analysis was based only on the total recoil-gated spectrum due to the paucity of -electron coincidence data. The experimental spectrum shown in Fig. 4(a) was obtained by subtracting the random-correlated background using time gates before and after events in prompt coincidence. L and M components from the 195-keV (L,M195) and 244.3-keV (L244) transitions belonging to the band are clearly apparent. Clearly visible are the L and M conversion lines of a transition at 144 keV, which fits well with the extrapolated energy for the transition. The corresponding ray overlaps with the x-ray line, which explains why it cannot be evidenced using -ray spectroscopy alone. The most intense transition at 389 keV will be discussed further in Sec. IV.
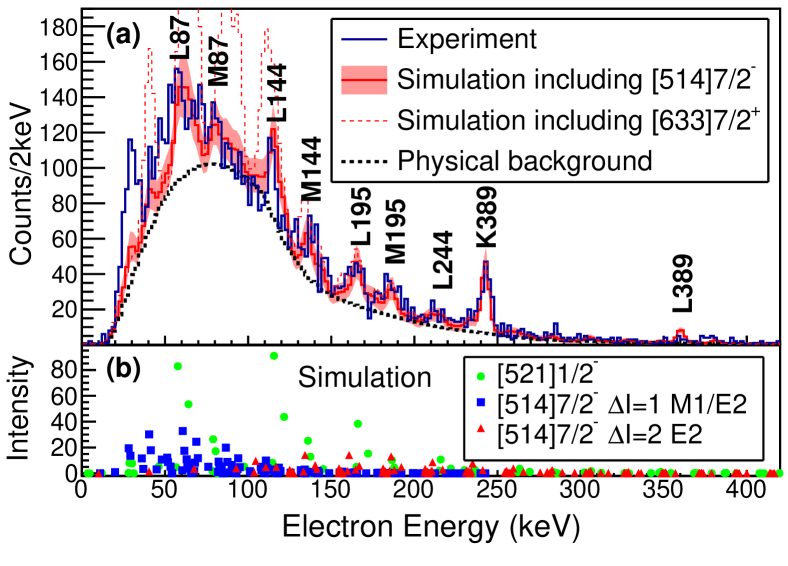
We also observed peaks below 100 keV with no counterpart in the -ray spectrum. In order to fully understand the electron spectrum and possibly constrain the single-particle configurations, we have performed a simulation of the conversion-electron spectra. We have adopted a purely analytical approach in our simulations. Compared to a Monte Carlo approach, this was possible because the number of ingredients was limited and because the response of the electron detector was quite simple. The advantage is that the simulations were fast and that all parameters easily controlled. The physics inputs for the rotational bands are described below. As soon as the transitions to be simulated have been listed (energy, relative intensity, multipolarity, and mixing ratio), the radiative and converted intensities were calculated using the conversion coefficients. The intensity was then corrected from the detector efficiency. For the electrons, the spectrum was simply simulated as Gaussian having the experimental resolution, with no background. This simplistic approach is justified by the fact that there is almost no background due to electron (back-)scattering. This was checked using nptool Matta et al. (2016) (a simulation and analysis framework for low-energy nuclear physics experiments based on geant4 Agostinelli et al. (2003)) in the 50-to 500-keV energy range: More that 85% of the electrons were indeed fully absorbed in the Si detector. The less than 15% remaining set of electrons contribute to a background which is mostly concentrated below 150 keV and which resembles the physical background that will be described in the following. Since the physical background dominates the majority of the spectrum, this implies that this background is overestimated by about 15%, which is of the same order of magnitude as the systematic experimental errors. As a matter of fact, the conclusions regarding discrete transitions will not be altered by our assumptions. Only the interpretation of the physical background is slightly biased by this hypothesis, but as we will see later, the analysis of this background is essentially qualitative. As far as rays are concerned, the same approach has been chosen, but in this case, a background-less detector response is no longer justified. Simulated -ray spectra are therefore not presented in this study. The K x-ray emission after internal conversion was also included in the simulations. The x-ray energies and intensities were taken from Ref. Firestone et al. (1999). The code has been implemented using the root framework Brun and Rademakers (1997).
The ingredients for the band were the experimental energies and intensities. The band was subsequently extrapolated at lower energies using a smooth moment of inertia resulting in transition energies of 87 keV () and 40 keV (), the former being evidenced in the electron spectrum [Fig. 4(a)]. These energies are strongly similar to those of bands based on the same single-particle configuration in the neighboring 247Bk and 251Es Ahmad et al. (1977). The transition intensity within the band was deduced from the -ray spectra, corrected for the internal conversion, and assumed constant for the transitions at 40, 87, and 144 keV. The corresponding electron intensities, after taking into account the detector response, are shown with green circles in Fig. 4(b).
A different approach has been adopted for the other rotational band: In that case, the transition intensities were simulated using the electromagnetic properties (electric quadrupole and magnetic dipole moments) as an input assuming either the or single-particle configuration. The rotational band was first extrapolated at higher angular momenta using a smooth moment of inertia. The total experimental intensity profile (converted plus radiative) as a function of the angular momentum, , was fitted using a Fermi distribution . This prescription provided the normalization factor , the average angular momentum entry point , and the diffuseness . It is interesting to note that the intensity profile inferred here corresponds remarkably well to that measured for 254No at similar conditions of excitation energy and angular momentum for the compound nucleus Henning et al. (2014). The transition rates of the stretched and of the mixed transitions connecting the two signature partner bands were subsequently calculated from the particle plus rotor model Bohr and Mottelson (1998) using the reduced radiative transition probabilities and , and radiative transition rates and :
| (1) |
| (2) |
| (3) |
| (4) |
with being the rotational gyromagnetic factor, being the Bohr magnetron, and being the electric quadupole moment. The orbital gyromagnetic factor has been approximated as , where is the nucleon spin (orbital) gyromagnetic factor. For the protons, we adopted and . A reduction of the spin gyromagnetic factor was used, a value generally adopted for heavy nuclei. The relations above result in and for the and configurations, respectively. The transition rates, corrected for internal conversion and according to the intensity profile were subsequently used to calculate the transition intensities along the rotational band. Actually, the intensity calculations can be performed purely analytically for the entire rotational band. In practice, the calculations were made from the top of the band, the intensities being calculated for all the transitions steeping downwards.
The resulting simulated electron intensities after taking into account the detector response for the hypothesis are shown in Fig. 4(b) with red triangles for the stretched transitions and with blue squares for transitions. As a result, the electron spectrum is dominated by transitions. The complexity of the spectrum is obvious along with a fragmented intensity pattern. However, the simulation of this band essentially generates tails in the peaks of the band. This is due to two factors: (i) most of the conversion-electron energies of this band are often found close to some of the band and (ii) the intensities of theses band transitions is lower than those of the band.
Experimentally resolving all peaks was not possible given the detector resolution and the collected statistics. The simulated intensity assuming the configuration has similar features but with a larger contribution of transitions (larger value). Since the total transition intensity was normalized from the -ray spectrum, the resulting electron intensities would exceed those of the case by a factor of 3, which is clearly not compatible with the measurement, and this rules out the configuration.
After summing the and contributions, there is still a large background in the electron spectrum peaking at 80 keV. In Fig. 4(a), a simulation corresponding to a set of rotational bands with and the moment of inertia randomly sampled is shown with a dotted black line. More precisely, each band configuration has been chosen either as a proton 1qp excitation with or a single proton excitation coupled to a 2qp, either proton or neutron having and antiparallel spin coupling according to the Gallagher rule Gallagher (1962). The moment of inertia was randomly selected around the value measured for yrast or high- rotational bands in the Fm-Lr region. We have arbitrarily taken a fraction of 50% proton 1qp excitations, 25% proton 3qp excitations and 25% 1qp proton 2qp neutron configuration. As shown in Fig. 4(a), the spectrum resulting from this simulation reproduces the experimental background remarkably well, with the only adjusted parameter being its total intensity scaled to correspond to the experimental spectrum above 250 keV. It should be noted, however, that the shape of this physical background is largely independent on the assumptions discussed above. Conversely, it mainly results from a convolution of the electron detection efficiency and the internal conversion coefficients. No physics ingredients such as the angular momentum entry point, average gyromagnetic factor, or average moment of inertia notably change the background shape. This background is, however, fully consistent with rotational bands unresolved experimentally, or from the continuum. Its intensity can be estimated at a level of 60% of the total 251Md population. It should be reminded here that a background-less response of the electron detector was assumed. As discussed above, this leads to an underestimated simulated background and therefore the present background analysis should be regarded as qualitative. Our conclusion is, however, entirely consistent with those of Butler et al. in the case of 254No, for which an electron background has been well reproduced using a set of rotational bands with 40% intensity Butler et al. (2002). The decay spectroscopy of 254No unambiguously confirms the presence of a 2qp state at about 1 MeV and of an isomeric 2qp state at about 1.3 MeV Herzberg et al. (2006); Tandel et al. (2006); Clark et al. (2010); Heßberger et al. (2010), on top of which rotational bands were observed. It was shown in particular in Heßberger et al. (2010) that the isomeric state is fed with an intensity ratio of 28 (2) %. Thus, most of the unresolved background identified by Butler et al. arises from the de-excitation of a band based on a high state. Using in-beam -ray spectroscopy, a rotational band based on a isomeric state was also observed in 250Fm Greenlees et al. (2008) and in 252No Sulignano et al. (2012), with an isomeric ratio of 37 (2) % Ketelhut (2010) and 30 % Sulignano , respectively. A similar situation is thus expected in odd-mass nuclei with the presence of high- 3qp states. It should be noted that a high- isomer has been recently evidenced in 251Md T. Goigoux et al. . It is therefore realistic to interpret the observed electron background in 251Md as corresponding to several unresolved bands, built either on high- 3qp states or on low-lying single-particle configurations such as or . However, band intensities are expected to be more fragmented compared to even-even nuclei due to the presence of several single-particle states at low excitation energy.
We have also simulated the -ray counterpart of this physical background, which, interestingly, also reproduces well the -ray background shape in the 150- to 600- keV energy range. This must be considered, however, as a qualitative consideration since the response of the Ge detectors was not fully included in our simulations. With regard to x-rays, their intensity turns out to be very sensitive to , as expected from the strong dependence of the rates [Eq.(1)], but no definitive conclusion can be drawn from the present work.
Finally, the total simulated spectrum ( and configurations, transition at 389 keV plus the physical background) is shown using a solid red line with the envelope corresponding to the uncertainty propagation [Fig. 4(a)]. The global shape is well reproduced except at 40 keV, interpreted as the energy tail of electrons that were not cut by the electrostatic barrier or the electronic threshold. The same simulation assuming the configuration is shown with a red dashed line for comparison, clearly overestimating the measured intensity and again ruling-out this configuration.
III.3 Intensity profile
The experimental intensity profile of stretched transitions for the g.s. band is shown in Fig. 5. The intensities were taken from the rays in the 189.2-keV () to 311.3-keV () range, corrected from the internal conversion. Only statistical uncertainties were considered here since a systematic error would simply scale the distribution. Although associated with large error bars, oscillations around are clearly visible. The intensity profile resulting from the band simulation discussed in Sec. III.2 for a gyromagnetic factor is shown with blue squares.
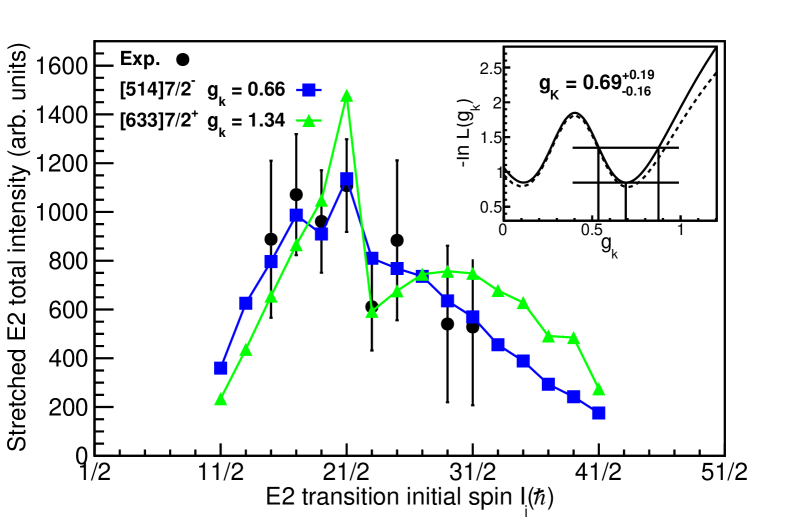
This simulated profile reproduces the experimental data remarkably well, notably the oscillations and an intensity jump between the states with and . Below , the transition energies are lower than the K electron-binding energy (145.6 keV) while they are higher above. This change results in a sharp decrease of the internal conversion coefficient by a factor of and consequently in a lowering of the transition rate below . The other impact is an increased stretched transition rate below , clearly visible in the simulation and evidenced in the experimental data. For comparison, the intensity profile assuming the configuration () is shown with green triangles. Although the jump is still present at the same angular momentum, the intensity profile departs significantly.
The gyromagnetic factor can be deduced using the maximum likelihood technique. For convenience, the opposite of the logarithm of the likelihood estimator, , is used since one has simply . This estimator is plotted in the inset of Fig. 5. The estimator, the most likely value and its uncertainty were derived as follows. The intensity profile was simulated for different values in the range and subsequently compared to the experimental profile using the maximum likelihood technique. The most likely corresponds to the minimum . The uncertainties were obtained using , as depicted in the inset of Fig. 5. The method allowed us to deduce the most likely gyromagnetic factor . This value is in remarkable agreement with the value estimated above for the configuration using the particle-plus-rotor model. In contrast, for the configuration, deviates by from the most likely value. It should be noted that the estimator is symmetric with respect to and therefore the value is still possible, but not favored since it does not correspond to any expected single-particle configuration at low excitation energy.
In order to better estimate the validity of our method, the same test was made taking into account only the first five experimental points. Indeed, the last two points are in the feeding region and therefore more sensitive to the total intensity profile parametrization (a Fermi distribution, as explained above). This analysis lead to , remarkably close to the value obtained using seven experimental points. The estimator using these five experimental values is plotted with a dashed line in the inset of Fig. 5. Both curves are very similar around the most likely value since the last two experimental points have a higher uncertainty and therefore a lower statistical weight. The second reason is that the model reproduces the two last experimental points very well for the most likely value, contributing only marginally to the estimator around its minimum. In contrast, the two experimental points that contribute most to the estimator are those who delineate the abrupt jump in the intensity profile ( and 21/2). Indeed, this jump amplitude is very sensitive to the gyromagnetic factor, and moreover these two points have a lower statistical uncertainty.
We are therefore confident that our method provides a reliable estimate of the gyromagnetic factor, which fully supports the configuration.
IV Evidence for octupole correlations in 249,251Md
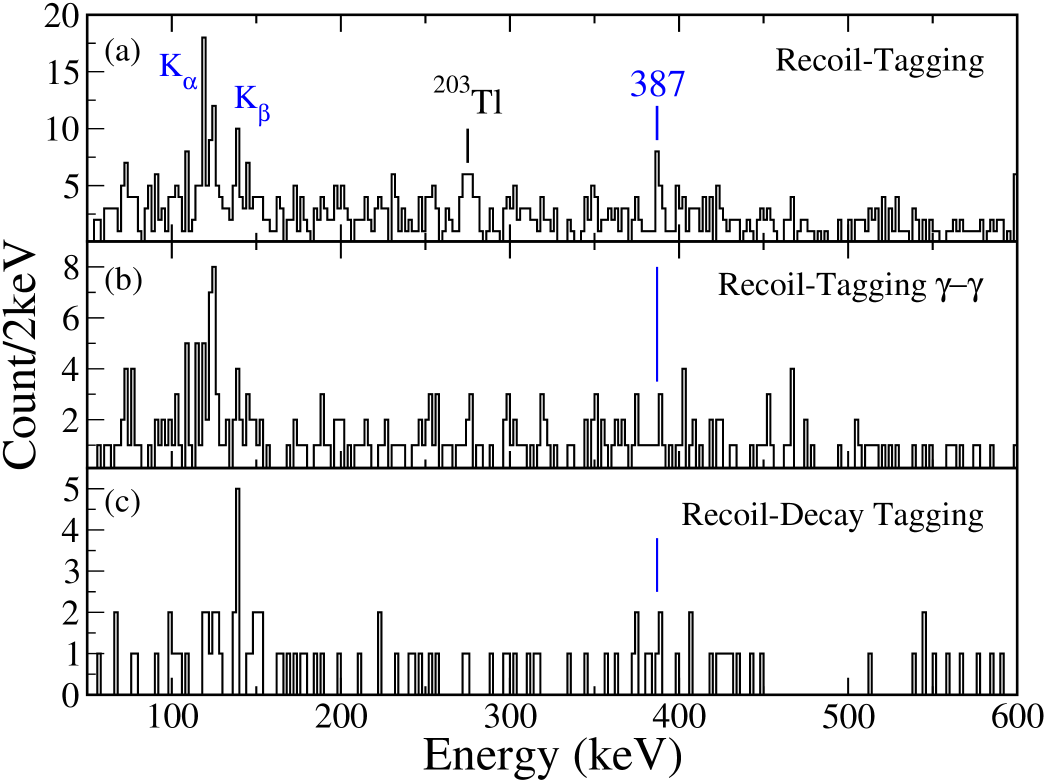
The most intense 251Md peak in both -ray and conversion-electron spectra corresponds to a transition at 389 keV. Although this transition collects about 16 % of the de-excitation flow (compared to and for the and bands, respectively), no coincident transition has been observed with a sufficient confidence level. Its experimental conversion coefficient is, within the uncertainties, only compatible with an multipolarity, as shown in Table 1. We also extracted an L-shell conversion coefficient . This value can be considered as an upper limit since the region of the L conversion is not background free. However, is again compatible with an multipolarity.
| Exp. | |||||||
|---|---|---|---|---|---|---|---|
| 2.266 10-2 | 8.476 10-1 | 5.906 10-2 | 1.946 | 1.465 10-1 | 3.551 | 1.84 | |
| 4.813 10-3 | 1.851 10-1 | 6.846 10-2 | 6.594 10-1 | 5.037 10-1 | 2.337 | 0.75 |
An transition of pure single-particle character would have a half-life of 23 ns and therefore out of the view of the SAGE detection. A rate enhancement is, however, possible if the initial and final states are coupled via a octupole phonon. Several examples of octupole-vibration coupling have been observed in the actinide region. First examples were reported in the 246,248Cm and 248,249Cf by Yates et al. using transfer reactions Yates et al. (1975a, b). A more recent example has been provided in 251Fm Rezynkina et al. (2018).
The occurrence of octupole correlations arise when orbitals with are close in energy. In the region, this is realized on the neutron side for the orbits. For the protons, the pair candidates are and ; all these pairs favor a octupole phonon as the lowest collective excitation. Although the , , and orbitals have not been observed in 251Md yet, the second pair is a better candidate since both orbitals have been predicted at lower energy compared to the first pair Parkhomenko and Sobiczewski (2004); Chatillon et al. (2006); Shirikova et al. (2013). In that case, the state would have a component and therefore pushed down compared to pure single-particle predictions.
The 389-keV transition can be hence tentatively assigned to a transition that could be, because of the coupling with an octupole phonon, of mixed character. We calculated the mixing ratio for a transition using
| (5) |
Because of the large experimental uncertainties, our measurement is compatible with no mixing. However, an upper limit, within one , of 0.35 can be provided, which would nevertheless leave the possibility of a substantial component.
Interestingly, a transition at 387 keV has been evidenced in the neighboring 249Md as shown in Fig. 6. This transition is the most intense in the recoil-tagged spectrum apart from a contamination of 203Tl Coulex [Fig. 6(a)]; its intensity decreases using - coincidences [Fig. 6(b)], consistent with only few radiative transitions in coincidence as in 251Md, and finally the transition is still present when tagging on the 249Md decay [Fig. 6(c)]. The energy and characteristics similar to 251Md suggests a transition of similar nature in both isotopes. This is consistent with the fact that several calculations predict a very similar single-particle structure of 249Md and 251Md Ćwiok et al. (1994); Parkhomenko and Sobiczewski (2004); Chatillon et al. (2006); Shirikova et al. (2013).
V Comparison of 251Md with 255Lr
V.1 Similarity of transition energies: A possible case of identical bands
An unexpected feature of the g.s. rotational band of 251Md is its resemblance to the excited band of 255Lr Ketelhut et al. (2009), both based on the orbital. The transition energies are indeed identical within the uncertainties up to , beyond which the difference slowly increases (Table 2 111It should be noted that no spins were suggested for the transitions in Ref. Ketelhut et al. (2009). The spins proposed in the evaluation Browne and Tuli (2013) should be excluded since the lowest unobserved transitions, because they were highly converted, were ignored in the evaluated level scheme.). On the other hand, rotational bands based on the configuration do not exhibit similarities at such a level of precision. Such a phenomenon of identical rotational bands (IBs) was first observed in a pair of superdeformed bands (SD) of 151Tb (first excited band) and 152Dy (yrast band) Byrski et al. (1990), later confirmed in numerous cases and which turned out to be emblematic of SD bands. The phenomenon of IBs has also been observed at intermediate and normal deformations, with bands having a variable degree of similarity, and sometimes with IBs for nuclei that differ substantially in mass (Ref. Baktash et al. (1995) and references therein).
| 251Md | 255Lr | 251Md | 255Lr | ||
|---|---|---|---|---|---|
| 13/2 | 161.8 (3) | 9/2 | |||
| 15/2 | 189.0 (7) | 189 (1) | 13/2 | 144 (1) | |
| 17/2 | 214.8 (5) | 215 (1) | 17/2 | 195.3 (3) | 196.6 (5) |
| 19/2 | 238.8 (4) | 239 (1) | 21/2 | 244.3 (3) | 247.2 (5) |
| 21/2 | 263.8 (3) | 264.6 (5) | 25/2 | 291.8 (10) | 296.2 (5) |
| 23/2 | 289 (1) | 288.4 (5) | 29/2 | 335 (1) | 342.9 (5) |
| 25/2 | 311.2 (6) | 314.0 (5) | 33/2 | 376.8 (4) | 387 (1) |
| 27/2 | 334 (1) | 338 (1) | 37/2 | 415 (2) | 430 (1) |
| 29/2 | 358 (1) | 359 (1) | 41/2 | 447 (2) | |
| 31/2 | 376 (1) | 384 (1) | 45/2 | [478 (2)] | |
| 33/2 | 49/2 | [513 (1)] | |||
It is worth reminding that, at moderate deformation, the classical moment of inertia of a rigid homogeneous body is proportional to Rowe (1970). Phrased differently, the transition energies of such rotating rigid bodies scale with for the same deformation. Therefore, for the 251Md-255Lr pair, an energy difference of 3% between the transition energies of the two bands is expected in such a purely macroscopic framework, significantly higher than the observation. For the pair of bands based on the 7/2- single-particle state, five transitions are identical within one keV, which could be considered as not very impressive at first sight compared to e.g. the phenomenon in SD bands. As we will discuss in the following, however, this case turns out to be unique in the transuranium region. It is also interesting to note that the transition energies for the band are larger in 255Lr than in 251Md, while the opposite effect is expected according to the scaling of rotational energies at fixed angular momentum and deformation.
Numerous mechanisms have been advocated to explain the IB phenomenon such as (i) the spin alignment of specific orbitals along the rotation axis in the strong coupling limit of the particle-rotor model, (ii) the role of symmetries and in particular the pseudo-SU(3) scheme, (iii) the role of orbitals not sensitive to the rotation, in particular, those having a high density in the equatorial plane (low number of nodes in the plane perpendicular to the symmetry axis), (iv) the role of time-odd terms, etc.; see Ref. Baktash et al. (1995) and references therein. None of them were fully satisfactory since they were neither predictive nor capable of identifying the underlying mechanism. Some global analyses using mean-field approaches suggest that the mechanism is not as simple as a quantum alignment or purely related to single-particle properties, but results from a cancellation of several contributions (deformation, mass, pairing), resulting in the identical bands (e.g. Refs. Ragnarsson (1990, 1991); Szymanski (1995); Satuła et al. (1996)).
Identical bands were previously reported in even-even transuranium nuclei Ahmad et al. (1991): The three or four first ground-state band transitions in 240Pu, 244,246Cm, and 250Cf are identical within 2 keV. The more recent improved spectroscopy of 240Pu Wang et al. (2009), 246Cm and 250Cf Hota (2012) has shown that the transition energies deviate significantly above = 8. More impressive are the ground-state bands of 236,238U that are identical up to spin within 2 keV Ahmad et al. (1991). In this reference, this has been interpreted in this region of midshell nuclei as the filling of orbitals driving small deformation changes that counteract the mass dependence. In any event, even if these bands cannot all be qualified as being identical, these cases recall that the systematics of moments of inertia can locally deviate very strongly from the overall scaling with Rowe (1970).
To establish whether other identical bands are present in the transuranium region, we have inspected all bands having at least eight measured transitions, which represent 30 cases in even-even nuclei and 29 bands in odd- or - nuclei (odd-odd nuclei were not considered). The data were taken from the Evaluated Nuclear Structure Data File (ENSDF) and from more recent publications or unpublished works Hota (2012); Birkenbach et al. (2015); Ketelhut (2010). This survey revealed two other even-even pairs that are identical within 2 keV for the four lowest spin transitions: They are respectively 236Pu and 242Pu, and 250Fm and 254No. The equality of the transitions, however, is verified over a few transitions only. We also mention the case of the (246Pu-252No) pair whose transition energies are identical within 2 keV up to = 6. This case can be hardly explained as these nuclei differ by eight protons and two neutrons, and may be considered as an accidental degeneracy. It is worth mentioning that the general trend of the collective state in the , region can be well explained by a change of the moment of inertia because of a reduction or increase in pairing correlations when approaching or leaving the deformed shell gaps (see the discussion, e.g. in Ref. Theisen et al. (2015)). Several nuclei, however, deviate from this trend (in particular the Cf isotopes). No explanation that would convincingly explain all cases has been found so far. Also, octupole correlations have been evidenced in the 240-244Pu Wang et al. (2009); Wiedenhöver et al. (1999) isotopes. Clearly, beyond-mean field effects have to be taken into account in that case. Except the 251Md-255Lr pair, we have not identified other cases of odd-mass nuclei having identical transitions between them, or having identical transitions with one of their neighboring even-even nuclei.
An intriguing fact in the IBs discussed here is that the nuclei differ by four mass units, more precisely an particle. In the rare-earth-metal region, an chain of even-even nuclei with bands identical up to has been identified: 156Dy, 160Er, 164Yb, 168Hf, 180Os (and 172W to a lesser extent) Casten et al. (1992). An interpretation based on the algebraic interacting boson model was proposed in the same reference. The quadrupole moment is linked to the product, () being the number of valence protons (neutrons) with respect to the nearest magic shell. This product is similar for all these nuclei and moreover in the language of the interacting boson model, these nuclei form a -spin multiplet having the same number of valence particles ; i.e., they are predicted to have a similar structure. However, the major drawback of this approach is that it overpredicts the occurrence of identical bands. Deficiencies to reproduce the gyromagnetic factor for these nuclei have also been noticed Stuchbery (1995).
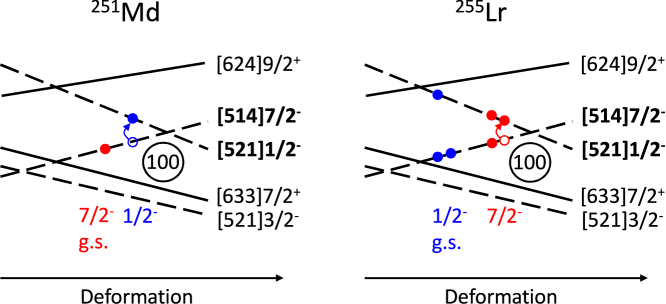
The nuclear structure and deformation can be expected to change when filling deformation-driving orbitals (either down- or up- sloping as a function of the deformation driving the nucleus toward larger or lower deformation, respectively). In this respect, it is interesting to note that because of the sequential filling of proton levels, the ground-state and the first excited state configurations of 251Md versus 255Lr are interchanged. Depending on its characteristics, the additional occupied pair of orbits in 255Lr can lead to subtle deformation changes between the two nuclei; see Fig. 7.
In the ground state of 251Md, one level out of the pair of up-sloping orbitals is filled, while in 255Lr the state corresponds to the same configuration plus a pair of filled down-sloping orbitals, the latter driving the nucleus toward slightly larger deformations. The deformation-driving effect in 255Lr for this configuration goes therefore in the same direction as the overall macroscopic dependence of the rigid moment of inertia. The filling of orbitals as such therefore cannot explain the experimental finding of identical bands, quite on the contrary: Based on this simple argument, the two bands should be even more different than can be expected from the global scaling of moments of inertia. On the other hand, the pair is filled for the 255Lr ground state, therefore driving the nucleus towards a lower deformation compared to the 251Md excited state, which goes in the opposite direction as the trend: A mechanism consistent with identical bands for the configuration, again in contradiction with the experimental finding.
Furthermore, there is a pair of neutron orbits that is filled to pass from 251Md to 255Lr, namely in the Nilsson orbital. According to calculations using a Woods-Saxon potential (see, e.g. Chasman et al. (1977)) or calculations presented below (see the self-consistent Nilsson diagram in Fig. 9), this level is not sloping around the ground-state deformation, which justifies ignoring neutron levels at the present level of discussion.
There is also the experimental observation to consider that the transition energies for the bands change in the opposite direction to that expected from the scaling. Moreover, from a purely macroscopic point of view, the deformation of 255Lr should decrease from to 0.21 to compensate for the mass difference ( term) and lead to the same energies as 251Md. Therefore, the mass-deformation compensation mechanism discussed above does not have the correct order of magnitude since only small deformation changes are expected and cannot explain simultaneously the larger transition energies for the 255Lr band and IBs for the bands, unless one assumes that there is an additional mechanism that decreases the moment of inertia in 255Lr. If the mechanism is the same for both configurations, then it just has the right size for the bands to make them identical, but “overshoots” for the bands.
The mass-deformation compensation mechanism resulting from the filling of levels is therefore unable to explain the experimental findings. There clearly have to be additional compensation effects, for example, from changes in pairing correlations or the alignment of single-particle states as proposed in Refs. Ahmad et al. (1991); Ragnarsson (1990); Espino and Garrett (1989); Stephens (1990); Zhang and Riedinger (1992) for the observation of identical bands found for pairs of rare-earth-metal nuclei.
In this respect, it is interesting to note that the 251Md and 255Lr nuclei are the neighbors of 250Fm and 254No respectively with one additional proton. As already mentioned, the yrast bands of these two even-even nuclei are also identical for the first four transitions. For the same reasons discussed above for the case of 251Md and 255Lr, the mass-deformation compensation mechanism also cannot explain the similarity between the yrast band of 250Fm and 254No. With 250Fm being proton magic deformed and 254No neutron magic deformed, a simple explanation of the change in moment of inertia in terms of a change in pairing correlations is also not straightforward. The rotational bands of 251Md and 255Lr can be phenomenologically described by the coupling of a proton in the orbit to the ground-state band of 250Fm and 254No, respectively. In the most basic version of such a model Rowe (1970), one automatically obtains identical bands in 251Md and 255Lr as well. However, this is not observed, indicating that there are additional changes that are not the same when passing from 250Fm to 251Md and from 254No to 255Lr, respectively. For the bands the situation is even more complicated since for 251Md the band could be interpreted as a proton in the orbit coupled to the ground-state band of 250Fm, whereas for 255Lr the band corresponds a 2p-1h excitation relative to the ground-state band of 254No.
V.2 Self-consistent mean-field analysis
To better understand the conditions for the emergence of identical bands for the nuclei studied here, we performed microscopic cranked self-consistent-mean-field calculations for the and bands in 249Md, 251Md, and 255Lr. The calculations were made with the coordinate-space solver MOCCa Ryssens (2016); Ryssens et al. that is based on the same principles as the code used for the Skyrme-HFB calculations reported in Refs. Chatillon et al. (2006, 2007); Ketelhut et al. (2009); Dobaczewski et al. (2015). We employ the recent SLy5s1 parametrization of the Skyrme energy density functional (EDF) Jodon et al. (2016) that was adjusted along similar lines as the widely-used SLy4 parametrization Chabanat et al. (1998) used in those references, but with a few differences in detail, the most important one being a constraint on the surface energy coefficient that leads to a much better description of fission barriers of heavy nuclei Ryssens et al. (2019). As pairing interaction we choose a so-called “surface pairing” with cutoffs as defined in Ref. Rigollet et al. (1999).
For further discussion, it is important to recall that SLy5s1 does not reproduce the empirical deformed shell closures at and Theisen et al. (2015); Asai et al. (2015); Ackermann and Theisen (2017), a property that it shares with SLy4 and almost all other available nuclear EDFs that have been applied to the spectroscopy of very heavy nuclei so far Dobaczewski et al. (2015); Bender and Heenen (2013). Instead, SLy5s1 gives prominent deformed proton gaps at and , and an additional deformed neutron gap at ; see Figs. 8 and 9. For the Md and Lr isotopes discussed here, the Fermi energy is in the direct vicinity of these shell closures, which has some influence on the calculated properties of their rotational bands.
We observe that, for a given Skyrme interaction, the similarity of in-band transition energies for different nuclei depends sensitively on the details of the treatment of pairing correlations. To illustrate this finding, four different options will be compared. The first one is the HFB + Lipkin-Nogami (HFB+LN) scheme as defined in Ref. Rigollet et al. (1999) with a pairing strength of for protons and neutrons that was adjusted to describe superdeformed rotational bands in the neutron-deficient Pb region. This prescription has also been used in Refs. Chatillon et al. (2006, 2007); Ketelhut et al. (2009). The second option is a HFB+LN scheme with a reduced pairing strength of that was adjusted to reproduce the kinematic moment of inertia of 252Fm at low spin when used with SLy5s1 Bender and Heenen . While the LN scheme is a popular prescription to avoid the breakdown of HFB pairing correlations in the weak-pairing limit, it is known to have some conceptual problems, the most prominent one not being variational. As an alternative, Erler et al. Erler et al. (2008) proposed a small modification that can be applied to any pairing interaction and that prevents the breakdown of pairing when being inserted into a standard HFB calculation. Their fully variational stabilized HFB scheme was used as a third pairing option, again with a surface pairing interaction of strength . As the fourth option we use the standard HFB scheme as the most basic reference case, again with a pairing strength of .
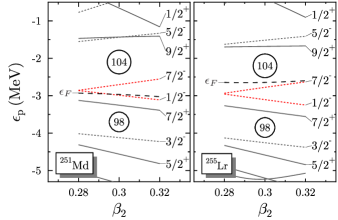
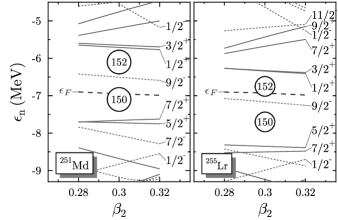
Independent of the pairing option chosen, we find a calculated ground state for 249Md and 251Md, but a ground state for 255Lr. In each case, the other state is a low-lying excitation at less than 160 keV. This result is at variance with experimental data, for which the relative order of these levels is the other way round Chatillon et al. (2006). This finding is intimately connected to the incorrect deformed gaps found in the Nilsson diagram of Fig. 8: in order to obtain the correct level sequence, the level has to be pushed up relative to the other levels such that it is above the level at all relevant deformations. This would open up a gap at and significantly reduce the gap; see the detailed discussion of this point in Ref. Chatillon et al. (2006). Similar problems for the relative position of these two levels were found for virtually all widely used nuclear EDFs Dobaczewski et al. (2015); Bender and Heenen (2013). It is noteworthy that the UNIDEF1 parametrization of Ref. Shi et al. (2014) for which the spin-orbit interaction has been fine-tuned to give deformed and shell gaps does not improve on the relative position of these two levels. In addition, it predicts that the [624] level is nearly degenerate with them, which is difficult to reconcile with the systematics of band heads in this region.
The Nilsson diagrams of Figs. 8 and 9 have been calculated for false vacua, meaning HFB states that have the correct odd particle number on average, but no blocked quasiparticles. It is noteworthy that the relative positions of many neutron and proton levels visibly change when going from 251Md to 255Lr: Filling a further pair of neutron and proton orbits changes all other levels through self-consistency. Such self-consistent rearrangement of deformed shells seems to be a general feature of heavy deformed nuclei when calculated within self-consistent models Bender and Heenen (2013).
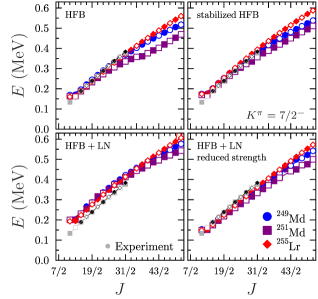
The rotational levels in each band have been constructed by solving the cranked HFB equations with a constraint on the collective angular momentum such that , with held fixed at or , respectively. The odd particle can be put either into the orbit with or , which leads to two different solutions of the HFB equations that we identify with the states in the two signature-partner bands that can be observed experimentally de Voigt et al. (1983). With increasing spin , one finds a signature splitting between the two calculated partner bands into an energetically favored and non-favored band. For the calculated and observed bands, the signature splitting is too small to be resolved on the plots. For the calculated band, however, it is quite substantial. As there are no experimental data for the non-favored band, we will not discuss its properties here.
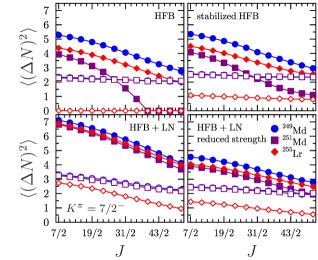
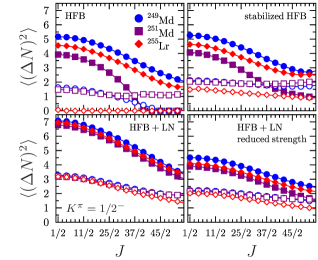
The resulting transition energies in the two bands are displayed in Fig. 10. It is immediately visible that the calculated energies depend significantly on the pairing option. To understand the origin of the differences between pairing options and nuclei, Fig. 11 displays the corresponding dispersion of particle number . The latter is a measure for the amount of pairing correlations.
Within a given pairing scheme, all calculated bands are very similar at low spin. There are, however, visible differences between the actual transition energies when comparing the four pairing schemes. For these nuclei that all are in the weak-pairing limit for either protons or neutrons or both, using stabilized HFB or HFB+LN instead of pure HFB reduces the moment of inertia when the calculations were done with the same pairing strength, as these schemes tend to enhance pairing correlations. For the lowest transitions, the best agreement between the bands in different nuclei is found for HFB, but at higher the bands visibly differ for that scheme, in particular the one of 251Md. This is a consequence of the breakdown of neutron pairing with increasing spin, which quickly increases the moment of inertia for this nucleus. Preventing the collapse of pairing with any of the other three pairing schemes brings the transition energies much closer together over the entire band. It is to be noted that the breakdown of neutron pairing at high spin in 251Md is an artifact of the too large gap at the Fermi energy visible in Fig. 9. Similarly, the breakdown of proton pairing in the HFB calculation of 255Lr is an artifact of the too large gap. Assuming that the deformed gaps were at and instead, the relative amount of pairing correlations would be quite different: Protons should be more paired in 255Lr than in the two Md isotopes, while neutrons should be less paired in 255Lr than the Md isotopes.
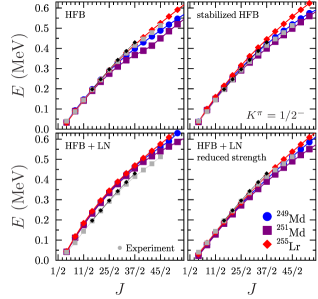
Figure 12 displays the transition energies between levels in the band of the same three nuclei, and Fig. 13 displays the corresponding dispersions of particle number. The overall trends are very similar to what is found for the bands. Again, the very close agreement of transitions in HFB at low spin is spoiled when neutron pairing breaks down at higher spin, an effect that is visibly reduced when using stabilized HFB or the LN scheme, in particular at high pairing strength. It is noteworthy that the similarity of the three calculated bands is slightly better than the agreement between the three calculated bands, while for data this is the other way round. Differences between the transition energies between same levels in the different bands are nevertheless still larger than what is found in experiment by about a factor of 2.
In spite of the wrong relative order of the and proton levels, the down-sloping levels are almost empty in the calculated excited band of the Md isotopes, while they are almost completely filled for 255Lr as one would expect if the level sequence were the one suggested by experiment as depicted in Fig. 7. Similarly, the up-sloping levels are almost empty for the band of the Md isotopes, whereas they are almost completely empty for 255Lr as would be expected from the empirical shell structure. As proton pairing is weak for these odd- nuclides anyway, the blocked proton configurations are therefore not much affected by the imperfections of the single-particle spectrum.
All states in the calculated rotational bands have a dimensionless quadrupole deformation as defined in Ref. Ryssens et al. (2019) of , with differences on the few percent level that depend on the nucleus, spin, blocked state, and pairing option used. With increasing spin , the deformation of all configurations is slowly decreasing. In parallel, all configurations become slightly triaxial, with the angle remaining below 2 deg. Comparing bands, we observe some systematic differences in quadrupole deformation that can be attributed to differences in the filling of single-particle levels near the Fermi energy. The value of the band of the two Md isotopes is slightly smaller by about 0.003 than the value of the band of 255Lr for all pairing options but HFB+LN. This is a consequence of the two additionally filled down-sloping, and therefore deformation-driving, levels as already discussed for the schematic Nilsson diagram of Fig. 7. The enhanced proton pairing correlations produced by the HFB+LN scheme reduce this effect and lead to a near-identical deformation of the band for all three nuclei. Similarly, the calculated deformation of the band of the Md isotopes is systematically larger than the deformation of the band. The difference is as large as 0.006 for the HFB option but remains much smaller for the standard HFB+LN scheme. This can be attributed to the filling of the deformation-driving level, while the up-sloping is almost empty. The deformation of the bands of the Md isotopes is also larger than the deformation of the band of 255Lr because the filled up-sloping levels in the latter drive the shape to smaller deformations. The effect is again largest with a of about 0.012 when using the HFB option that does not produce proton pairing correlation for 255Lr such that the change in the filling of orbits is largest. Using the other pairing schemes, the level is always partially filled to a varying degree, such that the change in deformation is reduced to about half that size.
The self-consistent calculations thereby confirm the schematic analysis of Fig. 7 concerning deformation changes, including the finding that deformation cannot be the sole explanation for the experimentally found reduction of the moment of inertia of both bands when going from 251Md to 255Lr, as it only brings a change into the right direction for the bands. Changes in pairing correlations also have to be an important factor. First of all, with increasing pairing correlations this simple picture of deformation changes driven by proton levels being filled or empty becomes blurred. Second, a reduction of pairing correlations in general reduces in-band transition energies Rowe (1970); de Voigt et al. (1983). As shown in Figs 11 and 13, the calculated pairing correlations are lower in 255Lr compared to 251Md, which should lead to an increase (decrease) of the moment of inertia (transition energies) in 255Lr while the opposite trend is needed to reconcile the contradictions mentioned above.
To summarize the discussion, the similarity of calculated transition energies in spite of sizable differences in the other properties discussed above points to accidental cancellation effects between the changes in shell structure, deformation, and pairing as ingredients of the identical bands and near-identical bands in 251Md and 255Lr. However, it is difficult to quantify the changes brought by these effects, such that an additional mechanism might be at play that leads to a universal reduction of the moment of inertia of 255Lr compared to 251Md. Even if such a yet unidentified mechanism is needed, it is qualitatively described by the cranked HFB calculations, at least at low spin. With increasing spin, the differences between the calculated bands become larger, as is the case for experiment. The calculations predict that the respective band of 249Md will also be very similar to what was found for 251Md and 255Lr, again in spite the large differences between deformation and pairing. The sensitivity of the calculated transition energies to details of the pairing scheme also suggests that obtaining identical bands to a precision that is comparable with experiment is essentially a fine-tuning problem. Using the SLy4 parametrization instead of SLy5s1 produces slightly different results but leads to the same conclusions.
All of these conclusions have to remain qualitative, though, as it should not be forgotten that finding identical bands at the 1-keV level is beyond the limits of what can be expected for the systematic errors of the cranked HFB method as such. It is also difficult to assess the possible role of octupole correlations, whose presence is hinted by the present data as discussed in Sec. IV, on the values for transition energies, as the coupling of states with octupole phonons is outside of the scope of any pure mean-field model. As a first step in that direction, exploratory beyond-mean field calculations including particle-number and angular-momentum projections on top of (parity-conserved) triaxial one-quasiparticle states were recently performed for 251Md, using a variant of the Skyrme EDF designed for this particular purpose Heenen et al. (2016). Although these calculations yield moments of inertia that are too small, they appropriately predict a ground state as well as the correct ordering of the levels in the signature partner bands.
VI Summary and conclusion
To summarize, this work provides the detailed properties of two rotational bands in the odd- 251Md interpreted as built on the and Nilsson orbitals, the former being the g.s. band. Conversion electron spectroscopy allowed the rotational bands to be extended to lower rotational frequencies for the band based on the Nilsson orbital. The conversion electron intensity was also used to constrain the single-particle configuration for the band, hence excluding the configuration. It was also shown that the band intensity profile in the presence of large internal conversion oscillates, providing a method to deduce the gyromagnetic factor. The most intense transition in both 249,251Md has been tentatively interpreted as a transition, its rate being probably enhanced by octupole correlations. The observation of several identical transitions in the 251Md-255Lr pair is the only case identified so far for odd-mass transuranium nuclei, which moreover differ by four mass units. Arguments based on a mass-deformation-pairing compensation fail to explain the experimental similarities () and differences () between 251Md and 255Lr. An additional and unexplained mechanism reducing the moment of inertia in 255Lr, that is probably independent of the filling of specific level, would explain simultaneously IBs for the configuration and even larger changes of the moment of inertia for the bands. HFB calculations suggest there is not a simple mechanism leading to identical bands in the mass region. Therefore, the similarity can be hence considered as accidental. While the collective properties are generally well reproduced by the present calculations, our study of the particular case of similar bands points to the high sensitivity of the model to its ingredients and in particular to pairing correlations. From both an experimental and theoretical point of view, the present work provides a step toward a better description of the super-heavy nuclei region and the still speculative island of stability.
Acknowledgements
We acknowledge the accelerator staff at the University of Jyväskylä for delivering a high-quality beam during the experiments. Support has been provided by the EU 7th Framework Programme Integrating Activities - Transnational Access Project No. 262010 (ENSAR), by the Academy of Finland under the Finnish Centre of Excellence Programme (Nuclear and Accelerator Based Physics Programme at JYFL, Contract No. 213503), and by the UK STFC. We thank the European Gamma-Ray Spectroscopy pool (Gammapool) for the loan of the germanium detectors used in the SAGE array. B.B. acknowledges the support of the Espace de Structure et de réactions Nucléaire Théorique (ESNT) at CEA in France. The self-consistent mean-field computations were performed using HPC resources of the computing center of the IN2P3/CNRS. W.R. gratefully acknowledges support by U.S. DOE grant No. DE-SC0019521
References
- Block et al. (2010) M. Block, D. Ackermann, K. Blaum, C. Droese, M. Dworschak, S. Eliseev, T. Fleckenstein, E. Haettner, F. Herfurth, F. Heßberger, et al., Nature (London) 463, 785 (2010).
- Theisen et al. (2015) Ch. Theisen, P. T. Greenlees, T.-L. Khoo, P. Chowdhury, and T. Ishii, Nucl. Phys. A 944, 333 (2015).
- Asai et al. (2015) M. Asai, F. Heßberger, and A. Lopez-Martens, Nucl. Phys. A 944, 308 (2015).
- Ackermann and Theisen (2017) D. Ackermann and Ch. Theisen, Phys. Scr. 92, 083002 (2017).
- Raeder et al. (2018) S. Raeder, D. Ackermann, H. Backe, R. Beerwerth, J. C. Berengut, M. Block, A. Borschevsky, B. Cheal, P. Chhetri, C. E. Düllmann, et al., Phys. Rev. Lett. 120, 232503 (2018).
- Ćwiok et al. (1996) S. Ćwiok, J. Dobaczewski, P.-H. Heenen, P. Magierski, and W. Nazarewicz, Nucl. Phys. A 611, 211 (1996).
- Rutz et al. (1997) K. Rutz, M. Bender, T. Bürvenich, T. Schilling, P.-G. Reinhard, J. A. Maruhn, and W. Greiner, Phys. Rev. C 56, 238 (1997).
- Bürvenich et al. (1998) T. Bürvenich, K. Rutz, M. Bender, P.-G. Reinhard, J. Maruhn, and W. Greiner, Eur. Phys. J. A 3, 139 (1998).
- Bender et al. (1999) M. Bender, K. Rutz, P.-G. Reinhard, J. A. Maruhn, and W. Greiner, Phys. Rev. C 60, 034304 (1999).
- Dobaczewski et al. (2015) J. Dobaczewski, A. V. Afanasjev, M. Bender, L. M. Robledo, and Y. Shi, Nucl. Phys. A 944, 388 (2015).
- Bender et al. (2001) M. Bender, W. Nazarewicz, and P.-G. Reinhard, Phys. Lett. B515, 42 (2001).
- Chatillon et al. (2007) A. Chatillon, Ch. Theisen, E. Bouchez, P. A. Butler, E. Clément, O. Dorvaux, S. Eeckhaudt, B. J. P. Gall, A. Görgen, T. Grahn, et al., Phys. Rev. Lett. 98, 132503 (2007).
- Leino et al. (1995) M. Leino, J. Äystö, T. Enqvist, P. Heikkinen, A. Jokinen, M. Nurmia, A. Ostrowski, W. H. Trzaska, J. Uusitalo, K. Eskola, et al., Nucl. Instrum. Methods Phys. Res., Sect. B 99, 653 (1995).
- Sarén et al. (2011) J. Sarén, J. Uusitalo, M. Leino, and J. Sorri, Nucl. Instrum. Methods Phys. Res., Sect. A 654, 508 (2011).
- Page et al. (2003) R. D. Page, A. N. Andreyev, D. E. Appelbe, P. A. Butler, S. J. Freeman, P. T. Greenlees, R.-D. Herzberg, D. G. Jenkins, G. D. Jones, P. Jones, et al., Nucl. Instrum. Methods Phys. Res., Sect. B 204, 634 (2003).
- Chatillon et al. (2006) A. Chatillon, C. Theisen, P. T. Greenlees, G. Auger, J. E. Bastin, E. Bouchez, B. Bouriquet, J. M. Casandjian, R. Cee, E. Clément, et al., Eur. Phys. J. A 30, 397 (2006).
- Pakarinen et al. (2014) J. Pakarinen, P. Papadakis, J. Sorri, R.-D. Herzberg, P. T. Greenlees, P. A. Butler, P. J. Coleman-Smith, D. M. Cox, J. R. Cresswell, P. Jones, et al., Eur. Phys. J. A 50, 53 (2014).
- Briselet et al. (2019) R. Briselet, C. Theisen, M. Vandebrouck, A. Marchix, M. Airiau, K. Auranen, H. Badran, D. Boilley, T. Calverley, D. Cox, et al., Phys. Rev. C 99, 024614 (2019).
- Lazarus et al. (2001) I. H. Lazarus, D. E. Appelbe, P. A. Butler, P. J. Coleman-Smith, J. R. Cresswell, S. J. Freeman, R. D. Herzberg, I. Hibbert, D. T. Joss, S. C. Letts, et al., IEEE Trans. Nucl. Sci. 48, 567 (2001).
- Rahkila (2008) P. Rahkila, Nucl. Instrum. Methods Phys. Res., Sect. A 595, 637 (2008).
- Kibédi et al. (2008) T. Kibédi, T. W. Burrows, M. B. Trzhaskovskaya, P. M. Davidson, and C. W. Nestor, Nucl. Instrum. Methods Phys. Res., Sect. A 589, 202 (2008).
- Heßberger et al. (2001) F. Heßberger, S. Hofmann, D. Ackermann, V. Ninov, M. Leino, G. Münzenberg, S. Saro, A. Lavrentev, A. Popeko, A. Yeremin, et al., Eur. Phys. J. A 12, 57 (2001).
- Ćwiok et al. (1994) S. Ćwiok, S. Hofmann, and W. Nazarewicz, Nucl. Phys. A 573, 356 (1994).
- Parkhomenko and Sobiczewski (2004) A. Parkhomenko and A. Sobiczewski, Acta Phys. Pol. B 35, 2447 (2004).
- Shirikova et al. (2013) N. Y. Shirikova, A. V. Sushkov, and R. V. Jolos, Phys. Rev. C 88, 064319 (2013).
- Antalic et al. (2010) S. Antalic, F. P. Heßberger, S. Hofmann, D. Ackermann, S. Heinz, B. Kindler, I. Kojouharov, P. Kuusiniemi, M. Leino, B. Lommel, et al., Eur. Phys. J. A 43, 35 (2010).
- He et al. (2009) X.-t. He, Z.-z. Ren, S.-X. Liu, and E.-g. Ahao, Nucl. Phys. A 817, 45 (2009).
- Zhang et al. (2012) Z.-H. Zhang, X.-T. He, J.-Y. Zeng, E.-G. Zhao, and S.-G. Zhou, Phys. Rev. C 85, 014324 (2012).
- Shirwadkar et al. (2019) U. Shirwadkar, S. K. Tandel, P. Chowdhury, T. L. Khoo, I. Ahmad, M. P. Carpenter, J. P. Greene, R. V. F. Janssens, F. G. Kondev, T. Lauritsen, et al., Phys. Rev. C 100, 034309 (2019).
- Greenlees et al. (2008) P. T. Greenlees, R.-D. Herzberg, S. Ketelhut, P. A. Butler, P. Chowdhury, T. Grahn, C. Gray-Jones, G. D. Jones, P. Jones, R. Julin, et al., Phys. Rev. C 78, 021303(R) (2008).
- Sulignano et al. (2012) B. Sulignano, C. Theisen, J.-P. Delaroche, M. Girod, J. Ljungvall, D. Ackermann, S. Antalic, O. Dorvaux, A. Drouart, B. Gall, et al., Phys. Rev. C 86, 044318 (2012).
- Jeppesen et al. (2009) H. B. Jeppesen, R. M. Clark, K. E. Gregorich, A. V. Afanasjev, M. N. Ali, J. M. Allmond, C. W. Beausang, M. Cromaz, M. A. Deleplanque, I. Dragojević, et al., Phys. Rev. C 80, 034324 (2009).
- Matta et al. (2016) A. Matta, P. Morfouace, N. de Séréville, F. Flavigny, M. Labiche, and R. Shearman, J. Phys. G: Nucl. Part. Phys. 43, 045113 (2016).
- Agostinelli et al. (2003) S. Agostinelli, J. Allison, K. Amako, J. Apostolakis, H. Araujo, P. Arce, M. Asai, D. Axen, S. Banerjee, G. Barrand, et al., Nucl. Instrum. Methods Phys. Res., Sect. A 506, 250 (2003).
- Firestone et al. (1999) R. B. Firestone, S. Y. F. Chu, and C. M. Baglin, Table of Isotopes: 1999 Update, 8th Edition (Wiley-Interscience, 1999).
- Brun and Rademakers (1997) R. Brun and F. Rademakers, Nucl. Instrum. Methods Phys. Res., Sect. A 389, 81 (1997).
- Ahmad et al. (1977) I. Ahmad, A. M. Friedman, R. R. Chasman, and S. W. Yates, Phys. Rev. Lett. 39, 12 (1977).
- Henning et al. (2014) G. Henning, T. L. Khoo, A. Lopez-Martens, D. Seweryniak, M. Alcorta, M. Asai, B. B. Back, P. F. Bertone, D. Boilley, M. P. Carpenter, et al., Phys. Rev. Lett. 113, 262505 (2014).
- Bohr and Mottelson (1998) A. Bohr and B. R. Mottelson, Nuclear Structure, Vol. 2 (World Scientific, Singapore, 1998).
- Gallagher (1962) C. J. Gallagher, Phys. Rev. 126, 1525 (1962).
- Butler et al. (2002) P. A. Butler, R. D. Humphreys, P. T. Greenlees, R.-D. Herzberg, D. G. Jenkins, G. D. Jones, H. Kankaanpää, H. Kettunen, P. Rahkila, C. Scholey, et al., Phys. Rev. Lett. 89, 202501 (2002).
- Herzberg et al. (2006) R.-D. Herzberg, P. T. Greenlees, P. A. Butler, G. D. Jones, M. Venhart, I. G. Darby, S. Eeckhaudt, K. Eskola, T. Grahn, C. Gray-Jones, et al., Nature (London) 442, 896 (2006).
- Tandel et al. (2006) S. K. Tandel, T. L. Khoo, D. Seweryniak, G. Mukherjee, I. Ahmad, B. Back, R. Blinstrup, M. P. Carpenter, J. Chapman, P. Chowdhury, et al., Phys. Rev. Lett. 97, 082502 (2006).
- Clark et al. (2010) R. M. Clark, K. E. Gregorich, J. S. Berryman, M. N. Ali, J. M. Allmond, C. W. Beausang, M. Cromaz, M. A. Deleplanque, I. Dragojević, J. Dvorak, et al., Phys. Lett. B 690, 19 (2010).
- Heßberger et al. (2010) F. P. Heßberger, S. Antalic, B. Sulignano, D. Ackermann, S. Heinz, S. Hofmann, B. Kindler, J. Khuyagbaatar, I. Kojouharov, P. Kuusiniemi, et al., Eur. Phys. J. A 43, 55 (2010).
- Ketelhut (2010) S. Ketelhut, Rotational Structures and High-K Isomerism in 248,250Fm, Ph.D. thesis, University of Jyväskylä (2010).
- (47) B. Sulignano, unpublished.
- (48) T. Goigoux et al., in preparation.
- Yates et al. (1975a) S. W. Yates, A. M. Friedman, and I. Ahmad, Phys. Rev. C 12, 795 (1975a).
- Yates et al. (1975b) S. W. Yates, R. R. Chasman, A. M. Friedman, I. Ahmad, and K. Katori, Phys. Rev. C 12, 442 (1975b).
- Rezynkina et al. (2018) K. Rezynkina, A. Lopez-Martens, K. Hauschild, I. Deloncle, S. Péru, P. Brionnet, M. L. Chelnokov, V. I. Chepigin, O. Dorvaux, F. Déchery, et al., Phys. Rev. C 97, 054332 (2018).
- Ketelhut et al. (2009) S. Ketelhut, P. T. Greenlees, D. Ackermann, S. Antalic, E. Clément, I. G. Darby, O. Dorvaux, A. Drouart, S. Eeckhaudt, B. J. P. Gall, et al., Phys. Rev. Lett. 102, 212501 (2009).
- Browne and Tuli (2013) E. Browne and J. K. Tuli, Nucl. Data Sheets 114, 1041 (2013).
- Byrski et al. (1990) T. Byrski, F. A. Beck, D. Curien, C. Schuck, P. Fallon, A. Alderson, I. Ali, M. A. Bentley, A. M. Bruce, P. D. Forsyth, et al., Phys. Rev. Lett. 64, 1650 (1990).
- Baktash et al. (1995) C. Baktash, B. Haas, and W. Nazarewicz, Annu. Rev. Nucl. Part. Sci. 45, 485 (1995).
- Rowe (1970) D. J. Rowe, Nuclear collective motion: models and theory (Methuen, London, 1970).
- Ragnarsson (1990) I. Ragnarsson, Nucl. Phys. A 520, c67 (1990).
- Ragnarsson (1991) I. Ragnarsson, Phys. Lett. B 264, 5 (1991).
- Szymanski (1995) Z. Szymanski, Phys. Rev. C 51, R1090 (1995).
- Satuła et al. (1996) W. Satuła, J. Dobaczewski, J. Dudek, and W. Nazarewicz, Phys. Rev. Lett. 77, 5182 (1996).
- Ahmad et al. (1991) I. Ahmad, M. P. Carpenter, R. R. Chasman, R. V. F. Janssens, and T. L. Khoo, Phys. Rev. C 44, 1204 (1991).
- Wang et al. (2009) X. Wang, R. V. F. Janssens, M. P. Carpenter, S. Zhu, I. Wiedenhöver, U. Garg, S. Frauendorf, T. Nakatsukasa, I. Ahmad, A. Bernstein, et al., Phys. Rev. Lett. 102, 122501 (2009).
- Hota (2012) S. Hota, Spectroscopy of neutron-rich Pu, Cm and Cf nuclei via inelastic and transfer reactions, Ph.D. thesis, University of Massachusetts Lowell (2012).
- Birkenbach et al. (2015) B. Birkenbach, A. Vogt, K. Geibel, F. Recchia, P. Reiter, J. J. Valiente-Dobón, D. Bazzacco, M. Bowry, A. Bracco, B. Bruyneel, et al., Phys. Rev. C 92, 044319 (2015).
- Wiedenhöver et al. (1999) I. Wiedenhöver, R. V. F. Janssens, G. Hackman, I. Ahmad, J. P. Greene, H. Amro, P. K. Bhattacharyya, M. P. Carpenter, P. Chowdhury, J. Cizewski, et al., Phys. Rev. Lett. 83, 2143 (1999).
- Casten et al. (1992) R. F. Casten, N. V. Zamfir, P. von Brentano, and W.-T. Chou, Phys. Rev. C 45, R1413 (1992).
- Stuchbery (1995) A. E. Stuchbery, Nucl. Phys. A 589, 222 (1995).
- Chasman et al. (1977) R. R. Chasman, I. Ahmad, A. M. Friedman, and J. R. Erskine, Rev. Mod. Phys. 49, 833 (1977).
- Espino and Garrett (1989) J. M. Espino and J. D. Garrett, Nucl. Phys. A 492, 205 (1989).
- Stephens (1990) F. S. Stephens, Nucl. Phys. A 520, c91 (1990).
- Zhang and Riedinger (1992) J.-y. Zhang and L. L. Riedinger, Phys. Rev. Lett. 69, 3448 (1992).
- Ryssens (2016) W. Ryssens, Symmetry breaking in nuclear mean-field models, Ph.D. thesis, Université Libre de Bruxelles (2016).
- (73) W. Ryssens, M. Bender, and P.-H. Heenen, MOCCa code (unpublished).
- Jodon et al. (2016) R. Jodon, M. Bender, K. Bennaceur, and J. Meyer, Phys. Rev. C 94, 024335 (2016).
- Chabanat et al. (1998) E. Chabanat, P. Bonche, P. Haensel, J. Meyer, and R. Schaeffer, Nucl. Phys. A635, 231 (1998), Nucl. Phys. A643, 441(E) (1998).
- Ryssens et al. (2019) W. Ryssens, M. Bender, K. Bennaceur, P.-H. Heenen, and J. Meyer, Phys. Rev. C 99, 044315 (2019).
- Rigollet et al. (1999) C. Rigollet, P. Bonche, H. Flocard, and P.-H. Heenen, Phys. Rev. C 59, 3120 (1999).
- Bender and Heenen (2013) M. Bender and P.-H. Heenen, J. Phys.: Conf. Ser. 420, 012002 (2013).
- (79) M. Bender and P.-H. Heenen, to be published.
- Erler et al. (2008) J. Erler, P. Klüpfel, and P.-G. Reinhard, Eur. Phys. J. A 37, 81 (2008).
- Shi et al. (2014) Y. Shi, J. Dobaczewski, and P. T. Greenlees, Phys. Rev. C 89, 034309 (2014).
- de Voigt et al. (1983) M. J. A. de Voigt, J. Dudek, and Z. Szymański, Rev. Mod. Phys. 55, 949 (1983).
- Heenen et al. (2016) P.-H. Heenen, B. Bally, M. Bender, and W. Ryssens, EPJ Web Conf. 131, 02001 (2016).