Observation of generalized Kibble-Zurek mechanism across a first-order quantum phase transition in a spinor condensate
The Kibble-Zurek mechanism provides a unified theory to describe the universal scaling laws in the dynamics when a system is driven through a second-order quantum phase transition. However, for first-order quantum phase transitions, the Kibble-Zurek mechanism is usually not applicable. Here, we experimentally demonstrate and theoretically analyze a power-law scaling in the dynamics of a spin-1 condensate across a first-order quantum phase transition, when a system is slowly driven from a polar phase to an antiferromagnetic phase. We show that this power-law scaling can be described by a generalized Kibble-Zurek mechanism. Furthermore, by experimentally measuring the spin population, we show the power-law scaling of the temporal onset of spin excitations with respect to the quench rate, which agrees well with our numerical simulation results. Our results open the door for further exploring the generalized Kibble-Zurek mechanism to understand the dynamics across first-order quantum phase transitions.
INTRODUCTION
Nonequilibrium dynamics across phase transitions plays a crucial role in various areas of physics ranging from cosmology to condensed matter (?). At zero temperature, the properties of a quantum system are dictated by its ground state, and the quantum phase transition is driven by quantum fluctuations. There, at the phase transition point, the energy gap vanishes and the relaxation time diverges, resulting in the violation of adiabaticity as the system parameter is tuned across the transition point. The Kibble-Zurek mechanism (KZM) describes the dynamics across the transition point by three evolution regions: two adiabatic and one impulse regions (?, ?, ?, ?, ?, ?, ?). Specifically, when a system is far away from the transition point, the relaxation time is sufficiently short so that the system can respond to the change of a parameter and the dynamics is adiabatic. When the system is tuned to be near the point, it enters into an impulse region, where the relaxation time is sufficiently long so that the system cannot adapt to the change and thus remains frozen. After the impulse region, the energy gap becomes large and the system reenters into an adiabatic region. Based on the KZM, universal scaling laws are predicted across continuous quantum phase transitions for various quantities, such as topological defects and spin excitations. The KZM in quantum phase transitions has been experimentally observed in several systems (?, ?, ?, ?, ?, ?, ?, ?), such as Bose-Einstein condensates and a programmable Rydberg simulator.
Different from the second-order quantum phase transition, multiple phases coexist at the transition point for the first-order one. Interestingly, similar to the former, numerical simulations have suggested that scaling laws may also exist in the dynamics of several first-order phase transitions (?, ?, ?, ?, ?, ?). However, while the KZM is very successful in the former, some direct application of the KZM to the first-order transition cannot give a satisfied description of the scaling law compared to the numerical simulation results, such as in an extended Bose-Hubbard model (?). In addition, there has been no experimental evidence for the existence of the scaling law at the first-order quantum phase transition.
A spinor Bose-Einstein condensate (BEC) provides a versatile platform to study the nonequilibrium physics, such as spin domains (?, ?, ?, ?, ?), topological defects (?, ?, ?, ?), the KZM through the second-order phase transition (?) and dynamical quantum phase transitions (?, ?). The condensate is described by a vector order parameter. Under single-mode approximation, all spin states share the same spatial wave function so that the spin and spatial degrees of freedom are decoupled (?, ?). For an antiferromagnetic (AFM) sodium condensate, its spin degrees of freedom exhibit a first-order quantum phase transition between an AFM phase with two levels equally populated and a polar phase with only the level populated ( is the magnetic quantum number). This system therefore provides an ideal platform to explore the dynamics across the first-order quantum phase transition. Indeed, many interesting phenomena, such as coarsening dynamics of the instability (?), nematic and magnetic spin density waves (?), and dynamical phase transitions (?), have been experimentally observed in the spinor condensate.
In this paper, we theoretically and experimentally study the scaling law as a quadratic Zeeman energy is slowly varied from positive to negative values (or from negative to positive values) across the first-order quantum phase transition between the polar phase and the AFM phase. Our numerical simulation shows the existence of a power-law scaling of the temporal onset of the spin excitations with respect to the quench rate. Similar to the KZM at the continuous quantum phase transition, we find that the dynamics exhibits two adiabatic and one frozen evolution region, suggesting the existence of the KZM. For the KZM, the power-law scaling exponent is directly related to the scaling of the energy gap. For the conventional one, the scaling exponent is determined by the energy gap between the ground state and the first excited state. However, we find that this does not agree with our simulation result. We therefore generalize the KZM by considering the energy gap between the maximally occupied state (corresponding to the metastable phase) and its corresponding first excited state. Using this gap, we find that the predicted exponent agrees very well with our simulation result.
We further perform experiments in the sodium condensate to show the power-law scaling of the temporal onset of spin excitations with respect to the quench rate by measuring the spin population. The experimental results agree well with our numerical simulations and the generalized KZM. Our result shows the first experimental evidence for the existence of the power-law scaling in the dynamics across the first-order quantum phase transition.
RESULTS
Theoretical analysis
We start by considering a spinor BEC, which is well described by the following Hamiltonian under single-mode approximation
| (1) |
where () is the annihilation (creation) operator for the spin component corresponding to the hyperfine level , is the condensate’s total spin operator along () with being the corresponding spin-1 angular momentum matrix, is the spin-dependent interaction ( for the antiferromagnetic sodium atoms), is the total atom number and () is the quadratic (linear) Zeeman energy.
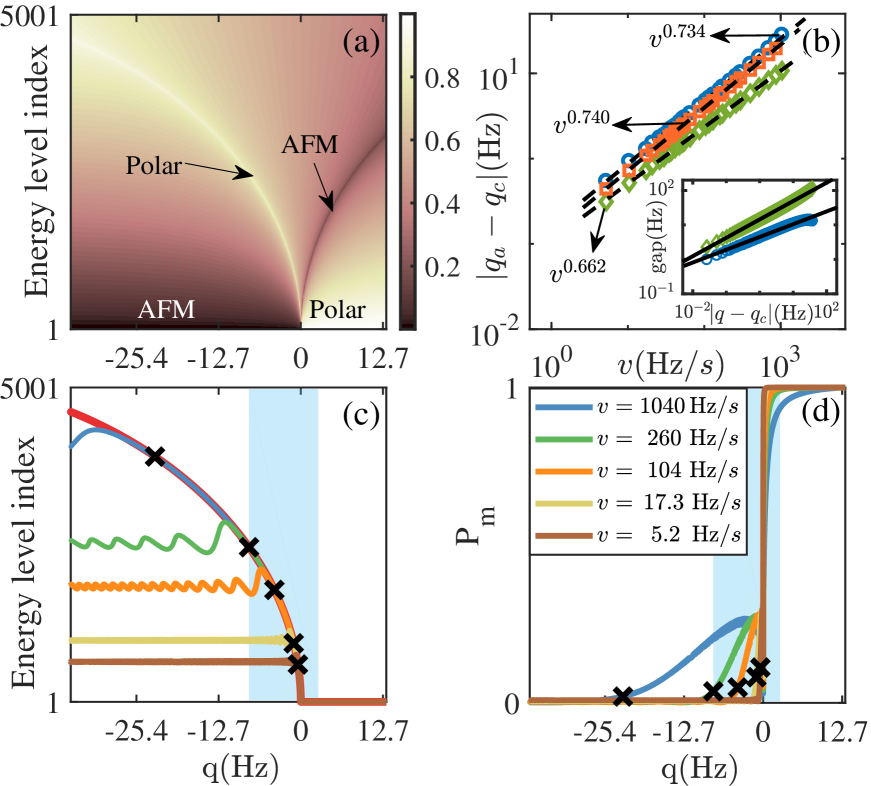
In the absence of the linear Zeeman energy (), there are two phases for the ground state: a polar phase with atoms all occupying the level for and the AFM phase with atoms equally occupying the levels for (?). If we take mean value with as an order parameter, we can clearly see that abruptly drops from one to zero at , showing the first-order quantum phase transition there [see Fig. 1(a)]. At the transition point , these two phases coexist. In fact, near this point, we can observe the existence of the polar phase for and AFM phase for as metastable states, which is the characteristic of the first-order phase transitions. In real experiments, is nonzero. However, since the Hamiltonian commutes with the total magnetization , i.e., , the quench dynamics is restricted in the subspace with zero magnetization if we prepare the initial state in the polar phase and the linear Zeeman term therefore becomes irrelevant.
To simulate the scaling in the dynamics across the first-order quantum phase transition, we start with the ground state of a spinor condensate in the polar phase for positive and then linearly vary the quadratic Zeeman energy by with , and characterizing the quench rate with being the total time as changes from to . To numerically simulate the dynamics, we solve the Schrödinger equation by directly diagonalizing the many-body Hamiltonian with Fock state basis (we will take for simplicity hereafter). The time evolution of can be obtained by for distinct . In the dynamics across the transition point, spin excitations from the polar state emerge, which can be reflected by the decrease of from one. Let be the temporal onset of the spin excitations and be the critical quadratic Zeeman energy at which the begins to change. In Fig. 1(b), we show the presence of a power-law scaling for with respect to the quench rate (see the orange squares).
To delve into the reason underlying the presence of the scaling, let us show the presence of impulse and adiabatic evolution regions. It is well known that a metastable phase exists across a first-order quantum phase transition as shown in Fig. 1(a). Intuitively, when we vary the system parameter across zero, the evolving state should stay around this metastable state if the energy gap relative to this metastable state is sufficiently small, suggesting the presence of an impulse region. Yet, when the energy gap becomes sufficiently large, the state cannot jump to the metastable state of the following so that begins to decrease, suggesting an entrance into an adiabatic region. Specifically, in the impulse region, an evolving state remains frozen in the initial state as time progresses. In other words, if the state remains in the initial state, its maximally occupied level for the evolving state is the same as the maximally occupied level for the initial state. Here the maximally occupied energy level of the evolving state is defined as the th eigenstate satisfying for all with being the eigenstate of , and the maximally occupied energy level for the initial state is defined as the th energy level that has the maximal overlap with the initial state, i.e., for all . The latter level coincides with the metastable polar phase with respect to [see Fig. 1(a) and (c)], which is consistent with the first-order quantum phase transition.
Interestingly, we find that when is varied across zero, the former maximally occupied level rapidly increases by following the latter maximally occupied one as shown in Fig. 1(c), suggesting the existence of an impulse region where the state remains frozen. In contrast, when the system leaves this region, the maximally occupied level begins approaching a fixed level, suggesting the presence of an adiabatic evolution. For instance, when , the maximally occupied level follows inside the blue region and then converges to around the 2510th level in the long time limit [see the green line in Fig. 1(c)].
To further demonstrate the existence of impulse and adiabatic regions in the dynamics, we compute the evolution of the probability of atoms occupying the maximally occupied level, i.e., . As shown in Fig. 1(d), we find that the probability changes rapidly near the transition point, consistent with the prediction of an impulse evolution, and remains almost constant in other regions, consistent with the prediction of an adiabatic evolution. In addition, we mark out as diagonal crosses determined by the numerical simulation, which agrees well with the where the system leaves the impulse region and enters the adiabatic region [see Fig. 1(c-d)].
The presence of the impulse and adiabatic regions suggests that the scaling law may be accounted for by the KZM. Suppose that at , and the system is in the polar phase. The is then linearly varied by . Based on the KZM, the critical time when the system begins to respond is determined by , where is the relaxation time proportional to with being the energy gap near the transition point. We can also determine the critical time by , after which the adiabaticity is restored. If the energy gap with being a positive real number, then the critical time is given by yielding . This shows a power-law scaling of with respect to and the scaling exponent is determined by the energy gap. At the second-order phase transition, the relevant energy gap is the gap between the ground state and the first excited state labelled as . In our system, this energy gap contributed by the Bogoliubov spin excitations as (?). This gives us , consistent with our numerical result [see Fig. 1(b)]. It also tells us that the finite-size effects are very small when (see the Supplementary Materials for details about finite-size effects). However, at the first-order transition point, the numerical evolution gives us the exponent of , which is larger than the value predicted by the KZM by more than . In stark contrast, if the energy gap is taken as the gap (dubbed the generalized energy gap) between the maximally occupied energy level, i.e., the th level and the corresponding first excited state relative to it, i.e., the th level, we find the exponent of , which agrees well with our numerical result. This is due to the different energy gap scaling as shown in the inset of Fig. 1(b) [the scaling exponent for the generalized energy gap is ]. For the maximally occupied energy level, while there are two gaps relative to it: one with the next level and the other with the previous level, only the former is relevant since it determines the impulse and adiabatic regions (see Materials and Methods for details). We call this method the generalized KZM. Yet, when we apply the generalized KZM to the second-order quantum phase transition, we find that the result is not as good as the one predicted by the first one, suggesting the difference between the first-order and second-order quantum phase transitions (see the Supplementary Materials for details about the KZM across the second-order quantum phase transition). While the energy gap for a second-order quantum phase transition generically exhibits a power-law scaling near the critical point, whether the power-law scaling of the generalized energy gap for a first-order quantum phase transition is universal is still an open question.
Experimental results
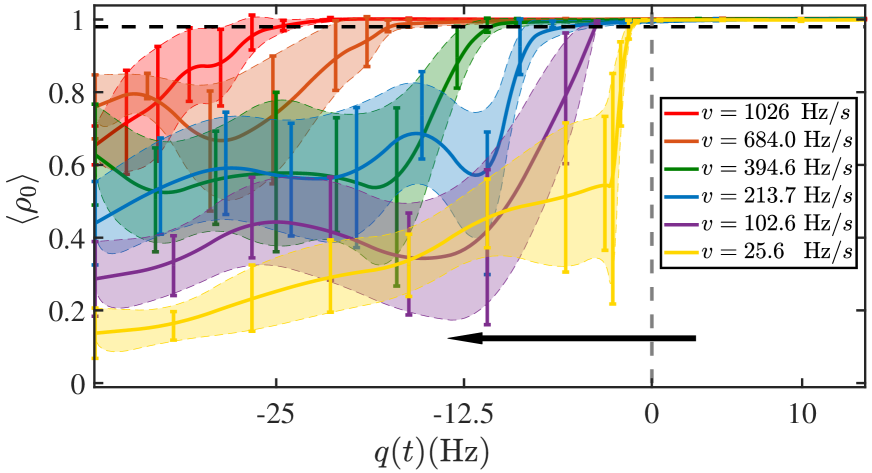
In experiments, we prepare a sodium BEC in the hyperfine state by evaporation of atoms in an all-optical trap (?) and then apply a strong magnetic field gradient to kick the atoms on the levels out of the optical trap, leaving all atoms on the level. After that, we hold the BEC atoms in a uniform magnetic field for to obtain a polar phase under the quadratic Zeeman energy of induced by the magnetic field. At the end of the holding, we turn on the microwave pulse with the frequency of (with the detuning of from to ) to change the quadratic Zeeman energy to (this time is defined as ). Subsequently, we linearly vary the quadratic Zeeman energy from to by ramping up the amplitude of the microwave field. During the entire ramping time, we control the microwave power by a PID system according to the calibration of the quadratic Zeeman energy (see Materials and Methods for details about the calibration). As time progresses, we apply the Stern-Gerlach fluorescence imaging to measure . At each time , we repeat measurements to obtain the average over the ensemble. Fig. 2 displays the observed as time evolves for a number of ramping rates . The is taken as the value when drops below the threshold . Evidently, approaches zero as is decreased.
To experimentally measure the power-law scaling, should be precisely probed. We here employ the quench dynamics to identify the error of transitions point (?) in our calibration. Besides, we also employ the result to evaluate the error of the (see Materials and Methods for details about the error evaluation).
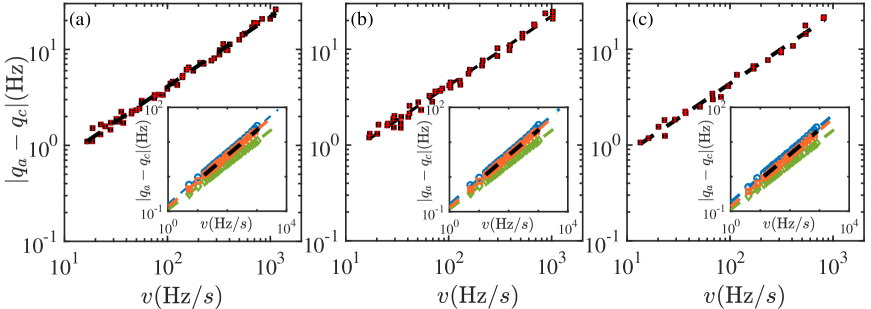
In Fig. 3(a-b), we plot the observed with respect to in the logarithmic scale, showing the existence of a power-law scaling, i.e., . The fitting of the experimental data gives the exponent of when and when , which are slightly different for different due to the finite-size effect. The experimental results are also in good agreement with the numerical simulation results: for the former and for the latter (see the insets in Fig. 3). We also calculate the scaling law determined by the KZM and find that the exponents predicted by the generalized KZM are for (a) and for (b), which are closer to the simulation and the experimental results than the exponents of and predicted by the KZM. In addition, we find that the scaling is not sensitive to the atom loss as we can still observe it in the presence of atom loss (see Materials and Methods for details about atom loss).
The scaling can also be observed when the system is driven from the AFM phase to the polar phase. In experiments, we prepare the initial state of the spinor BEC in a nearly AFM state by shining a -pulse radio frequency radiation to the BEC on the level. We then shine a resonant microwave pulse with the frequency of on the atoms for to remove the remaining atoms on the level to obtain an AFM state. After that, we suddenly switch off this microwave pulse and switch on another one with the frequency of . By controlling the amplitude of a microwave field, we are able to linearly vary the quadratic Zeeman energy from around to around . In Fig. 3(c), we show the experimentally measured relation between and , illustrating a power-law scaling with the exponent of , which agrees very well with the numerical simulation result of and the result of predicted by the generalized KZM.
DISCUSSION
In summary, we have theoretically and experimentally studied the dynamics across the first-order quantum phase transition in a spin-1 condensate. We find the existence of a power-law scaling of the temporal onset of the spin excitations with respect to the quench rate. The scaling is well explained by the generalized KZM. We further perform an experiment to observe the power-law scaling by measuring the spin populations, which agrees well with the numerical simulation and the generalized KZM results. Our experiment is the first one to observe the scaling in the dynamics across the first-order quantum phase transition and hence opens an avenue for further studying universal scaling laws for first-order quantum phase transitions both theoretically and experimentally.
MATERIALS AND METHODS
The relevant energy gap
For the maximally occupied energy level (the th level), there are two energy gaps relative to it: one gap (labelled as ) between this level and the next level [the ()th level] and the other (labelled as ) between this level and the previous level [the ()th level]. To show that is not relevant, let us suppose that were relevant. Let us further suppose that the evolving state occupies the maximally occupied energy level when we change the to . At this , if is very small compared to the quench rate and is very large compared to it, then the system should be in the impulse evolution region so that should remain unchanged. However, since the evolution is adiabatic with respect to the next level due to the large , the state cannot evolve to this level when we slightly decrease the , indicating that it cannot evolve to the maximally occupied energy level given that the level index of the maximally occupied level rises as the is decreased. This leads to the decrease of as we decrease the , which contradicts with the result that should remain unchanged. This conflict shows that the relevant gap is not .
Calibration of the spin-dependent interaction
The calibration of the spin-dependent interaction parameter in our experiments is achieved by applying a widely used spin oscillation procedure as detailed in the following.
In experiments, we first prepare the BEC in the polar state with all atoms occupying the level and then apply a radio frequency radiation to create a coherent state with and under a magnetic field, which contributes a quadratic Zeeman energy of . After that, the radio frequency radiation is switched off and the time evolution of the spinor condensates exhibits oscillations (?). Since the period and amplitude of the oscillations are determined by and , we can obtain by comparing the experimental results with the theoretical ones under a certain with where .
Specifically, we measure the spin oscillation diagram under six different magnetic quadratic Zeeman energy , and evaluate the mean value and standard deviation of , i.e., and with a narrow range of fluorescence counting number between a low limit and a high limit as shown by the horizontal error bar in Fig. S1.
Calibration of the quadratic Zeeman energy
To calibrate the quadratic Zeeman energy , we measure the Rabi frequency of transitions under a PID microwave power control system in experiments. We also apply the quench dynamics method to evaluate the error in the calibration process of .
In our experiments, the quadratic Zeeman energy is given by , where and are generated by the magnetic field and microwave pulse, respectively. The magnetic Zeeman energy is about in the whole ramping period. The microwave Zeeman energy is given by
| (2) |
where
| (3) | |||||
| (4) |
with being the resonant Rabi frequency for the transition from to and being the microwave detuning for the transition from to .
In experiments, we measure three Rabi frequencies of , and transitions corresponding to , and , respectively, and then determine the based on the above formula. The detuning of the microwave pulse is precisely controlled by the Keysight E8663D PSG RF Analog Signal Generator. Without a PID system, its power requires more than s to reach a stable value (after the RF amplifier ZHL-30W-252-S+), causing an error of about . We therefore apply a PID system to shorten the time for the microwave power to reach a set value to less than . The Rabi frequencies are measured during after the microwave pulse is switched on.
In Fig. S2, we plot the result of based on the experimentally measured Rabi frequencies at six distinct with frequency detuning . The figure also shows the fitting of these data by a parabola (see the dashed red line) and with this fitting line, the is controlled following the line shown in Fig. S2 (b) to realize the linear change of the .
In the following, we apply the quench dynamics to measure the quantum phase transition point and evaluate the calibration error. We first prepare the BECs in the polar phase under a positive and then suddenly quench the to . If is positive, the atoms remain on the level after evolution, and if is negative, the atoms on the levels show up after evolution. In experiments, is measured after this period of time for distinct as the microwave frequency is suddenly tuned to . To find the transition point, we control the to find the minimum so that remains unchanged and the maximum so that is decreased. Note that the decreases as the frequency is increased with varying from to . For these two frequencies , we calculate the quadratic Zeeman energy and , respectively, under the .
In table S1, we show the mean value and standard deviation of based on the quench dynamics data in one month. The error of the leads to the error of the as , where and are the standard deviations for and , respectively.
The effects of atom loss
In experiments, atom loss occurs due to the microwave and optical radiation. In Fig. S3, we display the amount of atom loss for different quench rates, showing that the amount increases when the is linearly decreased achieved by controlling the microwave amplitude and it also increases for smaller . Specifically, when , which is the slowest quench rate in the experiments, the amount of atom loss is roughly at the end of the ramp and near the point. Despite the presence of atom loss, it does not have obvious effects on our measured scaling property as shown in Fig. 3 in the main text.
References
- 1. A. Polkovnikov, K. Sengupta, A. Silva, M. Vengalattore. Colloquium: Nonequilibrium dynamics of closed interacting quantum systems. Rev. Mod. Phys. 83, 863 (2011).
- 2. T. W. B. Kibble. Some implications of a cosmological phase transition. Phys. Rep. 67, 183-199 (1980).
- 3. W. H. Zurek. Cosmological experiments in superfluid helium? Nature 317, 505-508 (1985).
- 4. W. H. Zurek. Cosmic strings in laboratory superfluids and the topological remnants of other phase transitions. Acta Phys. Polon. 24, 1301-1311 (1993).
- 5. W. H. Zurek. Cosmological experiments in condensed matter systems. Phys. Rep. 276, 177–221 (1996).
- 6. B. Damski. The Simplest Quantum Model Supporting the Kibble-Zurek Mechanism of Topological Defect Production: Landau-Zener Transitions from a New Perspective. Phys. Rev. Lett. 95, 035701 (2005).
- 7. W. H. Zurek, U. Dorner, P. Zoller. Dynamics of a Quantum Phase Transition. Phys. Rev. Lett. 95, 105701 (2005).
- 8. A. Polkovnikov. Universal adiabatic dynamics in the vicinity of a quantum critical point. Phys. Rev. B 72, 161201 (2005).
- 9. D. Chen, M. White, C. Borries, B. DeMarco. Quantum Quench of an Atomic Mott Insulator. Phys. Rev. Lett. 106, 235304 (2011).
- 10. S. Braun, M. Friesdorf, S. S. Hodgman, M. Schreiber, J. P. Ronzheimer, A. Riera, M. D. Rey, I. Bloch, J. Eisert, U. Schneider. Emergence of coherence and the dynamics of quantum phase transitions. PNAS 112, 3641-3646 (2015).
- 11. M. Anquez, B. A. Robbins, H. M Bharath, M. Boguslawski, T. M. Hoang, M. S. Chapman. Quantum Kibble-Zurek Mechanism in a Spin-1 Bose-Einstein Condensate. Phys. Rev. Lett. 116, 155301 (2016).
- 12. L. W. Clark, L. Feng, C. Chin. Universal space-time scaling symmetry in the dynamics of bosons across a quantum phase transition. Science 354, 606-610 (2016).
- 13. J. Zhang, F. M. Cucchietti, R. Laflamme, D. Suter. Defect production in non-equilibrium phase transitions: experimental investigation of the Kibble-Zurek mechanism in a two-qubit quantum simulator. New J. Phys. 19, 043001 (2017).
- 14. B. M. Anderson, L. W. Clark, J. Crawford, A. Glatz, I. S. Aranson, P. Scherpelz, L. Feng, C. Chin, K. Levin. Direct Lattice Shaking of Bose Condensates: Finite Momentum Superfluids. Phys. Rev. Lett. 118, 220401 (2017).
- 15. S. Kang, S. W. Seo, J. H. Kim, Y. Shin. Emergence and scaling of spin turbulence in quenched antiferromagnetic spinor Bose-Einstein condensates. Phys. Rev. A 95, 053638 (2017).
- 16. A. Keesling, A. Omran, H. Levine, H. Bernien, H. Pichler, S. Choi, R. Samajdar, S. Schwartz, P. Silvi, S. Sachdev, P. Zoller, M. Endres, M. Greiner, V. Vuletić, M. D. Lukin. Quantum Kibble-Zurek mechanism and critical dynamics on a programmable Rydberg simulator. Nature 568, 207-211 (2019).
- 17. H. Panagopoulos, E. Vicari. Off-equilibrium scaling behaviors across first-order transitions. Phys. Rev. E 92, 062107 (2015).
- 18. N. Liang, F. Zhong. Renormalization-group theory for cooling first-order phase transitions in Potts models. Phys. Rev. E 95, 032124 (2017).
- 19. I. B. Coulamy, A. Saguia, M. S. Sarandy. Dynamics of the quantum search and quench-induced first-order phase transitions. Phys. Rev. E 95, 022127 (2017).
- 20. A. Pelissetto, E. Vicari. Dynamic Off-Equilibrium Transition in Systems Slowly Driven across Thermal First-Order Phase Transitions. Phys. Rev. Lett. 118, 030602 (2017).
- 21. K. Shimizu, T. Hirano, J. Park, Y. Kuno, I. Ichinose. Dynamics of first-order quantum phase transitions in extended Bose-Hubbard model: from density wave to superfluid and vice versa. New J. Phys. 20, 083006 (2018).
- 22. S. R. Leslie, J. Guzman, M. Vengalattore, J. D. Sau, M. L. Cohen, D. M. Stamper-Kurn. Amplification of Fluctuations in a Spinor Bose Einstein Condensate. Phys. Rev. A 79, 043631 (2009).
- 23. M. Vengalattore, J. Guzman, S. R. Leslie, F. Serwane, D. M. Stamper-Kurn. Periodic spin textures in a degenerate spinor Bose gas. Phys. Rev. A 81, 053612 (2010).
- 24. J. Kronjäger, C. Becker, P. Soltan-Panahi, K. Bongs, K. Sengstock. Spontaneous Pattern Formation in an Antiferromagnetic Quantum Gas. Phys. Rev. Lett. 105, 090402 (2010).
- 25. J. Guzman, G.-B. Jo, A. N. Wenz, K. W. Murch, C. K. Thomas, D. M. Stamper-Kurn. Long-time-scale dynamics of spin textures in a degenerate 87Rb spinor Bose gas. Phys. Rev. A 84, 063625 (2011).
- 26. C. V. Parker, L. Ha, C. Chin. Direct observation of effective ferromagnetic domains of cold atoms in a shaken optical lattice. Nat. Phys. 9, 769-774 (2013).
- 27. L. E. Sadler, J. M. Higbie, S. R. Leslie, M. Vengalattore, D. M. Stamper-Kurn. Spontaneous symmetry breaking in a quenched ferromagnetic spinor Bose-Einstein condensate. Nature 443, 312-315 (2006).
- 28. L. S. Leslie, A. Hansen, K. C. Wright, B. M. Deutsch, N. P. Bigelow. Creation and Detection of Skyrmions in a Bose-Einstein Condensate. Phys. Rev. Lett. 103, 250401 (2009).
- 29. J. Choi, W. J. Kwon, Y. Shin. Observation of Topologically Stable 2D Skyrmions in an Antiferromagnetic Spinor Bose-Einstein Condensate. Phys. Rev. Lett. 108, 035301 (2012).
- 30. J. Choi, W. J. Kwon, M. Lee, H. Jeong, K. An, Y. Shin. Imprinting Skyrmion spin textures in spinor Bose-Einstein condensates. New J. Phys. 14, 053013 (2012).
- 31. H.-X. Yang, T. Tian, Y.-B. Yang, L.-Y. Qiu, H.-Y. Liang, A.-J. Chu, C. B. Dağ, Y. Xu, Y. Liu, L.-M. Duan. Observation of dynamical quantum phase transitions in a spinor condensate. Phys. Rev. A 100, 013622 (2019).
- 32. T. Tian, H.-X. Yang, L.-Y. Qiu, H.-Y. Liang, Y.-B. Yang, Y. Xu, L.-M. Duan. Observation of Dynamical Quantum Phase Transitions with Correspondence in an Excited State Phase Diagram. Phys. Rev. Lett. 124, 043001 (2020).
- 33. Y. Kawaguchi, M. Ueda. Spinor Bose-Einstein condensates. Phys. Rep. 520, 253-381 (2012).
- 34. D. M. Stamper-Kurn, M. Ueda. Spinor Bose gases: Symmetries, magnetism, and quantum dynamics. Rev. Mod. Phys. 85, 1191-1244 (2013).
- 35. E. M. Bookjans, A. Vinit, C. Raman. Quantum Phase Transition in an Antiferromagnetic Spinor Bose-Einstein Condensate. Phys. Rev. Lett. 107, 195306 (2011).
- 36. A. Vinit, E. M. Bookjans, C. A. R. Sá de Melo, C. Raman. Antiferromagnetic Spatial Ordering in a Quenched One-Dimensional Spinor Gas. Phys. Rev. Lett. 110, 165301 (2013).
- 37. A. T. Black, E. Gomez, L. D. Turner, S. Jung, P. D. Lett. Spinor Dynamics in an Antiferromagnetic Spin-1 Condensate. Phys. Rev. Lett. 99, 070403 (2007).
Acknowledgments
We thank Yingmei Liu, Ceren Dag, and Anjun Chu for helpful discussions. Funding: This work was supported by the Frontier Science Center for Quantum Information of the Ministry of Education of China, Tsinghua University Initiative Scientific Research Program, and the National key Research and Development Program of China (2016YFA0301902). Y. X. also acknowledges the support by the start-up fund from Tsinghua University, the National Thousand-Young-Talents Program and the National Natural Science Foundation of China (11974201). Author contributions: Competing interests: The authors declare that they have no competing interests. Data and materials availability: All data needed to evaluate the conclusions in the paper are present in the paper and/or the Supplementary Materials. Additional data related to the paper are available from authors upon request.
Supplementary materials
Supplementary Text
Section S1. Finite-size effects
Section S2. The KZM across the second-order quantum phase transition
Fig. S1. Calibration of the spin-dependent interaction .
Fig. S2. The experimental power control of the microwave pulse.
Fig. S3. Atom loss results.
Fig. S4. Effects of the atom number on the exponent.
Fig. S5. The scaling law across a second-order quantum phase transition.
Table S1. The error evaluation of .