First-principles calculation of electronic density of states and Seebeck coefficient in transition-metal-doped Si–Ge alloys
Abstract
High value and large Seebeck coefficient have been reported in the nanostructured Fe-doped Si–Ge alloys. In this work, the large Seebeck coefficient in Fe-doped Si–Ge systems is qualitatively reproduced from the computed electronic density of states, where a hybrid functional, HSE06, is used for an exchange-correlation functional, as well as a special quasi-random structure (SQS) for a disordered atomic configuration. Furthermore, by replacing Fe with other transition metals, such as Mn, Co, Ni, Cu, Zn, and Au, a better dopant that produces a larger Seebeck coefficient in Si–Ge alloy systems is explored.
pacs:
Valid PACS appear hereA vast amount of available energy has been wasted as heats, and it is expected that thermoelectric materials are employed to extract electricity from wasted-heats. Si–Ge alloys are known as one of the cheapest nontoxic thermoelectric materials utilized at high temperatures. The dimensionless figure of merit, , of Si–Ge alloys, however, is quite small; for both - and -type thermoelectric materials Rowe (1995).
The small values in Si–Ge alloys have been somewhat improved with the use of a nanostructuring approach, where a phonon conductivity is reduced by making a grain size small. To further increase the values of Si–Ge alloys, there are some attempts to modify their electronic band structure by doping transition metals Delime-Codrin et al. (2019); Omprakash et al. (2019); Takeuchi , and it has been reported that a quite high value, (at K), was obtained in the nanostructured Si0.55Ge0.35P0.10Fe0.01 sample, as well as a large Seebeck coefficient, V/K (at K) Delime-Codrin et al. (2019). It is believed that the large Seebeck coefficient originated from a strong peak at the edge of the conduction band in the electronic density of states generated by the Fe-doping (a so-called 3 impurity state), and this large Seebeck coefficient increased the value through the relation, . Although high values as well as large Seebeck coefficients have also been observed in other transition-metal-doped Si–Ge alloys, such as Au- Omprakash et al. (2019) and Ni-doped systems Takeuchi , their values and Seebeck coefficients were not as high as those of the Fe-doped system.
Although an occurrence of the 3 impurity states have been confirmed in an Fe-doped Si system using an electronic band structure calculation Delime-Codrin et al. (2019), that in Fe-doped Si–Ge system has not been confirmed yet either from an experimental or theoretical approach. In this work, therefore, the electronic density of states in Fe-doped Si–Ge alloys is calculated using an electronic band structure calculation, and the reported large Seebeck coefficient is reproduced from the computed electronic density of states. In addition, by substituting Fe with other transition metal (TM=Mn, Co, Ni, Cu, Zn, or Au), a better dopant for Si–Ge alloys that produces a larger Seebeck coefficient than that of Fe-doped systems is sought.
Si–Ge alloy forms a single solid solution over the whole composition range Olesinski and Abbaschian (1984), and it has been reported that the nanostructured Si0.55Ge0.35P0.10Fe0.01 sample sintered at 873 K and 400 GPa was also composed of a single solid solution Delime-Codrin et al. (2019). To describe a disordered configuration in a solid solution, a special quasi-random structure (SQS) Zunger et al. (1990); Wei et al. (1990) is employed here, which is the best periodic supercell to mimic the true disordered configuration using a small number of particles.
A SQS, which contains 64 atoms with a diamond structure (), is searched using mcsqs code available in the Alloy Theoretic Automated Toolkit (ATAT) Van de Walle et al. (2013). The following criterion is used to determine the SQS; pair correlation functions of SQS become nearly identical to those of the random alloy up to the third-nearest neighbors. The following alloy compositions are considered here; Si0.500Ge0.484Fe0.016 (or Si32Ge31Fe1) and Si0.781Ge0.203Fe0.016 (or Si50Ge13Fe1) for Fe-doped systems, and Si0.500Ge0.484TM0.016 (or Si32Ge31TM1) for TM-doped ones, where TM=Mn, Co, Ni, Cu, Zn, and Au from either 3 or 5 transition metals.
The electronic density of states of the SQSs is calculated using the projector augmented-wave (PAW) method Kresse and Furthmüller (1996) as implemented in the Vienna Simulation Package (VASP). Since it was confirmed that magnetic moments disappear during the electronic self-consistent-loop for all the transition-metal-doped systems, a non-spin-polarization calculation is conducted in this work. As an exchange-correlation functional, a hybrid functional introduced by Heyd, Scuseria, and Ernzerhof (HSE) Heyd et al. (2003) is employed, setting the range-separation parameter to 0.207 Å-1 (known as HSE06 Krukau et al. (2006)). The total energy of the supercell is minimized in terms of the volume, and their atomic positions are optimized until all force components are smaller than 0.01 . The plane wave cut-off energy is set to 350 eV, and the integration over the Brillouin zone is done, using Gaussian smearing of 0.05 eV with and -points for the structure relaxation and density of states calculations, respectively. Note that the equilibrium volume of the non-doped system is used for those of the doped systems, assuming that the volume change by doping is negligible; i.e., the equilibrium volume of Si0.500Ge0.500 (or Si32Ge32) and Si0.781Ge0.219 (or Si50Ge14) are used for those of Si0.500Ge0.484Fe0.016 (Si0.500Ge0.484TM0.016) and Si0.781Ge0.203Fe0.016 systems, respectively.
It is noteworthy that because a Seebeck coefficient is quite sensitive to the magnitude of a band gap, the use of a hybrid functional (HSE06) is important to evaluate the Seebeck coefficient in the doped Si–Ge alloys reliably. The band gap in the Si–Ge systems, as well as lattice constant, calculated using the HSE06 and generalized gradient approximation (GGA) of Perdew-Burke-Ernzerhof (PBE) Perdew et al. (1996) are compared in supplementary data. It is shown that HSE06 can reliably estimate both the band gap and lattice constant of the Si–Ge system compared to the GGA/PBE functional (see figures in supplementary data).
The Seebeck coefficient, , is defined as a constant of proportionality between the electric field, , and temperature gradient, ; i.e., . The Seebeck coefficient is given from the linear response theory as Mott and Jones (1936)
| (1) |
where is the unit charge of electron, is the chemical potential, is the energy, is the Fermi-Dirac distribution, and is the spectral conductivity. From the Bloch–Boltzmann theory, the spectral conductivity for an isotropic material is written as
| (2) |
where is the electronic density of states, is the group velocity, and is the relaxation time.
For a nanostructured bulk sample, an electron mean-free path, (), can be approximated to a nanograin size, (i.e., ) (a so-called small-grain-size limit Bera et al. (2010); Hao et al. (2016)). Then, the Seebeck coefficient, Eq. (1), becomes
| (3) |
Furthermore, by assuming that the group velocity, , is not sensitive to energy (i.e., ), Eq. (3) can be simplified to
| (4) |
From Eq. (4), the Seebeck coefficient for a nanostructured bulk sample can be estimated just from an electronic density of states.
Note that the chemical potential depends on temperature through the relation; , where is the number of electrons in a system. Instead of giving , the chemical potential at the ground state , which corresponds to the Fermi energy in the “doped” system, is specified in this work. (Hereinafter, the Fermi energy in the “non-doped” and “doped” systems are represented as and , respectively.)
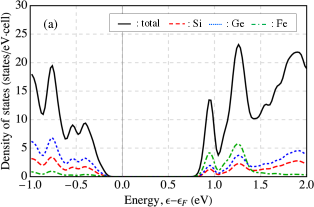
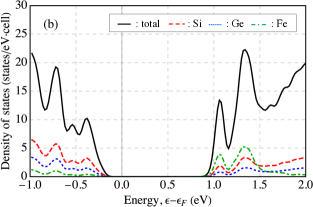
The calculated electronic density of states in the Si0.500Ge0.484Fe0.016 and Si0.781Ge0.203Fe0.016 alloys are, respectively, shown in Figs. 1 (a) and (b), where their partial density of states of Si, Ge, and Fe are also presented. From these results, one can see that there are two strong peaks mainly originated from the Fe-doping at the edge of the conduction band for both the compositions. A similar impurity state has been reported in the Si0.993Fe0.007 (or Si143Fe1) alloy system Delime-Codrin et al. (2019), where its electronic density of states was calculated using density functional theory with the GGA/PBE functional.
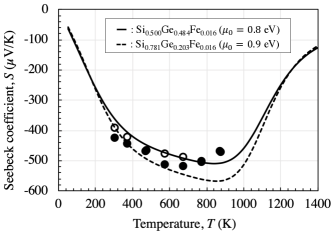
The Seebeck coefficients calculated from Eq. (4) using the total density of states shown in Fig. 1 are presented in Fig. 2. Here, the Fermi energies (or chemical potentials at the ground state), , are set to the bottom of the conduction band. From Fig. 2, the Seebeck coefficient of the Si0.781Ge0.203Fe0.016 alloy shows a larger value compared to that of the Si0.500Ge0.484Fe0.016 alloy. This is because the former composition has a larger band gap compared to the latter one, as can be seen in Fig. 1. The experimental data for the nanostructured Si0.55Ge0.35P0.10Fe0.01 sample are also shown in Fig. 2. One can see that the calculated Seebeck coefficients are quite close to the experimental data Delime-Codrin et al. (2019).
Next, electronic density of states and Seebeck coefficient in other transition-metal-doped systems are presented. The calculated electronic density of states in the Si0.500Ge0.484TM0.016 alloy systems (TM=Mn, Co, Ni, Cu, Zn, and Au) are shown in Fig. 3. From Fig. 3, the impurity state originating from the TM-doping can be seen at the bottom of the conduction band in the Mn-doped system, whereas those in other TM-doped systems are at the top of the valence band.
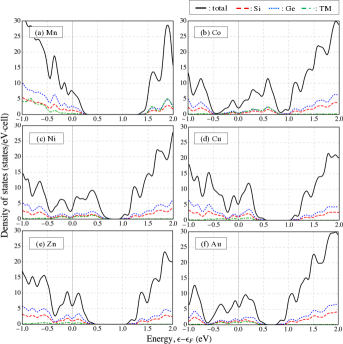
To obtain a large Seebeck coefficient, it is important to have not only a sharp peak at the end of either valence or conduction band, but also a large band gap (as can be seen in the Fe-doped system, Fig. 1). Since the band gap in the Mn-doped system is larger than that in the Fe-doped one (see Fig. 1 (a)) and there are large impurity states, it is expected that the Mn-doped system has a larger Seebeck coefficient than that of the Fe-doped system.
The calculated Seebeck coefficient in the TM-doped systems are shown in Fig. 4, where the result of the Fe-doped system (the same result shown in Fig. 2) is presented as well. Depending on the value of the Fermi energy, , the TM-doped systems show either - or -type thermoelectric characteristics. Here, the is set to either the end of valence or conduction band depending on the position of the impurity states. From Fig. 4, the magnitude of the Seebeck coefficients of the Co-, Ni-, Cu-, Zn-, and Au-doped systems are smaller than that of Fe-doped system, but the Mn-doped system shows larger Seebeck coefficient than that of the Fe-doped system at high temperatures ( K), as expected from their calculated electronic density of states.
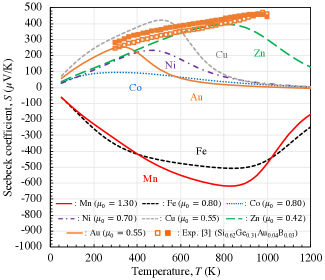
The experimentally measured Seebeck coefficients in the nanostructured Si0.62Ge0.31Au0.04B0.03 sample Omprakash et al. (2019) are also shown in Fig. 4. Compared to the experimental data, the calculated Seebeck coefficients in the Au-doped system are significantly underestimated at high temperatures. The main reason of this discrepancy would be the existence of a secondary phase in the measured sample Omprakash et al. (2019). In addition, the difference in the alloy compositions between the calculation and experiments is also considered to be the cause of the discrepancy. Since band gap of Si is larger than that of Ge, it is expected that band gap is increased by increasing the fraction of Si in the calculated Au-doped system, which will result in the increase of Seebeck coefficient at high temperatures.
From the calculated Seebeck coefficients, it is expected that the Mn-doping is better than the Fe-doping for the Si–Ge alloy system. However, the value depends not only on the Seebeck coefficient but also on the electrical resistivity, , as , where is the thermal conductivity. In general, the electrical resistivity is increased with the band gap. Thus, the electrical resistivity (as well as the thermal conductivity) needs to be evaluated to conclude whether the Mn-doped system is better thermoelectric materials than the Fe-doped system or not.
Note that it is assumed that the doped transition metals occupy substitutional sites, but it is uncertain whether they are located at substitutional or interstitial sites. To make clear their preferred sites from density functional theory, their formation energies need to be calculated and compared. However, this is beyond the scope of this paper and is left for future work.
In conclusion, the electronic density of states and Seebeck coefficient in the TM-doped Si–Ge systems (TM=Mn, Fe, Co, Ni, Cu, Zn, and Au) were investigated from the first-principles calculations with a hybrid functional (HSE06) using disordered configurations prepared based on the SQS. The impurity states in the Fe-doped Si–Ge systems were successfully produced, and the reported large Seebeck coefficients in the nanostructured Si0.55Ge0.35P0.10Fe0.01 sample were quantitatively reproduced from the computed electronic density of states. Using the same methodology, the electronic density of state and Seebeck coefficient of other TM-doped Si–Ge systems (TM=Mn, Co, Ni, Cu, Zn, and Au) were calculated. It was found that Mn-doping produces strong impurity states at the bottom of conduction band, and the See beck coefficient is larger than that of the Fe-doped system at high temperatures. Thus, Mn is considered to be a better dopant for the Si–Ge systems from the perspective of the Seebeck coefficient.
Acknowledgement
This work was supported by Japan Science and Technology Agency (JST) CREST, Grant Number: JPMJCR1812.
References
- Rowe (1995) D. M. Rowe, CRC handbook of thermoelectrics (CRC press, 1995).
- Delime-Codrin et al. (2019) K. Delime-Codrin, M. Omprakash, S. Ghodke, R. Sobota, M. Adachi, M. Kiyama, T. Matsuura, Y. Yamamoto, M. Matsunami, and T. Takeuchi, Applied Physics Express 12, 045507 (2019).
- Omprakash et al. (2019) M. Omprakash, K. Delime-Codrin, S. Ghodke, S. Singh, S. Nishino, M. Adachi, Y. Yamamoto, M. Matsunami, S. Harish, M. Shimomura, and T. Takeuchi, Japanese Journal of Applied Physics 58, 125501 (2019).
- (4) T. Takeuchi, private communication.
- Olesinski and Abbaschian (1984) R. W. Olesinski and G. J. Abbaschian, Journal of Phase Equilibria 5, 180 (1984).
- Zunger et al. (1990) A. Zunger, S.-H. Wei, L. G. Ferreira, and J. E. Bernard, Physical Review Letters 65, 353 (1990).
- Wei et al. (1990) S.-H. Wei, L. G. Ferreira, J. E. Bernard, and A. Zunger, Physical Review B 42, 9622 (1990).
- Van de Walle et al. (2013) A. Van de Walle, P. Tiwary, M. De Jong, D. L. Olmsted, M. Asta, A. Dick, D. Shin, Y. Wang, L.-Q. Chen, and Z.-K. Liu, Calphad 42, 13 (2013).
- Kresse and Furthmüller (1996) G. Kresse and J. Furthmüller, Computational Materials Science 6, 15 (1996).
- Heyd et al. (2003) J. Heyd, G. E. Scuseria, and M. Ernzerhof, The Journal of chemical physics 118, 8207 (2003).
- Krukau et al. (2006) A. V. Krukau, O. A. Vydrov, A. F. Izmaylov, and G. E. Scuseria, The Journal of chemical physics 125, 224106 (2006).
- Perdew et al. (1996) J. P. Perdew, K. Burke, and M. Ernzerhof, Physical review letters 77, 3865 (1996).
- Mott and Jones (1936) N. F. Mott and H. Jones, The Theory of the Properties of Metals and Alloys, Oxford (1936).
- Bera et al. (2010) C. Bera, M. Soulier, C. Navone, G. Roux, J. Simon, S. Volz, and N. Mingo, Journal of Applied Physics 108, 124306 (2010).
- Hao et al. (2016) Q. Hao, D. Xu, N. Lu, and H. Zhao, Physical Review B 93, 205206 (2016).