Shape isomers in Pt, Hg and Pb isotopes with N 126
Abstract
Deformation-energy surfaces of 54 even-even isotopes of Pt, Hg and Pb nuclei with neutron numbers up to 126 are investigated within a macroscopic-microscopic model based on the Lublin-Strasbourg-Drop macroscopic energy and shell plus pairing-energy corrections obtained from a Yukawa-folded mean-field potential at the desired deformation. A new, rapidly converging Fourier shape parametrization is used to describe nuclear shapes. The stability of shape isomeric states with respect to non-axial and higher-order deformations is investigated.
pacs:
21.10.Dr, 21.10.Ma, 21.60.Cs, 21.60.Jz, 25.85.Ca1 Introduction
Recent experimental investigations studying the structure of neutron deficient Lead and Mercury isotopes evidenced a shape coexistence phenomenon (see e.g. Refs. And00 ; HWo11 ) thus giving a strong impetus to theoreticians to explore this region of nuclei in more detail. Important advances in the study of neutron-deficient nuclei have been realized using tagging techniques in the Accelerator Laboratory of the University of Jyväskylä, Finland Julin2016 , through Coulomb-excitation experiments undertaken at the REX-ISOLDE facility in CERN WLG16 , or isomeric and -decays of nuclei populated by relativistic energy-fragmentation experiments podo2012 performed at GSI within the RISING campaign. Several interesting theoretical studies on that subject, based either on a self-consistent approach (see e.g. Refs. BHR03 ; YBH13 ; NRR13 ; NVR02 ) or on macroscopic-microscopic models (see e.g. MSB09 ), have been published in the last two decades.
The aim of the current paper is to present a systematic study of the potential energy surfaces of even-even Pt, Hg, and Pb isotopes with neutron number using a very efficient shape parametrization that we recently developed PNB15 ; SPN17 . We have chosen to carry out our study using the macroscopic-microscopic (mic-mac) approach with the Lublin-Strasbourg Drop (LSD) PDu03 , able to reproduce accurately both nuclear masses and fission barriers, and a Yukawa-folded single-particle potential DNi76 ; DPB16 to account for shell and pairing-energy corrections. A similar kind of investigation of nuclear potential-energy surfaces for a wide range of nuclei has been carried out in Ref. MSB12 using the () deformation space. Our study is, however, different in several aspects: another expression is used for the macroscopic energy, the evaluation of pairing and shell-correction energy is different, and, most importantly, a better more general nuclear shape parametrization is used in our present approach. In addition, the range of nuclear quadrupole deformations in Ref. MSB12 is smaller than the one in our present study, with the consequence that the super-deformed minima found by us are not present in the energy landscapes presented in Ref. MSB12 .
The present investigation is also similar to those described in our previous
study on shape isomers in the same mass region NPB17 , with, however,
several differences:
the present calculations are carried out for a larger set of
isotopes (170-204Pt, 172-206Hg, and 174-208Pb),
the potential energy surfaces (PES) are studied here in two
4-dimensional
deformation spaces: () and (),
where describes a non-axial degree of freedom, and the
parameters correspond roughly to multipole deformations,
a denser grid of deformation parameters than that of
Ref. NPB17 is used,
an average pairing energy taking into account the effect of an
approximate particle-number projection is included.
2 Theoretical model and details of the calculations
In the macroscopic-microscopic method MSw66 the total energy of a nucleus at a given deformation can be calculated as the sum of the macroscopic (liquid-drop type) energy and quantum correction terms for protons and neutrons generated by shell and pairing effects:
| (1) |
The LSD model PDu03 is used to evaluate the macroscopic part of the energy. Shell corrections are obtained, as usual, by subtracting the average energy from the sum of the single-particle (s.p.) energies of occupied orbitals
| (2) |
Here the s.p. energies are simply the eigenvalues of a mean-field Hamiltonian with a Yukawa-folded s.p. potential at the desired deformation. The average energy is evaluated using the Strutinsky prescription Str66 ; NTS69 with an 6th order correction polynomial. The pairing correction is determined as the difference between the BCS energy BCS57 and the single-particle energy sum and the average pairing energy NTS69 :
| (3) |
In the BCS approximation the ground-state energy of a system with an even number of particles and a monopole pairing force is given by
| (4) |
where the sums run over the pairs of s.p. states contained in the pairing window defined below. The coefficients and are the BCS occupation amplitudes, and is the pairing-energy correction due to the particle number projection done in the GCM+GOA approximation GPo86
| (5) |
where are the quasi-particle energies, and and denote the pairing gap and the Fermi energy, respectively. The average projected pairing energy, for a pairing window of width , which is symmetric in energy with respect to the Fermi energy, is equal to
| (6) |
Here is the average single-particle level density and the average paring gap corresponding to a pairing strength
| (7) |
The width of the pairing window for protons or neutrons is chosen so as to contain (N or Z) s.p. states around the Fermi surface. For such a window the pairing strength can be approximated by PPS89
| (8) |
where is the mass number, and we have used the same value for protons and neutrons with MeV.
In the whole calculation the single-particle spectra are obtained by diagonalization of a Hamiltonian with a Yukawa-folded mean-field potential DNi76 ; DPB16 having the same parameters as those used in Ref. MNi95 .
The macroscopic-microscopic energy landscape of each nucleus is evaluated as function of the different deformation degrees of freedom by using the Fourier parametrization of the nuclear shape that we recently developed PNB15 :
| (9) |
where is the half-length of the shape and locates the centre of mass of the nucleus at the origin of the coordinate system. It turns out that one can define what we will call “optimal coordinates”, , through SPN17
| (10) |
in such a way that the liquid-drop energy as function of the elongation becomes minimal along a track that defines the liquid-drop path to fission. The in Eq. (10) are the expansion coefficients of a spherical shape given by . Non-axial shapes can easily be obtained assuming that, for a given value of the -coordinate, the surface cross-section has the form of an ellipse with half-axes and SPN17 :
| (11) |
where the parameter describes the non-axial deformation of the nuclear shapes. The volume conservation condition requires that .
A similar kind of investigation has been undertaken in Ref. MSB12 for a much wider range of nuclei (7206 isotopes with masses between A31 and A290) but for a much more restricted deformation space (3 deformation parameters and corresponding respectively to quadrupole, hexadecapole and axial asymmetry), whereas our deformation space contains the deformation parameters of Eq. 10) plus one axial asymmetry parameter defined in Eq. (11). The study of Ref. MSB12 was also carried out using the macroscopic-microscopic method, but with the finite-range liquid droplet model (FRLD), while in the present study we use the Lublin-Strasbourg Drop model (LSD) PDu03 . As it was shown in Ref. PDu03 , the use of deformations of higher multipolarity, that are different in both models, induces a different stiffness of the PES, what has a non negligible effect on the energy landscape. At difference from Ref. MSB12 where a pairing treatment in the BCS approach was used together with the Lipkin-Nogami prescription to take into account the effect of the projection on the correct particle number, we use an approximate GCM+GOA particle-number projection in our approach GPo86 ; PPS89 , which yields results that are much closer to the exact ones, in particular in the weak-pairing limit.
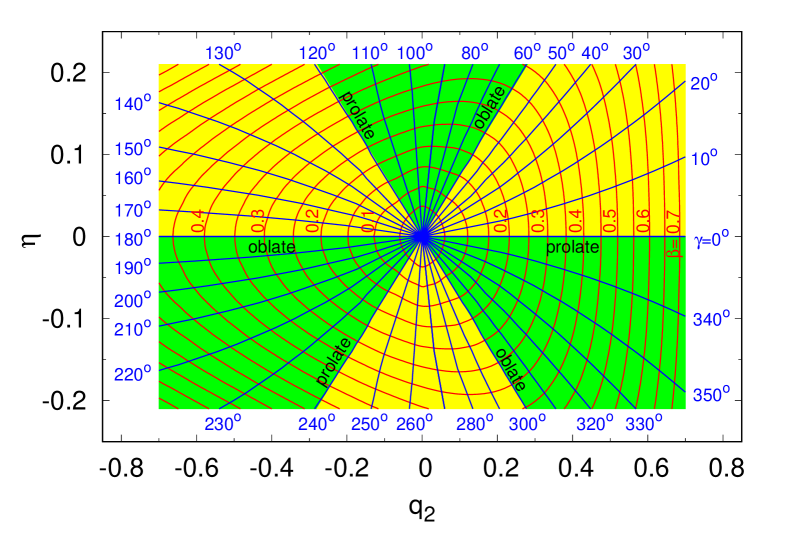
The above description of non-axial shapes of deformed nuclei () is more general than the commonly used () parametrization by Bohr Boh52 ; KSP76 . For spheroidal shapes both descriptions are, however, equivalent. As one can see from Fig. 1, where the two parametrizations are compared, the periodicity of the nuclear shapes by an angle of 60∘ is similar in the () and in the () planes. One has, however, to keep in mind that this regularity is partially spoiled when higher multipolarity deformations () come into play, which makes that our () shape parametrization is substantially more general than the 3-dimensional parametrization used in Ref. MSB12 . It is only for the very special case of spheroidal shapes that both parametrization coincide.
It is important, in this context, to stress that there are different points in the (), as in the () plane, that correspond, when higher degrees of freedom are neglected (and only under that assumption!), to precisely the same shape, with the only difference that the axes of the coordinate system have been interchanged (like ). As an example, the point (), described by () in the new parametrization, identifies obviously the same shape as () or equivalently in the new parametrization by (). When investigating potential energy landscapes, where the triaxial degree of freedom is taken into account, one therefore should be extremely careful, not to consider as two different configurations points in the () deformation plane that are nothing but rotation images of one another.
3 Results
The calculations of the potential-energy surfaces were performed for the isotopic chains of even-even Pt, Hg and Pb nuclei, with the same range of neutron numbers between =92 and =126. The macroscopic-microscopic energy of each isotope was evaluated in a four-dimensional (4D) deformation space spanned by the , , , and coordinates [see Eqs. (10) and (11)]. In parallel, a calculation made in the 3D space of the , , and deformation parameters was carried out in order to test the effect of higher-order deformations on the PES in the considered nuclei.
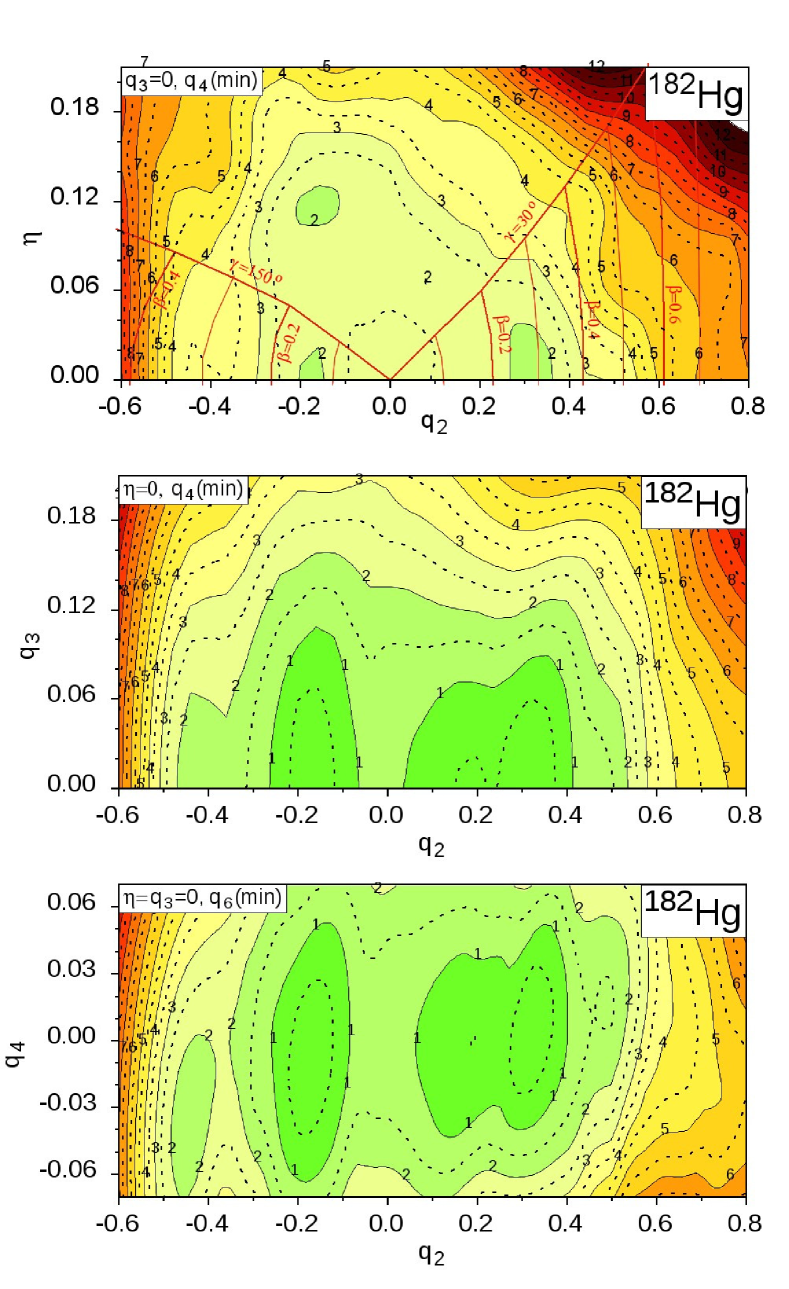
Our calculations in the 4D deformation space spanned by the , , , and coordinates, clearly show that the left-right asymmetry degree of freedom does not decrease the potential energy at any of the studied deformations, in any of the here considered nuclei, as one can see in the (), () and () PES presented in Fig. 2 for the 182Hg nucleus, chosen here as a representative case for all the nuclei in the present study. The PES shown are generally defined as the difference of the total nuclear energy (1) of the deformed nucleus and the one of the corresponding spherical shape evaluated using the LSD macroscopic model. All energy points in the () map (top of Fig. 2) are minimized with respect to the and deformation degrees of freedom. The additional red lines indicate the corresponding () coordinates, with two sectors, namely and explicitly indicated, which correspond to the lower and upper part of the () map in which only the sector is traditionally displayed (see e.g. Ref. KSP76 ). In addition, red lines representing values are drawn. The part of the () map between the and lines is usually omitted when one projects a multidimensional macro-micro or self-consistent PES onto the () plane, loosing hereby, as we have explained above, some information on the impact of higher multipolarities. We have therefore decided to show in the following the full () maps in order not to lose part of the results, which could be important when e.g. the deepest minimum would appear in this upper part of the map.
In the middle panel of Fig. 2 is shown the PES in the plane which has been obtained for the axial symmetric case () after minimization with respect to the degree of freedom. In this and in the rest of the energy landscapes shown in the following, solid lines correspond to layers separated by 1 MeV, while the distance between dashed and neighbouring solid lines is of 0.5 MeV. The labels on the layers denote energies in MeV.
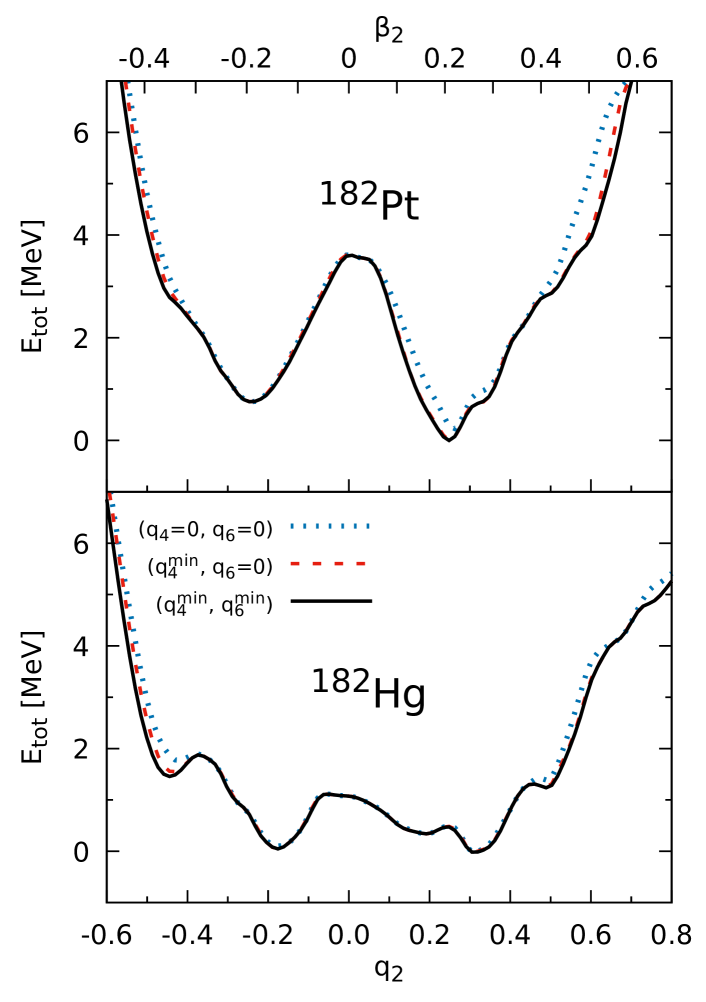
The PES displayed in the bottom panel of Fig. 2 shows the energy landscape in the () plane. The structure of the PES is seen to be rather complex and quite a few local minima can be observed in this cross-section of our 5D deformation space, two on the oblate () and three on the prolate side. One has to bear in mind, however, that one is looking here only at a 2D cross-section of a 5D deformation space and that the stability of these local minima with respect to the other deformation degrees of freedom, especially the non-axial , should be carefully studied in each case. Also the role of the higher multipole deformation needs to be analysed. We have therefore tried to investigate the impact of these higher-multipole degrees of freedom on the deformation energy of 182Pt and 182Hg. The results of this study is shown in Fig. 3, where the energy as function of the elongation parameter is shown in a 1D cross-section of the PES and where different lines indicate the importance of different higher-order deformations. These deformation energies which are typical for all the considered nuclei in the three here investigated isotopic chains, clearly show that the role of deformations is practically negligible, thus demonstrating that the “optimal coordinates” , defined in Eq. (10), have, indeed, been skilfully chosen.
An overview of the deformation energies as function of the elongation parameter is shown in Fig. 4 for the nuclei of the three Pt, Hg, and Pb isotopic chains with neutron numbers , where the potential energy of each isotope is minimized with respect to and . The left-right asymmetry degree of freedom is not included in this study, since for all the here considered nuclei it does not play any noticeable role as demonstrated above. Lines corresponding to different isotopes are drawn in different colours and the ground-state energy minimum of each isotope is shifted by 1 MeV with respect to the previous isotope in order to separate the curves. In each diagram the bottom and top lines are marked by the corresponding mass number A for better visibility. The experimental excitation energies of the super-deformed (SD) minima are also shown when available, as in the case of Hg and Pb nuclei.
In the upper parts of each diagram in Fig. 4 the corresponding values of the quadrupole deformation are also given. This deformation parameter is defined by the harmonic expansion of the radius of a deformed nucleus:
| (12) |
where are the spherical harmonics. Such an expansion is frequently used in publications dealing with PES calculated in the mac-mic approach (see e.g. Ref. JKS17 ),
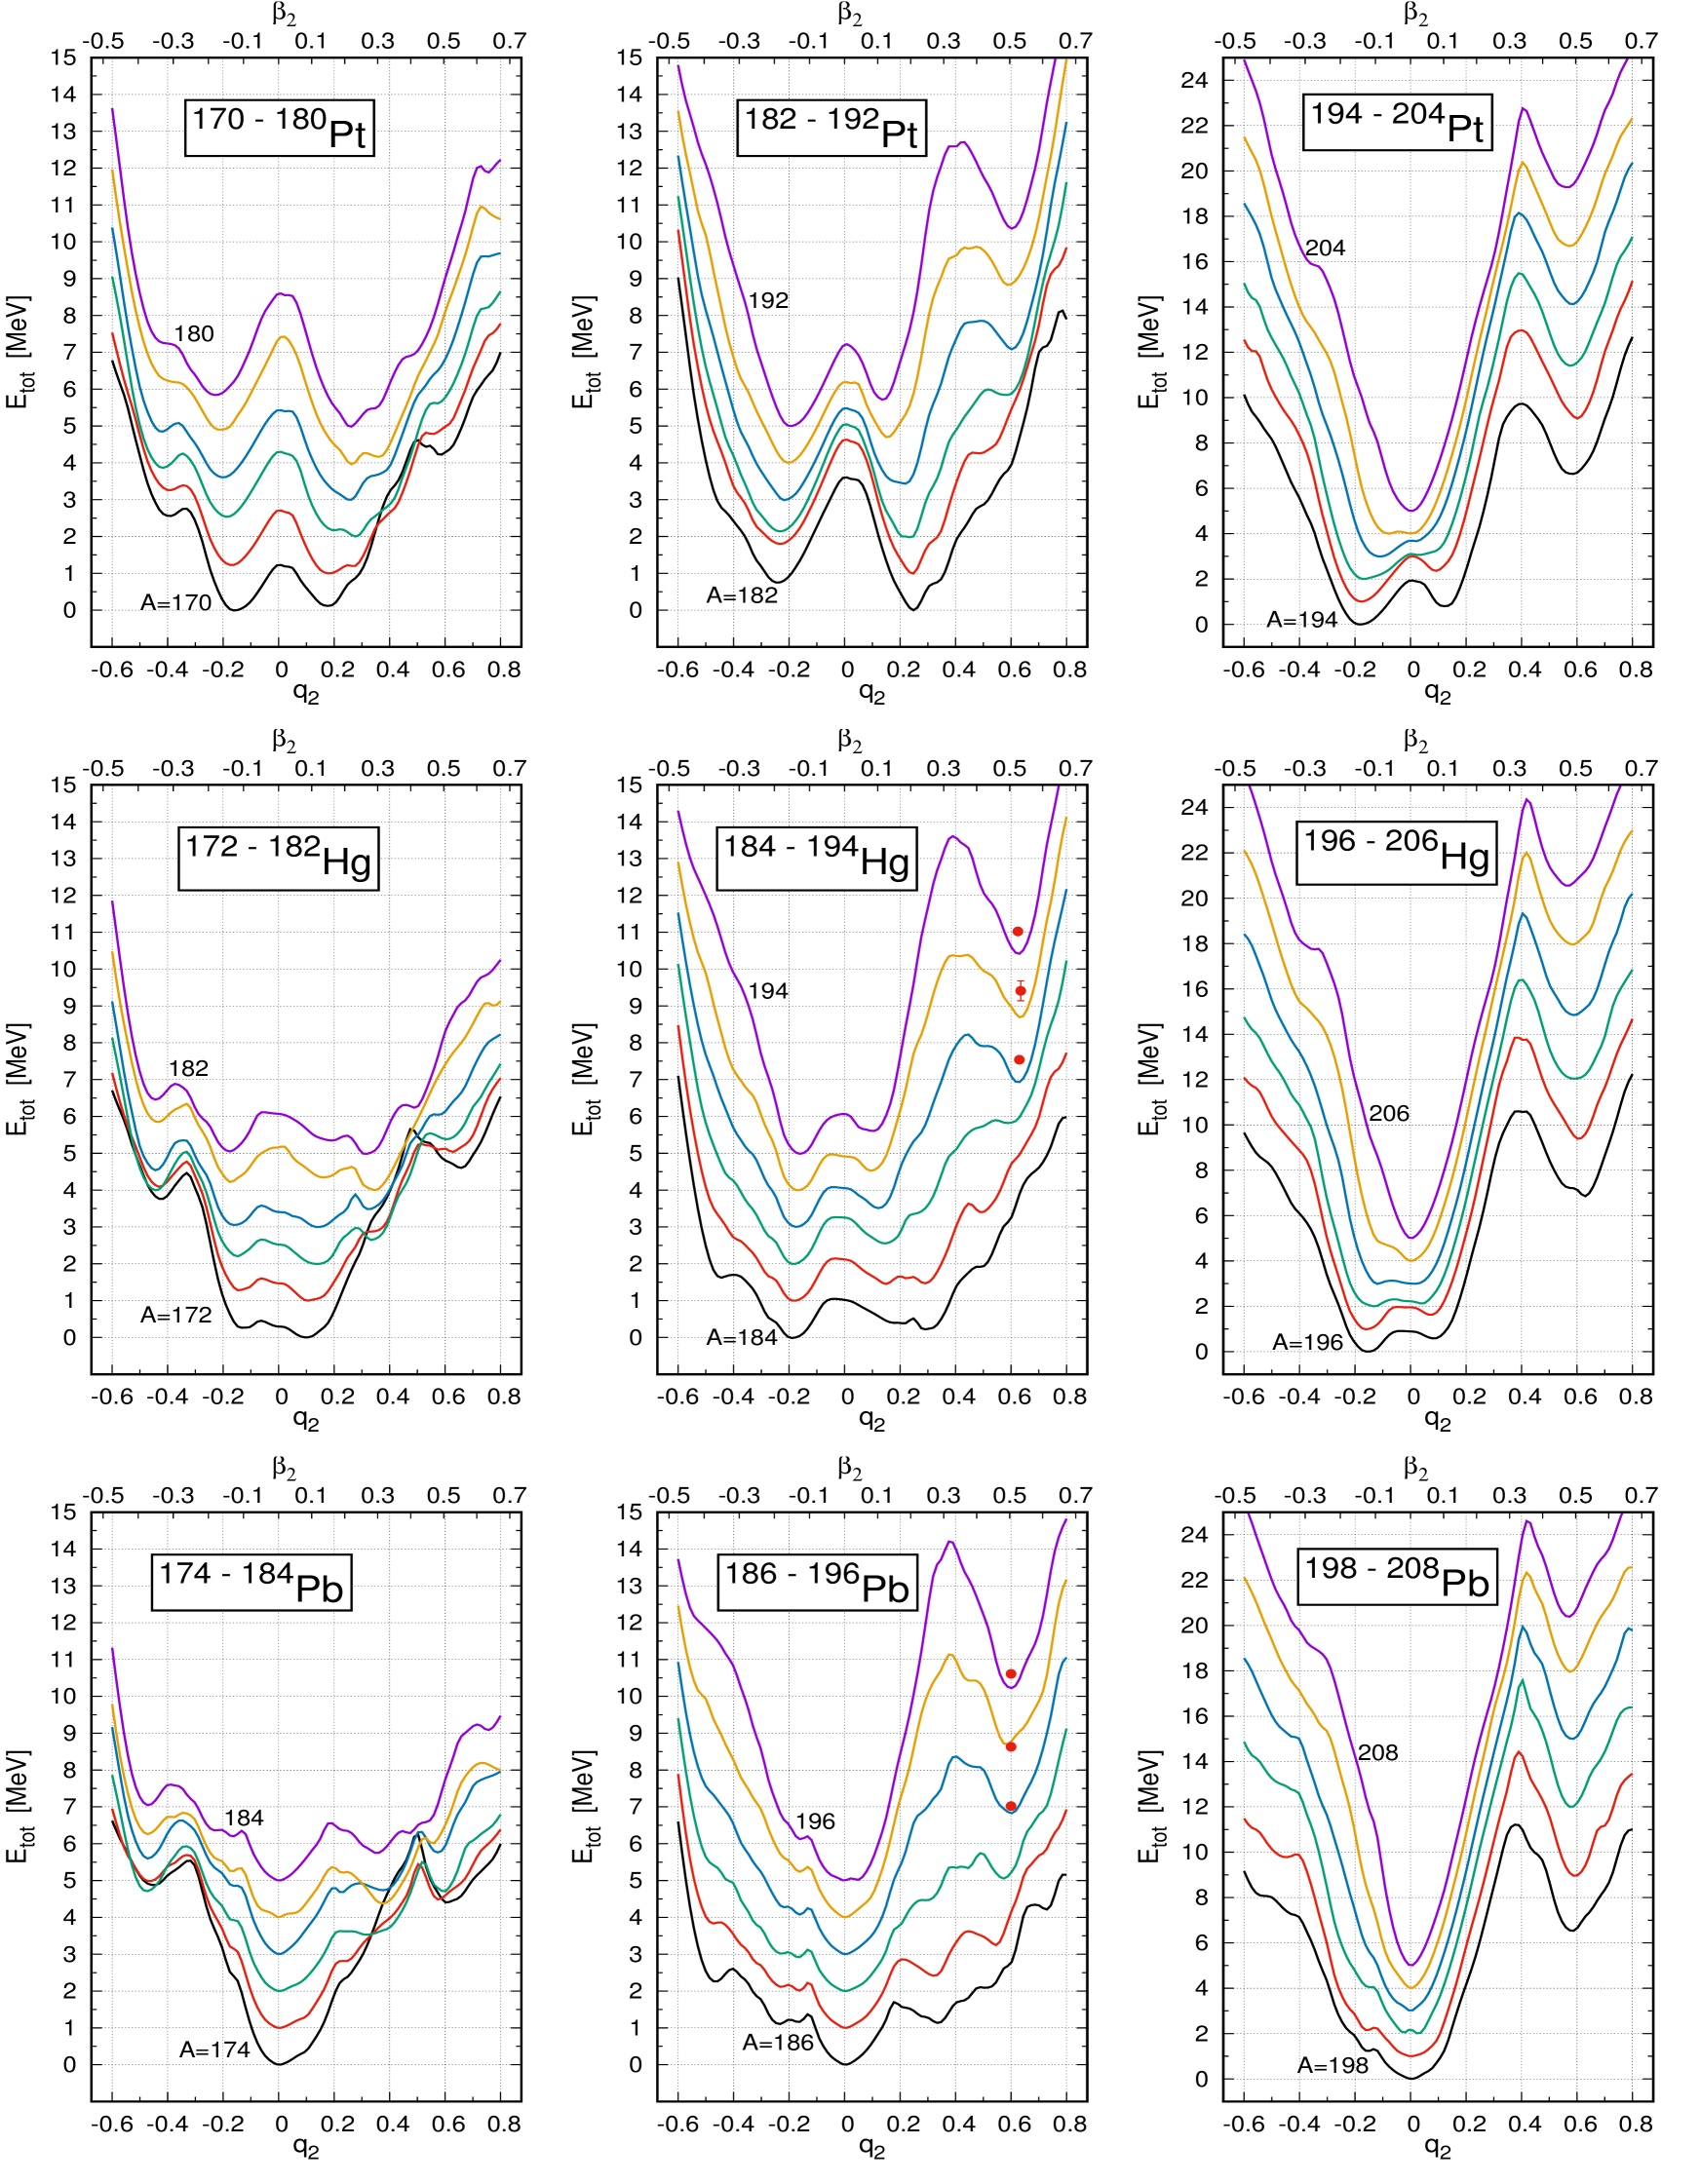
but turns out to be very slowly converging at large nuclear elongations (as shown in Refs. PNB15 ; SPN17 ; DPB75 ). The experimental energies corresponding to the bottom of the SD bands, measured with respect the ground state, are marked by the red points in Fig. 4. These experimental data are taken from Ref. (LLL16 , Fig. 46) and found in all cases to be in quite good agreement with our theoretical predictions.
Quite pronounced oblate and prolate minima around and are found in all Pt isotopes, except that one finds, when looking just at such a kind of 1D deformation energy, that beyond 194Pt (with neutron number larger than N116) the prolate minimum at gradually looses its importance at the profit of a super-deformed (SD) shape isomer located around . One has, however, to keep in mind that we have, for the moment, completely left out of our considerations the non-axial degree of freedom. As we will see in Fig. 7 in Subsection 3.1, that analysis will change, when we will take that additional degree of freedom into account. While in 170Pt the ground-state deformation is oblate, situated only about 200 keV below the prolate minimum, heavier Pt isotopes with show a prolate ground state. The situation changes again in the case of still heavier Pt isotopes , where the oblate minimum becomes again deeper with a deformation energy, however, that gets smaller and smaller with growing neutron number as one approaches to the magic number when the isotopes 202-204Pt become spherical. The largest deformation energy of MeV is predicted by our calculation to occur in 178-184Pt. A delicate structure appears on the prolate side in 172-178Pt isotopes when two minima around and begin to compete. At this point one cannot really judge about the stability of these local minima and an eventual shape coexistence by looking at such a 1D plot only. A more extended study which takes also the non-axial degree of freedom into account is necessary and will be carried out in Subsection 3.1.
Apart from the minima at deformations typical for the ground state, strongly oblate minima at are found in 170-176Pt isotopes, minima that are separated from the normal-deformed oblate one by a small barrier of only 0.5 MeV. In addition, a rather strongly deformed pronounced prolate minimum at is observed both in the lightest here studied Pt isotope 170Pt, as well as in Pt isotopes with A186, with a barrier which separates them from the normal-deformed prolate minimum and thus guarantees their stability, a barrier that gradually grows with increasing neutron number to reach about 3 MeV in 204Pt. In most cases these SD isomeric states are, however, rather high in energy above the ground state ( MeV), and will therefore be difficult to be observed experimentally. On the other hand, the moment of inertia of nuclei in such SD bands is several times larger as compared to a typical deformed ground-state band SBP73 , which has a significant influence on the high-spin level structure since the SD states can appear at energies close to or even lower than the rotational states built on the ground-state.
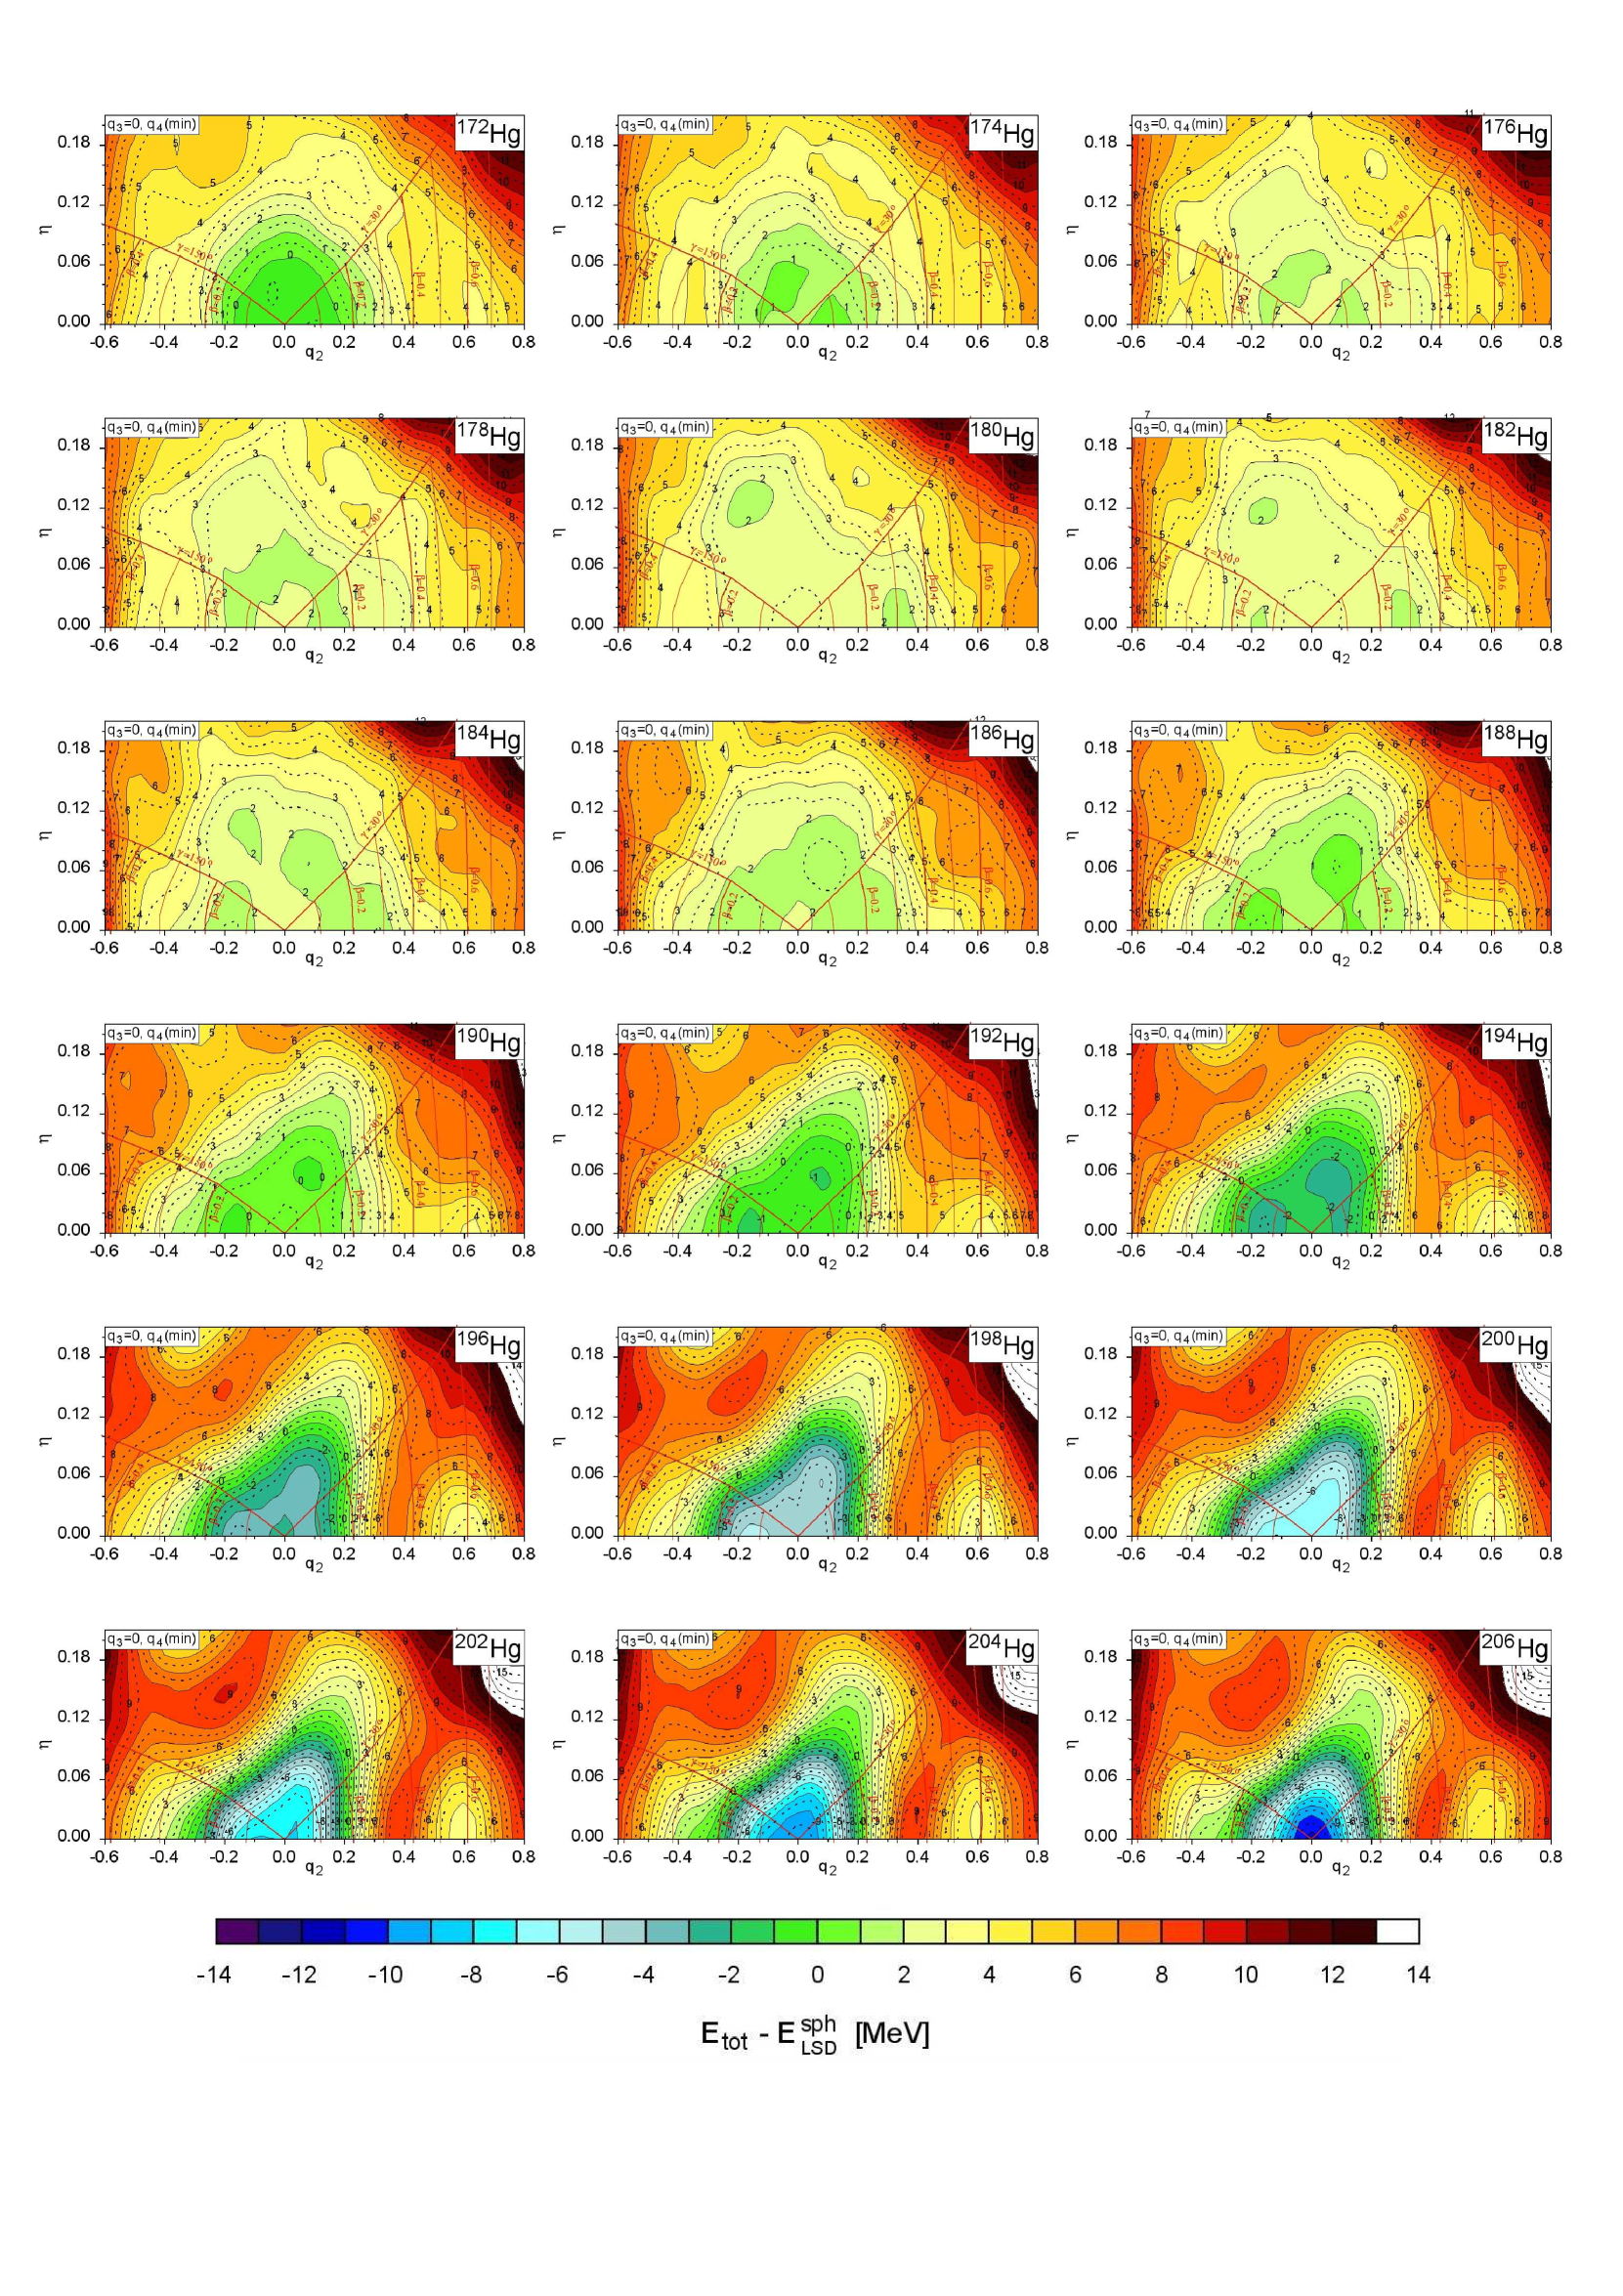
The situation in the Hg isotopes (middle row of Fig. 4) is even more complex. Apart from the strongly deformed oblate minimum at observed in the lighter isotopes 172-184Hg, separated from the ground state minimum by a barrier of up to 1 MeV, a very elongated shape isomer is present at in 172-176Hg, disappears beyond 176Hg, and reappears again in the 190-206Hg isotopes. This strongly deformed shape isomer is protected from a decay towards to the normally deformed states by a fairly high barrier and is located between 4 MeV (in 190Hg) and 16 MeV (in 206Hg) above the ground state. In 176-186Hg additional low-lying prolate or oblate minima appear, thus giving the chance to observe a shape-coexistence in these nuclei. One has of course to study the stability of these local minima with respect to non-axial deformations, an investigation that will be carried out in Subsection 3.2.
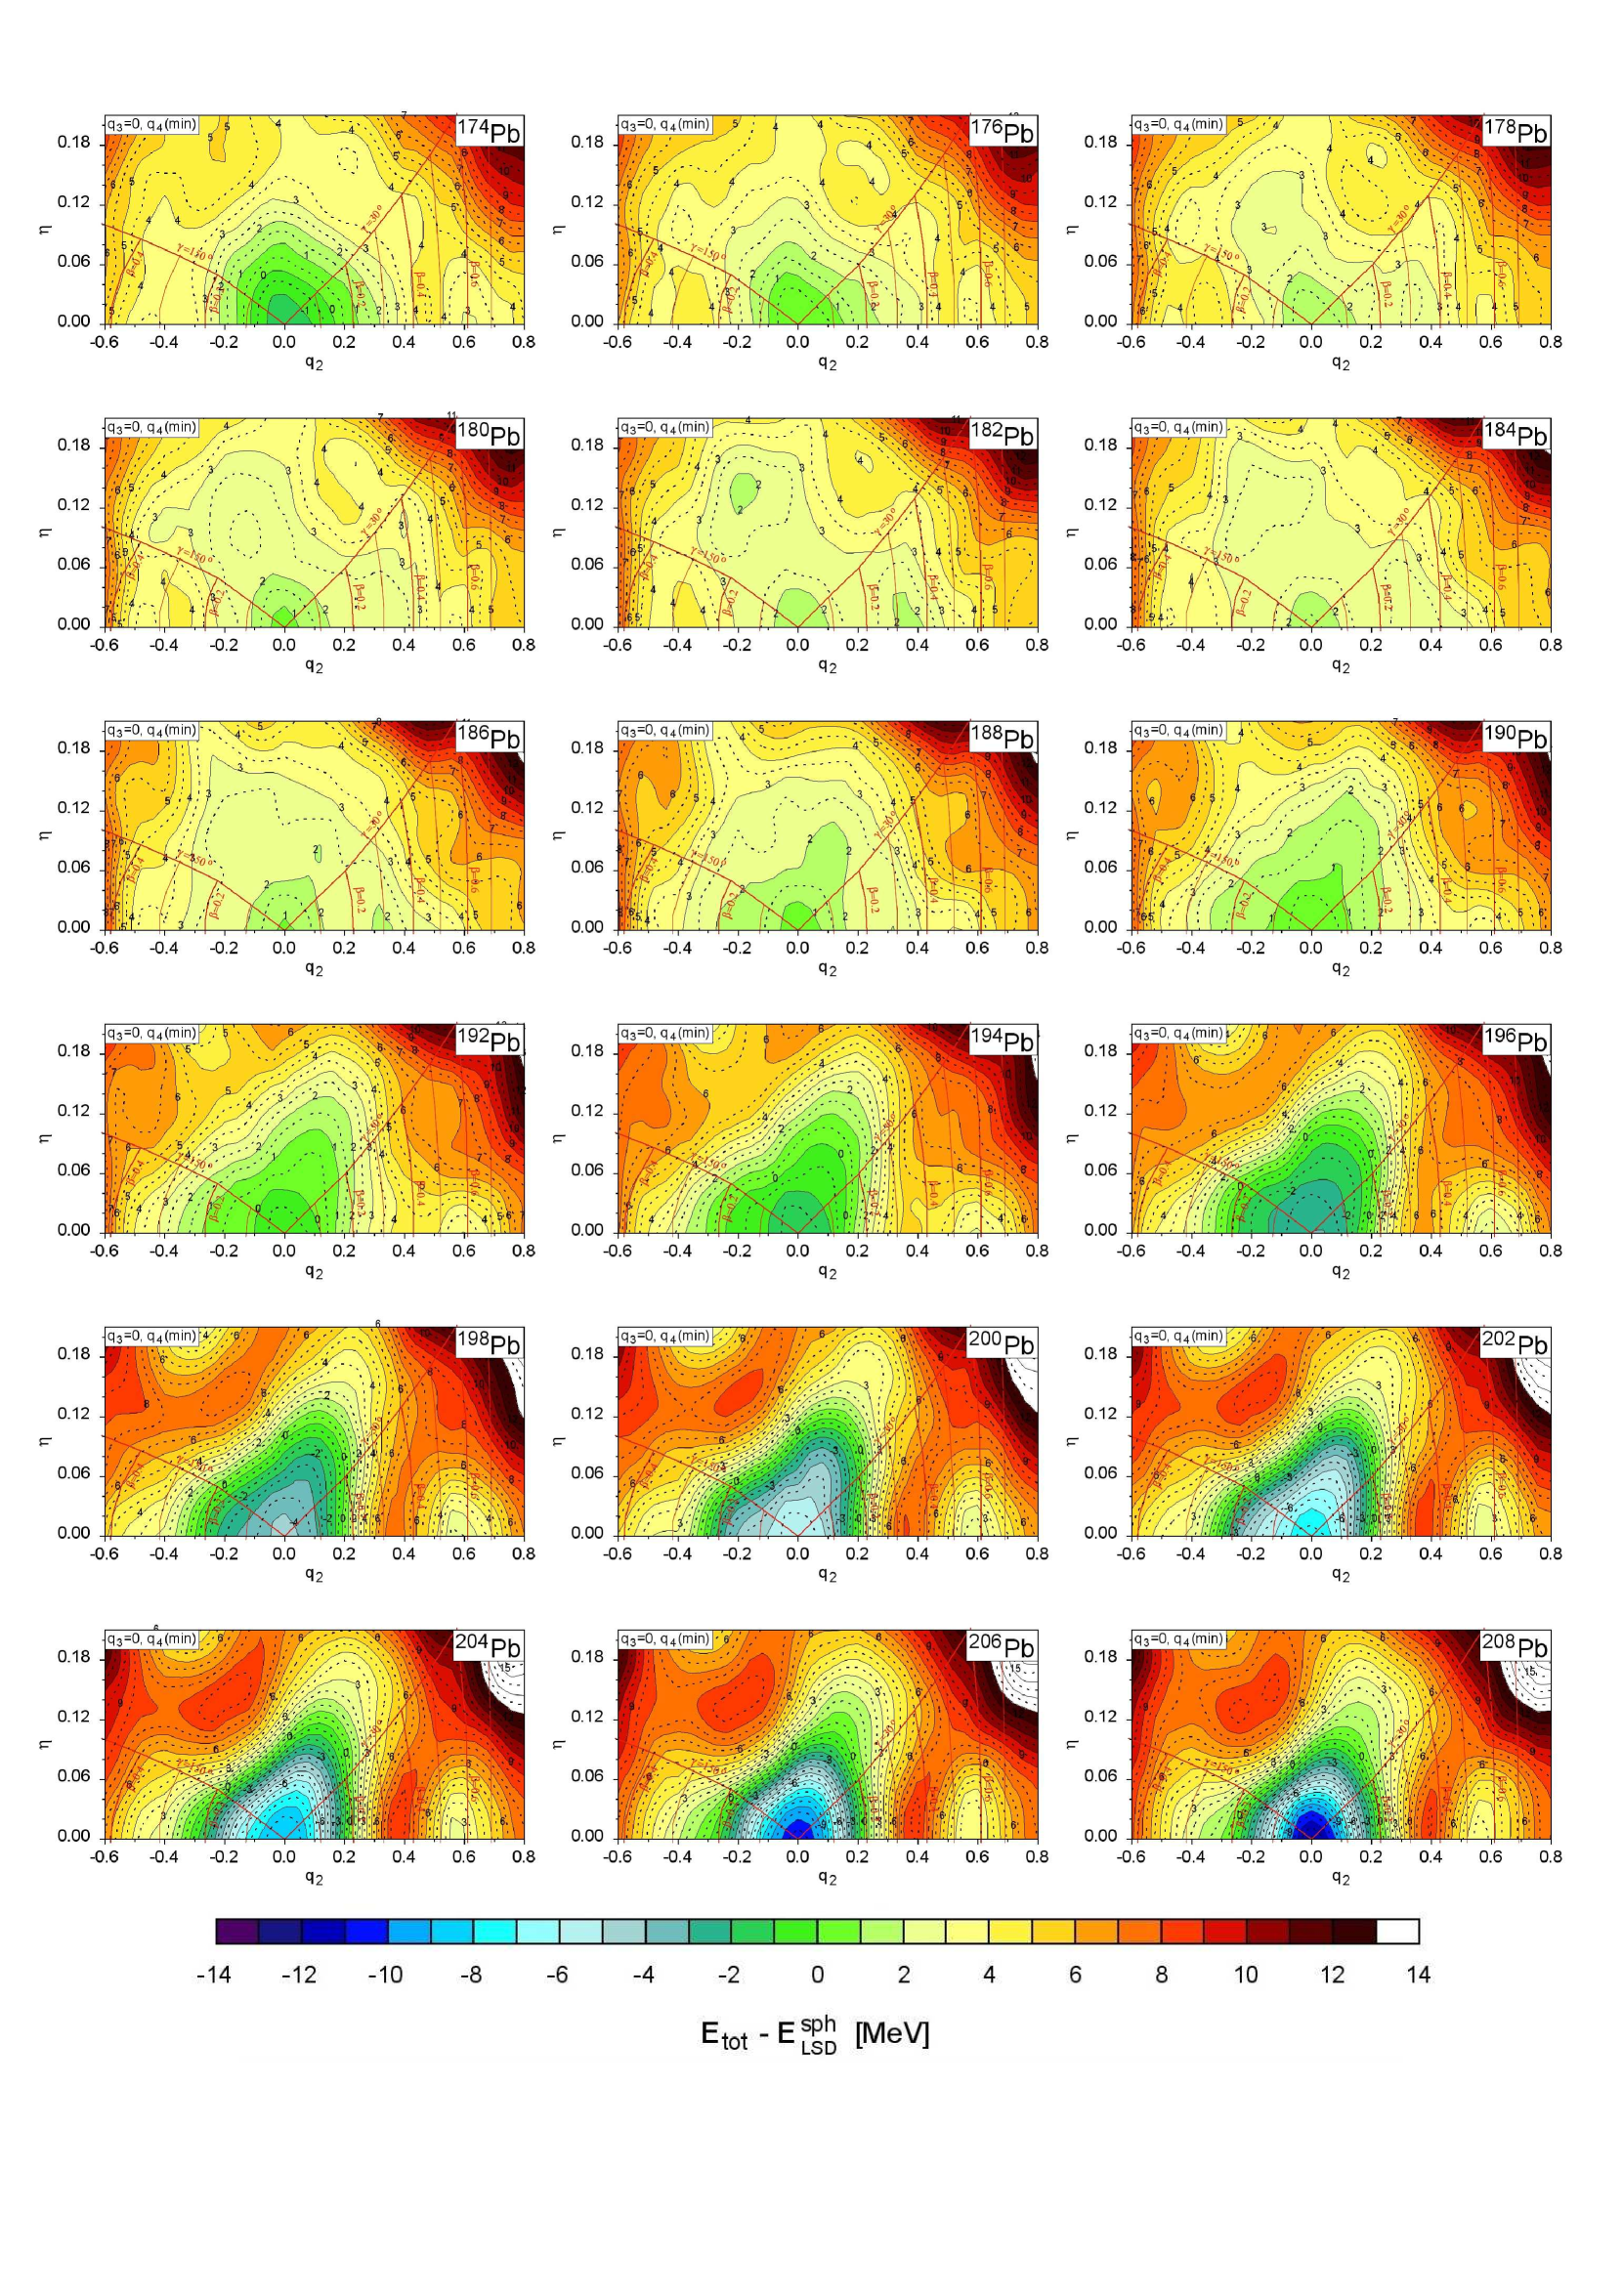
The ground state of all considered 174-208Pb isotopes is found to be spherically symmetric, but in all of them deformed local minima can be observed. Similar as in the case of the Mercury isotopes, strongly deformed oblate minima with appear in the isotopes with , located again rather high above the ground state, at about 5 MeV in 174Pb and 2.5 MeV in 186Pb. Very deformed prolate configurations with a main-axis ratio close to 2 () are predicted by our calculations in the five lightest isotopes 174-182Pb and in isotopes with . It is interesting to notice that some additional local minima appear at smaller deformations and in 182-188Pb isotopes, where even several oblate and prolate deformed minima are predicted. These results, already reported in our previous study NPB17 , are in line with the experimental observations (see e.g. Ref. And00 ). The stability of these minima with respect to the non-axial degree of freedom will be discussed in the subsequent Subsection 3.3.
In the three lightest Pb isotopes (A=174 to 178) one observes a sudden wobbling of the energy at and the appearance of a local SD minimum at . These are induced by the minimization process, when i.e. the energy minimum jumps with increasing elongation from one to another valley in the () plane.

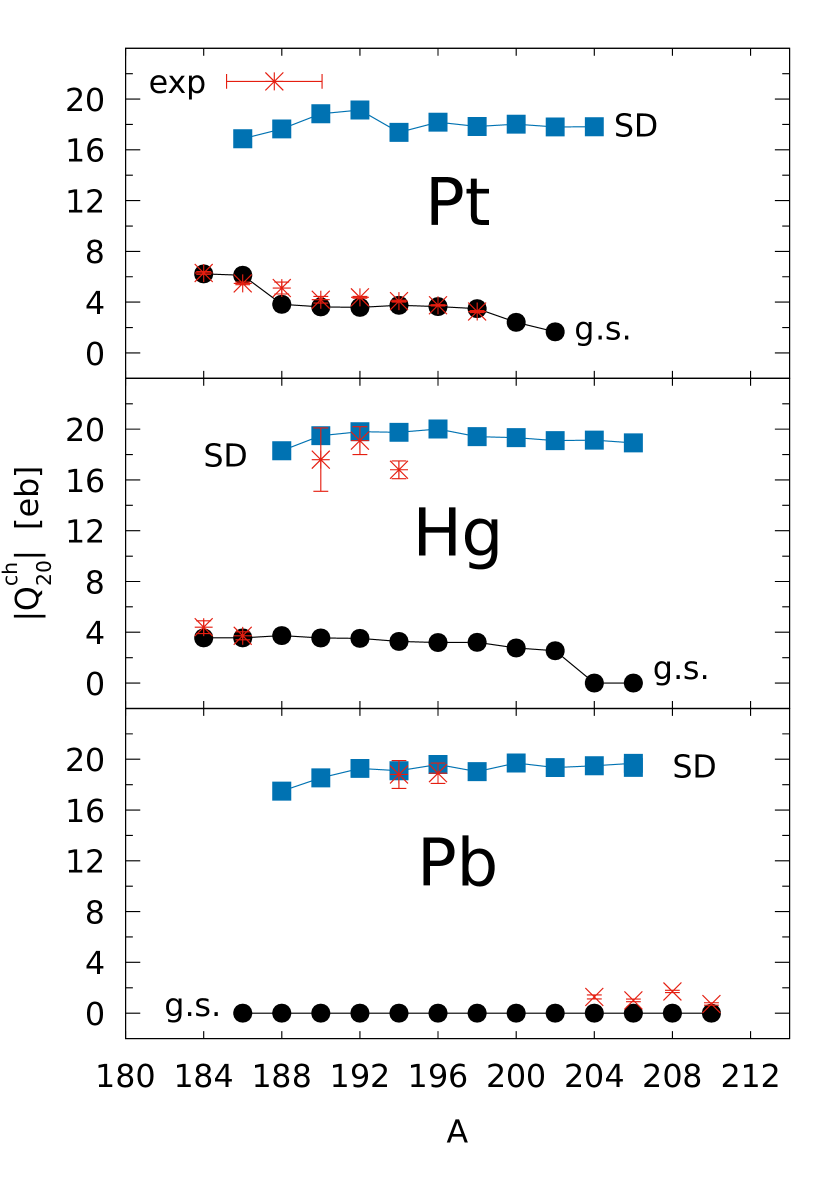
One could ask the question about the accuracy of our theoretical predictions. A comparison with available data, taken from Refs. LLL16 ; SZF02 ; NUDAT , is presented in Figs. 5 and 6, where Fig. 5 shows the moment of inertia and the charge quadrupole moment as function of the elongation parameter for 194Pb, and Fig. 6 the charge quadrupole moment in the ground state and the SD shape isomeric state for the isotopic chains of Pt, Hg and Pb. The experimental value of the moment of inertia of the SD shape isomer in Fig. 5 is evaluated from the energies of two lowest experimentally observed members ( and ) of the SD rotational band SZF02 . One can see that the experimental values ( and ), given by the horizontal lines in Fig. 5 coincide quite well, at the predicted deformation of the SD minimum (vertical dotted line), with the theoretical values for both these quantities. Another measure of the accuracy of our predictions is presented in Fig. 6, where the theoretical absolute values of the charge quadrupole moment for the ground state (black points) and the SD minimum (blue squares) of Pt, Hg, and Pb are compared with the corresponding experimental data (red stars) taken from Refs. LLL16 ; SZF02 ; NUDAT .
We would like to stress at this point that all results, obtained in models taking only axial symmetric shapes into account and giving an indication of a possible existence of shape isomers or shape coexistence, cannot seriously be considered as reliable without checking the stability of the identified minima with respect to other degrees of freedom, among which the non-axial deformation seems to be the most important one. That is precisely what will be investigated in the subsequent subsections.
3.1 Pt nuclei
The potential energy surfaces of 170-204Pt isotopes on the () plane are displayed in Fig. 7. The energy in each of the deformation points on these maps is minimized with respect to deformations only, since we have seen, as explained above, that and degrees of freedom are practically ineffective in these nuclei at the investigated deformations. A very elongated local minimum appears here at in the two lightest 170-172Pt isotopes, when a non-axial deformation is taken into account. It turns out that this local minimum is deeper here than in Fig. 4 where that degree of freedom is absent. Both these isotopes also appear to be unstable in their ground state () with respect to the non-axial degree of freedom. They can therefore be considered as good examples of the so-called -instability. Please recall in this respect the discussion related to the two different descriptions, () and (), of the non-axial degree of freedom at the end of Section 2 and visualized in Fig. 1.
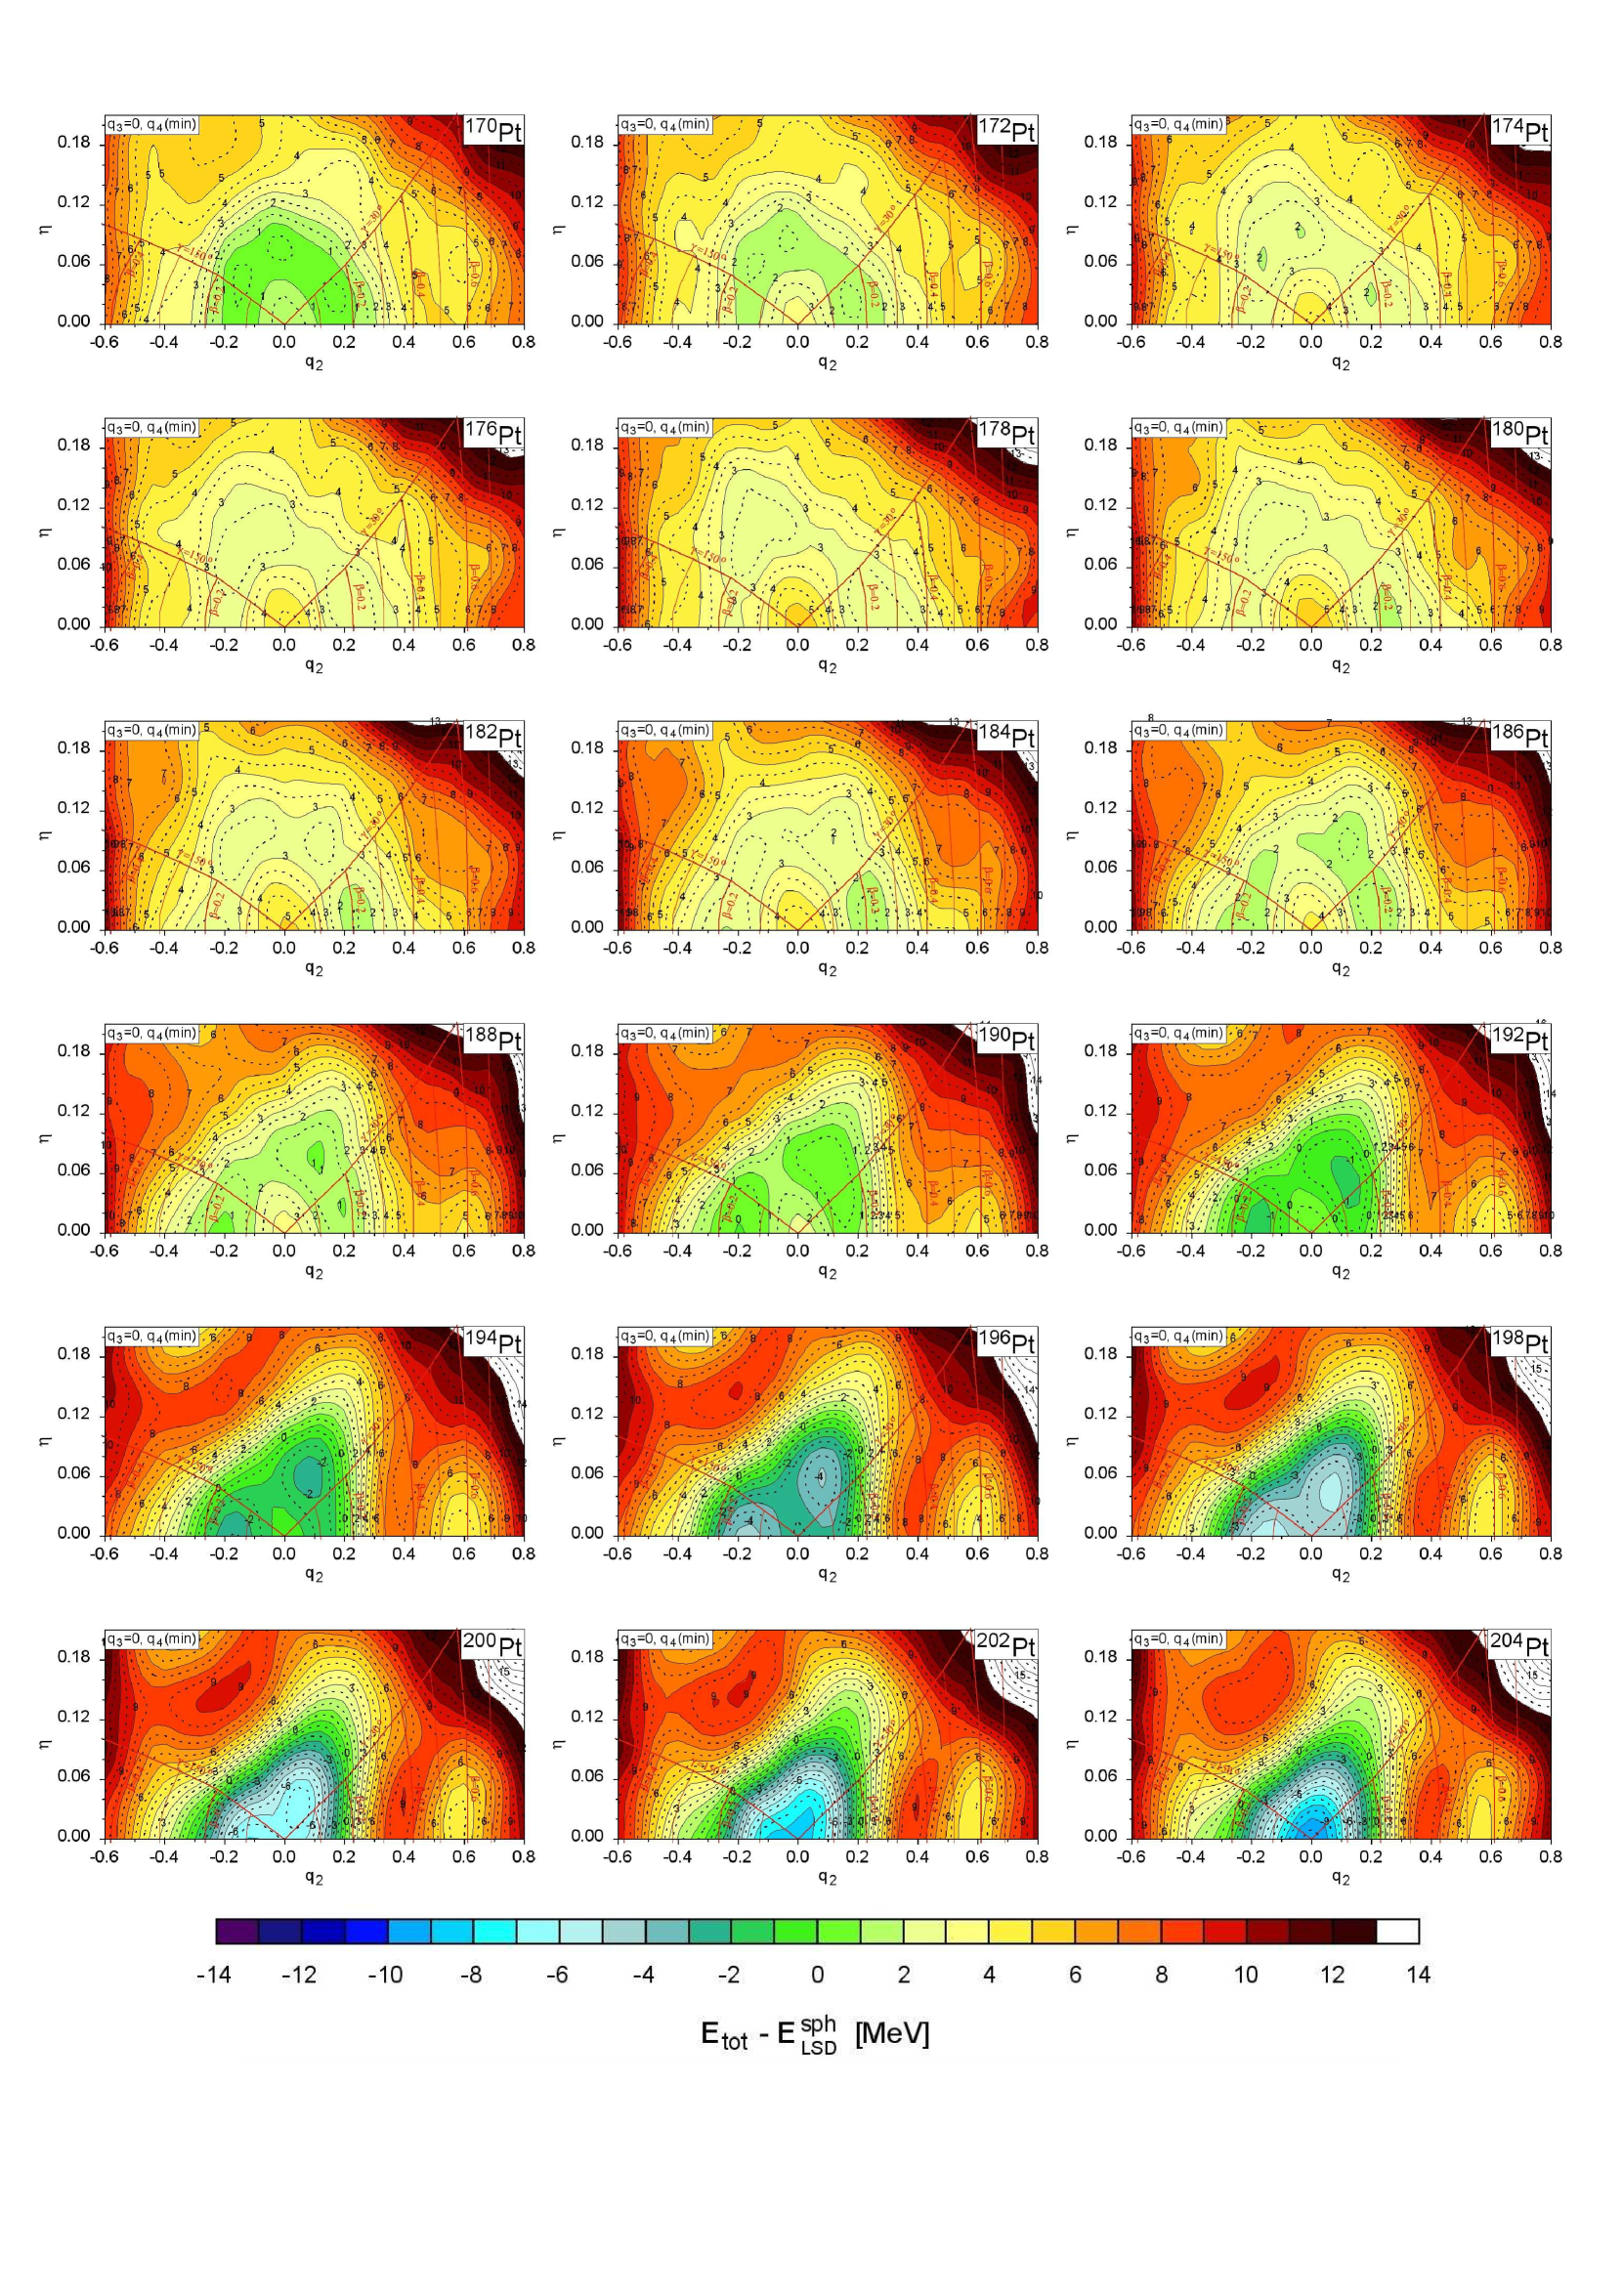
When looking at the deformation energies of the 174-180Pt nuclei in Fig. 4, where axial symmetry had been imposed, one has the impression that there is a coexistence of a prolate minimum at with an oblate minimum at separated by a barrier of about 1.5 to 2.5 MeV. When, however, taking the non-axial degree of freedom into account, as this has been done in the calculations represented in Fig. 7, the picture changes. When looking e.g. at the case of 178Pt, one again finds a coexistence of two minima, one prolate at (), the other triaxial at (), which are separated by a much lower barrier now, that now the non-axial degree of freedom is taken into account Remembering however the discussion at the end of Section 2, one concludes that these two local minima just represent the same prolate shape, since the triaxial minimum with negative value is nothing but the symmetry image of the axially symmetric prolate ground-state minimum, as can easily be verified by taking into account the 60∘ symmetry represented in Fig. 1. The same situation is observed in all of the 174-180Pt isotopes. Let us recall at this point that the above sextant symmetry, which is exact in the case of spheroid shapes, is broken when higher multipolarity deformations are taken into account. In Ref. MSB12 the special choice of the axial and non-axial hexadecapole deformations, originally proposed by Rohoziński and Sobiczewski RSo81 , was used to keep this 60∘ regularity. The shape parametrization used in the present paper does not posses exactly this symmetry. One could in principle introduce similar constraints as in Ref. RSo81 on the deformation parameters to restore such a sextant symmetry, but such constraints would cause a loss of generality of our deformation space which we want to avoid. A chance for a oblate-prolate shape coexistence appears, however, in the 182-186Pt isotopes with a small barrier between prolate and oblate minima. Also in 188Pt two minima are observed, one oblate at () and another one triaxial at (). In the heavier Pt isotopes with , oblate shapes are preferred in the ground state, whereas, approaching the N126 shell closure, the 202-204Pt nuclei turn out to be spherical. The very deformed shape isomers around observed for the 188-204Pt isotopes in Fig. 4 persist when non-axial deformations are taken into account, with a slight reduction (of up to 0.5 MeV) of the barrier height between these isomers and the ground state for the four heaviest isotopes.
3.2 Hg nuclei
Just in the same way as done in Fig. 7 for the Pt isotopes, we show in Fig. 8 the deformation energies of the Mercury isotopes 172-206Hg on the () plane. One observes that the shape isomeric states corresponding to both the very oblate deformations () in 172-182Hg, and the very prolate deformations () in 172-176Hg and in 190-206Hg all survive when the non-axial degree of freedom is taken into account with the exception of the prolate isomer in 174Hg and 176Hg which becomes slightly triaxial with . A significant reduction of the height of the barrier between the shape-isomeric states with and the ground state minimum can, however, be observed in the 200-206Hg isotopes due to the non-axial degree of freedom. The ground state of 172Hg and of 200-206Hg are spherically symmetric, while in the 174-176Hg isotopes it is the prolate minimum that corresponds to the ground state. The additional triaxial minima observed at () correspond again to the 60∘ mirror image of that ground-state deformation, as explained at the end of Section 2. For the 178-188Hg isotopes there should be a chance of a shape-coexistence at small deformations, while for isotopes between 190Hg and 198Hg the ground-state minimum corresponds to an oblate shape.
3.3 Pb nuclei
The 174-208Pb isotopes are analysed in the same way in Fig. 9 through PES landscapes in the () plane. The situation turns out, however, to be slightly different here, since the ground state is found to be spherically symmetric in all the considered isotopes and no competition between prolate and oblate ground-state deformation is present. The issue of a possible shape-coexistence can, in fact, not be limited to prolate versus oblate shapes, but is much more general, as can be seen through the () maps at small deformations in the 178-186Pb isotopes, where the landscapes in directions are very soft, thus allowing for local minima, particularly visible in the maps of 182-184Pb. Similarly as in the case of the Pt and Hg isotopes, a well deformed prolate shape isomer at is predicted in practically all Pb isotopes except 182-188Pb. This shape isomer is particularly visible in the heavier isotopes, as already noticed on the lower part of Fig. 4, even though we now realize that the barrier between the ground state and that prolate shape isomeric state is lowered by as much as 1 MeV by the inclusion of deformations that break the axial symmetry, in particular in the heavier isotopes 204-208Pb. Rather shallow oblate minima appear at an elongation of in the 176-186Pb isotopes, with a small barrier of about 0.5 MeV that separates them from the ground-state minimum. Since these minima turn out to be axially symmetric they already appear clearly in Fig. 4. An additional axially symmetric prolate minimum is predicted at by our calculations in 182-188Pb. It is located at about 1 MeV above the ground state well, separated from it by a small barrier of about 0.5 MeV. Similarly, small oblate minima are visible in Fig. 4 for elongations in the range in 184-194Pb, as was found previously in some mainly self-consistent approaches (see e.g. Refs. BHR03 ; YBH13 ; NRR13 ; NVR02 ). These turn out, however, to disappear when the non-axial degree of freedom is taken into account, as this is clearly seen in Fig. 9.
Let us refer the interested reader to a recent publication PNB19 of our group, where shape isomers in nuclei of the three here studied isotopic chains have been extensively analysed and listed in a table in the appendix together with their energies with respect the ground-state, axial and non-axial quadrupole moments, and moments of inertia.
4 Summary and conclusions
In our study of isotopic chains of neutron deficient Pt, Hg and Pb nuclei with neutron numbers in the range , a certain number of general remarks can be made.
First of all we have found that the left-right asymmetry degree of freedom does not play any important role in any of the here considered nuclei, and this not only around the ground state deformation, but throughout the here considered range of deformations. However, this conclusion does not necessarily hold when going to very large elongations (beyond ) as encountered in the fission process.
Another important conclusion is that it appears absolutely essential to take into account deformations that break the axial symmetry. It indeed appears in all three of the here investigated isotopic chains that, at least for small neutron numbers , i.e. away from the shell closure, the energy landscape in the () plane is rather flat around the ground-state deformation, which always stays rather close to the spherical configuration, while a very pronounced spherical ground-state minimum gradually develops when approaching the magic number . For the more neutron deficient nuclei that present a very rich () landscape in the vicinity of the spherical configuration, small differences can decide whether the ground-state deformation will turn out to be prolate or oblate, as this is demonstrated when going from 186Pt, which is prolate deformed, to the neighbouring 188Hg nucleus, by just adding a pair of protons, which then turns out to have an oblate ground-state deformation. A similar, even more pronounced effect was already observed in in the Polonium isotopes NPB17 , on the other side of the shell closure, when going from 182Po with a prolate ground-state at with an 1.5 MeV higher oblate isomer at , to 192Po where the oblate minimum becomes the ground-state, before both these merge at 198Po with a ground-state which is spherically symmetric.
As far as the shape coexistence between prolate and oblate minima is concerned, several candidates, in all three of the here studied isomeric chains, clearly emerge: it is often away from the magic numbers, i.e. in regions where the shell corrections are not that dominant, that such a phenomenon comes into play. In the Platinum nuclei, we have found that the region 182-188Pt seems particularly favourable, with minima at separated by a small barrier. In the Mercury isotopic chain it is in the 178-188Hg isotopes that a chance for shape-coexistence at small deformations should exist. But the question of a possible shape-coexistence can, in fact, not be limited to prolate versus oblate shapes, being more general, as this has been illustrated through the () maps in the Lead isotopes, in particular in 178-186Pb, where the landscapes in directions are very soft, thus allowing for local minima, particularly visible in the landscapes of 182-184Pb.
Future investigations of some additional isotopic chains in the mass region, but also in other quite different mass regions are anticipated, in order to probe, from a comparison with the experimental data, as that has been done here, the predictive power of our theoretical approach.
Acknowledgements:
This work has been partly supported by the Polish-French COPIN-IN2P3 collaboration agreement under project numbers 08-131 and 15-149, as well as by the Polish National Science Centre, grant No. 2016/21/B/ST2/01227.
References
- (1) A. N. Andreyev, M. Huyse, P. Van Duppen, L. Weissman, D. Ackermann, F. P. Hessberger, S. Hofmann, A. Kleinböhl, G. M. Münzenberg et al., Nature 405, 430 (2000).
- (2) K. Heyde and J. L. Wood, Rev. Mod. Phys. 83, 1467 (2011).
- (3) R. Julin, T. Grahn, J. Pakarinen, and P. Rahkila, Journ. Phys. G 43, 024004, (2016).
- (4) K. Wrzosek-Lipska and L. P. Gaffney, Journ. Phys. G 43, 024012 (2016).
- (5) Zs. Podolyák, Journ. Phys. Conference Series 381, 012052 (2012).
- (6) M. Bender, P. -H. Heenen, and P. -G. Reinhard, Rev. Mod. Phys. 75, 121 (2003).
- (7) J. M. Yao, M. Bender, and P.-H. Heenen, Phys. Rev. C 87, 034322 (2013).
- (8) K. Nomura, R. Rodriguez-Guzman, and L. M. Robledo, Phys. Rev. C 87, 064313 (2013).
- (9) T. Niksić, D. Vretenar, P. Ring, and G. A. Lalazissis, Phys. Rev. C 65, 054320 (2002).
- (10) P. Möller, A. J. Sierk, R. Bengtsson, H. Sagawa,and T. Ichikawa, Phys. Rev. Lett. 103, 212501 (2009).
- (11) K. Pomorski, B. Nerlo-Pomorska, J. Bartel, and C. Schmitt, Acta Phys. Pol. B Supl. 8, 667 (2015).
- (12) C. Schmitt, K. Pomorski, B. Nerlo-Pomorska, and J. Bartel, Phys. Rev. C 95, 034612 (2017).
- (13) K. Pomorski and J. Dudek, Phys. Rev. C 67, 044316 (2003).
- (14) K. T. R. Davies and J. R. Nix, Phys. Rev. C 14, 1977 (1976).
- (15) A. Dobrowolski, K. Pomorski, and J. Bartel, Comp. Phys. Comm. 199, 118 (2016).
- (16) P. Möller, A.J. Sierk, R. Bengtsson, H. Sagawa and T. Ichikawa, Atomic Data and Nuclear Data Tables 98, 149 (2012).
- (17) B. Nerlo-Pomorska, K. Pomorski, J. Bartel, and C. Schmitt Eur. Phys. Journ. A 53, 67 (2017).
- (18) W. D. Myers and W. J. Świa̧tecki, Nucl. Phys. 81, 1 (1966).
- (19) V. M. Strutinsky, Sov. J. Nucl. Phys. 3, 449 (1966); Nucl. Phys. A 95, 420 (1967); Nucl. Phys. A 122, 1 (1968).
- (20) S.G. Nilsson, C. F. Tsang, A. Sobiczewski, Z. Szymański, S. Wycech, S. Gustafson, I. L. Lamm, P. Möller, and B. Nilsson Nucl. Phys. A 131, 1 (1969).
- (21) J. Bardeen, L. N. Cooper, and J. R. Schrieffer, Phys. Rev. 108, 1175 (1957).
- (22) A. Góźdź and K. Pomorski, Nucl. Phys. A 451, 1 (1986).
- (23) S. Piłat, K. Pomorski, and A. Staszczak, Zeit. Phys. A332, 259 (1989).
- (24) P. Möller and J. R. Nix, Data Nucl. Data Tables 59, 185 (1995).
- (25) A. Bohr, Mat. Fys. Medd. Dan. Vid. Selsk. 26, no. 14 (1952).
- (26) T. Kaniowska, A. Sobiczewski, K. Pomorski, and S. G. Rohozinski, Nucl. Phys. A274, 151 (1976).
- (27) P. Jachimowicz, M. Kowal, and J. Skalski, Phys. Rev. C 95, 014303 (2017).
- (28) A. Dobrowolski, K. Pomorski, and J. Bartel, Phys. Rev. C75 (2007) 024613
- (29) A. Lopez-Martens, T. Lauritsen, S. Leoni, T. Døssing, T.L. Khoo, S. Siem, Prog. Part. Nucl. Phys. 89, 137 (2016).
- (30) A. Sobiczewski, S. Bjornholm, and K. Pomorski, Nucl. Phys. A202, 274 (1973).
- (31) B. Singh, R. Zywina, R. B. Firestone, Nucl. Data Sheets 97, 241 (2002).
- (32) https://www.nndc.bnl.gov/nudat2/
- (33) S. G. Rohoziński, A. Sobiczewski, Acta. Phys. Polon. B 12, 1001 (1981).
- (34) K. Pomorski, B. Nerlo-Pomorska, J. Bartel, H. and Molique, Bul. Journ. Phys. 46, 269 (2019).