Ground state and low-temperature magnetism of the quasi-two-dimensional honeycomb compound InCu2/3V1/3O3
Abstract
We report a combined 115In NQR, 51V NMR and SR spectroscopic study of the low-temperature magnetic properties of InCu2/3V1/3O3, a quasi-two dimensional (2D) compound comprising in the spin sector a honeycomb lattice of antiferromagnetically coupled spins associated with Cu2+ ions. Despite substantial experimental and theoretical efforts, the ground state of this material was has not been ultimately identified. In particular, two characteristic temperatures of about K and K manifesting themselves as anomalies in different magnetic measurements are discussed controversially. A combined analysis of the experimental data complemented with theoretical calculations of exchange constants enabled us to identify below 39 K an “intermediate” quasi-2D static spin state. This spin state is characterized by a staggered magnetization with a temperature evolution that agrees with the predictions for the 2D XY model. We observe that this state gradually transforms at 15 K into a fully developed 3D antiferromagnetic Néel state. We ascribe such an extended quasi-2D static regime to an effective magnetic decoupling of the honeycomb planes due to a strong frustration of the interlayer exchange interactions which inhibits long-range spin-spin correlations across the planes. Interestingly, we find indications of the topological Berezinsky-Kosterlitz-Thouless transition in the quasi-2D static state of the honeycomb spin-1/2 planes of InCu2/3V1/3O3.
I Introduction
Dimensionality of the spin system and the involved spin degrees of freedom play an important role in defining magnetic properties of a material in particular regarding its ground state and magnetic excitations. Long-range magnetic order (LRO) which is a typical ground state of 3-dimensional (3D) magnets can be strongly suppressed in systems with frustrated exchange interactions. Reduction of the spatial dimensionalilty of magnetic couplings may be a further cause of the suppression of LRO. For instance, according to the Mermin-Wagner’s theorem, LRO is impossible even at zero temperature in a 1D spin-1/2 isotropic Heisenberg chain with the coordination number due to strong quantum fluctuations, although it can be stabilized on a 2D square lattice with at K [1]. The spin-1/2 Heisenberg honeycomb lattice has a particular position in this respect. Like the square lattice, it is not frustrated for the antiferromagnetic (AFM) nearest-neighbor interaction. However, quantum fluctuations are enhanced due to the low coordination number . Still they remain less pronounced than in the 1D case and, hence, do not destroy LRO at .
In real 3D transition metal (TM) compounds where magnetic TM ions bonded via ligands form 2D hexagonal layers, such honeycomb spin planes may deviate from the ideal Heisenberg regime. The anisotropy of the in-plane magnetic exchange as well as a finite interlayer coupling can weaken quantum fluctuations. As a result, long range magnetic order can be stabilized at finite temperatures [2; 3; 4; 5; 6]. Depending on the particular details, such as frustration of the next-neighboring in-plane exchange interaction and/or of the coupling between the planes, different types of magnetic structures can be realized [7; 8; 9; 10; 11; 12]. If frustration is sufficiently strong the LRO can be suppressed completely [13; 14].
One particularly interesting aspect of this class of materials is that the spin-orbit coupling and the low-symmetry ligand field can give rise to a strong easy-plane magnetic anisotropy of the honeycomb planes made of TM ions which then can be described by the model. There, unlike in the Heisenberg model, only two components of the spin and are interacting on the honeycomb spin plane. This can lead to complex magnetic behavior beyond conventional LRO and associated classical spin-wave excitations, namely the formation of the spin vortex gas and the Berezinsky-Kosterlitz-Thouless (BKT) transition to the topologically ordered state of vortex-antivortex pairs predicted in the 2D XY model [15; 16; 17; 18].
Only a few antiferromagnets are known so far, where the signatures of this topological transition were found mostly by analyzing the critical exponents. In the majority of the cases the comparison with the predictions of the BKT theory is complicated due to the residual interplane couplings which eventually yield 3D AFM Néel order such as, e.g., in BaNi2(PO4)2 [19], BaNi2V2O8 [20; 21; 22], or MnPS3 [23]. As a rare exception, the coordination polymer C36H48Cu2F6N8O12S2 does not exhibit the Néel order but features magnetic excitations consistent with a BKT scenario [24].
The title compound of the present paper InCu2/3V1/3O3 features 2D structural order of magnetic Cu2+ (=1/2) ions on a honeycomb lattice with nonmagnetic V ions in the formal oxidation state 5+ complementing the hexagonal layer [25]. Occasional Cu/V site inversion gives rise to a finite structural in-plane correlation length of approximately 300 Å [25]. Besides being a candidate to host -wave superconductivity upon doping [26], it also appears to be a rare realization of a honeycomb spin lattice with strongly frustrated interlayer coupling. Despite substantial experimental and theoretical interest in this compound its ground state is still not unambiguously identified. Previous magnetization, Electron Spin Resonance (ESR) and Nuclear Magnetic Resonance (NMR) measurements complemented by Quantum Monte Carlo calculations suggest the onset of the AFM ordered state at K [27] with the fully developed Néel-type collinear AFM sublattices below K [28] that feature anomalous spin dynamics [29]. However, according to Ref. [25], specific-heat, thermal expansion and neutron-diffraction experiments show no evidence for long range magnetic order down to 1.8 K. As reported in Ref. [30], doping of InCu2/3V1/3O3 with Co leads to AFM LRO, whereas Zn doping results in the suppression of AFM order. Theoretical studies have shown that fluctuations arising from the interlayer magnetic frustration destroy 3D magnetic LRO in InCu2/3V1/3O3 [30; 31].
Considering the above mentioned controversies of different kinds of experimental data and their interpretation it is appealing to resolve them and to obtain a unified picture of the ground state and low-temperature magnetism of InCu2/3V1/3O3. With this aim, in the present work we investigate experimentally and theoretically the ground state and low-temperature static and dynamic properties of InCu2/3V1/3O3. In particular, employing 115In NQR, 51V NMR and SR spectroscopies we address the occurrence of the above menitioned two characteristic temperature scales of K and K. Their understanding appears to be crucial for the elucidation of the low-temperature magnetism of this compound. We find that below 39 K InCu2/3V1/3O3 develops a staggered magnetization. Its -dependence suggests a quasi-2D static state of the spin system with predominantly in-plane commensurate long-range spin-spin correlations. Further on, we find that a full 3D antiferromagnetic order develops at a much lower temperature of 15 K. These experimental findings are rationalized within a microscopic spin model based on density functional theory (DFT) calculations. Its key features are: i) the dominance of and the irrelevance of magnetic exchanges beyond the nearest neighbors within the honeycomb planes, i.e. , ii) the XXZ anisotropy of the nearest neighbor exchange accompanied by a vanishingly small antisymmetric (Dzyaloshinskii-Moriya) anisotropy, and iii) the presence of a single frustrated antiferromagnetic exchange between the honeycomb planes. We argue that a significant frustration of the interlayer exchange in InCu2/3V1/3O3 together with a certain degree of structural disorder are responsible for the two characteristic low-temperature regimes of this compound in compliance with all experimental observations. Furthermore, by analyzing our static and dynamic magnetic data we find indications of a BKT transition in InCu2/3V1/3O3 presumably occurring within an intermediate quasi-2D static state of the spin system below 39 K.
The paper is organized as follows. Experimental details are summarized in Sect. II. The results of 115In NQR, 51V NMR and SR experiments and the microscopic model are presented in Sect. III and Sect. IV, respectively, and discussed together in Sect. V. The main conclusions are summarized in Sect. VI. The Appendix presents some specific details of the analysis of the NQR Hamiltonian.
II Experimental details
The powder sample of InCu2/3V1/3O3 was synthesized and comprehensively characterized as described in Ref. [25].
NQR experiments were performed on the 115In nuclei (nuclear spin , gyromagnetic ratio MHz/T, quadrupolar moment barns) using the Redstone console and Lap NMR portable spectrometers from Tecmag. Frequency swept spectra were recorded with the pulse sequence, the spin echo signal was integrated at each step. Measurements were performed in the temperature range from 5 to 100 K. The nuclear relaxation rates in the NQR experiment were measured at the maximum of the spectra with the saturation-recovery method. For that the pulse train was used to saturate the nuclear spin system and the echo intensity was measured as a function of the time delay between the pulses. The 51V NMR spin-lattice relaxation rate was measured with the method of stimulated echo.
A muon spin relaxation (SR) experiment on a powder sample of InCu2/3V1/3O3 was performed at the GPS beamline at the Paul Scherrer Institute in Villigen, Switzerland, between 2 K and 60 K in zero field (ZF) and 50 G external magnetic field applied perpendicular to the forward/backward positron detector pair axis. The time dependent corrected asymmetry spectra were analyzed using the MSRFIT software package [32].
III Results
III.1 115In NQR experiments
III.1.1 115In NQR spectra
The choice of the NQR technique has several advantages over the experimental methods previously used for the studies of InCu2/3V1/3O3. As other magnetic resonance spectroscopies, it is a local technique that provides information on the static and dynamic properties of a material on the scale of a few interatomic spacings and does not require long range order to probe the spin structure and magnetic exitations which would be a necessary condition, e.g., in the case of neutron scattering. Compared to NMR, NQR is a technique where no external magnetic field is needed, therefore it allows one to probe the bare, unperturbed Hamiltonian of the electron spin system. Finally, NQR is very sensitive not only to fluctuating and static local magnetic fields generated by electron spins but also to the electric field gradient around the nuclei thus making it possible to study a local charge environment.
Generally, all nuclei with spin 1/2 have a non-spherical charge distribution and an electric quadrupole moment associated with this charge. The quadrupole moment interacts with the local crystal electric field gradient (EFG) that originates from a non-symmetric ionic surrounding. The interaction of with the EFG can be expressed by the following Hamiltonian [33]:
| (1) |
Here, is the charge of the proton, is the asymmetry parameter defined as . The is the matrix element of the EFG tensor in the principal coordinate system. The quantity is commonly defined as , and and are projections of the nuclear spin on the -quantization axis given by the EFG and perpendicular to it, respectively. In InCu2/3V1/3O3 the 115In nucleus with the spin is surrounded by six oxygen ions forming an asymmetric octahedron. Due to this asymmetry the degeneracy of the NQR transitions , , and is lifted and, as a result, four lines in the 115In NQR spectrum with different frequencies are expected (see below and the Appendix for details).
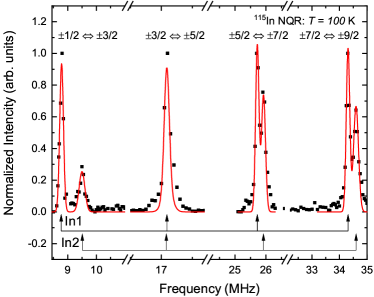
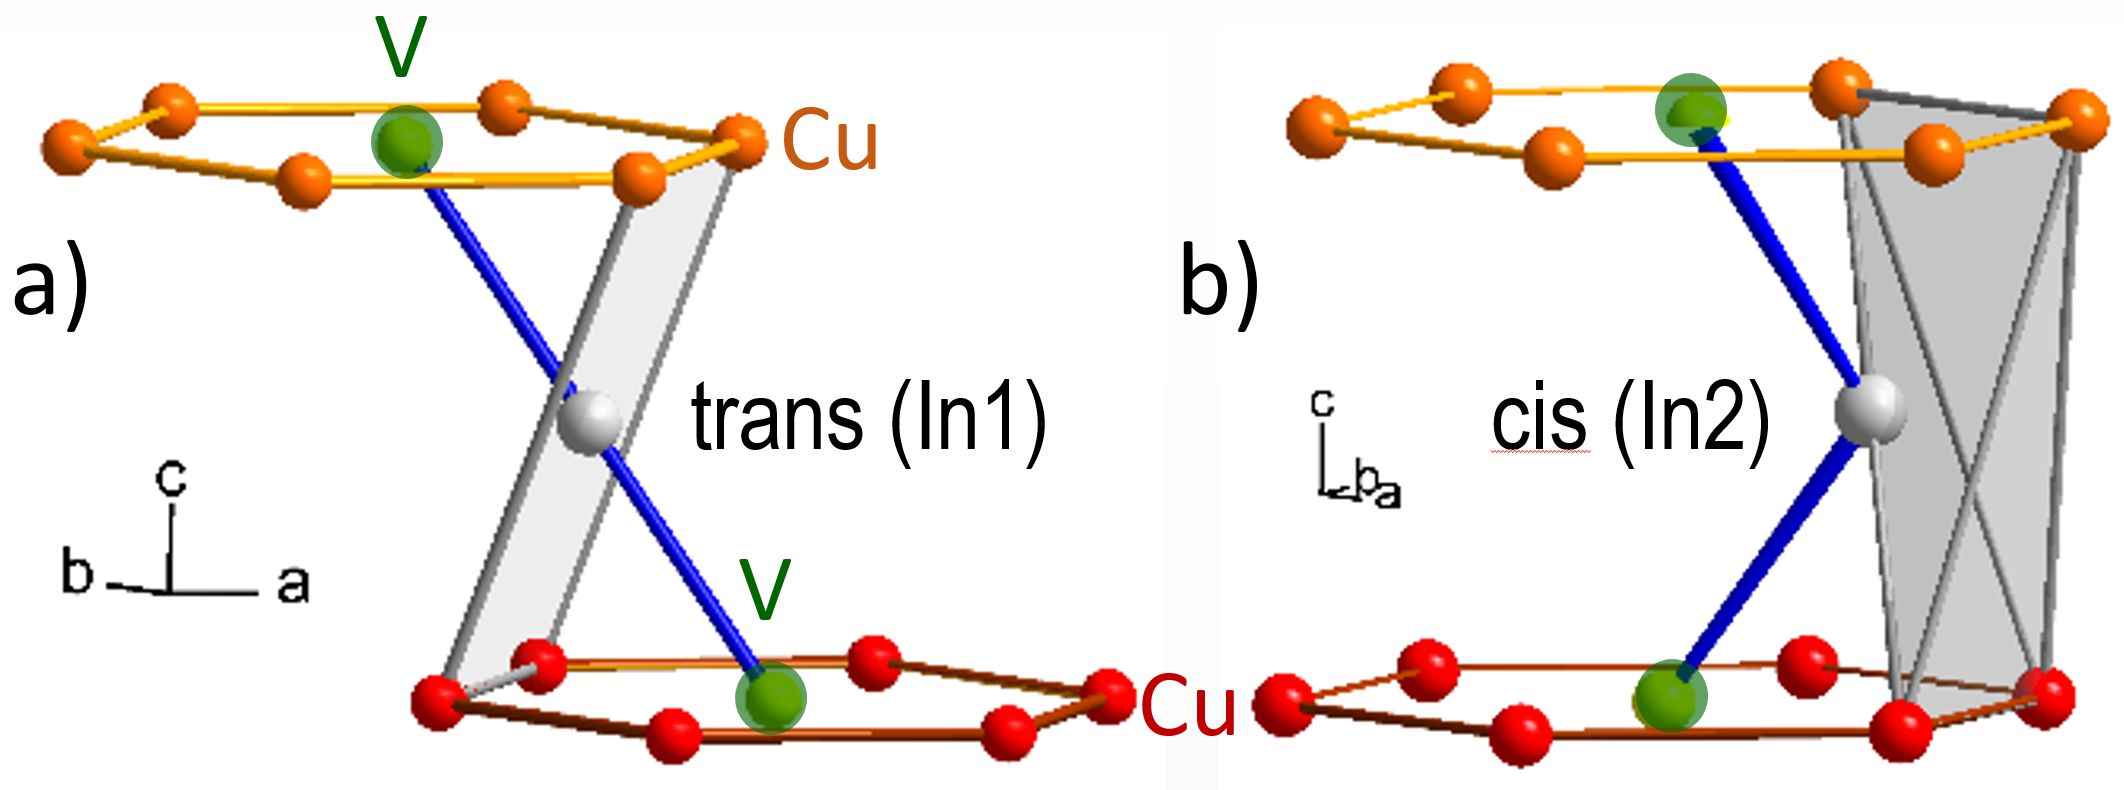
A full 115In NQR spectrum of InCu2/3V1/3O3 measured at a high temperature of K is presented in Fig. 1. Seven resonance lines can be resolved instead of the expected four. Such a spectrum can be completely understood and well modeled if one takes into account two different crystallographic In positions, In1 and In2, arising due to the stacking of ordered honeycomb lattices present in the regular crystallographic structure of InCu2/3V1/3O3 (Fig. 2). In1 occurs in a centrosymmetric surrounding in a trans-fashion whereas In2 occurs in a non-centrosymmetric surrounding in a cis-fashion, thus having slightly different electric field gradients.
Consequently, for the modeling of the spectra with the aid of Hamiltonian (1) we used two set of parameters and which, together with the corresponding transition frequencies, are listed in Table 1. Obviously, the smaller can be assigned to the position with higher symmetry and the larger can be assigned to the position with lower symmetry (Fig. 2). The intensities of the two contributions are related approximately as 1:1. The apparent difference of the amplitude of the lines in Fig. 1 is due two their slightly different widths most likely occuring because of the different degree of distortion of the oxygen octahedron.
| Transition frequencies | ||||||
|---|---|---|---|---|---|---|
| Site | () | () | () | |||
| In1 | 8.58 | 0.05 | 8.77 | 17.09 | 25.72 | 34.31 |
| In2 | 8.66 | 0.1 | 9.51 | 17.08 | 25.92 | 34.60 |
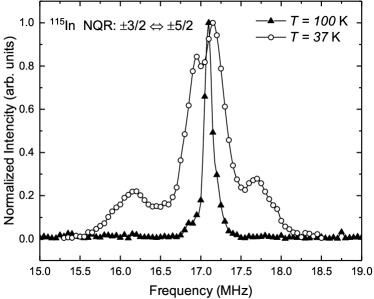

In the following we focus on the part of the 115In NQR spectrum corresponding to the () transition which is plotted on an enlarged scale in Fig. 3 for two selected temperatures of 100 and 37 K. The spectrum measured in the paramagnetic state at 100 K consists of a single narrow line at 17.1 MHz due to an almost perfect overlap of the signals from the In1 and In2 sites for the () transition (see Table 1). The other spectrum recorded just below the ordering temperature K is significantly broader and is split into several lines. As can be seen in Fig. 4 on a larger frequency scale, with further decreasing temperature the splitting of the spectrum progresses and the lines get more resolved.
Typically, a splitting of an NQR line of a magnetic material is a fingerprint of an ordered state. If the probed nuclei are located at non-symmetric positions with respect to the AFM sublattices the nuclei are exposed to local static magnetic fields which cause the Zeeman splitting of the nuclear Kramers doublets (see Appendix for details). In the symmetrical case the local field from different sublattices would be compensated and the NQR line should remain unsplit. When the spin system is in a static but not long range ordered, i.e., disordered state, the individual nuclei in the sample would sense different local fields leading to strong line broadening due to a distribution of local fields [34].
The splitting of the 115In NQR lines evidences the establishment of the ordered state in InCu2/3V1/3O3 where In nuclei are exposed to local magnetic fields giving rise to magnetically nonequivalent positions at each of the two crystallographic In sites. Apparently, those In nuclei which experience a stronger local field contribute to the lines with a large splitting as indicated in Fig. 4 by arrows labeled and , whereas nuclei experiencing weaker magnetic fields contribute to the split lines close to the central frequency of 17 MHz (see the Appendix).
III.1.2 115In relaxation measurements
115In nuclear spin-lattice relaxation () measurements at the line corresponding to the transition were performed in a temperature range from 70 down to 5 K. In Fig. 5 typical nuclear magnetization recovery curves obtained with the saturation-recovery pulse sequence are presented.
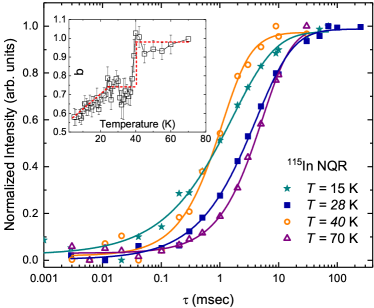
For nuclei with spin , the magnetization recovery is a multiexponential function but still it can be described by a single relaxation time . For , the theoretical magnetization recovery curve contains four exponents. The corresponding coefficients of the exponential terms were calculated by J. Chepin and J.H. Ross Jr. for the relaxation in magnetic materials as a function of the asymmetry parameter in Ref. [35]. Since in InCu2/3V1/3O3 two 115In sites contribute to the total signal, the following function, which takes into account the overlap of the two signal contributions, was used to fit the data:
| (2) |
Here is the equilibrium magnetization, is the nuclear spin-lattice relaxation time and is the stretching parameter. Parameters and are the weighting factors of the initial nuclear magnetization after the fist pulse corresponding to the In1 and In2 sites, respectively. Since for the transition contributions from the two nuclear sites fully overlap these parameters were taken equal, . The corresponding numerical coefficients of Eq. (2) used to fit the magnetization recovery curves for both 115In positions are given in Table 2.
| Site | ||||
| In1 | 3 | 10 | 20.7 | 35.5 |
| In2 | 3 | 10 | 20.5 | 34 |
| Site | ||||
| In1 | 0.016 | 0.031 | 0.135 | 0.818 |
| In2 | 0.007 | 0.028 | 0.122 | 0.843 |
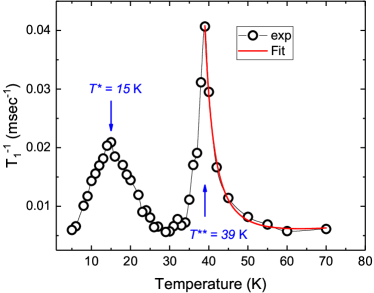
The obtained temperature dependence of the nuclear spin-lattice relaxation rate is shown in Fig. 6. Generally, can be driven by magnetic fluctuations and/or by a fluctuating EFG due to lattice vibrations (phonons). The latter mechanism yields as a monotonically ascending function of temperature, e.g., or [36], which is not observed experimentally (Fig. 6). Furthermore, in Ref. [25] three characteristic vibrational modes were observed with temperatures 160, 350 and 710 K corresponding to the lattice vibrations at THz frequencies, i.e., far above the NQR frequency scale. Thus, such phonon modes should not affect the nuclear relaxation processes as well. Therefore we conclude that the nuclear relaxation is of magnetic origin at low temperatures. Indeed, a gradual increase of the rate below 60 K (Fig. 6) can be ascribed to the development of the magnetic correlations in InCu2/3V1/3O3. Eventually the dependence exhibits a peak at temperature =39 K. Such a sharp peak usually signifies the establishment of long-range magnetic order. This peak in the relaxation is accompanied by a step-like drop of the stretching parameter , indicating a distribution of the relaxation times due to inhomogeneous fluctuating fields in the electron spin system (Fig. 5, inset). Remarkably, by further decreasing the temperature the second prominent feature, a broad peak in the dependence at =15 K is observed.
III.2 51V NMR spin-lattice relaxation rate

The 51V NMR spin-lattice relaxation rate in InCu2/3V1/3O3 was measured at the central peak of the 51V NMR spectrum [28] in magnetic fields of about 3 T. The time evolution of the nuclear magnetization could be described with a single spin-lattice relaxation time in the functional form described by A. Narath [37] for the central transition for the nuclear spin . With decreasing temperature continuously decreases down to K and then exhibits a broad peak centered around K similar to the peak at K in the -dependence of the 115In NQR relaxation rate (cf. Fig. 6). Notably, in contrast to the 115In NQR data, no peak at K was found in the -dependence of the 51V NMR relaxation rate. The inset of Fig. 7 depicts the dependence of the stretching parameter of the nuclear magnetization decay on temperature. is close to unity at high temperatures and, similar to the case of the 115In NQR relaxation (cf. Fig. 5, inset), rapidly decreases down to below 40 K.
III.3 SR experiments
III.3.1 Transverse field SR measurements
The results of the transverse field (TF) SR measurements in 5 mT external field are depicted in Fig. 8.
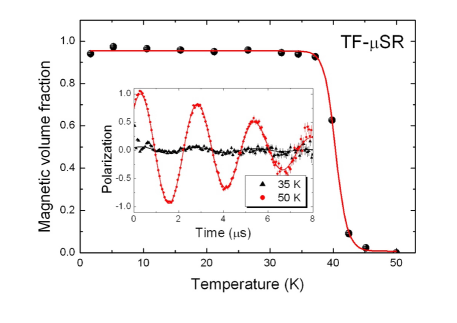
At 50 K the full muon spin polarization amplitude is oscillating with a frequency corresponding to the external field. A weak depolarization is due to a weak static field distribution at the muon site of the order of 10 G caused by nuclear dipole moments. At 35 K the amplitude of this signal is reduced to 5 % and 95 % of the signal show a much faster depolarization due to the appearance of strong internal magnetic fields at the muon site which exceed the external field by more than a factor of 10. The zero field SR measurements discussed below prove that these internal fields are static on the timescale of microseconds. The muon spin polarization in the TF time spectra was analyzed using the polarization function
| (3) |
Here, is the fraction of muons experiencing a strong internal magnetic field due to magnetic order, is the initial phase of the muon spin polarization at and is the static Gaussian line width at 60 K. The main panel of Fig. 8 shows . For temperatures below 40 K, exhibits a nearly constant value of 0.95. The remaining precession signal amplitude can be associated with muons stopped in the sample holder. Therefore, the TF SR measurements prove that muons in the full sample volume experience strong static internal fields below 40 K.
III.3.2 Zero field SR measurements
Zero field (ZF) SR measurements were performed between 2 K and 42.5 K. Typical time spectra are depicted in Fig. 9.
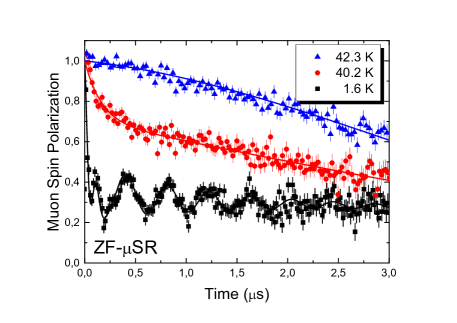
At 42.5 K the muon spin polarization decays only weakly with a Gaussian time dependence. The relaxation rate is consistent with the TF measurements at high temperatures. At 40.2 K the onset of strong relaxation of a fraction of the full signal amplitude sets in. At 1.6 K two different spontaneous precession frequencies can be resolved, a weakly relaxing component with frequency 2.5 MHz and strongly relaxing component with 8 MHz. A fraction of of the initial muon spin polarization does show only a weak relaxation in the microsecond time range without oscillations. This proves that (i) two different muon sites are populated in InCu2/3V1/3O3 most likely due to OH-like bonds of the muon to different oxygen ions in the lattice which are energetically nearly degenerated, and (ii) that the internal fields at both muon sites are nearly static. Therefore the ZF muon spin polarization below 40 K was analyzed using the polarization function
Here, is the relative fraction of muon site 1 exhibiting the lower muon spin precession frequency 2.5 MHz with the exponential relaxation rate , and 8 MHz with the exponential relaxation rate being the corresponding parameters of muon site 2. The relative signal amplitude of muon site 1, 0.25 is temperature independent below 30 K. Above 30 K it increases towards 0.6 close to 40 K. Experimentally it was difficult to follow the high frequency () signal close to due to its high relaxation rate. Therefore close to the fitting algorithm increases the signal fraction of the low frequency () signal (which, of course, also exhibits a frequency approaching zero close to and allows some ambiguity in amplitude). Since we cannot exclude a change of the relative muon site occupancies ( due to small changes of the binding potential energies at the two muon sites) we did not fix this parameter in the analysis.
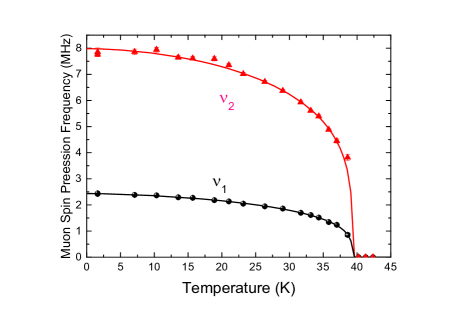
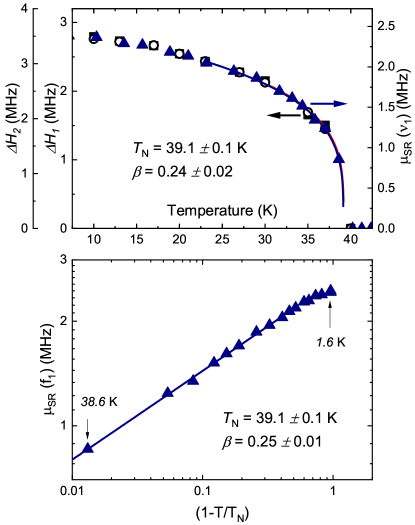
In Fig. 10 the temperature dependence of both muon spin precession frequencies is shown. In a global fit and are very well described by an order parameter function of the form
| (4) |
Here, = 39.1(1) K and the critical exponent = 0.25(1) are global parameters, and = 2.45(1) MHz and = 7.98(1) MHz. Clearly both curves show no anomaly near K, whereas is equal to K (cf. Fig. 6).
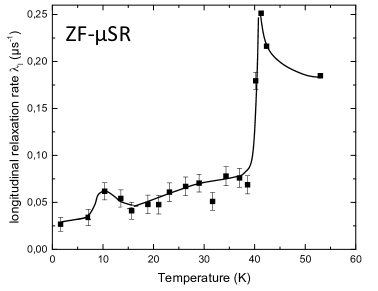
The longitudinal relaxation rate , depicted in Fig. 11, exhibits a maximum close to . Below 38 K a slow decrease is observed from 0.07 towards 0.03 at 2 K. Only a weak second maximum is found between 10 K and 15 K reminiscent of the broad peak observed in of 115In NQR at K. The temperature shift of the peak position in the SR experiment is consistent with the fact that the spontaneous muon spin precession frequencies are smaller than the NQR transition frequency by a factor of 2 – 6 depending on the muon site.
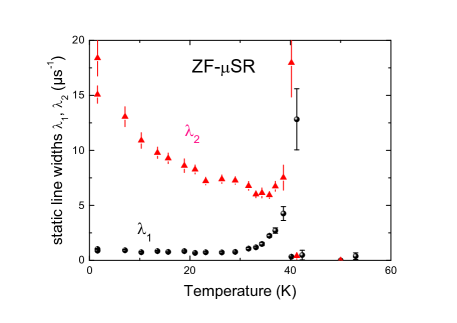
The essentially static line widths and are depicted in Fig. 12 (note that is orders of magnitude smaller). Since the local magnetic field at site 2 is 4 times larger than at site 1, is also larger than by a similar factor. Above 35 K towards both line widths increase due to the reduction of the in-plane magnetic coherence length close to . Below 30 K is nearly temperature independent whereas increases towards lower temperatures. This increase in linewidth may result from the onset of the static interlayer correlations in this temperature range.
IV Microscopic model
Scalar relativistic DFT calculations have been performed within the generalized gradient approximation (GGA) [38] as implemented in the full potential code fplo version 18 [39]. Nonmagnetic band structure calculations were performed on a 14147 mesh (228 points in the irreducible wedge). For the structural input, we used the neutron powder diffraction data measured at 10 K [25]. Note that the lattice constants and atomic coordinates provided in Table I of Ref. [25] pertain to the Cu/V disordered structure with the space group (194) and can not describe the honeycomb lattice structure of InCu2/3V1/3O3. The highest symmetry compatible with the honeycomb arrangement of Cu atoms for a single layer is (189). Yet it features a simple stacking of magnetic honeycomb planes without a shift, giving rise to the spurious trigonal prismatic local coordination of In. Thus, the minimal structural model of InCu2/3V1/3O3 entails the A-B-A-B stacking, where the A and B planes are shifted with respect to each other, leading to the space group (63).
The lack of a threefold rotation symmetry in the orthorhombic structure singles out one of the three nearest-neighbor exchanges, which is not anymore equivalent to the remaining two, and raises the question of a possible dimerization. To estimate this tendency, we relaxed the oxygen positions within the GGA+ with = 8.5 eV and = 1 eV using the fully localized limit as the double counting correction. To allow for an antiferromagnetic arrangement within the honeycomb planes, the symmetry has been further lowered down to monoclinic, space group (11). The resulting structure predictably has a lower GGA energy, but the difference between the transfer integrals for the inequivalent paths is small: meV for the “singled out” path versus meV for the other two paths. Moreover, since the former transfer integral is smaller, and the respective antiferromagnetic exchange is weaker, indicating that there is no tendency towards an electronically-driven dimerization in the honeycomb planes. This also agrees with the experimental data where no fingerprints of a dimerization have been observed. Therefore, all further calculations were performed for the experimental crystal structure.
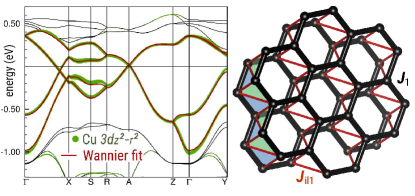
Though in the chemical notation InCu2/3V1/3O3 is named indium copper oxide-vanadate, from the physics perspective, electronically it is an undoped cuprate with the electronic configuration. Typical for this class of materials, GGA calculations yield a metallic ground state due to the severe underestimation of electronic correlations. The four Cu atoms in the unit cell produce a four-band manifold crossing the Fermi level (Fig. 13, left). In contrast to most cuprates that feature the half-filled Cu orbital, this band manifold in InCu2/3V1/3O3 corresponds to the antibonding combination of -overlapping Cu and O orbitals. The strong hybridization allows us to resort to an effective single-orbital model with one orbital per Cu. The transfer integrals between these effective orbitals are estimated by Wannier projections [40]. In this way, we find that only three terms exceed 10 meV: the first and second neighbors in the honeycomb plane — , and , respectively, — as well as the shortest interlayer coupling .
The antiferromagnetic exchange can be directly estimated in second order perturbation theory as = , where is the onsite Coulomb repulsion within the effective one-orbital model. By taking the commonly used value = 4.5 eV (e.g. [41]), we obtain the leading antiferromagnetic exchange = 360 K, which is amenable to a direct comparison with the experiment: The magnetic susceptibility of the = honeycomb Heisenberg model has a broad maximum centered at 0.72 (e.g., [42]). By taking the experimental position of this maximum (185 K [25]) in InCu2/3V1/3O3, we obtain of about 255 K. The reduced value of hints at a sizable ferromagnetic contribution to the magnetic exchange, which is lacking in the effective one-orbital approach in accord with the Pauli principle.
Next, we estimated the total exchange integrals, containing both antiferromagnetic and ferromagnetic contributions. To this end, we performed spin-polarized calculations, using a supercell doubled along the axis and calculated the total energies within the GGA+ approach with the Coulomb repulsion = 8.5 eV, the Hund’s exchange = 1.0 eV, and the fully localized limit [43] as the double counting correction. All calculations have been done in the cell metrically equivalent to the unit cell doubled along the axis, the space group (6), on a mesh of points. As expected, the GGA+ restores the insulating nature of InCu2/3V1/3O3, while the orbital occupation matrices indicate that the half-filled (and hence, magnetically active) orbital in InCu2/3V1/3O3 is Cu .
The GGA+ total energies of 31 different collinear magnetic configurations were mapped onto a classical Heisenberg model with = . The five short-range (with up to 7.5 Å) exchange integrals , , , , and were determined by a least-squares solution to a redundant linear problem; the results are provided in the last column of Table 3.
A corollary of this analysis is the presence of the dominant nearest-neighbor exchange and the much weaker interlayer exchange (see the right panel of Fig. 13 for a sketch of the model), while further exchange couplings are comparable to the error bars. At this point, it is crucial to consider the topology of the spin lattice. As we discussed earlier in this Section, the neighboring layers in InCu2/3V1/3O3 are shifted with respect to each other. Due to this shift, two interplane exchanges couple the nearest neighbors of one plane with the same spin in the neighboring plane. The resulting –– triangles underlie the geometrical frustration of the magnetic model (Fig. 13, right). We conclude that InCu2/3V1/3O3 is an excellent realization of the honeycomb lattice where the magnetic ordering is further suppressed by a frustrated interlayer exchange.
Let us note that the absolute numerical values of and may be up to % inaccurate due to the ambiguous choice of the parameter. Yet their ratio % and the irrelevance of further exchanges beyond the – model are a solid outcome of the analysis. It is clear that in the J regime, the anisotropy of may play a crucial role as its magnitude can be larger than the isotropic exchange . To investigate the anisotropic terms, we perform full-relativistic noncollinear GGA+ calculations using vasp version 5.4.4 [44; *oj:VASP_2] with projector-augmented-wave pseudopotentials [46; 47]. Anisotropic exchange parameters were evaluated by using the four-cell method [48]. The resulting bilinear exchange tensor is:
| (5) |
where the honeycomb planes are in the plane. Thus, the antisymmetric part of describes the Dzyaloshinksii-Moriya vector = 0.7 K perpendicular to the honeycomb planes. The extremely small value of of 0.3 % again indicates that InCu2/3V1/3O3 is an excellent model honeycomb system. In contrast, the diagonal elements reveal a considerable XXZ anisotropy of 4 %.
| path | multiplicity | |||
|---|---|---|---|---|
| 3.3509 | 12 | |||
| 5.8038 | 24 | |||
| 6.2572 | 16 | |||
| 6.7018 | 12 | 6 | ||
| 7.0979 | 16 | 2 |
The crystal field generated by the trigonal bipyramidal environment of copper atoms in InCu2/3V1/3O3 renders the orbital half-filled and magnetically active. This unusual orbital ground state has been previously conjectured for two other cuprate materials: the spin chain system CuSb2O6 [50; 51] and the 3D skyrmionic Mott insulator Cu2OSeO3 [52; 53].
In CuSb2O6, the CuO6 octahedra are squeezed, forming two short and four long Cu–O bonds. DFT calculations indicate a small crystal field splitting, but the orbital becomes half-filled due to the larger band width, which in turn gives rise to a sizable gain in kinetic energy [51]. Hence, the orbital ground state is stabilized by the competition between hopping processes and the onsite Coulomb repulsion rather than by the crystal field.
The case of Cu2OSeO3 is closer to InCu2/3V1/3O3: here, one of the two structurally inequivalent copper atoms, Cu(1), has the local trigonal bipyramid environment. The microscopic magnetic model features five inequivalent exchanges, two ferromagnetic exchanges connecting Cu(2) atoms that have the conventional orbital ground state, and three antiferromagnetic exchanges that couple Cu(1) and Cu(2) sublattices. Interestingly, one of these antiferromagnetic exchanges is accompanied by a large Dzyaloshinskii-Moriya anisotropy amounting to 58% of the isotropic exchange [53]. However, in InCu2/3V1/3O3 the situation is remarkably different: the orbitals of the neighboring atoms are stretched perpendicular to the respective nearest-neighbor bonds, and the Dzyaloshinskii-Moriya anisotropy is nearly absent.
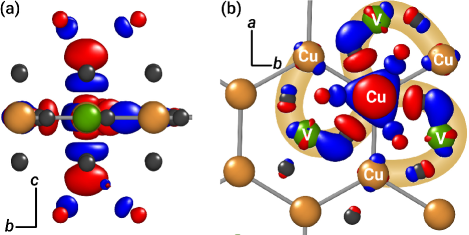
Coming back to the isotropic model, InCu2/3V1/3O3 has a sizable nearest-neighbor superexchange, while longer-range intraplane exchanges and are strongly suppressed. As can be seen from the Wannier functions of states in Fig. 14, this behavior can be understood as a joint effect of the orbital state and the strong covalency of V-O bonds. A sizable V-mediated superexchange is present in other low-dimensional magnets, such as volborthite Cu3V2O7(OH)H2O [54] and SrNi2V2O8 [55].
V Discussion
A very intriguing feature of InCu2/3V1/3O3 is the occurrence of two characteristic temperatures in the low- regime of this compound. We begin the discussion by summarizing how these temperatures manifest in different kinds of measurements. The kink in the static magnetic magnetic susceptibility at 38 K was originally ascribed to the 3D AFM order of the spins in the bulk of InCu2/3V1/3O3 at K [27], and later on reconsidered to be a signature of local magnetic correlations of the spins at the structural domain boundaries [25]. Interestingly, the spin-flop transition in the field dependence of the static magnetization at T which usually occurs in 3D ordered anisotropic antiferromagnets is observed in InCu2/3V1/3O3 only below 20 K which has been interpreted as the formation of the 3D Néel-type collinear AFM spin structure below this characteristic temperature [28]. This conclusion was corroborated by the occurrence of the second kink in the static susceptibility and by the observation of the gapped AFM resonance modes at sub-THz frequencies below 20 K. Such resonance modes are typical for a 3D collinear antiferromagnet, and soften at the same critical field [28]. However, the gapless paramagnetic ESR signal can be observed only above the upper characteristic temperature of 38 K [27] suggesting that up to this temperature the spin system in InCu2/3V1/3O3 still remains in some quasi-static correlated state featuring anomalous spin dynamics [29].
Indeed, below the ”upper” ordering temperature K, as determined by the present local spin probe techniques, the development of the internal field – static on the timescale of the NQR and SR experiments – manifests in the splitting of the 115In NQR lines (Fig. 4) and in the spontaneous precession of the muon spin (Fig. 9). The splitting of the 115In NQR lines enables one to monitor the temperature dependence of the internal field probed by the nuclei which is proportional to the sublattice magnetization in InCu2/3V1/3O3.
As to the dynamic characteristics, the spin-lattice relaxation rate of 115In nuclei exhibits a sharp peak at K and a broad peak at K (Fig. 6), i.e., it is sensitive to both characteristic temperatures discussed above. The muon relaxation rate exhibits similar characteristic features (Fig. 11). In contrast, the spin-lattice relaxation rate of 51V nuclei shows a peak only at K (Fig. 7) due to a special symmetry position of these nuclei (see below).
The internal field probed by NQR and SR can be considered as a measure of the order parameter of the spin system in InCu2/3V1/3O3. Therefore, it is instructive to analyze its temperature dependence in some detail. In NQR, as a quantity proportional to we have taken the full splitting of the outer satellites and (Fig. 4). Analysis of the -dependence of can provide information about the spin dimensionality of the spin system. Such a dependence is shown in Fig. 15 together with the -dependence of the muon precession frequency which perfectly match together. Both data sets were fitted together by the critical exponent function according to Eq. (4). The fit yields the ordering temperature =39.10.1 K and the critical exponent = 0.240.02, practically the same as from the fit of the muon precession frequency alone (cf. Fig. 10).
The theoretically expected values of the critical exponent are for the 3D Heisenberg spin system, for the 3D XY-model, for the 3D Ising system, for the 2D XY-model, and for the 2D Ising system [56; 57; 58]. The experimentally obtained value of is surprisingly close to the prediction for the 2D XY model [57], reflecting the predominantly two-dimensional critical behavior of quasi-statically correlated Cu spins in InCu2/3V1/3O3.
It appears from this analysis that, although the occurrence of the internal field may be related to the development of 3D quasi-static correlations – as it follows from the Quantum Monte-Carlo calculations in Ref. [28] – the correlations develop predominantly in the planes whereas the inter-plane correlation length increases much slower. Furthermore, as it was shown in Ref. [57], in the framework of the 2D XY model one finds finite magnetization at in 2D finite-size clusters even if their size approaches a macroscopic scale. This situation is likely to be realized in InCu2/3V1/3O3 since the finite in-plane structural correlation length of Å due to the Cu/V site inversion [25] may set respective constraints on the magnetic correlation length. Therefore, one can consider the spin system in InCu2/3V1/3O3 to be in a quasi-2D static state below 39 K. As it follows from the microscopic model developed in Sect. IV such an anisotropic behavior could be attributed to a significant geometrical frustration of the interlayer exchange due to the shift of the Cu-V layers with respect to each other along the -axis. Therefore, the Cu spins in the neighboring layers are AFM coupled on a frustrated triangular motif. In this situation the planes are effectively decoupled but a small amount of defects can partially break the interlayer frustration enabling some correlations also across the planes [59]. Moreover, as we have shown in Sect. IV, in InCu2/3V1/3O3 there is a rather rare situation that the intralayer exchange, being much larger than that between the layers, is not frustrated which stabilizes a quasi-static state below K. Due to residual interlayer spin dynamics this is not yet a conventional true 3D Néel AFM ordered state. This is evidenced by the pronounced 2D XY critical behavior and also by the absence of the fully developed AFM resonance modes and the field-induced spin-flop transition.
At first glance, it seems surprising that the slowing down of the in-plane spin dynamics in InCu2/3V1/3O3 by approaching the upper characteristic temperature K from above does not result in a typical peak in the -dependence of the 51V relaxation rate . However, one should keep in mind that the nonmagnetic V ions are located in the plane in the symmetric position with respect to the Cu ions. Therefore, the growth of the in-plane AFM correlations between the Cu spins results in a gradual decrease of the effective local field acting on the V nuclei ultimately down to zero. This yields the slowing down of the rate despite the decreasing frequency of the spin fluctuations. This in-plane dynamics could be probed by V nuclei at the defect non-symmetric crystallographic sites whose amount is however quite small in our samples. Nevertheless the transition into a quasi-2D static state below is reflected in a reduction of the stretching parameter from 1 to 0.5, which is typical for a 2D situation (Fig. 7) [60]. In contrast, a characteristic peak at is present in the rate of 115In nuclei which are in the non-symmetric position with respect to the Cu spins in the plane (Fig. 2) and the parameter also drops down to 0.5 at (Fig. 6). Similarly, the muons at the nonsymmetric interstitial position exhibit at this temperature a sharp peak in the relaxation rate, too (Fig. 11).
The onset of the spin-flop transition below K [28] evidences the establishment of the fully developed 3D magnetic order in InCu2/3V1/3O3. Due to the shift of the honeycomb planes along the -axis the local fields in the ordered state become nonzero at the V sites as well. Associated with this, the -dependences of the rate of both types of nuclei as well as the relaxation rate of the implanted muons feature the peak at K (Figs. 6, 7 and 11). This peak is broad suggesting a rather gradual transformation of the magnetic state obviously related to the strong interlayer frustration and the related residual interlayer spin dynamics which is suppressed only gradually with decreasing temperature. The suppression of this dynamics and the establishment of the 3D order leads to a more homogeneous distribution of local fields. As a consequence, the NQR linewidth which continuously increased below 39 K saturates and even narrows below K (Fig. 16). The absence of an anomaly in the specific heat associated with magnetic order might be related to the fact that a large fraction of magnetic entropy is already lost below 100 K due to short-range correlations [25] as well as due to the pronounced two-dimensionality of the spin system which suppresses the -peak in the dependence at the magnetic phase transition [61]. Presumably, the ordered moment could be quite small due to the enhanced spin fluctuations in the 2D honeycomb lattice with the low coordination number , which might explain the non-observation of magnetic Bragg peaks in neutron diffraction [25]. The reason for a missing magnetic anomaly in the thermal expansion [25] could be a weak magneto-elastic coupling due to the quenched orbital moment of Cu2+.

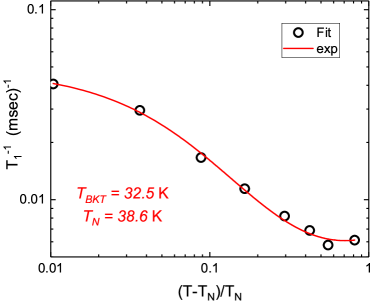
The possibility of the realization of the BKT physics in InCu2/3V1/3O3 is certainly a very intriguing issue. That the honeycomb planes in this compound feature planar anisotropy has been shown by our DFT calculations and previously was suggested by ESR experiments in Ref. [27]. It should be noted that for the occurrence of the BKT transition at a finite temperature the pure XY limit is not necessary. As was shown by Cuccoli et al. [62] using quantum Monte Carlo simulations, even a very small (of the order of 10-3) deviation from the isotropic Heisenberg case towards planar anisotropy gives rise to the BKT transition at a finite temperature. As has been discussed, e.g., in Ref. [19] the occurrence of the Néel order obscures but not necessarily completely excludes the BKT physics. The detection of the BKT transition in low-dimensional quantum spin magnets is a general problem. Unlike in FM or AFM ordered phases magnetization is not the order parameter for the BKT transition. Therefore, the signatures of the BKT physics in such experimental methods as neutron scattering, NMR or ESR can be detected only indirectly by looking for critical exponents above the transition point. The critical behavior of the electron spin system can be studied by analyzing the -dependence of the nuclear spin-lattice relaxation rate. Having established the 2D XY behavior below = 39 K from the analysis of the static internal field in InCu2/3V1/3O3, one can expect that above this temperature the correlation length follows an exponential dependence, predicted by Kosterlitz [18]:
| (6) |
where 1 and . is the BKT phase transition temperature into the vortex - antivortex paired state. As it was shown by Borsa [63] the spin-lattice relaxation rate in a 2D antiferromagnetic system is proportional to the square of the correlation length :
| (7) |
Here is the gyromagnetic factor of 115In, = is the exchange frequency and is the effective fluctuating hyperfine field [64]. Following the same procedure as used by Waibel et al. for the 51V NMR relaxation in BaNi2V2O8 [21], the NQR magnetic spin-lattice relaxation rate for InCu2/3V1/3O3 can be fitted with the following function:
| (8) |
where , and the linear -term accounts for the direct phonon relaxation. The fit yields K and , which is close to the theoretical value within the error bar (Fig. 17).
Such an estimate of appears to be consistent with the theoretical results in Ref. [57] where the temperature of the onset of the staggered magnetization (in our case K) of a 2D large-size spin cluster is somewhat higher than the BKT transition temperature.
From the theoretical perspective, our conjecture on the BKT transition in InCu2/3V1/3O3 requires further analysis. Generally, a BKT transition should manifest itself in the behavior of long range spin correlations at different temperatures. According to our DFT calculations, the minimal model to address the BKT physics in InCu2/3V1/3O3 is the XXZ model of AB-stacked honeycomb lattices with the interplane exchange amounting to 2.5% of the nearest neighbor exchange. Unfortunately, simulating this model is very challenging: while quantum Monte Carlo techniques suffer from the sign problem due to magnetic frustration, classical Monte Carlo simulations are not justified for the extreme quantum case of . Nevertheless, we believe that our experimental indications of the BKT transition in InCu2/3V1/3O3 will stimulate further numerical studies of this model, for instance, using the recently introduced pseudofermion functional renormalization group method [65], capable of treating quantum spin models with frustration.
VI Conclusions
To summarize, we have studied the low-temperature magnetic properties of the quasi-2D magnet InCu2/3V1/3O3 featuring honeycomb planes of AFM coupled Cu2+ spins by employing three kinds of local spin probes, the nuclei 115In and 51V at the regular lattice sites and implanted spin-polarized muons at interstitial lattice sites. The main objective of this study was to elucidate the nature of the two characteristic temperature scales of K and K which were controversially interpreted in different previous experiments. The splitting of the 115In NQR spectral lines and the onset of the muon spin precession at 39 K evidence the development of the staggered magnetization whose temperature dependence agrees well with the predictions of the 2D XY model suggesting that InCu2/3V1/3O3 is in a quasi-2D static magnetic state below this temperature. A transition to this state is signified by a peak in the -dependence of the relaxation rate of the In nuclei at K and a maximum in the longitudinal muon spin relaxation rate, whereas such a peak is absent in the case of the V nuclei due to the cancellation of the local fluctuating fields at this symmetric in-plane position, as expected for the quasi-2D ordered state. However, a true 3D long range magnetic order in InCu2/3V1/3O3 gradually sets in at a significantly lower temperature manifesting in the broad relaxation peaks at K for both types of nuclei and a weak anomaly in the muon relaxation rate. These experimental results are strongly supported by our DFT calculations of the electronic band structure and of the exchange constants in InCu2/3V1/3O3 that reveal the dominance of the nearest neighbor AFM exchange in the honeycomb spin-1/2 planes with a significant XXZ anisotropy and with negligible further neighbor in-plane couplings, as well as a single sizable and frustrated AFM exchange between the honeycomb planes. It appears from our experimental and theoretical findings that such a significant interlayer magnetic frustration concomitant with some structural disorder give rise to two distinct magnetic states successively occurring in InCu2/3V1/3O3 upon lowering the temperature. Particularly intriguing are indications from the analysis of the 115In relaxation rate of the topological BKT transition in the honeycomb planes of InCu2/3V1/3O3 in the quasi-2D ordered state presumably occurring at K, which call for theoretical studies of the BKT physics in this compound.
Acknowledgments
This work has been supported in part by the Deutsche Forschungsgemeinschaft in the framework of CRC ”Correlated Magnetism - From Frustration to Topology” (SFB 1143, project-id 247310070) and Würzburg–Dresden Cluster of Excellence on Complexity and Topology in Quantum Matter – ct.qmat (EXC 2147, project-id 39085490), and is partially based on experiments performed at the Swiss Muon Source SS, Paul Scherrer Institute, Villigen, Switzerland. E.V. and M.I. acknowledge the support of RFBR through grant No. 18-02-00664. O.J. was supported by the Leibniz Association through the Leibniz Competition. A.M. acknowledges support by the Carl Zeiss Foundation. We thank Ulrike Nitzsche for technical assistance.
Appendix
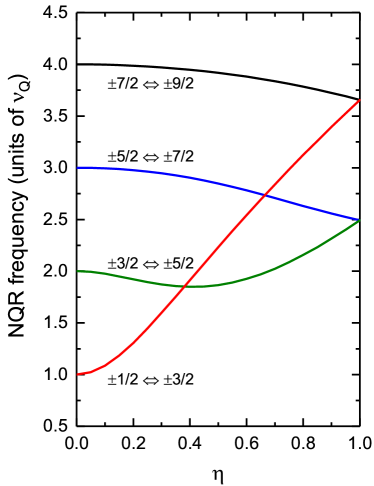
Hamiltonian (1) can be easily solved for the asymmetry parameter = 0, i.e., in the case of the axial symmetry of the charge distribution around the nucleus. For 0 it is still solvable analytically for the nuclei with , but for there is no analytical solution. Therefore, for 115In with we have calculated the transition frequencies as a function of numerically.
The results for the four allowed transitions , , and are presented in Fig. 18. As is customary, the levels are labeled according to the largest component of the wavefunction, though is a good quantum number only when = 0.
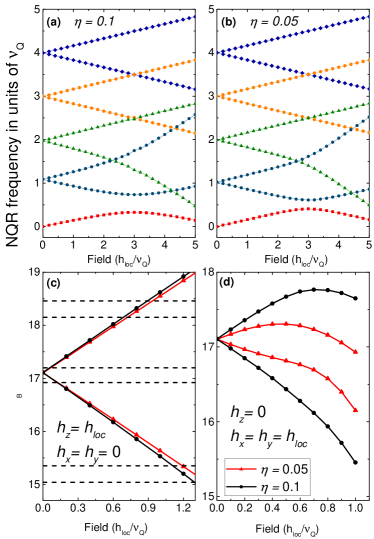
Additionally, we numerically solved Hamiltonian (1) perturbed by the Zeeman interaction due to the local magnetic field . For calculations we considered two cases of the EFG with and relevant for InCu2/3V1/3O3. Computation results are shown in Figs. 19(a) and 19(b). As a consequence of the Zeeman splitting the additional transition appears. In our calculations we considered the case when the magnetic field is applied along the EFG -principal axis. A comparison of the calculations with the experimental data obtained at 10 K (cf. Fig. 4) is shown in Fig. 19(c). As it can be seen there, in the case of very small magnetic fields, the line splitting is small and is masked by the overlap of the lines. In stronger fields all four transitions are well separated in a qualitative agreement with experiment. On the quantitative level there is some discrepancy due to the non-collinearity of and the -axis of EFG which results in an asymmetric splitting of the lines. To illustrate this, in Fig. 19(d) we show the other simple limit of ().
References
- Mermin and Wagner [1966] N. D. Mermin and H. Wagner, Phys. Rev. Lett. 17, 1133 (1966).
- Zvereva et al. [2015] E. A. Zvereva, M. I. Stratan, Y. A. Ovchenkov, V. B. Nalbandyan, J.-Y. Lin, E. L. Vavilova, M. F. Iakovleva, M. Abdel-Hafiez, A. V. Silhanek, X.-J. Chen, A. Stroppa, S. Picozzi, H. O. Jeschke, R. Valentí, and A. N. Vasiliev, Phys. Rev. B 92, 144401 (2015).
- Kurbakov et al. [2017] A. I. Kurbakov, A. N. Korshunov, S. Y. Podchezertsev, A. L. Malyshev, M. A. Evstigneeva, F. Damay, J. Park, C. Koo, R. Klingeler, E. A. Zvereva, and V. B. Nalbandyan, Phys. Rev. B 96, 024417 (2017).
- Bera et al. [2017] A. K. Bera, S. M. Yusuf, A. Kumar, and C. Ritter, Phys. Rev. B 95, 094424 (2017).
- Lefrançois et al. [2016] E. Lefrançois, M. Songvilay, J. Robert, G. Nataf, E. Jordan, L. Chaix, C. V. Colin, P. Lejay, A. Hadj-Azzem, R. Ballou, and V. Simonet, Phys. Rev. B 94, 214416 (2016).
- Petrenko et al. [2008] O. A. Petrenko, G. Balakrishnan, N. R. Wilson, S. de Brion, E. Suard, and L. C. Chapon, Phys. Rev. B 78, 184410 (2008).
- Li et al. [2012] P. H. Y. Li, R. F. Bishop, D. J. J. Farnell, and C. E. Campbell, Phys. Rev. B 86, 144404 (2012).
- Mulder et al. [2010] A. Mulder, R. Ganesh, L. Capriotti, and A. Paramekanti, Phys. Rev. B 81, 214419 (2010).
- Mosadeq et al. [2011] H. Mosadeq, F. Shahbazi, and S. A. Jafari, Journal of Physics: Condensed Matter 23, 226006 (2011).
- Bishop et al. [2012] R. F. Bishop, P. H. Y. Li, D. J. J. Farnell, and C. E. Campbell, Journal of Physics: Condensed Matter 24, 236002 (2012).
- Yogi et al. [2017] A. Yogi, A. K. Bera, A. Maurya, R. Kulkarni, S. M. Yusuf, A. Hoser, A. A. Tsirlin, and A. Thamizhavel, Phys. Rev. B 95, 024401 (2017).
- Bishop et al. [2014] R. F. Bishop, P. H. Y. Li, and C. E. Campbell, Phys. Rev. B 89, 214413 (2014).
- Smirnova et al. [2009] O. Smirnova, M. Azuma, N. Kumada, Y. Kusano, M. Matsuda, Y. Shimakawa, T. Takei, Y. Yonesaki, and N. Kinomura, Journal of the American Chemical Society 131, 8313 (2009).
- Matsuda et al. [2010] M. Matsuda, M. Azuma, M. Tokunaga, Y. Shimakawa, and N. Kumada, Phys. Rev. Lett. 105, 187201 (2010).
- Berezinskii [1971] V. L. Berezinskii, Journal of Experimental and Theoretical Physics 32, 493 (1971).
- Kosterlitz and Thouless [1973] J. M. Kosterlitz and D. J. Thouless, Journal of Physics C: Solid State Physics 6, 1181 (1973).
- Kosterlitz and Thouless [1972] J. M. Kosterlitz and D. J. Thouless, Journal of Physics C: Solid State Physics 5, L124 (1972).
- Kosterlitz [1974] J. M. Kosterlitz, Journal of Physics C: Solid State Physics 7, 1046 (1974).
- Regnault and Rossat-Mignod [1990] L. P. Regnault and J. Rossat-Mignod, “Phase transitions in quasi two-dimensional planar magnets,” in Magnetic Properties of Layered Transition Metal Compounds, edited by L. J. de Jongh (Springer Netherlands, Dordrecht, 1990) pp. 271–321.
- Heinrich et al. [2003a] M. Heinrich, H.-A. Krug von Nidda, A. Loidl, N. Rogado, and R. J. Cava, Phys. Rev. Lett. 91, 137601 (2003a).
- Waibel et al. [2015] D. Waibel, G. Fischer, T. Wolf, H. v. Löhneysen, and B. Pilawa, Phys. Rev. B 91, 214412 (2015).
- Klyushina et al. [2017] E. S. Klyushina, B. Lake, A. T. M. N. Islam, J. T. Park, A. Schneidewind, T. Guidi, E. A. Goremychkin, B. Klemke, and M. Månsson, Phys. Rev. B 96, 214428 (2017).
- Rønnow et al. [2000] H. Rønnow, A. Wildes, and S. Bramwell, Physica B: Condensed Matter 276-278, 676 (2000).
- Tutsch et al. [2014] U. Tutsch, B. Wolf, S. Wessel, L. Postulka, Y. Tsui, H. O. Jeschke, I. Opahle, T. Saha-Dasgupta, R. Valentí, A. Brühl, K. Removic-Langer, T. Kretz, H.-W. Lerner, M. Wagner, and M. Lang, Nature Communications 5, 5169 EP (2014), article.
- Möller et al. [2008] A. Möller, U. Löw, T. Taetz, M. Kriener, G. André, F. Damay, O. Heyer, M. Braden, and J. A. Mydosh, Phys. Rev. B 78, 024420 (2008).
- qing Jia et al. [2017] S. qing Jia, Q. wei Wang, J. Liu, and L.-J. Zou, Journal of Physics: Conference Series 827, 012010 (2017).
- Kataev et al. [2004] V. Kataev, A. Möller, U. Löw, W. Jung, N. Schittner, M. Kriener, and A. Freimuth, J. Magn. Magn. Mater. 290-291, 310 (2004).
- Yehia et al. [2010] M. Yehia, E. Vavilova, A. Möller, T. Taetz, U. Löw, R. Klingeler, V. Kataev, and B. Büchner, Phys. Rev. B 81, 060414 (2010).
- Okubo et al. [2011] S. Okubo, H. Wada, H. Ohta, T. Tomita, M. Fujisawa, T. Sakurai, E. Ohmichi, and H. Kikuchi, Journal of the Physical Society of Japan 80, 023705 (2011).
- Yan et al. [2012] Y. J. Yan, Z. Y. Li, T. Zhang, X. G. Luo, G. J. Ye, Z. J. Xiang, P. Cheng, L. J. Zou, and X. H. Chen, Phys. Rev. B 85, 085102 (2012).
- Jia et al. [2017] S.-Q. Jia, Q.-W. Wang, X.-L. Yu, and L.-J. Zou, AIP Advances 7, 055825 (2017).
- Suter and Wojek [2012] A. Suter and B. M. Wojek, Physics Procedia 30, 69 (2012).
- Abragam [1961] A. Abragam, Principles of Nuclear Magnetism (Clarendon Press, Oxford, 1961).
- Iakovleva et al. [2017] M. Iakovleva, S. Zimmermann, J. Zeisner, A. Alfonsov, H.-J. Grafe, M. Valldor, E. Vavilova, B. Büchner, and V. Kataev, Phys. Rev. B 96, 064417 (2017).
- Chepin and Jr [1991] J. Chepin and J. H. R. Jr, Journal of Physics: Condensed Matter 3, 8103 (1991).
- Kranendonk [1954] J. V. Kranendonk, Physica 20, 781 (1954).
- Narath [1967] A. Narath, Phys. Rev. 162 (1967).
- Perdew et al. [1996] J. P. Perdew, K. Burke, and M. Ernzerhof, Phys. Rev. Lett. 77, 3865 (1996).
- Koepernik and Eschrig [1999] K. Koepernik and H. Eschrig, Phys. Rev. B 59, 1743 (1999).
- Eschrig and Koepernik [2009] H. Eschrig and K. Koepernik, Phys. Rev. B 80, 104503 (2009).
- Janson et al. [2009] O. Janson, W. Schnelle, M. Schmidt, Y. Prots, S.-L. Drechsler, S. K. Filatov, and H. Rosner, New J. Phys. 11, 113034 (2009).
- Tsirlin et al. [2010] A. A. Tsirlin, O. Janson, and H. Rosner, Phys. Rev. B 82, 144416 (2010).
- Czyżyk and Sawatzky [1994] M. T. Czyżyk and G. A. Sawatzky, Phys. Rev. B 49, 14211 (1994).
- Kresse and Furthmüller [1996a] G. Kresse and J. Furthmüller, Phys. Rev. B 54, 11169 (1996a).
- Kresse and Furthmüller [1996b] G. Kresse and J. Furthmüller, Comput. Mater. Sci. 6, 15 (1996b).
- Blöchl [1994] P. E. Blöchl, Phys. Rev. B 50, 17953 (1994).
- Kresse and Joubert [1999] G. Kresse and D. Joubert, Phys. Rev. B 59, 1758 (1999).
- Xiang et al. [2013] H. Xiang, C. Lee, H.-J. Koo, X. Gong, and M.-H. Whangbo, Dalton Trans. 42, 823 (2013).
- Momma and Izumi [2011] K. Momma and F. Izumi, J. Appl. Cryst. 44, 1272 (2011).
- Heinrich et al. [2003b] M. Heinrich, H.-A. Krug von Nidda, A. Krimmel, A. Loidl, R. M. Eremina, A. D. Ineev, B. I. Kochelaev, A. V. Prokofiev, and W. Assmus, Phys. Rev. B 67, 224418 (2003b).
- Kasinathan et al. [2008] D. Kasinathan, K. Koepernik, and H. Rosner, Phys. Rev. Lett. 100, 237202 (2008).
- Seki et al. [2012] S. Seki, X. Z. Yu, S. Ishiwata, and Y. Tokura, Science 336, 198 (2012).
- Janson et al. [2014] O. Janson, I. Rousochatzakis, A. A. Tsirlin, M. Belesi, A. A. Leonov, U. K. Rößler, J. van den Brink, and H. Rosner, Nat. Commun. 5, 5376 (2014).
- Janson et al. [2016] O. Janson, S. Furukawa, T. Momoi, P. Sindzingre, J. Richter, and K. Held, Phys. Rev. Lett. 117, 037206 (2016).
- Bera et al. [2015] A. K. Bera, B. Lake, A. T. M. N. Islam, O. Janson, H. Rosner, A. Schneidewind, J. T. Park, E. Wheeler, and S. Zander, Phys. Rev. B 91, 144414 (2015).
- de Jongh [1990] L. de Jongh, Magnetic Properties of Layered Transition Metal Compounds (Springer Netherlands, 1990).
- Bramwell and Holdsworth [1993] S. T. Bramwell and P. C. W. Holdsworth, Journal of Physics: Condensed Matter 5, L53 (1993).
- Collins [1989] M. F. Collins, Magnetic Critical Scattering (Oxford University Press, New York, 1989).
- Liu et al. [2013] D.-Y. Liu, Y. Guo, X.-L. Zhang, J.-L. Wang, Z. Zeng, H.-Q. Lin, and L.-J. Zou, EPL (Europhysics Letters) 103, 47010 (2013).
- Narayanan et al. [1995] A. Narayanan, J. Hartman, and A. Bain, J. Magn. Reson., Series A 112, 58 (1995).
- Bloembergen [1977] P. Bloembergen, Physica B 85, 51 (1977).
- Cuccoli et al. [2003] A. Cuccoli, T. Roscilde, V. Tognetti, R. Vaia, and P. Verrucchi, Phys. Rev. B 67, 104414 (2003).
- Borsa et al. [1992] F. Borsa, M. Corti, T. Goto, A. Rigamonti, D. C. Johnston, and F. C. Chou, Phys. Rev. B 45, 5756 (1992).
- Moriya [1956] T. Moriya, Progress of Theoretical Physics 16, 23 (1956).
- Iqbal et al. [2016] Y. Iqbal, R. Thomale, F. Parisen Toldin, S. Rachel, and J. Reuther, Phys. Rev. B 94, 140408 (2016).