From Stock Prediction to Financial Relevance: Repurposing Attention Weights to Assess News Relevance Without Manual Annotations
Abstract
We present a method to automatically identify financially relevant news using stock price movements and news headlines as input. The method repurposes the attention weights of a neural network initially trained to predict stock prices to assign a relevance score to each headline, eliminating the need for manually labeled training data. Our experiments on the four most relevant US stock indices and 1.5M news headlines show that the method ranks relevant news highly, positively correlated with the accuracy of the initial stock price prediction task.
1 Introduction
Events such as lawsuits, the unveiling of a newly discovered technology, the introduction of new legislation, or previous market movements can have a significant impact on stock prices. A quick and informed reaction to such an event is crucial for financial analysts.
Information overload is pervasive in the financial industry, hindering the analysts’ ability to incorporate the most relevant events into their decision process. One of the main natural language understanding challenges across many industries is to prioritize incoming information, reducing the risk of missing important events.
In this paper, we propose a novel method to identify relevant financial news. The key insight is that this can be achieved without relying on manually created relevance judgments, instead leveraging the correlation of news events and stock prices. The core idea is to train an attention-based neural network on the stock prediction task, using the price movement as label. The input of the network is a set of events in the form of news headlines (embedded using BERT Devlin et al. (2019)), and the output is the price movement of a specific stock index with respect to the previous day (i.e., DOWN, STAY, UP), mediated by an attention layer Bahdanau et al. (2015). The layer acts as an input selector, computing the weight for each headline on a given day. These weights are repurposed to score and thus rank news headlines according to financial relevance. As each weight solely depends on the headline itself, we can use it to compare headlines across the entire dataset.
We evaluated our method on the most prominent US stock indices (S&P500, Dow Jones, Russell 1000, and Nasdaq) and 1.5 million headlines (1994-2010) from Gigaword Graff et al. (2003). A first automatic evaluation confirmed a positive correlation between stock prediction accuracy and relevance scores (via the attention weight). In a second, manual evaluation, we labeled 1000 headlines and found that the method ranks relevant events highly: A network trained on the Dow Jones stock index prices, for example, resulted in 89% relevant events in the top 200 ranks, compared to only 19% relevant events in a uniform sample of headlines.
2 Related Work
Stock price prediction from news. The feasibility of predicting stock prices from news has been debated Merello et al. (2018) as the news can affect the price before it is published. In our case this is not an issue as it only matters that the price change is reflected in the news, not the timing; news about price movements are indeed relevant. Multiple approaches explored alternatives to extract price signals from news such as sentiment analysis, semantic parsing, etc Gidófalvi (2001); Schumaker and Chen (2009); Xie et al. (2013); Li et al. (2014); Peng and Jiang (2016). Here we use contextualized embeddings plus attention to extract those signals.
Extraction of financial events. Previous work focused on the explicit representation of events, either in a canonical or semi-canonical way Ding et al. (2014, 2015, 2016); Peng and Jiang (2016); Jacobs et al. (2018), or non-canonicalized Ein-Dor et al. (2019); Shi et al. (2019). Events are represented as structured facts Ding et al. (2014), via embeddings Ding et al. (2015) or keywords Shi et al. (2019), and are usually pre-selected based on explicit company mentions Shi et al. (2019). Most approaches differ from ours in that events are input for stock prediction as ultimate goal, while we use stock prediction to identify relevant events. Our end-to-end approach allows us to automatically select the relevant events avoiding involved preprocessing, compromise on the representation of the event, or the use of an underlying extraction system.
Attention as explanation. A debate has erupted around the idea of using the attention mechanism Bahdanau et al. (2015) to explain output. Serrano and Smith (2019) and Jain and Wallace (2019) concluded that attention weights should not be used to explain a decision, and Wiegreffe and Pinter (2019) developed a set of tests to determine weight consistency. In our specific case, we found that the results on the stock price prediction are related to the attention weights performance as relevance scores, and have merit when used for ranking. However, we acknowledge the need to go into deeper analysis to understand score stability in future work.
3 Training the attention layer for event scoring
The idea is to make use of attention to learn a headline relevance weight by predicting the stock price movement. Once the network is trained we can use the unnormalized weights of the attention layer as a global relevance score for the news headlines.
As input we use all daily headlines and their categories. The output is DOWN, STAY, UP with respect to the next trading session open price. The full network is displayed in Figure 1.
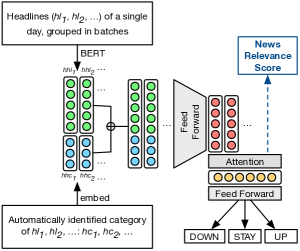
Each headline consisting of a (padded) sequence of tokens , is encoded into vectors of length via the BERT-base-uncased model pooled output:
Each headline comes with a category label (details in Section 4) embedded into a randomly initialized vector of length 30
Both vectors are concatenated
and projected to a vector of length 100 by a fully connected feed forward with ELU activation
Following Yang et al. (2016), an attention layer computes normalized weights for each headline in the input day, , and aggregates them according to those weights.
The final label (DOWN, STAY, UP) is computed using a feed forward layer with softmax activation
Every input layer is normalized, and weights are initialized using He. The dropout rate is 0.25. We use the BERT out-of-the-box optimizer111https://github.com/tensorflow/models/tree/master/official/nlp/bert. All weights are fine-tuned on the task. We ran on 3 Tesla V100 with a total batch size of 15. The model has a total of 110M parameters.
4 Evaluation
Dataset. AP headlines of English Gigaword Graff et al. (2003) and the most prominent US stock indices: S&P500, Dow Jones, Nasdaq, and Russell222https://finance.yahoo.com/quote/%5EGSPC/history?p=%5EGSPC, totaling 3777 trading sessions (1994–2010) and 1,532,260 headlines, with a daily average of 405.68, a standard deviation of 134.49, a minimum of 1 and a maximum of 1213.
News Classification. We trained a classifier on TagMyNews Vitale et al. (2012) to classify the headlines into 6 categories: ’business’, ’entertainment’, ’health’, ’sci-tech’, ’sport’, ’us’ and ’world’. The input of the BERT based model is a single headline and the output a class score (dropout=0.25, batch size=120, maximum headline length=15 tokens). The best model F1 was 0.85 (20% test size), in line with state-of-the-art Zeng et al. (2018). We assigned a single class to each headline (0.5 threshold). Table 1 shows the distribution per category.
| Category | Number of articles | % |
|---|---|---|
| world | 596,899 | 38,96 |
| sport | 275,585 | 17.99 |
| business | 231,083 | 15.08 |
| us | 211,570 | 13.81 |
| unclassified | 66,891 | 4.37 |
| entertainment | 54,607 | 3.56 |
| sci-tech | 54,057 | 3.53 |
| health | 41,568 | 2.70 |
Preprocessing. Given resource constraints, we are limited to 115 headlines per day, with a maximum length of 15 tokens. To account for more than 115 headlines, we created stratified subsets on headline categories to generate several data points per day. We discarded days with less than 25 headlines for the four most prominent categories, dropping 511 data points (13.53%), and removed headlines with less than 20 characters. To assign price movement labels, we set thresholds that minimize the distance between the majority and minority class to balance the distributions. We searched for a symmetric threshold between [0.1%, 1%] at 0.1 intervals, see Table 2 for the final values.
| Stock Index | Threshold | DOWN | STAY | UP |
|---|---|---|---|---|
| S&P500 | +/- 0.3% | 30.91% | 33.61% | 35.48% |
| Dow Jones | +/- 0.3% | 30.53% | 33.23% | 36.23% |
| Russell 1000 | +/- 0.3% | 29.47% | 34.38% | 36.15% |
| Nasdaq | +/- 0.3% | 30.48% | 29.83% | 39.69% |
4.1 Event relevance
The goal is to understand if the attention layer’s unnormalized weights can be used to generate meaningful global news relevance scores; we understand meaningful as a score that favors news reflecting stronger price movement signals, either ex-ante or ex-post the price change, as in both cases the news would be relevant; we do not control for endogeneity. We ran two experiments: one to understand which news categories provide better signals, and the second to check if they effectively receive higher scores. We also performed a manual evaluation over the top 200 headlines for each index plus a uniform random sample, totaling 1000 headlines.
Categories with stronger signals. We ran the network on each news category separately to predict the price movement. We selected the model with the maximum accuracy over 20 epochs. Table 3 shows the results for all categories. ’business’ headlines are more informative, achieving the highest accuracy on most of the stock indices. Interestingly, ’sci-tech’ news is the best category for Nasdaq, which specializes in technology. However, the top accuracy for this index lags well behind the others. This fact will be reflected in the relevance scores in the following experiment.
| News Category | S&P500 | Dow Jon. | Russ. 1000 | Nasd. |
|---|---|---|---|---|
| business | 57.88 | 61.97 | 55.92 | 43.64 |
| us | 40.13 | 42.02 | 39.59 | 38.45 |
| world | 41.83 | 39.66 | 38.73 | 44.89 |
| sports | 38.94 | 36.36 | 38.94 | 44.09 |
| sci-tech | 36.74 | 37.05 | 36.90 | 44.96 |
| entertainment | 34.57 | 37.98 | 38.14 | 42.33 |
| health | 34.57 | 34.26 | 35.81 | 40.78 |
| all | 52.92 | 54.99 | 54.49 | 45.22 |
| Stock Index | @Rank 10 | @Rank 100 | @Rank 1000 | @Rank 2500 |
|---|---|---|---|---|
| S&P500 | 90.00% / +471.09% | 91.82% / +482.62% | 87.50% / +455.22% | 81.30% / +415.88% |
| Dow Jones | 85.00% / +439.36% | 63.00% / +299.76% | 40.95% / +159.84% | 29.02% / +84.14% |
| Russell 100 | 100.00% / +534.54% | 92.33% / +485.90% | 87.40% / +454.59% | 81.84% / +419.31% |
| Nasdaq | 0.06% / -61.93% | 14.20% / -9.90% | 16.46% / +4.45% | 16.512% / +4.78% |
| Rank | Headline | Rank | Headline |
|---|---|---|---|
| 1 | Dow Drops 176; Nasdaq Tumbles 179 | 14 | Stocks, Dollar Lower on Strong Economic Report … |
| 2 | U.S. stocks drop as bond market signals slowdown; Dow … | 15 | Dow Down 60.50; Nasdaq Off 8.78 |
| 3 | U.S. stocks drop on profit-taking, poor Time Warner … | 16 | Stocks dip as traders await Fed meeting details |
| 4 | Dollar Lower, Stocks Fall in Early Trading | 17 | Dow Drops 17; Nasdaq Down Fraction |
| 5 | Stocks fall despite manufacturing pickup … | 18 | Dollar Weaker, Stocks Fall … |
| 6 | Nasdaq Falls 95; Dow Up 8 | 19 | Dollar, Stocks Traded Lower Eds … |
| 7 | Stocks Fall, Dollar Traded Higher … | 20 | Stocks Fall Back, Dollar Lower … |
| 8 | Stocks fall in early trading | 21 | Stocks fall on concerns over Wall Street and local ec… |
| 9 | U.S. stocks turn lower as investors take profits from … | 22 | Dollar, Stocks Lower in Early Tokyo Trading … |
| 10 | Dow closes below 10,000; Nasdaq at lowest level … | 23 | Nasdaq Ends Down 147; Dow Up 25 |
| 11 | Stocks lower on Wall Street amid mixed global picture … | 24 | U.S. stocks end mostly lower after GDP report … |
| 12 | Financial shares fall on delay, restatement of results | 25 | Dow Up 70.20; Nasdaq Falls 71.28 |
| 13 | Stocks Plunge on Profit-Taking, Dollar Inches Higher … | 26 | London Shares Lower … |
| Rank | Headline |
|---|---|
| 1 | Latam stocks lower on slowdown concerns |
| 2 | Stocks end lower amid worries after House OKs plan |
| 3 | Latam stocks plunge on slowdown concerns |
| 4 | World markets drop on worries of US-led slowdown |
| 5 | French economy enters recession |
| 6 | US economy sheds most jobs since 2003 |
| 7 | Manhattan apartment sales drop further |
| 8 | India ’ s key stock index drops 4 percent |
| 9 | Japan stocks slide on worries about US economy |
| 10 | Hon Kong stocks drop on US worries |
| 11 | Credit markets still tight after bailout approval |
| 12 | US cuts off family planning group in Africa |
| 13 | Employers cut 159,000 jobs, most in over 5 years |
| 14 | Russian shares fall sharply |
| 15 | US Congress OKs bailout bill and Bush signs its |
Scoring news headlines. Now we need to understand if the attention weights are consistent with results in Table 3; we expect ’business’ headlines to have a relatively higher score. We trained the network on the entire set of news and used the attention layer to score 271,520 headlines across all categories in the test set. We selected the model with the minimum loss, patience of two epochs. Table 4 shows the results for the top 10, 100, 1,000, and 2,500 headlines. It shows the fraction of business headlines up to that rank, and the increase compared to the fraction of business news in the whole set. For the indices with higher accuracy in the previous experiment (S&P500, Dow Jones, and Russell 1000), the scores significantly skew the distribution at the top ranks towards business news by between 534.65%–471.09% at Rank 10 and between 419.31%–84.14% at Rank 2500. For Nasdaq, with a previously lower performance, the scores do not seem to provide a clear pattern, indicating that the stock prediction performance might reflect the quality of scores.
4.2 Anecdotal data
Table 5 shows the top 26 headlines over the whole timespan, ranked using the unnormalized attention layer weights of the model trained for S&P500 with all news categories. The examples show that the model scores market-relevant headlines highly. We see mostly headlines reflecting general market trends. Results for an iconic date, October 3, 2008, in which the US House passed the 2008 bailout show the same trend (Table 6). As for a single day, specific news about stock movements are not many, top-ranking has space for other relevant economic or political events.
4.3 Manual evaluation
We labeled the top 200 test set headlines for each index plus 200 uniformly sampled. Two annotators classified them as relevant or non-relevant. In total, there were only 19 (1.9%) discrepancies that were resolved via mutual agreement. Table 7 shows the relevance results and the high inter-annotator agreement. As before, financially relevant news score higher for the best performing indices compared to Nasdaq and the uniform sample.
| Stock Index | Relevant | Not Relevant | Cohen’s kappa |
|---|---|---|---|
| S&P500 | 100% | 0% | 1 |
| Dow Jones | 89% | 11% | 0.88 |
| Russell 1000 | 87% | 13% | 0.94 |
| Nasdaq | 25.5% | 73.5% | 0.95 |
| Uniform | 19% | 81% | 0.90 |
5 Conclusion and future work
We presented an exploratory analysis to rank financially relevant events without manually labeled data. We showed that when a simple neural network is able to extract informative signals from news, the attention layer was able to score higher the most relevant news. Future work needs to focus on a more fine-grained analysis of the data and understanding the stability of the scores.
Acknowledgments
We gratefully acknowledge the support of NVIDIA Corporation with the donation of the Titan V GPU used for this research.
References
- Bahdanau et al. (2015) Dzmitry Bahdanau, Kyunghyun Cho, and Yoshua Bengio. 2015. Neural machine translation by jointly learning to align and translate. In ICLR.
- Devlin et al. (2019) Jacob Devlin, Ming-Wei Chang, Kenton Lee, and Kristina Toutanova. 2019. BERT: Pre-training of deep bidirectional transformers for language understanding. In NAACL-HLT, pages 4171–4186.
- Ding et al. (2014) Xiao Ding, Yue Zhang, Ting Liu, and Junwen Duan. 2014. Using structured events to predict stock price movement: An empirical investigation. In EMNLP, pages 1415–1425.
- Ding et al. (2015) Xiao Ding, Yue Zhang, Ting Liu, and Junwen Duan. 2015. Deep learning for event-driven stock prediction. In IJCAI, IJCAI’15, page 2327–2333.
- Ding et al. (2016) Xiao Ding, Yue Zhang, Ting Liu, and Junwen Duan. 2016. Knowledge-driven event embedding for stock prediction. In COLING, pages 2133–2142.
- Ein-Dor et al. (2019) Liat Ein-Dor, Ariel Gera, Orith Toledo-Ronen, Alon Halfon, Benjamin Sznajder, Lena Dankin, Yonatan Bilu, Yoav Katz, and Noam Slonim. 2019. Financial event extraction using Wikipedia-based weak supervision. In Second Workshop on Economics and Natural Language Processing, pages 10–15.
- Gidófalvi (2001) Győző Gidófalvi. 2001. Using news articles to predict stock price movements.
- Graff et al. (2003) David Graff, Junbo Kong, Ke Chen, and Kazuaki Maeda. 2003. English gigaword. Linguistic Data Consortium, Philadelphia, 4(1):34.
- Jacobs et al. (2018) Gilles Jacobs, Els Lefever, and Véronique Hoste. 2018. Economic event detection in company-specific news text. In First Workshop on Economics and Natural Language Processing, pages 1–10.
- Jain and Wallace (2019) Sarthak Jain and Byron C. Wallace. 2019. Attention is not explanation. In NAACL-HLT, pages 3543–3556.
- Li et al. (2014) Xiaodong Li, Haoran Xie, Li Chen, Jianping Wang, and Xiaotie Deng. 2014. News impact on stock price return via sentiment analysis. Know.-Based Syst., 69(1):14–23.
- Merello et al. (2018) S. Merello, A. Picasso Ratto, Y. Ma, O. Luca, and E. Cambria. 2018. Investigating timing and impact of news on the stock market. In 2018 IEEE International Conference on Data Mining Workshops (ICDMW), pages 1348–1354.
- Peng and Jiang (2016) Yangtuo Peng and Hui Jiang. 2016. Leverage financial news to predict stock price movements using word embeddings and deep neural networks. In NAACL-HLT, pages 374–379.
- Schumaker and Chen (2009) Robert P. Schumaker and Hsinchun Chen. 2009. Textual analysis of stock market prediction using breaking financial news: The azfin text system. ACM Trans. Inf. Syst., 27(2).
- Serrano and Smith (2019) Sofia Serrano and Noah A. Smith. 2019. Is attention interpretable? In ACL, pages 2931–2951.
- Shi et al. (2019) Lei Shi, Zhiyang Teng, Le Wang, Yue Zhang, and Alexander Binder. 2019. Deepclue: Visual interpretation of text-based deep stock prediction. IEEE TKDE, 31:1094–1108.
- Vitale et al. (2012) Daniele Vitale, Paolo Ferragina, and Ugo Scaiella. 2012. Classification of short texts by deploying topical annotations. In ECIR, page 376–387.
- Wiegreffe and Pinter (2019) Sarah Wiegreffe and Yuval Pinter. 2019. Attention is not not explanation. In EMNLP-IJCNLP, pages 11–20.
- Xie et al. (2013) Boyi Xie, Rebecca J. Passonneau, Leon Wu, and Germán G. Creamer. 2013. Semantic frames to predict stock price movement. In ACL, pages 873–883.
- Yang et al. (2016) Zichao Yang, Diyi Yang, Chris Dyer, Xiaodong He, Alex Smola, and Eduard Hovy. 2016. Hierarchical attention networks for document classification. In NAACL-HLT, pages 1480–1489.
- Zeng et al. (2018) Jichuan Zeng, Jing Li, Yan Song, Cuiyun Gao, Michael R. Lyu, and Irwin King. 2018. Topic memory networks for short text classification. In EMNLP, pages 3120–3131.