A review of quasi-periodic oscillations from black hole X-ray binaries: observation and theory
Abstract
Black hole and neutron star X-ray binary systems routinely show quasi-periodic oscillations (QPOs) in their X-ray flux. Despite being strong, easily measurable signals, their physical origin has long remained elusive. However, recent observational and theoretical work has greatly improved our understanding. Here, we briefly review the basic phenomenology of the different varieties of QPO in both black hole and neutron star systems before focusing mainly on low frequency QPOs in black hole systems, for which much of the recent progress has been made. We describe the detailed statistical properties of these QPOs and review the physical models proposed in the literature, with particular attention to those based on Lense-Thirring precession. This is a relativistic effect whereby a spinning massive object twists up the surrounding spacetime, inducing nodal precession in inclined orbits. We review the theory describing how an accretion flow reacts to the Lense-Thirring effect, including analytic theory and recent numerical simulations. We then describe recent observational tests that provide very strong evidence that at least a certain type of low frequency QPOs are a geometric effect, and good evidence that they are the result of precession. We discuss the possibility of the spin axis of the compact object being misaligned with the binary rotation axis for a large fraction of X-ray binaries, as is required for QPOs to be driven specifically by Lense-Thirring precession, as well as some outstanding gaps in our understanding and future opportunities provided by X-ray polarimeters and/or high throughput X-ray detectors.
keywords:
Black Holes , Neutron Stars , Accretion disc , Frame-dragging1 Introduction
X-ray binary systems (XRBs) consist of a black hole (BH) or a neutron star (NS) accreting material from a stellar companion. Close to the compact object, the accreting material is heated to such high temperatures that it glows brightly in X-rays – providing a means to observe the relativistic motion of matter in strong gravitational fields, and probe the ultra-dense matter that forms NSs. These systems cannot be directly imaged as their angular size is typically sub-nano-arcseconds, but the observed rapid X-ray variability provides a means to indirectly map the accretion flow. In particular, quasi-periodic oscillations (QPOs) are commonly observed in the X-ray flux. Upon their discovery more than 30 years ago, their potential as a powerful diagnostic was immediately recognised, but unambiguous determination of their physical origin has since proved challenging. Here we review the extensive observational phenomenology of QPOs, the prevailing theories for their physical origin, and progress made through observational tests over the last decade.
Although our main focus here will be on the BH systems, we will frequently refer to the NS systems as a basis for comparison. We will almost exclusively discuss low mass XRBs, in which the companion is less massive than the compact object, and mass transfer takes place via Roche-Lobe overflow111The only exception in this review is Cygnus X-1, for which the companion is a massive O-type star, and mass transfer takes place via a focused wind.. Based on their long-term behaviour, low mass XRBs can be classified into persistent and transient sources. The former are always active, showing typical X-ray luminosities exceeding LX 1036 erg/s. The latter spend most of their life in quiescence (LX 1030–1034 erg/s) with occasional bright outbursts (typically reaching luminosities of LX 1037–1038 erg/s) that last weeks to months, more rarely years, and are spaced by months to decades. Apart from a few exceptions, BH systems are typically transients and most NS systems are persistent sources [45].
QPOs are best studied in the Fourier domain. They appear in the power spectrum – which is the modulus squared of the Fourier transform of the light curve [235] – as narrow (width less than the centroid frequency) peaks. In BH systems, QPOs are generally split into low frequency (LF) QPOs, with centroid frequency Hz, and high frequency (HF) QPOs, with centroid frequency Hz [25]. A similar distinction applies in NS systems, although the nomenclature is more complex with extra classes of QPO that are not observed in BHs, such as ‘hectohertz’ QPOs, and with the highest frequency QPOs in NSs generally referred to as kHz QPOs rather than HF QPOs. The earliest reference in the literature to what we now recognise as a LF QPO is likely in the 1979 paper by Samimi et al. [198], in which they discuss the ‘sporadic quasi-periodic behaviour’ of the X-ray light curve of GX 339-4 as observed by HEAO. However, it is not clear if this quasi-periodicity is statistically significant in their data. The first robust detection was reported in 1983 by Motch et al. [154] for the same source. An X-ray QPO with a centroid frequency of Hz was detected in data from the Ariel 6 rocket, and an optical QPO was simultaneously observed at about half that frequency in data from a 1.5 m ESO telesope located in La Silla. Only a couple of years later, QPOs were detected in X-ray data from the EXOSAT satellite, from the NS source GX 5-1 [238]. The unprecedentedly high frequency ( Hz) and persistence of the oscillations in GX 5-1, coupled with the correlation between QPO frequency and X-ray flux, suggested that they could be a geometric effect driven by a characteristic frequency of the inner accretion flow such as the orbital frequency [236]. Over the following years, thanks mainly to observations by the EXOSAT and GINGA satellites, the existence of distinct QPO types became clear for both NS [141, 236] and BH systems [147]. The Rossi X-ray Timing Explorer (RXTE), operational between 1996 and 2012, provided the richest database for the study of QPOs in XRBs, with thousands of observations in which hundreds of LF QPOs have been detected, contributing greatly to the current rich phenomenological picture.
RXTE also enabled the first detections of kHz QPOs in NS systems [239] and HF QPOs in BH systems [152, 192]. Since HF QPOs have frequencies commensurate with the epicyclic frequencies of particle motion close to the innermost stable circular orbit (ISCO) of the BH, they have been the subject of great theoretical interest [1, 107]. However, whereas kHz QPOs from NS XRBs are fairly strong and common features, HF QPOs from BH XRBs are very rare and weak features. LF QPOs, on the other hand, are very commonly observed from BH XRBs with very high signal to noise [159]. This has allowed a detailed picture of their observational properties to be built over the past few decades, and a great amount of progress as to their physical interpretation to be made over the past decade. LF QPOs in BH XRBs are therefore the primary focus of this review.
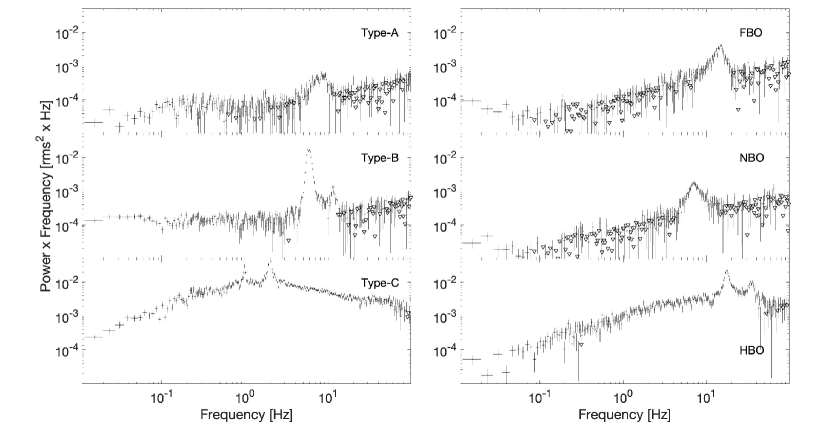
LF QPOs in BH XRBs have been classified into three types: A, B and C [252, 204, 36, 159]. Representative power spectra of these three types are shown in Fig 1 (left). Type-A QPOs are weak and broad features, whereas Type-B and Type-C QPOs are strong and relatively narrow features. Type-C QPOs are typically observed together with broad band, flat-topped noise, which has been suggested to be caused by propagating fluctuations in the mass accretion rate [129, 97]. For NS systems, the nomenclature is slightly different, and largely dependent on historical reasons: LF QPOs are classed as flaring branch oscillations (FBOs), normal branch oscillations (NBOs) and horizontal brand oscillations (HBOs), based on the location of the source in a colour-colour diagram [117, 72] at the time of the QPO detection. Fig 1 (right) shows typical examples of these three types, which have been suggested to be NS analogues of the Type-A, -B and -C, respectively, in BH systems [36, 162]. NBOs, FBOs and HBOs have been observed in the so-called Z-sources, low-mass NS XRBs accreting near or above the Eddington luminosity, (see [72]). In NS XRBs accreting at lower rates, the so-called Atoll sources, similar LF QPOs have been identified, and called HBO-like and FBO-like oscillations based on the similarities of their properties to the LF QPOs observed in Z-sources (see [162] for details).
QPO properties evolve throughout an outburst and are tightly correlated with the evolution of the spectrum through a number of spectral states: the hard state, the intermediate states and the soft state. In the hard state the X-ray spectrum is dominated by a hard power-law (photon-index 1.4-2) with a high energy cut-off around keV, while in the soft state the spectrum is dominated by a thermal component peaking at keV. Both components are present in the intermediate states. The thermal component is well understood as originating from a geometrically thin, optically thick accretion disc, in which turbulent stress transports angular momentum outwards and heats the disc material [201, 171]. Since the disc is optically thick, it locally emits a blackbody spectrum, with the blackbody temperature increasing with proximity to the BH. The power-law component is thought to originate from Compton up-scattering of soft X-ray photons from the disc (or a jet, in the low-luminosity hard states) by a cloud of hot electrons located close to the BH [223, 219], with the high energy cut-off determined by the characteristic electron temperature. There is still no consensus in the literature on the exact geometry of this cloud, which is often termed the corona. The disc may evaporate inside of some truncation radius into a large scale height accretion flow that plays the role of the corona (truncated disc model [48, 84]). Or, the corona may be located above the disc, and possibly magnetically supported [62, 71] (analogous to the solar corona). Alternatively it may be located at the base of the out-flowing jet, either being fairly compact [148, 51] or extended [114].
The spectrum also displays a reflection component that results from irradiation of the disc by the corona. The irradiated flux is reprocessed in the disc’s upper atmosphere to emit characteristic features such as an iron K fluorescence line at keV and a broad bump peaking at keV referred to as the Compton hump [118, 65]. The observed reflection spectrum is distorted by relativistic motion of the disc material (Doppler shifts) and the gravitational pull of the BH (gravitational redshift), leading to the observed iron line profile being asymmetrically broadened [50]. The observed iron line profile therefore encodes information about orbital motion in the disc, and provides a valuable diagnostic as to the physical origin of QPOs.
We will first summarise the detailed phenomenology of all QPO classes and their relation to spectral states and transitions (Section 2). We will then focus on details of LF QPOs in BH XRBs, investigating what makes them quasi-periodic as opposed to purely periodic signals (Section 3). We will discuss theoretical models of LF QPOs, many of which consider epicyclic frequencies in general relativity (GR) and their effect on the dynamics of the accretion flow. We will therefore first review some of the theory behind this (Section 4) before summarising the most prominent LF QPO models from the literature (Section 5). We will then present the most constraining observational tests of the physical mechanism behind LF QPOs (Section 6), discussing the current state of the art (Section 7) and finally concluding with a number of concluding remarks (Section 8).
2 Phenomenology of QPOs
QPOs of all classes have been studied in great detail by fitting the Poisson noise subtracted power spectrum of many observations with various empirical models, the most commonly used consisting of a sum of Lorentzian functions (e.g. [24]). The Lorentzian function is given by [241]
| (1) |
where is Fourier frequency, is the Lorentzian peak frequency (corresponding to the QPO centroid frequency), is the half width at half maximum (HWHM), and is equal to the integral of from to . From Parseval’s theorem, the power spectrum can be normalised such that its integral over all positive frequencies is equal to the square of the fractional root mean square deviation (or rms) of the corresponding time series (fractional rms normalisation; [117, 22]). The rms essentially quantifies how variable a given time series is in a given Fourier frequency range. If the rms normalisation is used, then represents the fractional rms of the Lorentzian component. A quality factor is typically defined, which describes how narrowly peaked a given component is. It is also useful to define the frequency at which the Lorentzian component contributes most of its variance per logarithmic frequency interval, , since this allows the characteristic frequencies of broad and narrow components to be compared. This frequency is sometimes referred to as the characteristic frequency [24].
QPOs often appear as a series of harmonically related peaks, which indicates that the oscillation in the time domain is more complex than purely sinusoidal. In this review, with the term ‘QPO frequency’ we will refer to the centroid frequency of the fundamental peak, , and we employ the nomenclature standard in physics in which the centroid frequency of the harmonic is . Therefore, the first harmonic is the fundamental. In contrast, the centroid frequency of the overtone is . We note that in the QPO literature the second harmonic is (erroneously) often referred to as ‘the harmonic’ or ‘the first harmonic’.
Since the QPO properties are tightly correlated with spectral state, we review the phenomenology of states and states transitions in BHs before discussing LF QPOs and HF QPOs and their observed properties.
2.1 States and transitions
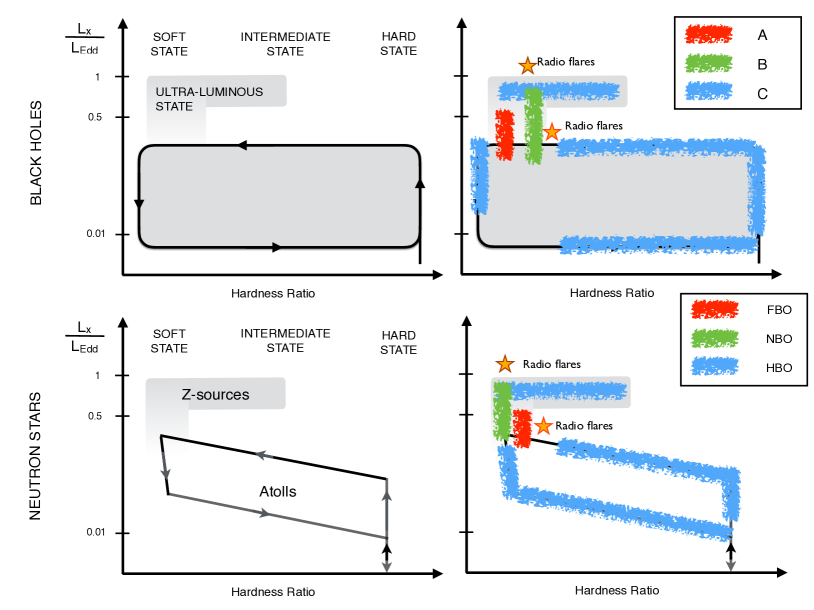
During an outburst, BH XRBs typically cycle through several spectral-timing states - believed to be connected with different accretion rates onto the BH (e.g. [150], [28]) - which can be tracked using a hardness-intensity diagram (HID) [77, 28]. Fig 2 (top left) shows a sketch of the ‘q’-shaped loop traced out on the HID by a typical BH XRB in outburst. The hardness is defined as the ratio of the counts in a harder X-ray band to that in a softer X-ray band. Typical bounds for the hard and soft bands are keV and keV [23], but being rather arbitrarily chosen, the ranges used vary quite a lot across different studies and different instruments. Outbursts begin in the hard state (bottom right of the HID), during which the time variability amplitude of the X-ray emission is high, and the rms can be as high as . Sources then transition to the soft state via two intermediate states: the hard intermediate state (HIMS) and the soft intermediate state (SIMS). This transition occurs at a roughly constant luminosity (). Since the hardness and the fractional rms variability amplitude are tightly correlated, the rms decreases during the state transition and is very low (sometimes consistent with zero) in the soft state [25].
Shortly before or just after the transition to the soft state, a few sources enter the so called ultra-luminous state (ULS; e.g. [156], top of the HID). GRO J1655-40 is the BH XRB that showed the clearest example of a ULS in the RXTE era. Other sources have shown short excursions to this state, among these GX 339-4, XTE J1550-564, H1743-322, 4U 1630-47 (see e.g. [46]) and GRS 1915+105 [163]. The ULS exhibits fairly low variability amplitude (around 5-10%), but large colour variations. Compared to the standard intermediate states, it extends to much higher luminosities, reaching and in some cases exceeding the Eddington luminosity [230]. After the soft state is reached, the luminosity slowly decreases (in weeks to months) to a few percent of LEdd until a backward transition occurs, taking a source once more through the intermediate states and then to the hard state. After this second hard state, the outburst phase normally comes to an end, even though it is not unusual to witness a temporary re-brightening, which takes the sources up in the hard state for a time (typically a few weeks to a few months), and finally back to quiescence [39, 15, 40]. Outburst phases in BH XRBs are characterized by hysteresis, i.e. the hard to soft transition always occurs at higher luminosity than the soft to hard transition [149, 131]. This cyclic pattern translates into hysteresis loops in the HID that are always observed to develop in an anti-clockwise manner. Similar loops are seen in an rms-intensity diagram [164], as expected from the known correlation between rms and hardness.
2.2 Low frequency QPOs
As we alluded to in the Introduction, LF QPOs in BH XRBs have traditionally been classified into three types: A, B and C. Fig 2 (top right) shows where in the hysteresis loop on the HID each type of QPO is observed. We see that Type-C QPOs are first observed in the hard state, whereas Type-B and Type-A QPOs are only seen during the transition to the soft state. Below, we discuss these three QPO classes in the order they appear in an outburst.
2.2.1 Type-C QPOs
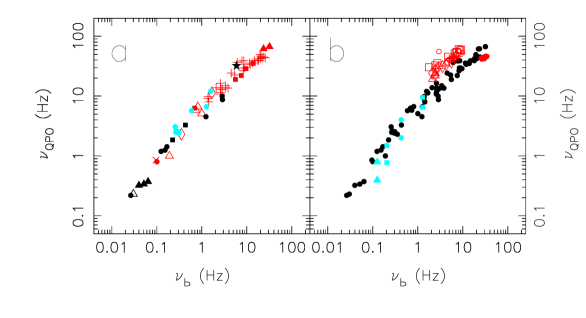
Type-C QPOs (Fig. 1 bottom) are by far the most common type of QPO in BH systems. Type-C QPOs can be detected essentially in all accretion states (Fig. 2, top right), even though they are particularly prominent in the hard-intermediate state and at the bright end of the low-hard state. The centroid frequency is tightly correlated with spectral state, rising from a few mHz in the hard state at low luminosities to Hz in the intermediate states. They are also occasionally observed in the soft state and the ULS (see, e.g., [156]), where they can reach 30 Hz. Type-C QPOs are characterised by a high-amplitude (up to 20% rms), narrow () peak in the power spectrum, coincident with ‘flat-top’ noise characterised by a low and high frequency break. A number of harmonics are generally detected, of which the one with the highest rms amplitude is usually (but not exclusively) identified with the fundamental. A second harmonic and sometimes even higher-order harmonics are often seen in addition to the fundamental, as well as a so-called sub-harmonic peak (centered at half the fundamental frequency). As shown in Fig. 3, the Type-C QPO frequency correlates with the low frequency break in the power spectrum [253]. The QPO frequency also correlates tightly with spectral parameters such as the photon index [248] and modelling the flat-top noise as a sum of broad Lorentzians reveals that it correlates with the characteristic frequency of all these broad components [183]. Type-C QPOs have also been observed at optical (e.g. [154, 85, 63]), ultraviolet [82] and infrared [103] wavelengths. Simultaneous multi-wavelength observations have revealed that the UV/optical/IR QPO centroid frequency is sometimes coincident (within errors) with the X-ray QPO fundamental frequency [82, 47, 63] and sometimes (again, within errors) with half of the X-ray fundamental frequency [154, 103]. Due to the quality and quantity of Type-C QPO observations, we will concentrate on these features more than any other throughout this review.
2.2.2 Type-B QPOs
Type-B QPOs (see Fig. 1) have been detected in a large number of BH XRBs and they appear during the SIMS (Fig. 2, top right). In fact, the SIMS is defined by the presence of a Type-B QPO [28]. They are characterised by a relatively high amplitude (up to 5% rms) and narrow () peak, with a centroid frequency at 5-6 Hz (but see [157], where type-B QPOs were found at 1-3 Hz). Type-B QPOs generally appear in the power spectrum coincident with weak red noise (few percent rms or less) that increases in amplitude at low frequencies (0.1 Hz). A weak second harmonic is often present, sometimes together with a sub-harmonic peak. In a few cases, the sub-harmonic and fundamental have comparable amplitude, resulting in a cathedral-like QPO shape [35]. Rapid transitions in which Type-B QPOs appear and disappear on very short time scales are sometimes observed in some sources (e.g. [168] and [35] for the cases of GX 339-4 and XTE J1859+226). These transitions are difficult to resolve at present, as they take place on a timescale shorter than a few seconds. Type-B QPOs occur at a similar time to discrete jet ejections evidenced by transient radio flares [52] and transient jets resolved in high angular resolution radio images [41]. This property led to speculation that they are causally connected with the jet ejection, perhaps indicating that the inner regions of the accretion flow are ejected during the Type-C to Type-B transition. However, Fender et al. [53] showed that the association is not so clean, with the Type-B QPO sometimes occurring slightly before and sometimes slightly after the inferred ejection.
2.2.3 Type-A QPOs
Type-A QPOs (see Fig. 1) are the least common type of LF QPO in BH XRBs. The entire RXTE archive only contains significant Type-A QPO detections. Figure 2 (top right) shows that Type-A QPOs normally appear in the soft state, just after the hard to soft transition has taken place. They appear as a weak (few percent rms) and broad () peak with centroid frequency of approximately Hz. Neither a sub-harmonic nor a second harmonic are usually detected, possibly because of the broadness of the fundamental peak, or because of the intrinsic low-amplitude of this type of QPO. Type-A QPOs are associated with a very low amplitude red noise. Originally, these LF QPOs were dubbed Type A-II [79]. LF QPOs dubbed Type A-I [252] were strong, broad and appeared together with a very low-amplitude red noise, and a ‘shoulder’ on the right-hand side of this QPO was clearly visible and interpreted as a very broadened second harmonic peak. Casella et al. [36] showed that these Type A-I LF QPOs should instead be classified as Type-B QPOs. Since Type-A QPOs are very weak, rare features, we hereafter will not discuss them in much detail.
2.3 High-frequency QPOs
HF QPOs are rare features in BH systems, with all detections to date being made by RXTE. The first reported detection, in 1997, was from GRS 1915+105 at Hz [152]. Since then, sixteen years of RXTE observations have yielded only a handful of detections in other sources (XTE J1550-564, GRO J1655-40, XTE J1859+226, H 1743-322 , GX 339-4, XTE J1752-223, 4U 1630-47, IGR J17091-3624), but all at a few hundred Hz, i.e., at significantly higher frequencies than the Hz QPO from GRS 1915+105. It is worth noticing that some of these detections have been later proven to be not statistically significant, leaving only two source a few solid detections from two sources (XTE J1550-564, GRO J1655-40, see [29]). The Hz QPO has emerged as a somewhat special case, in that a QPO at similar frequency has only been seen from one other source (IGR J17091-3624 [4]), and there are many detections of this feature from GRS 1915+105 [26], including a number of cases found in the ASTROSAT data, where the 67Hz QPO varies significantly in frquency over short time scales [27]. The above contrasts sharply with the handful of statistically significant detections of Hz HF QPOs from other sources [29].
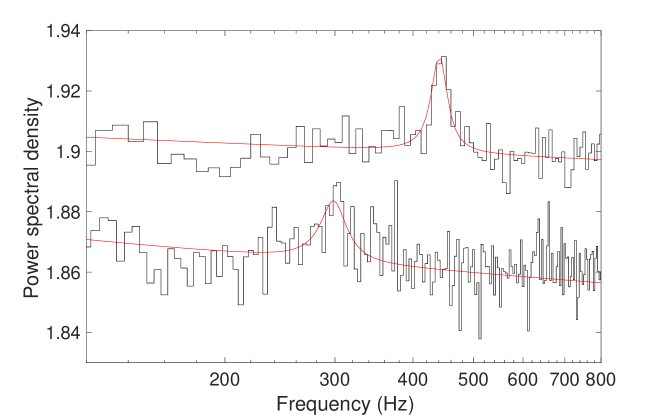
HF QPOs appear only in high flux observations, at a fairly specific hardness ratio [29]. Although this may be a selection effect given that the noise level decreases with count rate, there are many high flux observations without HF QPO detections, which suggests that a high count rate is not the only parameter required for the detection of an HF QPO. HF QPOs can be observed as single or double peaks (in which case they are called the lower and upper HF QPOs). Only one source, GRO J1655-40 (see Fig. 4), showed two clear simultaneous peaks [212, 158], which however appear in two different energy bands (the lower peak is visible at low energies, i.e. keV, the higher peak at higher energies, i.e. keV), while all the other systems only showed single peaks, which appear to move in frequency with time [30]. A claim of two simultaneous HF QPOs from XTE J1550-564 (with the lower one at a significance level [193]) was later shown to be an effect of averaging a large number of observations [139]. H1743-322 also showed a significant HF QPO, and a weak tentative simultaneous peak that may correspond to a second HF QPO [78].
The fractional rms of a typical HF QPO is in the full RXTE band, increasing steeply with energy [29]. This energy dependence explains why RXTE was best suited for detecting HF QPOs, having a high effective area above keV. In the case of GRS 1915+105, the HF QPO rms amplitude can reach 20% in the 20-40 keV energy band [152]. The typical quality factor is and for the lower and upper HF QPO, respectively. For the Hz QPO, typically, but covers a range . In both GRO J1655-40 and H1743-322, the frequencies of the simultaneous HF QPOs are close to being in a 3:2 ratio [212, 193, 191]. The same is true for the two peaks reported for XTE J1550-564, but as stated above, these peaks are very likely not real simultaneous HF QPOs. This motivated a family of models suggesting that these HF QPOs result from some kind of resonance [1]. However, since HF QPOs are very rare and only detected in a specific state, this frequency ratio could well be a coincidence.
2.4 Neutron star systems
NS XRBs show states similar to those seen in BH systems except the phenomenology is somewhat more complex, presumably due to the solid surface and anchored magnetic field [237]. State classification historically used a colour-colour diagram (CCD) [72] instead of an HID [237], with sources being classified as either Atoll or Z sources, based on the shape of the pattern traced by these systems in a CCD. Both Atoll and Z-sources show three main states that roughly correspond to the hard, intermediate and soft state seen in BH systems. In Atoll sources, the states are traditionally referred to as the island, lower banana and upper banana branches, whereas in Z-sources they are referred to as the horizontal, normal and flaring branches. A few sources (e.g. XTE J1701-462 [119]), have shown full evolution between Z and Atoll like spectra. This clarified that the main difference between these two classes of sources is their average accretion rate, significantly higher in Z-sources than in Atoll sources. Recently, Muñoz-Darias et al. [163] and Motta et al. [162] showed that the spectral, timing and multi-wavelength properties of BH and NS systems are remarkably similar (see Fig 2, bottom). These authors demonstrated that NS and BH systems cross three main accretion states that can be determined purely by the fractional variability amplitude: hard state (rms), intermediate states () and soft state (rms). The type of evolution of a NS or BH across states and transitions appears to be mostly determined by the average accretion rate on the compact object, rather than by the nature of the compact object itself. Below 50% LEdd (typical of Atoll sources and the majority of BH low-mass XRBs) hysteresis is the natural form that state transitions take. Above 50% LEdd (typical of Z-sources and highly-accreting BHs, such as GRS 1915+105) hysteresis does not take place, and instead fast transitions from and to the soft state occur at a roughly constant luminosity. Transient flaring behaviour is also observed in such sources, but the variability level is typically quite low [163]. The main difference that remains between BH and NS low mass XRBs resides in the transition velocity between states: the fastest transitions are seen in Z-sources and the slowest in BH systems, and Atoll sources sit somewhere between the two.
Classification of LF QPOs in NS systems is more difficult than for BH systems due to the somewhat richer phenomenology, but three main types of LF QPOs have been identified for Z-sources [237]: horizontal branch oscillations (HBOs), normal branch oscillations (NBOs) and flaring branch oscillations (FBOs). These are thought to correspond respectively to Type -C, -B and -A QPOs in BH systems (see Fig 1, right panels) [36, 162], partly because they occur when the source showing them is in the same region of the HID (see Fig 2, bottom right), and partly because HBOs follow the same correlation between QPO frequency and break frequency as BHs (see Fig 3). Motta et al. [162] recently showed that the same classification can also be applied to Atoll systems, which however do not appear to show NBO-like QPOs.
QPOs are also seen at high frequencies in NSs, where they are traditionally called kHz QPOs instead of HF QPOs. The first two sources in which kHz QPO were detected were 4U 1728–34 and Sco X-1. Peaks at 700 Hz and 1100 Hz, apparently not directly connected with the NS spin period, were detected in the power spectrum of these two systems [239, 216]. Since then, many kHz QPO detections have been made. These features are notable for having a much larger amplitude and quality factor than HF QPOs, explaining why they are observed so much more commonly.
2.5 mHz QPOs
In 2001, Revnivtsev et al. [194] reported the discovery of a new class of low frequency quasi-periodic variations of the X-ray flux in three NS X-ray binaries (4U1608-52, 4U1636-536 and Aql X-1), which were later observed in more systems, [215, 227, 213, 136]. These QPOs are typically referred to as to mHz QPOs, named after the frequency range at which they appear. They exhibit properties that differ from other QPO types, in that they occur only in a narrow range of X-ray luminosity, their fractional rms amplitude decreases with energy and they disappear at the onset of thermonuclear (type I) X-ray bursts [194]. Based on their observed properties, these QPOs are generally interpreted as a the result of a special regime of the nuclear burning on the NS surface, which generates a quasi-periodic flaring in the emission from the surface.
Altamirano and Strohmayer [7] reported on the discovery of mHz QPOs in the a BH candidate H1743-322. Clearly, surface-bound processes should be excluded in this source (unless it turns out to harbour a NS instead of a BH). The authors suggested that these QPOs are not analogues of the NS mHz QPOs, but may instead be the BH equivalent of the so-called 1-Hz QPOs seen in dipping NS systems [102, 77] (except with a much lower centroid frequency). This particular class of QPOs has only been reported for H 1743-322, but we note that most RXTE observations are fairly short and, moreover, are typically analysed by averaging the power spectrum over many even shorter (s) segments. It is therefore entirely possible that many mHz QPOs are still to be found in the RXTE archive. Indeed, QPOs with frequency below the range typically associated with LF QPOs have been reported for Cygnus X-1 [189] and V404 Cyg [81].
2.6 Other objects
2.6.1 AGN
QPOs are extremely common features in accreting BH X-ray binaries and, based on the scale-invariance of the accretion process, one may expect that QPOs should be detected around the accreting super-massive () BHs powering active galactic nuclei (AGN). All timescales are expected to scale with BH mass, and so any AGN QPOs are expected to be at frequencies orders of magnitude lower than their X-ray binary counterparts. This makes them very difficult to detect with the comparatively short and irregularly spaced observations currently available. In particular, Vaughan and Uttley [245] showed that strong Type-C QPOs typical of BH X-ray binaries with their frequencies scaled to AGN BH masses would not be detectable with existing AGN monitoring campaigns. It is therefore not surprising that there have been very few convincing detections of AGN QPOs to date.
A number of early claims of AGN QPO detections were later disfavoured. Most commonly, the QPO is originally claimed to be highly statistically significant, then a later re-analysis demonstrates that the inferred significance reduces dramatically when the broad band noise is (correctly) modelled as red noise instead of white noise (e.g. see discussion in [31]). Or in the case of the Seyfert galaxy NGC 6814, a strong ks periodicity reported by Mittaz and Branduardi-Raymont [146] was later shown to originate from another (probably Galactic) source 37 arcmin from the AGN core [135]. The first robust detection of a QPO in an AGN was a 1hr X-ray modulation from the Seyfert galaxy RE J1034+396 [67]. Alston et al. [2] later reported on another detection of this 1 hr QPO in RE J1034+396, and Alston et al. [3] dicovered a hr QPO in another AGN, MS 2254.9–3712. Both QPOs show a relatively high amplitude (5-6) and Q-factor ( 8), a soft lag at the QPO frequency and a relatively hard spectrum (they are both detected above 1 keV). These QPOs have been suggested to be the AGN equivalent of HF QPOs [142], but more detections are required before strong conclusions can be made.
2.6.2 Ultra-luminous X-ray sources (ULXs)
ULXs have inferred intrinsic X-ray luminosities well above the Eddington limit of a stellar-mass BH and are spatially resolved from the nucleus of their host galaxy. They were therefore long thought to be powered either by intermediate mass () BHs accreting at sub-Eddington rates, or stellar-mass BHs accreting at super-Eddington rates. mHz QPOs are often detected from ULXs (e.g. [165, 214]). It has been argued that these mHz QPOs are ULX analogues of Type-C QPOs, and thus that the QPO frequencies are 2 orders of magnitude lower because the BHs in ULXs are orders of magnitude heavier. Moreover, Pasham et al. [177] reported on the discovery of a pair of 3:2 frequency ratio QPOs in the ULX M82 X-1, which they argued are the ULX analogue of HF QPOs. From this association, they derived a BH mass of . However, the field was dramatically changed by the discovery of pulsations from the ULX M82 X-2 [14]. A number of subsequent detections of pulsations from other ULXs [61, 99, 100] have confirmed that at least a fraction of ULXs are powered by super-Eddington accreting NSs and have cast doubt on the simple QPO mass scaling arguments for the intermediate mass BH hypothesis – particularly since M82 X-2 itself appears to exhibit an mHz QPO in its power-spectrum that was previously suggested to be a Type-C QPO analogue [33]. It therefore seems more likely either that these mHz QPOs are simply analogues of the mHz QPOs observed in Galactic XRBs, or are entirely another class of QPO, perhaps associated with super-Eddington accretion rates. As is the case for AGN QPOs, a larger number of detections is needed to allow any further progress to be made in interpreting ULX QPOs.
3 What makes QPOs quasi-periodic?
We now delve into the detailed observational properties of LF QPOs in BH XRBs, asking the question: what makes them quasi-periodic as opposed to purely periodic?.
3.1 Frequency and amplitude modulation
First, let us discuss the effects that may make an oscillation quasi-periodic instead of periodic. As a starting point, we can represent a QPO as a sum of two harmonic components:
| (2) |
Here, and are the amplitudes of the two harmonic components and the QPO phase is
| (3) |
where is the QPO phase at , is the centroid frequency of the fundamental and is the phase difference between the harmonics. For the simplest case whereby the frequency, phase difference and amplitudes are constant, we would have a purely periodic function, whose power spectrum would be a sum of -functions (i.e. a pulsation). This case is demonstrated by the black lines in Fig 5, with the time series on the top left (, ) and the corresponding power spectrum on the right.
Now let us explore the effect of frequency modulation by allowing the QPO frequency to change with time. In order to generate a time series for with the desired properties, we first model its power spectrum (using fractional rms normalisation) as a Lorentzian function (Equation 1). We use (i.e. a zero-centered Lorentzian), and Hz. We then use the algorithm of Timmer and Koenig [224] to generate a maximally stochastic time series from this input power spectrum. Essentially, the Fourier components of this time series have amplitudes corresponding to the target power spectrum and completely random phases (see e.g. [97] for an expanded discussion). The time series shown in the second panel from the top in Fig 5 (left) is calculated using this variable QPO frequency, with the amplitudes of both harmonics held constant (i.e. pure frequency modulation). The corresponding power spectrum is plotted on the right (red). We see that the harmonic peaks now have a finite width, and that both harmonics have the same fractional width (i.e. they have the same , and therefore appear to have the same width on a logarithmic scale). This happens because the centroid frequency of the first and second harmonic at time is respectively and , and therefore the range of frequencies covered by the second harmonic is always twice that of the first.
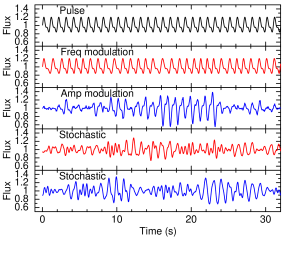
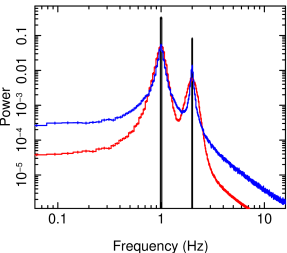
We can instead explore the effect of amplitude modulation by holding the QPO frequency constant and allowing the harmonic amplitudes to vary. We use a Timmer and Koenig simulation to generate a time series for from a zero-centered Lorentzian power spectrum with and Hz, and set . The resulting QPO time series is in the middle panel of Fig 5 (left), and the corresponding power spectrum is on the right (blue). This pure amplitude modulation gives the harmonic peaks the same absolute width as each other, which happens because each harmonic component is multiplied by essentially the same stochastic time series.
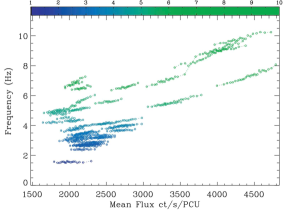
Insight into the dominant de-cohering mechanism can therefore, in principle, be gained by modelling observed power spectra with a multi-Lorentzian model. If the harmonics have the same width, , we can conclude that amplitude modulation is the most important effect, and if they have the same quality factor, we can instead conclude that frequency modulation is the most important effect. A number of studies have shown that Type-C QPOs are consistent with the latter [187, 190, 178], even when higher harmonics than the second are detected. A complication is the sub-harmonic, which often has a lower quality factor. This could be explained by additional amplitude modulation. Heil et al. [74] investigated frequency modulation of the Type-C QPO in XTE J1550-564 by splitting the light curve into s segments and stacking the power spectra of those segments based on count rate (flux binning). They found that the QPO frequency correlates with count rate (see Fig 6, left), and that the higher the mean QPO frequency, the steeper the gradient of this correlation. Nespoli et al. [168] had earlier found similar results for the Type-B QPO in GX 339-4.
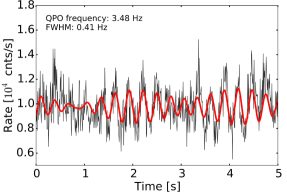
However, the power spectrum includes only the amplitudes of the Fourier components, and discards the phases. Therefore much of the information in the time series is not represented by the power spectrum. To demonstrate this, we take the two power spectra shown in Fig 5 (right) and generate time series with these power spectra using the Timmer and Koenig algorithm. The resulting time series are shown in the bottom two panels of Fig 5 (left). We see that the red ‘stochastic’ time series (second from bottom) is dramatically different from the red ‘frequency modulation’ time series (second from top), yet they have identical power spectra to one another. Likewise, the blue ‘stochastic’ time series is very different to the blue ‘amplitude modulation’ time series (middle), eventhough the two have the same power spectrum. This demonstrates that the relative widths of the QPO harmonics in the power spectrum do not uniquely determine the mechanism that makes the QPO quasi-periodic. For this information, we must use statistics more sophisticated that the power spectrum that preserve phase. Fig 6 (right) shows a result from van den Eijnden et al. [232], who applied an optimal (Weiner) filter (see e.g [179]) to X-ray light curves from GRS 1915+105 in an attempt to isolate the Type-C QPO from the associated broad band noise. The black line is the raw data, and the red line is the filtered data. We see both frequency and amplitude modulation. In particular, we see what were termed coherent intervals whereby the QPO signal remains coherent for cycles, then loses coherence before the next coherent interval begins (there are coherent intervals in the plot). The amplitude reaches a minimum between coherent intervals and a maximum in the middle of the intervals. Interestingly, van den Eijnden et al. [232] used the same filtering technique to study observations in which the QPO frequency depends on energy band to find that during each coherent interval, the QPO phase of the energy band with higher frequency accelerates ahead of the slower band, only for the phases to reset at the start of the next coherent interval. Evidence of these coherent intervals can also be found using wavelet transforms [115] or the Hilbert-Huang transform [217].
3.2 QPO waveform
If we wish to measure the waveform of the QPO – the count rate as a function of QPO phase (what pulsar astronomers would call the ‘pulse profile’) – we require more information than can be determined from the power spectrum alone. In fact, from the power spectrum alone, we do not know if a well defined QPO waveform even exists. The QPO could instead be purely stochastic noise with the variability amplitude peaking at harmonically related frequencies – as is the case for the Timmer and Koenig simulations plotted in the bottom two panels of Fig 5 (left). The difference between these maximally stochastic time series and the other quasi-periodic time series plotted in Fig 5 (left), that do have well defined waveforms, is that the phases of the QPO harmonic components are correlated with one another in the latter case and not in the former case. We can think of this in terms of the phase difference between harmonics, (see equation 2). varying randomly with a uniform distribution results in a maximally stochastic time series whereas varying around a well-defined mean value instead leads to the harmonic components being correlated – in which case it makes sense to try to constrain a QPO waveform.
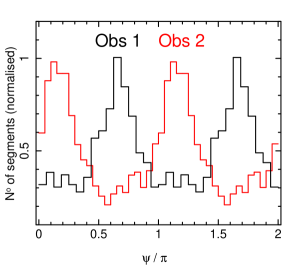
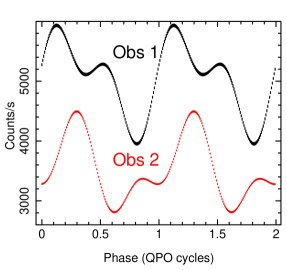
Ingram and van der Klis [94] investigated variations of this phase difference between harmonics for two RXTE observations of Type-C QPOs in GRS 1915+105. They split the X-ray light curves up into short segments (with each segment containing QPO cycles) and for each segment calculated from the Fourier transform of the light curve. Fig 7 (left) shows histograms of these many measurements of for the two observations, which have QPO fundamental frequencies of Hz (obs 1, black) and Hz (obs 2, red). We see that these histograms each have a very clear peak, meaning that does indeed vary around a well-defined mean value. The mean value of for each observation can be measured by determining the peak of the corresponding histogram, and an ‘average’ QPO waveform can be reconstructed from combining this with measurements of the harmonic amplitudes (which can be determined from the power spectrum). Fig 7 (right) shows the waveforms re-constructed for the same two observations of GRS 1915+105. QPO waveforms can alternatively be constrained using phase-folding algorithms. Tomsick and Kaaret [226] filtered RXTE light curves of GRS 1915+105 in order to isolate the QPO from the broadband noise (similar to our Fig 6, right). They then defined peaks in the filtered light curve as zero points of QPO phase in order to phase fold. That their results are similar to those of Ingram and van der Klis [94] provides confidence in the reconstruction technique. It also, in hindsight, tells us that we already knew in 2001 that the phase difference between harmonics varies around a well-defined mean. This is because the Tomsick and Kaaret [226] algorithm tracks the phase of the QPO fundamental, which would be uncorrelated with the phase of the second harmonic if followed a uniform distribution. This would have resulted in the Tomsick and Kaaret [226] waveforms all being purely sinusoidal due to the second harmonic component cancelling completely in the phase-folded waveforms. Therefore, the very fact that the Tomsick and Kaaret [226] waveforms have harmonic content shows that is not uniformly random. If were constant, then the amplitude of the second harmonic in the phase-folded waveform would be the same as that in the Fourier reconstructed waveform. Instead, varies around a mean value, meaning that the phase-folding method always predicts smaller second harmonic amplitudes than the reconstruction method due to destructive interference. Furthermore, any error in assigning instantaneous QPO phase leads to a reduction of the overall amplitude of the phase-folded waveform for exactly the same reason. This provides a good test of any phase-folding algorithm: if the QPO waveform ends up with a very small amplitude, as would be the case if one simply folded on a constant QPO period, one can conclude that the algorithm has not worked, and that the results have little meaning.
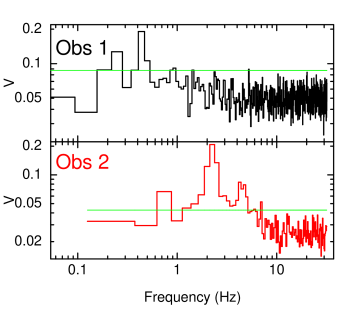
Ingram and van der Klis [94] further investigated the GRS 1915+105 data by measuring the phase difference between the Fourier components at each frequency and at . For each frequency pair, they calculated Kuiper’s statistic, , to determine whether or not the distribution of is consistent with a uniform distribution (high means the distribution is not consistent with uniform). Fig 8 shows Kuiper’s statistic plotted against for the two GRS 1915+105 observations featured in the previous figure. Values of above the green line correspond to a non-uniform distribution with confidence. The peaks at the QPO fundamental frequency ( Hz and Hz for obs 1 and 2 respectively) indicate coupling between the first and second harmonics, and the peaks at twice and thrice the QPO fundamental in the bottom plot indicate respectively coupling between the second and fourth harmonics and the third and sixth harmonics! The peak at half the QPO frequency for observation 1 indicates coupling between the sub-harmonic and the fundamental, and the peak at a third of the QPO frequency in observation 2 turns out to indicate coupling between the QPO and the broadband noise (see the following section). The other feature of note in Fig 5 is the difference between the QPO and the broadband noise: there is no evidence of strong phase coupling between pairs of frequencies both dominated by the broadband noise (although we will see in the next sub-section that there are some weak correlations).
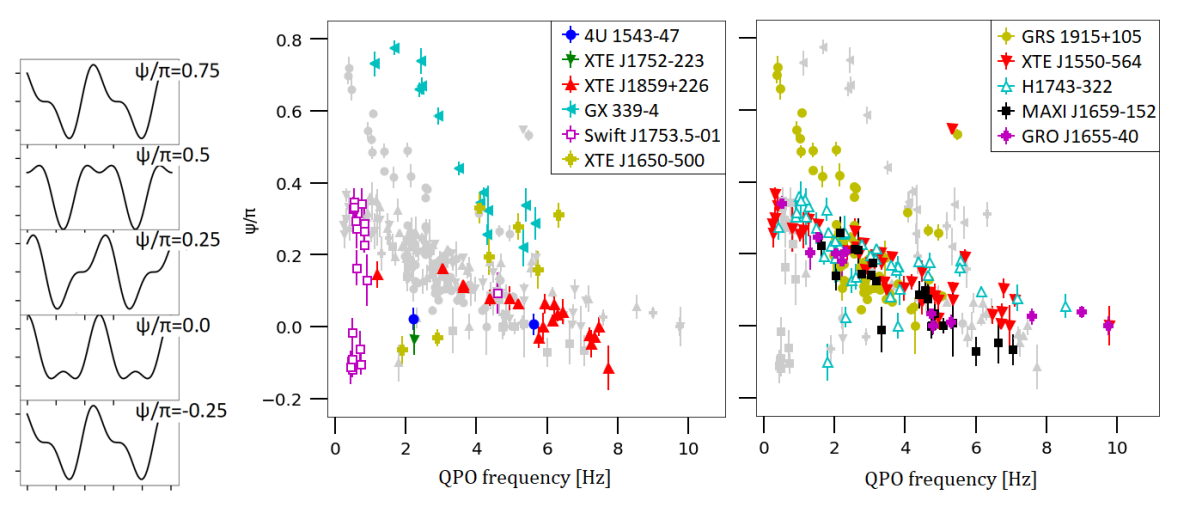
Recently, de Ruiter et al. [43] measured for many observations of QPOs in the RXTE archive. They found that is always measured to vary around a well defined mean whenever the data are good enough to do so. Fig 9 shows their measurements of plotted against QPO frequency for many observations of Type-C QPOs, with the coloured points in the left and right panels corresponding respectively to low (i.e. the binary system is viewed more face-on) and high (i.e. the binary system is viewed more edge-on) inclination sources. We see that generally reduces from to as the QPO frequency evolves from to Hz, with seemingly less scatter for the high inclination sources. This confirms the hints from Fig 7 that the waveform evolves systematically with QPO frequency (see the example waveforms for different values of to the left of Fig 9). de Ruiter et al. [43] also found that Type-B QPOs have well defined waveforms, and that the measured value evolves with QPO frequency in a manner that differs from the Type-C case (see their Fig 6). This implies that these two QPO types have a genuinely different origin, with the difference between the two being more than simply the associated broadband noise.
3.3 The bi-spectrum: coupling of the QPO and broadband noise
Further insight can be gained from the bi-spectrum, which is defined as
| (4) |
where is the frequency of the Fourier transform of the X-ray light curve [110, 133], and the averaging indicated by the angle brackets is over different light curve segments. Essentially, the bi-spectrum describes the correlations between the phases of Fourier components at three frequencies: , and , and is only defined for less than the Nyquist frequency (and only non-trivially defined for ). The bi-spectrum informs on how well correlated the square of a time series is with the time series itself. Defining , it can be shown using the convolution theorem that
| (5) |
where is the number of time intervals in a light curve segment. Therefore a time series with zero bi-spectrum – as is generated by the Timmer and Koenig [224] algorithm – is uncorrelated with its own square. It is possible to simulate a time series with a specified bi-spectrum using the algorithm of Vanhoff and Elgar [242], which was developed for the application of modelling waves in shallow water.
It is convenient to define the squared bi-coherence
| (6) |
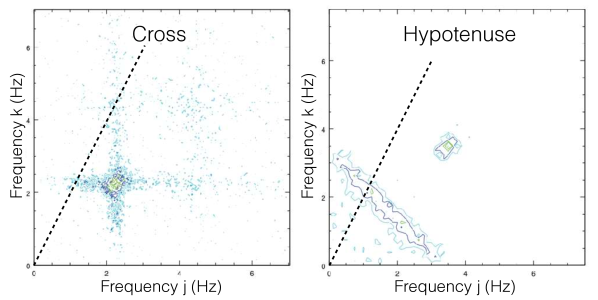
which can take values between and [110]. Fig 10 shows some contour plots of the bi-coherence of GRS 1915+105, reproduced from Maccarone et al. [133]. They identified characteristic patterns displayed by Type-C QPOs in the source: the ‘cross’ pattern (left), the ‘hypotenuse’ pattern (right), and the ‘web’ pattern, which is a combination of the other two. The pattern exhibited by the source was found to correlate with the radio brightness and the QPO frequency. Recently, Arur and Maccarone [10] conducted a systematic analysis of GX 339-4 to find that the bi-spectrum transitions smoothly from the web to the hypotenuse pattern as the Type-C QPO frequency increases (no observations displayed the cross pattern for GX 339-4). Type-B QPOs only have bi-coherence peaks at , and Type-A QPOs have low bi-coherence. The peaks at combinations of QPO harmonics indicate phase coupling between QPO harmonics, whereas the diagonal line of raised bi-coherence in the hypotenuse pattern indicates coupling between the QPO and the broadband noise. The broadband noise itself has a non-zero bi-coherence, albeit more than an order of magnitude lower than that of the QPO [231]. This is expected, since the broadband noise is not Gaussian distributed, but log-normal distributed, which naturally arises from propagation of fluctuations in mass accretion rate [231].
The dashed line along enables us to compare these bi-coherence plots with the Kuiper’s statistic plot in Fig 8 if we read the frequency in Fig 8 as . This is because high bi-coherence roughly corresponds to large . We see that the cross pattern along the dashed line consists of peaks at and as is seen for observation 1 in Fig 8, whereas the hypotenuse pattern along this line instead consists of a peak at . Since observation 2 in Fig 8 includes such a peak at in addition to peaks at each QPO harmonic frequency, we can conclude that observation 2 from Ingram and van der Klis [94] corresponds to a web pattern, and observation 1 to a cross pattern. From this comparison, we can make two insights that were not appreciated by Ingram and van der Klis [94] at the time: i) the peak at half the QPO frequency for observation 1 corresponds to the line in the cross pattern of the bi-coherence, and ii) the peak at a third of the QPO frequency in observation 2 indicates phase coupling between the QPO and the broadband noise. It is still rather unclear quite what this non-linear interaction between the QPO and broadband noise is, but some simple models are explored and discussed in [133] and [10]. The phase difference between harmonics, , can also be related to the bi-spectrum, through the bi-phase [132]. Indeed, Arur and Maccarone [10] recently showd that the bi-spectrum can be used to reconstruct the QPO waveform.
4 Lense-Thirring precession and disc theory
Before exploring specific models for LF QPOs in the following section, we will first lay some important theoretical foundations. Many of the models in the literature consider the relativistic effect of Lense-Thirring precession, and so we take some time to introduce the concept in this section. As we will see, Lense-Thirring precession can greatly affect the dynamics of accretion discs that are initially misaligned with the equatorial plane of a spinning BH. Here, we briefly summarise the analytic theory for such tilted discs and compare with the results of recent numerical simulations. Hereafter, we will employ the convention whereby lower case is radius expressed in units of a gravitational radius , such that (where , and are respectively BH mass, Newton’s gravitational constant and the speed of light in a vacuum).
4.1 Test mass frequencies
For a test mass orbiting a spinning BH in a nearly circular orbit slightly perturbed from the BH equatorial plane, the orbital, radial and vertical epicyclic angular frequencies in the Kerr metric are [20, 140]
| (7) |
where is the dimensionless spin parameter, is the angular momentum of the hole and top and bottom signs represent pro- and retro-grade spin respectively. The corresponding frequencies in units of cycles per unit time are . In Newtonian gravity, all three of these frequencies are always equal, meaning that orbits always close. In the Kerr metric, however, the inequality between the orbital and radial epicyclic frequencies leads to periastron precession. This is a rotation of the semi-major axis of an orbit with angular frequency . At the time of Einstein proposing GR, periastron precession had already been observed, and had remained unexplained for more than 50 years, in Mercury’s orbit around the Sun.
The inequality between the orbital and vertical epicyclic frequencies leads to Lense-Thirring precession. This is a nodal precession (i.e. a vertical wobble) of orbits misaligned with the BH equatorial plane, with angular frequency . It results from the frame dragging effect, which is the dragging of inertial frames about the BH spin axis. Lense-Thirring precession is named after the authors who first derived the effect, although the Lense and Thirring [116] expression for the frequency was derived in the weak field limit (), this being decades before the derivation of the Kerr metric [109]. Their expression
| (8) |
can be derived from equations 7 via a first order Taylor expansion. The hierarchy of the precession frequencies is .
4.2 The diffusive and wave-like regimes
If a disc is initially tilted with respect to the equatorial plane of a spinning BH, it will be warped by the differential nature of the Lense-Thirring precession frequency. The response of the disc to this turns out to depend on whether the Shakura and Sunyaev [201] dimensionless viscosity parameter is greater than or less than the disc scale height . For , the warp is communicated by viscosity (the diffusive regime) and for , the warp is instead communicated by pressure waves (the wave-like regime). Here we will take some time to understand what these two regimes are and where this comparison between and comes from. We can start by splitting the disc into rings and representing the angular momentum per unit surface area of a ring as the vector
| (9) |
Here, is the surface density (the mass density integrated over the disc height), the z-axis aligns with the BH spin axis, is the (polar) tilt angle and is the (azimuthal) twist angle. We take a hat to denote a unit vector throughout. We see that a disc is respectively misaligned, warped and twisted if , and . Warps are communicated via the internal torque, , where is the shear force acting at the boundary between the rings (see equations 1-4 in [170]) caused by the rings moving past one another in the locally azimuthal direction due to differential rotation and in the locally vertical direction due to differential nodal precession.
In the diffusive regime, mass is assumed to pass between rings only via the boundaries between them. Pringle [180] showed that mass conservation gives
| (10) |
which turns out to be the same as for a planar disc [60], and angular momentum conservation gives
| (11) |
where is radial velocity and the final term of equation 11 describes the warp forced by differential Lense-Thirring precession. These equations can be solved by defining kinematic viscosity in the azimuthal and vertical directions, and . Using the prescription of Shakura and Sunyaev [201], we can set , where is the sound speed. Papaloizou and Pringle [175] and Ogilvie [172] found that , and so the internal torque in each direction can be calculated for a given value of (see e.g. equations 21-23 in [169]). Solving equations 10 and 11 then indicates that tends to the initial tilt angle for large and to at small , with the two regimes connected by a smooth warp (also see [38, 18]). This result was first derived by Bardeen and Petterson [19], and therefore such a setup is often called the Bardeen-Patterson configuration. We note, however, that their equations did not conserve angular momentum, but the result still held up to subsequent, more sophisticated treatments [175, 180].
In the opposite, wave-like regime, the linearized equation for angular momentum conservation is essentially the same as the diffusive regime (equation 11), whereas the internal torque obeys [126, 127, 169]
| (12) |
We can understand that these two equations have wave-like solutions for , therefore explaining the name ‘wave-like regime’, by exploring the invicid (), Keplerian () limit. In this case, equations (11) and (12) can be combined to find
| (13) |
Making a final illustrative assumption that is independent of , we see that the above equation reduces to a classical wave equation with velocity . We therefore see that a warp in an invicid disc launches a pressure wave with speed . This is called a bending wave, since it describes the disc shape.
This can be understood physically as warps in the thick disc launching pressure waves (note that the final term in equation 12 is related to the vertically integrated pressure: [127]). Fig 11 illustrates that a misalignment between two rings lines up the high pressure mid-plane of one ring with the lower pressure atmosphere of its neighbour, creating a radial pressure gradient from the existing vertical pressure gradient. An orbiting gas parcel will therefore experience an oscillating pressure gradient, launching a pressure wave in the disc. The wavelength of the pressure wave in the invicid, Keplerian limit is approximately [127]
| (14) |
Since the bending wave wavelength is a fairly strong function of , the stable warp, is smooth far from the BH and oscillatory close to the BH. These oscillations at small are referred to in the literature as radial tilt oscillations [101, 127].
In a more realistic limit, the term in equation 12 introduces an exponential damping of the bending waves, on a characteristic timescale [182]. The waves therefore travel a typical distance (since for a disc in vertical hydrostatic equilibrium) before they are damped by viscosity. If , we can conclude that we are in the diffusive regime rather than a wave-like regime, since viscosity damps out the waves and governs the disc dynamics. Therefore, the diffusive regime is characterised by and the wave-like regime by .
4.3 Solid body precession
In the wave-like regime, solutions corresponding to solid-body precession are possible. That is, is still given by Equation (7), is independent of time and . We can calculate the angular frequency of solid body precession, , from the total angular momentum of the disc and the Lense-Thirring torque on the total disc , which are related as . Thus , where is the angle between and BH spin axis. The angular momentum and torque acting on a disc annulus are respectively and . For a disc that is not too strongly warped (), we can set and integrate over all disc radii to get
| (15) |
This equation holds for an arbitrary disc twist, as long as that twist is frozen in time. Using the weak field formula for (equation 8) and specifying then gives [124, 55, 90]
| (16) |
A more correct description can of course be obtained by using the more accurate formula for (equations 7) and integrating numerically (e.g. [87, 88, 188]), or using a polynomial approximation [42]. Further accuracy can be achieved if the radial profile of the tilt angle is known.
4.4 Numerical simulations
Qualitatively, the predictions of analytic theory have been reproduced by numerical simulations. Smoothed particle hydrodynamics (SPH) simulations consider many particles interacting in an effective potential, but still rely on an input viscosity prescription (i.e. values of and ). GR magneto-hydrodynamics (GRMHD) simulations instead solve the MHD equations on a grid given an initial configuration of mass and magnetic field density. The magneto-rotational instability [17], which forms due to the tangling of magnetic field lines by differential rotation, takes the place of a viscosity prescription. Such grid-based simulations therefore provide the best tests for analytic theory.
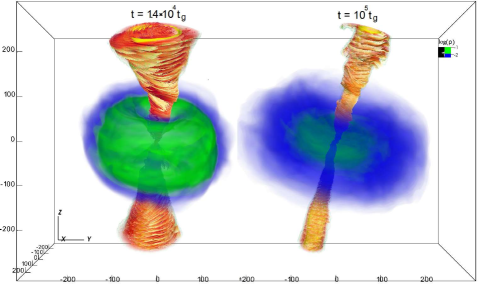
Thick discs () were the first to be explored globally in GRMHD, being the least computationally expensive due to the comparatively few total cells required to properly resolve their scale height. Fragile et al. [55] found that such a thick disc with an initial tilt angle of did indeed undergo solid-body precession as predicted by the analytic theory, at a precession frequency consistent with Equation (16). Recently Liska et al. [120] repeated this setup, but were able to achieve higher resolution, particularly around the poles of the grid. This enabled them to resolve jets, which they found to precess with the thick disc (see Fig 12).
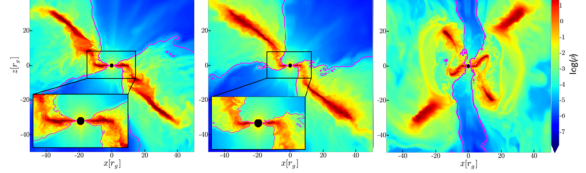
Thin discs () are rather harder to resolve in GRMHD, and so for a long time the Bardeen-Petterson configuration could only be studied in SPH (e.g. [167, 166]). Liska et al. [123] recently achieved the required resolution for the first time to find that an , disc around an BH forms a Bardeen-Petterson configuration with transition radius , which is smaller than expected from analytic theory (e.g. [112]). For very large and/or very small , the smooth transition of the Bardeen-Petterson configuration is predicted to become rather sharp (disc breaking [125]), or even separate into discrete, individually precessing rings (disc tearing [170]). Nixon et al. [170] estimated that the disc tears at radius
| (17) |
and demonstrated that breaking and tearing occur in SPH simulations. Liska et al. [122] recently confirmed that this also happens in GRMHD (see Fig 13).
5 Models for low frequency QPOs
Many models have been proposed for LF QPOs, ranging from well-developed theories that have been confronted with the data to ideas briefly discussed in one or a few papers. In this section, we describe in detail the models that feature prominently in the literature and also summarise some other models that have received less attention. A high fraction of the models assume a truncated disc / hot inner flow geometry, whereby the thin disc truncates at some radius larger than the ISCO and the accretion flow inside of this takes the form of a hot, large scale height accretion flow (see Fig 14c) that plays the role of the X-ray corona. Wherever this geometry is assumed we will refer to the inner radius of the flow as and the transition radius between disc and flow as . All of these models were proposed to explain Type-C QPOs, although we note that they could all equally be candidates to explain Type-B QPOs. We have attempted to make this review of models fairly comprehensive, but fear that the shear size of the literature likely prevents this from being a completely exhaustive summary.
5.1 The relativistic precession model
The relativistic precession model (RPM) [208, 209] is perhaps the simplest of all the models. The LF QPO fundamental frequency is simply assumed to be the Lense-Thirring precession frequency at some characteristic radius, perhaps the disc truncation radius. Moreover, the lower and upper HF QPOs are postulated to be associated respectively with periastron precession and orbital motion. The model was originally proposed to explain the LF QPOs and pair of kHz QPOs observed from NSs [208], but was soon after extended to BH QPOs [209]. These frequencies of geodesic motion may modulate the X-ray flux if there are extended bright clumps of material all located at the same radius of the accretion disc on slightly elliptical orbits (to ensure periastron precession) that are slightly titled with respect to the BH equatorial plane (to ensure Lense-Thirring precession). The flux would then be modulated through relativistic Doppler boosting [16]. It is plausible that such hot spots would form at the truncation radius, where turbulence is likely generated. As the truncation radius moves inwards and the spectrum consequently softens, all geodesic frequencies increase, reproducing the observed evolution of QPO frequency.
An extension to this model was proposed by Schnittman et al. [199], who considered a precessing ring. Another mechanism for modulating the flux with the Lense-Thirring precession and orbital frequencies was suggested by Psaltis and Norman [184]. This model considers a disc with some narrow transition radius (), perhaps coinciding with an abrupt change in disc properties (again, perhaps the truncation radius). A white noise of driving density perturbations are assumed to originate from outside the transition region, and the response of the disc in the transition region to these perturbations is calculated. The output power spectrum includes a zero-centered Lorentzian with HWHM (where is the viscous frequency [60]), and narrow peaks at the orbital and Lense-Thirring precession frequencies of the transition region. The latter peak describes a precessing, one-armed azimuthal density perturbation with a vertical tilt, similar to the precessing ring model of Schnittman et al. [199].
5.2 The precessing inner flow model
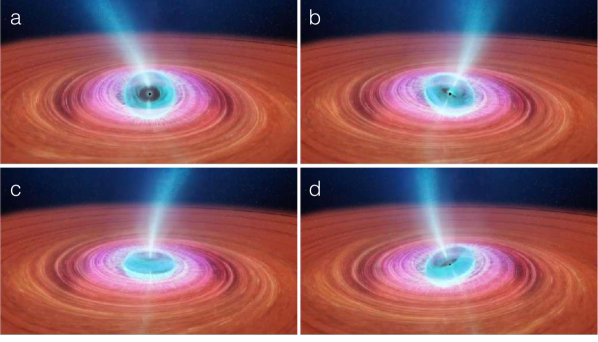
The model of Ingram et al. [90], which assumes a truncated disc / hot inner flow geometry, is illustrated in Fig 14. The BH spin axis is assumed to be moderately misaligned with the rotational axis of the binary system (). In the soft state, the thin disc is in a Bardeen-Petterson configuration, but in the hard state the disc is assumed to be truncated outside of the Bardeen-Petterson transition radius, meaning that the disc feeds misaligned material to the inner flow. This then causes the entire inner flow to precess, as is discussed in Section 4.3, as well as the base of the jet [120].
As illustrated in Fig 14, the flow precesses around the BH spin axis such that the misalignment angle between the flow and BH spin, , remains constant. Because the disc is stationary and misaligned with the spin axis by the same angle , the angle between the disc and flow rotation axes varies over each precession cycle between (panel c) and (panel a). Therefore viewers at different azimuths will see different things. For the reader, maximum misalignment in Fig 14 (panel a) occurs when the flow faces maximally towards us, but the flow would face maximally away from an observer positioned behind the page at maximum misalignment. The X-ray flux is then modulated by a combination of effects. The most obvious are Doppler boosting and projected area effects. Maximal Doppler boosting occurs when the flow is viewed most edge-on, since blue shifts from the approaching material dominate over red shifts from receding material. The projected area, on the other hand, is largest when the flow is viewed most face-on. The predicted flux as a function of precession phase is therefore a trade-off between these two considerations [247, 91]. It is also important to consider the angular dependence of Compton scattering, which is not isotropic for a non-spherical scattering medium such as the inner flow [218]. Finally, the intrinsic luminosity and temperature of the inner flow should vary with precession phase as the angle between disc and flow varies and consequently so too does the luminosity of disc photons irradiating the flow [256, 254].
Ingram et al. [90] showed that the spin dependence of the flow precession frequency is partially cancelled out by the expected spin dependence of the surface density profile, . Analytic theory and GRMHD simulations predict that is constant outside of the so-called bending wave radius but drops-off steeply inside of this in the region dominated by radial tilt oscillations [55, 54]. The bending wave radius can be estimated as the largest radius where the bending waves turn over, , giving (from Equation 14) . The increase of this radius with increasing spin can explain why different sources display similar (but not identical; e.g. [202]) evolution in QPO frequency [211, 59] without having to make the uncomfortably fine-tuned assumption that all BH XRBs have the same spin. The highest possible precession frequency, on the other hand, should depend on BH spin, since this is when the truncation radius is only just larger than the ISCO (and therefore smaller than ), and the highest observed QPO frequency does indeed vary from one object to the other [158, 93, 59].
The dependence of the precession frequency on the surface density profile also provides a natural explanation for the observed short term variations in QPO frequency (see Section 3.1) if the broad band noise is assumed to originate from propagating fluctuations of the mass accretion rate in the inner flow [129, 8, 87]. This is because a local increase in accretion rate will cause a local over-density in the surface density. Over-densities in the inner / outer regions of the flow will speed up / slow down precession, and increases in the accretion rate close to the hole will lead to greater increases in X-ray flux than those far from the hole due to the centrally peaked gravitational emissivity [87]. Therefore, the precession model predicts the short timescale correlations between QPO frequency and X-ray flux seen by Heil et al. [74] (see Fig 6, left).
This model makes a number of testable predictions, most notably regarding the reflection signature. First of all, the changing angle between disc and flow should result in the reflection fraction changing over the course of each precession cycle. Most characteristically, the inner flow will predominantly illuminate different disc azimuths as it goes through each precession cycle, meaning that the iron line should be blue shifted when the flow shines on the approaching disc material (panel d) and red shifted when the flow shines on the receding disc material (panel b) [199, 89]. Fragile et al. [57] extended this model to also attribute HF QPOs to the breathing mode and vertical epicyclic frequency of the inner flow. The model has also been considered as a basis to interpret multi-wavelength observations of QPOs. Kalamkar et al. [103] suggested that the IR QPO they detected from GX 339-4 is due to jet precession. Veledina et al. [247] modelled optical QPOs by considering optical photons produced in the inner precessing flow by the cyclo-synchrotron process, and Veledina and Poutanen [246] instead considered reprocessing of X-ray photons from a precessing inner flow into optical photons by the outer accretion disc.
5.3 Corrugation modes
Corrugation modes (c modes) are transverse standing waves in the disc height with some resonant angular frequency , that are trapped in a region between the disc inner radius and another radius called the inner vertical resonance (IVR) , and excited by perturbations in an intrinsic disc quantity such as density (e.g. [108, 249, 106]). Visualisations of such oscillations can be found in Fig 2 of Tsang and Butsky [228]. The study of c modes is part of the wider field of discoseismology, which encapsulates a number of different modes of oscillation (e.g. gravity modes, pressure modes). The c modes are the discoseismic mode with resonant frequencies in the region of the observed LF QPO frequencies (gravity modes and pressure modes oscillate at higher frequencies). The resonant frequency is
| (18) |
where and are integers,
| (19) |
and the constant depends on the sound speed in the disc (typical value ; [249]). We see from equation (18) that, in the case of , the resonant frequency is nothing other than the Lense-Thirring precession frequency at the IVR, , making this essentially yet another model that associates the LF QPO with Lense-Thirring precession. The resonant frequency is therefore set by the mass and spin of the hole, the sound speed and the disc inner radius. The model can therefore reproduce the observed changes in LF QPO frequency if the disc inner radius moves towards the hole as the QPO frequency is observed to increase (changes in QPO frequency can also be driven, to a lesser extent, by changes in the sound speed).
In order to understand the origin of the standing wave, let us explore the result of introducing a plane wave perturbation in the disc density with angular frequency . This causes a plane wave in the disc height with dispersion relation [229, 173]
| (20) |
where , and is the radial wave number. Waves can only propagate in regions of the disc for which the RHS of equation (20) is , thus in the regions where the following conditions are fulfilled
| (21) | |||||
| (22) |
The latter of these two expressions (equation 22) corresponds to the propagation region of c modes (the former corresponds to gravity modes), which extends from out to , defined as . It is therefore possible for a wave with angular frequency to propagate in the region to . If these two boundaries are reflective (see [229]), then a standing wave trapped in the region to will result only for eigen-frequencies, , that correspond to waves with an integer number of nodes in the region. Therefore, similarly to the Psaltis and Norman [184] model, a white noise of input perturbations will result in the excitation of resonant modes.
5.4 Accretion ejection instability
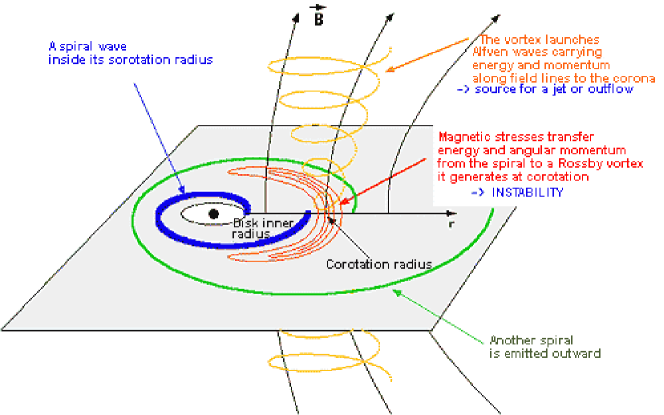
The Accretion Ejection Instability (AEI; [221]) is a spiral wave instability in the density and scale height of a thin disc threaded with a strong vertical (poloidal) magnetic field (strong as in gas and magnetic pressure are roughly equal). Fig 15 shows a schematic of the instability. The spiral structures each have an integer number of turns between the disc inner radius and the inner Lindblad resonance and rotate about the disc surface with angular eigen-frequency, . The spiral arms result from perturbations to the strength of the vertical magnetic field threading the disc.
A plane wave perturbation in field strength with angular frequency results in spiral waves in disc density with approximately the following dispersion relation
| (23) |
where is the unperturbed magnetic field strength (see [244] for a more accurate expression). This is identical to the dispersion relation of self-gravity driven spiral density waves in galaxies, except here magnetic terms act as negative self-gravity. The waves can only propagate in regions for which the RHS of equation (23) is , and are therefore damped between the inner and outer Lindblad resonances, defined as the two radii where . Waves from the inner disc propagate towards the co-rotation radius, where , which is located between the two Lindblad resonances. Outward propagating waves are reflected at the inner Lindblad radius, , to then propagate inwards to where they are again reflected. The eigen-frequencies are a set of frequencies for which the reflected outward propagating wave has the same phase as the original outward propagating wave (i.e. they correspond to spiral structures with an integer number of turns between and ). The fundamental eigen-frequency is therefore set by the mass and spin of the hole, disc parameters such as field strength and sound speed, and the inner disc radius. The observed changes in QPO frequency are again assumed to be caused by moving towards the hole, with increasing as reduces, except for when is very close to the ISCO, where the relation reverses [243].
These spiral standing waves can create a further instability at the co-rotation radius: a Rossby vortex. This is caused by an over-density forming at the co-rotation radius that spreads slightly in radius (red contours in Fig 15). Differential rotation of disc material means that this over-density is sheared, with the inner parts accelerating ahead of the outer parts to create a vortex at the co-rotation radius. This in turn twists the field lines threading the over-density to launch a vertical Alfven wave (yellow lines in the figure). If there is a low density corona above the disc, this Alfven wave can transfer energy and angular momentum from the accretion flow to the corona, contributing to the launching of a wind and/or jet (hence the name accretion ejection instability).
5.5 Propagating oscillatory shock
The propagating oscillatory shock model [151, 37] assumes a two component accretion flow (TCAF) consisting of an outer Keplerian disc that is sandwiched above and below by a sub-Kelperian corona, and an inner sub-Keplerian halo [225], often referred to as a CENBOL (centrifugal pressure supported boundary layer). In general, the disc/corona and halo components have different accretion rates, and are separated by a shock at radius that marks a sharp transition in density from the outer (pre-shock) corona to the inner (post-shock) halo. According to the propagating oscillatory shock model, the shock location oscillates around a mean value if the cooling timescale of the halo is comparable with the infall timescale [151] or if the Rankine-Hugoniot condition for a stable shock is not satisfied [197]. It is this oscillation that is proposed to produce the QPO in the X-ray flux. The oscillation frequency is inversely proportional to the infall time in the halo (e.g. [37])
| (24) |
where is the ratio of the post-shock halo density to pre-shock corona density (the compression ratio). Typical values of the compression ratio are [44], meaning that the QPO frequency is, within a factor of a few, assumed to be the Keplerian orbital frequency at the shock location. The evolution of the QPO frequency is then reproduced by the shock location moving in as the QPO frequency increases.
We see that this model requires to be very large for typical QPO frequencies measured in the hard and intermediate states. For Hz, typical values are [44], which is very hard to reconcile with the relativistically broadened iron line routinely observed in the X-ray spectrum. Although measurements of the disc inner radius using the iron line are subject to modelling and calibration uncertainties, the observed broad iron line profiles are simply not compatible with a disc truncated at hundreds of (e.g. [66, 95]), which would instead produce a narrow line. This very large disc inner radius also means that the accretion rate through the disc must be implausibly high in the intermediate state (e.g. times the Eddington limit in [44]) in order to explain the observed disc temperatures. Whereas super-Eddington accretion rates are possible in nature [14], the Keplerian thin disc solution, which is used for this model, is not valid for such rates. Furthermore, the soft state still consists of a thin disc extending down to the ISCO in this model, meaning that as the source transitions from the intermediate to soft state, the disc accretion rate must sharply drop by more than an order of magnitude in order to reproduce the approximately constant X-ray luminosity observed over the transition, which seems rather fine-tuned.
5.6 Pressure or accretion rate modes
There are many QPO models in the literature that can be characterised as ‘intrinsic’ variability models, in that the system geometry is assumed to stay constant with time, and the oscillation in flux is assumed to result from some resonant oscillation in a property such as pressure or accretion rate. One such model, proposed by Cabanac et al. [34] in the context of a inner flow / truncated disc geometry, considers a white noise of perturbations to the pressure of the inner flow being generated at its outer radius, . These perturbations set up pressure waves in the corona. Reflection of these waves at the flow inner radius leads to the growth of resonant modes with wavelengths that are an integer fraction of . These oscillations in the pressure then modulate the X-ray flux through the Compton up-scattering process, leading to a predicted power spectrum consisting of band limited noise and a QPO with a fundamental frequency of and many higher harmonics. The QPO features become less sharp as transmission at is assumed to be more important. The increase in QPO frequency during the transition from hard to soft state is then explained by moving inwards, and to a lesser extent the sound speed increasing.
Other suggestions have been made based on MHD simulations. O’Neill et al. [174] reported on large-scale, low-frequency dynamo cycles in a global MHD simulation. The cycles take the form of oscillations in azimuthal magnetic field in and above the disc (extending into a low density corona several scale heights above the disc). The oscillations in magnetic field at narrow radial ranges are quasi-periodic and occur at frequencies commensurate with the observed LF QPO frequencies. However, the oscillation frequency is a function of radius, and so when the flux emitted form the entire disc is estimated, the oscillations are completely washed out and no QPO feature is seen in the prost-processed power spectrum. Similarly, Wang et al. [250] proposed that LF QPOs may be caused by toroidal Alfvén wave oscillations. Machida and Matsumoto [134] noted the formation of a constant angular momentum inner torus in a subset of their MHD simulations that deforms itself from a circle to a crescent quasi-periodically, in turn modulating the mass accretion rate and the mass outflow rate.
6 Observational tests
Here we summarise the current state-of-the-art in attempts to observationally constrain the QPO mechanism. The goal here is less to test individual theories, which in some cases overlap somewhat, but more to determine broad conclusions about the nature of these oscillations. For instance, most models can be classed either as geometrical – whereby the shape and/or size of something varies quasi-periodically – or intrinsic – whereby some fundamental property such as pressure or accretion rate oscillates in a stable geometry. In some models the disc emission is predicted to oscillate and in others the coronal emission is expected to oscillate. By testing these broad properties against the data, we can narrow down the allowed classes of models until we have a very specific picture of the physical properties that a successful model must have. In this manner, we need not even confine ourselves to existing theories proposed in the literature. We can instead imagine basic modulation mechanisms, such as a oscillations in the scale height or temperature of the corona.
6.1 Inclination dependence
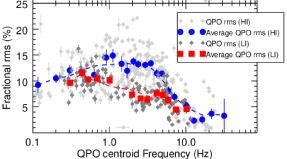
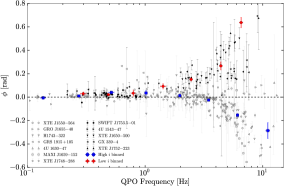
Given the size of the complete RXTE archive, it is now feasible to conduct population studies of X-ray binaries that probe the dependence of QPO properties on the inclination angle between the binary rotation axis and our line-of-sight. Motta et al. [159] used a sample of RXTE observations to show that the Type-C QPOs are stronger in higher inclination (more edge-on) binary systems, whereas Type-B QPOs are stronger in lower inclination (more face-on) systems (see Fig 16, left). Such an inclination dependence of Type-C QPOs had previously been suggested in the literature [200], but Motta et al. [159] and Heil et al. [73] were the first to use a large enough sample size to claim high statistical significance. This provides strong evidence that LF QPOs have a geometric origin. It also suggests that Type-B QPOs modulate the X-ray flux differently from Type-C QPOs. For instance, Type-C QPOs could be due to precession of the (oblate) inner flow, with Type-B QPOs instead caused by jet precession [159, 43]. It is worth noting that the QPO amplitude in the precession model depends on the tilt angle and viewer azimuth as well as the (polar) inclination angle [247, 91], implying that there should be a rather large spread in the correlation between QPO amplitude and inclination. It is, however, difficult to test for such a spread because the inclination angle tends to be poorly constrained observationally beyond being categorised as ‘high’ or ‘low’.
van den Eijnden et al. [233] used a sample slightly extended from the Motta et al. [159] analysis (with the main difference being the inclusion of data from GRS 1915+105) to study the inclination dependence of the phase lag between hard ( keV) and soft ( keV) photons measured at the QPO fundamental frequency and its overtones. Fig 16 (right) shows their result for the Type-C QPO fundamental. We see that small hard lags (i.e. hard photons lag soft photons) are seen for all sources when the QPO frequency is low, whereas low / high (red / blue in the plot) inclination sources display hard / soft lags when the QPO frequency is high. This inclination dependence of the phase lag is more difficult to interpret than the amplitude inclination dependence, but is much more dramatic, and provides further evidence in favour of a geometric origin of the Type-C QPO. van den Eijnden et al. [233] also found that soft lags for the Type-B fundamental appear to be preferentially associated with high-inclination sources, but not with high statistical significance because of the small sample size (15 sources in total, but only 9 of those sources have Type-B QPO detections and an inclination estimate). The sample size will continue to grow as hitherto unknown XRBs go into outburst, therefore there is scope to expand such population studies using X-ray missions such as NICER.
6.2 Frequency-resolved spectroscopy
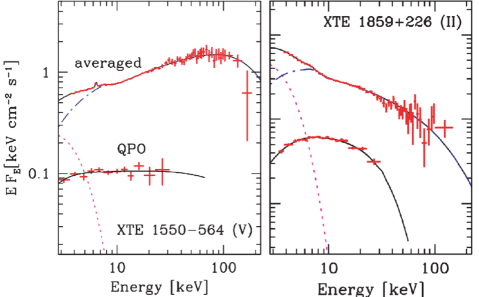
Frequency-resolved spectroscopy provides a way to determine the energy spectrum of the QPO harmonics - in other words, it constrains which spectral components are oscillating. This is achieved by extracting light curves for many energy channels, and calculating the Poisson noise subtracted power spectrum of each channel in absolute rms normalization [195] such that the integral of the power spectrum over all frequencies gives the variance of the corresponding light curve. The energy dependence of QPO harmonic components can be studied by fitting each power spectrum with a multi-Lorentzian model and plotting the square root of the integral of the Lorentzian component corresponding to given harmonic against energy (the absolute rms spectrum). The rms spectrum is in units of count rate and therefore the instrument energy response must be accounted for before it can be compared to physical models (see [138] for an extended discussion on this).
Sobolewska and Życki [205] studied the rms spectrum of the Type-C QPO fundamental component for a number of BH XRBs. Fig 17 shows a subset of their results. Perhaps the most striking conclusion is that the time-averaged spectrum includes a disc component (magenta), but the QPO rms spectrum does not. This indicates that the QPO fundamental does not modulate the directly observed disc emission, but strongly modulates the Comptonized emission. They also found that the QPO spectrum is softer than the time-averaged spectrum when the latter is hard, and becomes harder than the time-averaged spectrum as the latter becomes softer. Axelsson et al. [13] studied the fundamental and second harmonic of Type-C QPOs in XTE J1550-564. They again found that the QPO fundamental rms spectrum contains no disc component, and noted that it is similar to the spectrum of high frequency ( Hz) broad band noise variability, which displays weaker reflection components than the time-averaged spectrum (consistent with path length differences washing out the fastest variability in the reflection spectrum; [69]). The second harmonic, in contrast, is significantly softer than the time-averaged spectrum. A similar analysis of GX 339-4 [12] additionally revealed that the rms spectrum of the second harmonic can be described by a low-temperature, optically thick Comptonized component that is not required to be present in the rms spectrum of the fundamental, which instead includes a higher temperature Comptonized component. The authors suggested that these results could be explained by precession of a stratified inner accretion flow, which is hotter closer to the BH. They could also potentially be explained by non-linear variability of a single Comptonized component [68]. For instance, oscillations in the electron temperature will drive oscillations in the spectral index [255]. If these temperature oscillations have a strong second harmonic whereas the variations in total flux only have a strong first harmonic, this could lead to the second harmonic having a much softer rms spectrum than the first.
The lack of a QPO signal in the disc component is very troublesome for QPO models that are based on oscillations in the disc. For instance, it is simple to imagine how disc corrugation modes can give rise to strong oscillations of the Comptonised flux (via e.g. variation of seed photons for Compton up-scattering), but much harder to imagine how the observed disc flux is not modulated. We can speculate that the region of the disc where the oscillations take place is somewhat hidden from view by an X-ray corona located above the disc (but not entirely hidden, because the corona has optical depth ), and therefore the disc spectrum we see is dominated by the stable region at larger radii that is not covered by the corona. The overdensities in the disc spiral waves of the AEI model radiate a Comptonized spectrum, and so this model can explain the spectrum of the fundamental, but it is not clear how it can explain the softer spectrum of the second harmonic.
6.3 QPO Phase-resolved spectroscopy
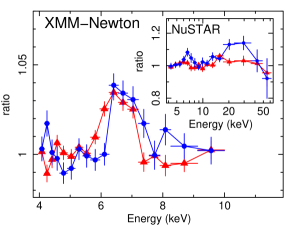
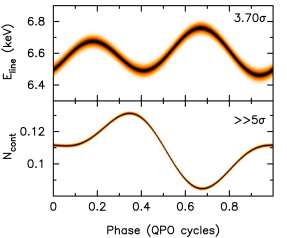
Whereas the rms spectrum gives the amplitude of different QPO harmonics for each energy channel, constraining the full QPO waveform for each energy channel provides a lot more information. We have already discussed in detail the QPO waveform for a single energy band in Section 3.2. The same techniques discussed therein can be applied to individual energy channels to obtain QPO phase-resolved spectra. This includes filtering and phase-folding such as the method of Tomsick and Kaaret [226] and the Hilbert-Huang transform explored by Su et al. [217]. Ingram and van der Klis [94] argued that better signal to noise can be achieved by reconstructing the waveforms from the harmonic amplitudes, the phase difference between harmonics in a broad (therefore high count rate) reference band and the phase difference for each harmonic between each energy channel and the broad reference band. Stevens and Uttley [210] instead used the cross-correlation function between each energy channel and a broad reference band. The major advantage of this method is that it preserves the quasi-periodicity of the QPO instead of reducing it to a sum of harmonics. The major disadvantage is that the phase difference between harmonics is lost completely. Estimating parameter uncertainties is a subtle task for all reconstruction methods, since the error bars of the spectra are correlated across phases. Ingram et al. [96] circumvented this problem by fitting the phase-resolved model in Fourier space - i.e. Fourier transforming the phase-resolved model and fitting it to the Fourier transform of the QPO. Stevens and Uttley [210] instead used a bootstrapping scheme.
Ingram et al. [96] used the phase-resolving method of Ingram and van der Klis [94] in order to study a Type-C QPO from the BH XRB H 1743-322. Fig 18 (left) shows reconstructed spectra at two QPO phases (blue circles are a quarter of a QPO cycle after red triangles). We see that the iron K line profile changes between these two phases, both in the XMM-Newton and NuSTAR data (inset). Fig 18 (right) shows the results of fitting the phase-resolved spectra with a simple absorbed power-law plus Gaussian iron line model. Since the fitting is in the Fourier domain, the result is a probability map. This analysis confirms that the centroid energy of the line varies with QPO phase with a significance of . This not only provides very strong evidence for a geometric QPO origin, but also confirms a specific prediction of the precession model [89]. The only way to explain this in the context of a constant geometry is with variations in the disc ionization state, since the restframe iron line energy is keV for neutral iron and keV for the highest ionization state. This interpretation is ruled out by the NuSTAR data since we see that the strongest Compton hump coincides with the bluest iron line, whereas increased disc ionization leads to the Compton hump being weaker compared with the line [64]. Also, the variation of X-ray flux irradiating the disc would need to be orders of magnitude for the line energy modulation to be caused by ionization changes alone, when the variation in X-ray flux we see is only . The modulation can therefore only be explained by variations in Doppler shifts caused by changes in the accretion geometry.
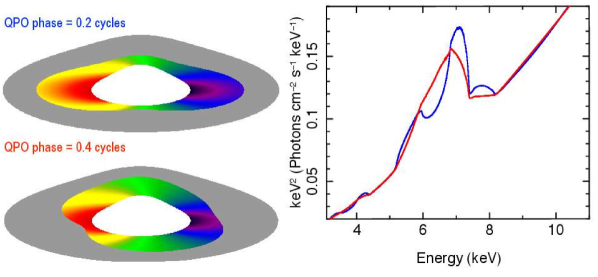
Ingram et al. [95] applied a more sophisticated phase-resolved spectral model to the same data set. They parameterized the restframe reflected specific intensity as a function of QPO phase, , and disc radius and azimuth with the analytic function
| (25) |
where the restframe reflection spectrum is calculated using the model xillver [64]. If the asymmetry parameters and are non-zero, this function corresponds to an asymmetric illumination pattern on the disc surface that rotates as the QPO phase increases. They then calculated the observed QPO phase-dependent reflection spectrum accounting for all relativistic effects. Fig 19 shows the best fitting illumination function (left) and the corresponding observed reflection spectra (right) for two selected QPO phases. We see that the there are two bright patches on the disc surface (). This enables the model to reproduce the two maxima in line energy per QPO cycle seen in Fig 18 (right), since the bluest line occurs when the approaching and receding sides of the disc are both illuminated and the reddest line occurs when the front and back of the disc are illuminated. This is the case because blue shifted radiation is also Doppler boosted, and so the blue wing dominates over the red wing when approaching and receding sides of the disc are illuminated. Ingram et al. [95] suggested that such an illumination could result from the top and bottom of an oblate precessing inner flow illuminating the disc (i.e. the misalignment angle between disc and flow is greater than the opening angle of the flow), or alternatively may occur if both the inner flow and the jet base are precessing. The best fitting model is preferred to a null-hypothesis of axisymmetric illumination () with significance. Confirmation of asymmetric illumination at confidence levels is likely to be provided by the high count rate capabilities of NICER.
Another important result of the Ingram et al. [95] analysis is that the reflection fraction is required to vary with significance. Since the reflection fraction in this context is defined as the number of photons intercepted by the disc divided by the number of photons radiated by the corona (i.e. the covering fraction), this indicates once and for all that the geometry is changing over the course of each QPO cycle. Ingram et al. [95] also tried alternative models with an axisymmetric illumination profile. They considered modulations in the ionization, disc inner radius and the radial emissivity parameter, . The first of these has already been argued to be implausible, but qualitative testing is still worthwhile. The second is most similar to the propagating oscillatory shock model, although the truncation radius according to that model would be for the observed QPO frequency ( Hz), and therefore the rotational frequency is too low to cause the observed Doppler shifts. Still, an oscillation of the disc inner radius caused by some other physical mechanism could plausibly cause a line energy modulation. The third is intended to mimic oscillations in the shape or height of the corona. All three alternative models yield worse fits than the best fitting asymmetric model with confidence.
The phase-resolved spectroscopy results strongly favour asymmetric geometrical models for the Type-C QPO. The line energy modulation could be caused by precession of the inner flow, jet or disc, or by the spiral density waves of the AEI [105]. However, there is no strong QPO in the disc component. Therefore, although disc corrugation modes can explain the line energy modulation [228], this requires the oscillating region of the disc to not be hidden by the corona and therefore predicts a strong QPO in the disc spectrum. It is also unclear quite how the reflection fraction would change with QPO phase both in the corrugation modes and AEI models, unless perhaps the disc is warped. These observational characteristics are instead naturally explained by precession of the corona or jet as long as the disc rotation axis is misaligned with the BH spin axis.
Stevens and Uttley [210] studied a Type-B QPO in RXTE data from GX 339-4. They we not able to constrain changes in the iron line due to signal to noise restraints, but were able to track the QPO phase dependence of the disc blackbody and Comptonised components. Their preferred model consisted of a constant multi-temperature disc, a variable blackbody component (representing thermal radiation from the inner disc), a variable power-law and a Gaussian iron line. They found that the blackbody temperature and power-law flux varied with and rms respectively, and that the temperature variations led the power-law flux variations by QPO cycles. The variations in bolometric flux of the blackbody component were . This is of course consistent with changes in the intrinsic disc flux, through either accretion rate fluctuations or variable irradiation, in a constant geometry (i.e. the Stefan-Boltzmann law). The cycles phase lag rules out irradiation as the cause, since in this case there should be no phase lag, but oscillations in the accretion rate of the inner disc are possible. An relation would also result if the blackbody component has a constant intrinsic flux, but the blue shift (where and are respectively observed and emitted photon energies) changes with QPO phase, as would be the case for precession. This is because the relation between the observed and emitted bolometric flux is (see e.g. [128, 92]). Since the restframe flux follows the Stefan-Boltzmann law, , this gives . The effective blackbody temperature measured by the observer is , and therefore . The authors suggested a model whereby a precessing jet illuminates different disc azimuths. This fits the observations because the highest disc temperature would occur when the jet tilts towards the approaching disc material, and the peak in power-law flux would occur precession cycles later when the jet tilts towards the observer. The X-ray source must be reasonably far from the BH in order to explain the small variations in disc temperature.
6.4 QPO triplets
Although the observational evidence strongly implies that LF QPOs are generated by precession, none of the tests discussed thus far give any indication that this is specifically Lense-Thirring precession. If we knew the mass and spin of a given BH, and were able to track the disc inner radius over many observations, we could test if the QPO frequency evolves with disc inner radius in a manner predicted by the model. However, it is notoriously difficult to measure all three of these quantities. It is however possible to test the RPM whenever a Type-C LF QPO and a pair of HF QPOs are detected in the same observation, because the RPM associates these three features with Lense-Thirring precession, periastron prescession and orbital motion, all at the same characteristic radius. If a triplet of QPOs is detected, this leaves three equations and three unknowns: , and , which can be solved for analytically [93]. Motta et al. [158] did just this for a QPO triplet detected from GRO J1655-40 (the pair of HF QPOs are pictured in Fig 4, left) to infer , and . Remarkably, this mass measurement agrees very well with the existing dynamical mass measurement of . Another validation of the model came when they found that the highest Type-C QPO frequency ever measured for this source is consistent with Lense-Thirring precession at the ISCO radius for these mass and spin values, as is predicted by the RPM.
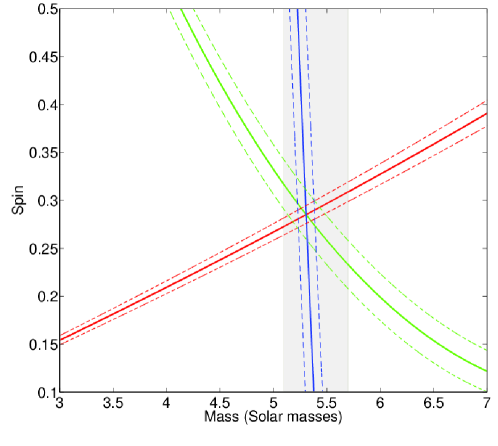
Although the RPM is a rather simplistic model, it is the limiting case of the more physical precessing inner flow model when the radial extent of the precessing flow is small [160]. The source is predicted to be in such a state for the observation containing the triplet, since the Type-C QPO frequency is fairly high ( Hz). HF QPOs are only observed in softer states such as this one (i.e. with higher QPO frequencies) [29]. Psaltis et al. [183] and [24] noted that broader power spectral components are observed in the hard state, whose characteristic frequencies smoothly evolve into the HF QPO frequencies as the source spectrum softens. They suggested that this happens because the flow is extended in the harder states, meaning that a range of periastron precession and orbital frequencies contribute to the broad components, but these features become narrower as the extent of the flow, and therefore the range of epicyclic frequencies, decreases. Fragile et al. [57] showed that the GRO J1655-40 QPO triplet can also be explained by a precessing torus (; ), with the lower and higher HF QPOs resulting respectively from breathing and vertical epicyclic modes of this torus. This model works for the dynamical mass measurement of GRO J1655-40 for a spin of , but there are parameters and therefore other values of BH mass also work.
The consistency of this triplet with the RPM and the more sophisticated model of Fragile et al. [57] is very encouraging, but unfortunately HF QPO detections are sufficiently rare for this to be the only triplet in the entire RXTE archive. It is therefore not possible to further test these models with more triplets. It is however possible to apply the RPM to doublets if a dynamical mass measurement is available. Motta et al. [161] did this for XTE J1550-564 and obtained a spin value consistent with that obtained via X-ray spectroscopic methods. It is also possible to place limits on the spin according to the RPM by combining the highest Type-C QPO frequency ever observed with a mass measurement [93, 59]. The very precise mass and spin values that can be inferred from the RPM make further observational validation of the model very desirable. Such tests will be made possible by future high throughput X-ray missions such as eXTP and STROBE-X, which will be very sensitive to detecting HF QPOs.
6.5 Energy dependence of the QPO frequency
One observational property of Type-C QPOs that is rather challenging for all models to reproduce is the energy dependence of QPO frequency observed for a number of sources [185, 232, 233, 80]. Most, if not all, QPO models invoke some sort of global mode, implying that there should be only one QPO frequency, regardless of the energy band we observe in. van den Eijnden et al. [232] tested the hypothesis that there is no energy dependence of the QPO frequency at any given time, but that the QPO frequency changes with time (which it does) in a manner that correlates with QPO amplitude in one energy band and anti-correlates with amplitude in the other band. In this case, the power spectrum averaged over time would then contain a QPO with higher frequency for the correlated band than for the anti-correlated band. This hypothesis had to be ruled out because the phase of the higher frequency QPO was found to accelerate away from the phase of the lower frequency QPO (see the final paragraph of Section 3.1). This tells us that the instantaneous QPO frequency depends on energy, and therefore if the QPO is driven by precession, there needs to be some differential precession. This is not so difficult to imagine, since the Lense-Thirring precession frequency is a function of radius and so we can imagine the twist of the inner flow increasing to give a slightly higher precession frequency in the hotter inner region, in turn leading to the QPO frequency increasing with energy. However, van den Eijnden et al. [232] found for GRS 1915+105 that the QPO frequency sightly decreases with energy for low average and increases with energy for higher average . This is very hard to explain with radial differential precession, since we always expect the precession frequency and spectral hardness to increase with proximity to the hole.
A possible answer to the riddle was provided by the GRMHD simulations of a moderately thick () tilted disc ran by Liska et al. [121]. They found that the disc precesses along with the low density corona above it and the jet. The jet precesses at a slightly slower rate than the corona, which precesses at a slightly slower rate than the disc. Such a ‘multi-region’ setup could potentially also allow other models to reproduce the energy dependence of QPO frequency. Taking the AEI as an example, perhaps the spiral density wave in the disc mid-plane could have a slightly different frequency to the that in the disc upper atmosphere.
7 Discussion
7.1 What are LF QPOs?
From the previous Section, we can conclude a number of things about the nature of Type-C QPOs:
They modulate the Comptonised component, not the disc component: We know this from frequency-resolved spectroscopy. Furthermore, QPOs are still visible - and matter of factly with a higher fractional rms - at energies and in accretion states where the disc has no contribution. Note, however, that the oscillation could still somehow originate in the disc but only modulate the X-ray flux emitted from the corona through, for example, variation of seed photons.
They are very likely a geometrical effect: There are many strong lines of evidence that lead to this conclusion. There is the inclination dependence of QPO amplitude and phase lag, and the line energy and reflection fraction modulations observed in H 1743-322. A caveat is that the spectral modulations that form the strongest arguments are currently based entirely on one observation of one source. More observations therefore need to be analysed in order to gain confidence that the H 1743-322 observation is representative of the population.
They are likely an azymuthally asymmetric geometrical effect: This conclusion is again driven by the line energy modulation in H 1743-322 and the QPO phase-resolved spectral modelling of Ingram et al. [95]. We must therefore keep in mind that this conclusion is also essentially based on one observation of one source.
We can make similar statements about Type-B QPOs, perhaps with slightly less confidence. We also conclude that Type-B QPOs are different features to Type-C QPOs. This is evidenced by observations that contain both classes of QPO simultaneously [156], and also by the different inclination dependence of the two QPO classes. A model whereby Type-C and Type-B QPOs are respectively due to precession of the oblate inner accretion flow and the jet is consistent with the observational data, and Lense-Thirring precession is a theoretically appealing precession mechanism. There is still, however, a lot to learn about LF QPOs despite the many decades since they were first discovered, and it is of course important to carry on testing models other than the precession model such as the AEI.
7.2 Are these systems misaligned?
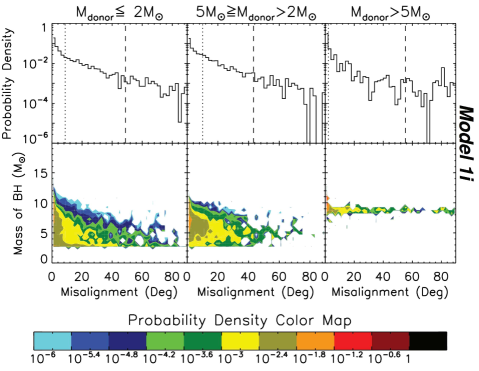
For the Lense-Thirring precession model to apply to all Type-C QPOs, all sources that display them must have a misalignment between the BH spin axis and the binary orbital axis. This requirement can be relaxed a little if we assume that Type-C QPOs are driven by precession but remain agnostic about the physics behind this precession. That said, it is difficult to imagine how the reflection fraction could vary with QPO phase (as is observed) in an aligned system. Ray tracing calculations of a precessing ring [247] and torus [91, 95] demonstrate that the observed QPO amplitudes can be reached if the half opening angle of the precession cone (i.e. the misalignment angle) is . These calculations do not include the variation of seed photons that would result from the angle between flow and disc rotation axes varying between and , which provides an additional modulation mechanism and thus increase the QPO amplitude for a given misalignment angle [256, 254]. The required range of misalignments can therefore be revised down slightly.
The first question we can ask is: is it theoretically reasonable for a large fraction of BH XRBs to have the misalignment required by the precession model? For XRBs formed from existing binary star systems, misalignment is thought to be introduced by asymmetries in the supernova explosion that creates the BH (a supernova kick). Fig 21 shows the result of one of the supernova kick models ran by Fragos et al. [58] (Maxwellian distribution of kick velocities and uniform distrbution of kick directions) in the form of probability density functions for all of the binary systems that remain bound after the supernova (in order to become XRBs). We see that systems with smaller misalignments are more common, with in the range. This is because the largest kicks disrupt their binary systems. Accretion onto the hole will then drive the system towards alignment over time. King and Nixon [111] show that this is a slow process, with the BH needing to accrete of its initial mass before the misalignment angle is significantly altered (also see [137, 18]), indicating that modest misalignments could be common amongst the BH XRB population. Even more mass would need to be accreted if the Bardeen-Petterson transition radius is smaller than analytic predictions, as recent GRMHD simulations imply [123].
It is therefore plausible for many systems to have a misalignment, but it follows that there should also be many systems with a misalignment. A fraction of the BH XRB population should therefore display no, or at least very weak, Type-C QPOs according to the precesison model. The most famous example of such a source is perhaps Cygnus X-1. Although there are lumps and bumps in its power spectrum, the feature that has occasionally been speculated to be a Type-C QPO [11] is very weak and broad () and is not seen in the bi-coherence [231]. Other sources with very weak and/or broad QPOs include GRO J0422+32 ( [234]), LMC X–3 ( [32]), 1E 1740.7–2942 (the great anhilator [203]), GRS 1758–258 [203], Swift J1357.2–0933 [9] and GS 1354–64 [196]. However, in some of these cases the QPO may have been smeared out by very long exposures, and in others the QPO may simply have been missed due to the only outburst being ‘hard state only’ [222] or largely obstructed by sun constraints (e.g. Swift J1713.4–4219 [222]). Perhaps the best example for which these caveats do not apply is XTE J1652–453, which has no detectable Type-C QPO in its HIMS power spectrum [75]. Finally, there are a number of sources for which a power spectrum has never been published, despite having been observed by RXTE or another telescope with similar timing capabilities. We speculate that there may be a bias at play amongst such sources, since Type-C QPOs are interesting features, and therefore a power spectrum displaying them is more likely to be published than one without.
Although Type-C QPOs are therefore not completely ubiquitous, they are more commonly present than not, which is slightly in tension with the expectations of population synthesis models. One effect that has never been included in the binary evolution models, however, is radiative warping [181, 60]. For an initially misaligned system, radiation pressure from the central X-ray source is capable of warping the outer disc. We speculate that this effect could further slow down the binary alignment process, and/or lead to the inner disc being more misaligned with the hole than the binary partner is. BH XRBs in dense environments such as globular clusters may have very different properties, since they are likely formed by binary capture for which there is no preferred misalignment angle [49]. Therefore, if a bright enough XRB in a globular cluster were ever detected, the precession model predicts that it would likely have very strong QPOs. Arbitrary misalignment angles are also expected for tidal disruption events (TDEs). It is somewhat encouraging for the precession model that the QPO recently discovered from a TDE reached a fractional rms as high as [176].
There are a few (indirect) observational tests for binary misalignment. For instance, the proper motion of Cygnus X-1 is consistent with that of its natal association of O stars, implying that it felt no supernova kick [145]. Before we get excited that this explains why Cygnus X-1 has no QPOs however, we must also note that GRS 1915+105, which has very strong QPOs, also has no peculiar velocity with respect to its association [145]. Another test comes from super-luminal jet ejections, because the 3D jet trajectory can be reconstructed by tracking the proper motion and brightness of approaching and receding lobes. For GRO J1655–40, the inferred jet inclination angle is [76], whereas the binary inclination angle calculated from ellipsoidal modulations of absorption lines in the donor star’s optical spectrum is [70]. This means that the misalignment angle is at least , because we have no information about the projection of the binary rotation axis on the observer plane [56]. For SAX 1819–2525 (V4641 Sgr), a misalignment of is inferred using the same method [130]. The misalignment for XTE J1550–564 could potentially be much smaller, but is still [206]. For H 1743–322, comparing the inferred jet orientation [207] with the inner disc inclination measured via QPO phase-resolved reflection modelling [95] implies a misalignment angle , and an misalignment of is consistent within confidence.
Perhaps the most spectacular evidence of misalignment is the recent result of Miller-Jones et al. [144], who used very long baseline interferometry to discover that the jets of V404 Cygni are precessing. The half opening angle of the precession cone is , and the precession period is in the range second to hours (the pattern of sampling makes it difficult to estimate the precession period, or even to conclusively confirm that that the changes in jet orientation are periodic). These observations are coincident with an intermittently detected X-ray QPO with a period of seconds [81], although it is difficult to reliably establish a connection between the two phenomena. The results of Miller-Jones et al. [144] provide strong evidence that V404 is a misaligned system, although we note that this source cannot by any stretch be considered typical of the population. One argument in favour of alignment is that XRB jets are all observed to have a very small opening angle, which implies that the opening angle of the precession cone is equally small if the observed jet lobe is averaged over many precession cycles. However, resolved jet lobes are all from discrete, transient ejections and therefore there are no such constraints on the precession cone of the compact persistent jets coincident with Type-C QPOs.
7.3 Outstanding Problems
Although much progress has been made over the past decade or so, there are still some observational characteristics that challenge the precession hypothesis, and some that pose a challenge to most, if not all, proposed QPO models. Here, we summarise these problems.
7.3.1 The sub-harmonic
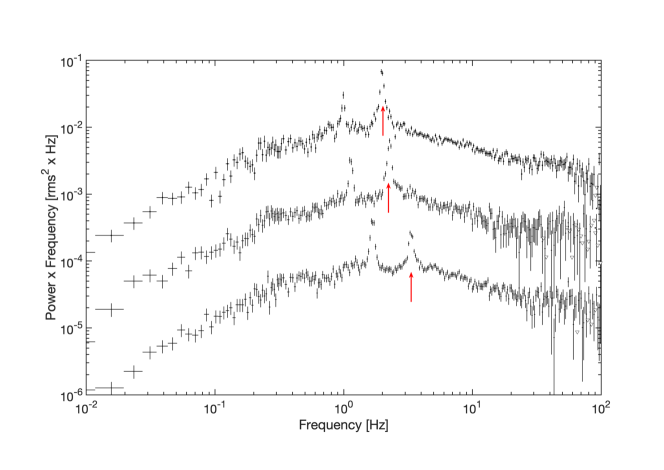
It is usual to classify the QPO fundamental as the highest amplitude peak in the power spectrum. However, a sub-harmonic – at half the frequency of the fundamental – is often observed. Sub-harmonics are seen for Type-C and Type-B QPOs, and they are perhaps the most puzzling property of QPOs. The most obvious explanation is that the sub-harmonic is the true fundamental, and somehow the second harmonic (which is what we call the fundamental) has more power than the fundamental. This is difficult to achieve in any model (e.g. [247]). Curiously, a sub-harmonic feature is often co-incident with peaks at times the frequency of the most powerful QPO peak, where is an integer , but not with peaks at times the frequency of the most powerful QPO peak. This means that, if the sub-harmonic is actually the true fundamental, then the QPO never has any strong odd harmonics, only even harmonics. The alternative of the sub-harmonic truly being a sub-harmonic is equally difficult to explain. The RXTE archive also includes a few examples of the sub-harmonic amplitude overtaking that of the fundamental. Fig 22 shows an example of this over three observations on consecutive days from the 2007 outburst of GX339-4. The picture is further complicated by multi-wavelength observations, since the fundamental frequency of optical and IR QPOs are sometimes observed to be consistent with the X-ray fundamental (e.g. [83]) and sometimes with the X-ray sub-harmonic (e.g. [154, 103]).
7.4 QPOs from accreting millisecond X-ray pulsars
Since we know the spin frequency of accreting millisecond X-ray pulsars, we can estimate the spin parameter for a range of reasonable moment of inertia values and test the Lense-Thirring precession model against the observed LF QPO frequencies, under the assumption that the upper kHz QPO is due to orbital motion. Initial works to test the RPM in this manner concluded that the LF QPO frequency matches best to twice the Lense-Thirring precession frequency [153, 209]. Ingram and Done [86] later considered the precessing inner flow model, and found that the solid body precession frequency matched the LF QPO frequency if the surface density profile becomes more centrally peaked as the source gets brighter, as may result from material piling up on the MNS surface. More recently, van Doesburgh and van der Klis [240] considered a sample of 13 sources and again found that the surface density profile is required to become more centrally peaked as the source flux increases in order to explain the QPO frequencies. They additionally find that the LF QPO frequencies are higher than the precession frequencies produced by assuming reasonable moment of inertial values, and suggest (again) that the LF QPO fundamental could actually be twice the precession frequency, or that the precession is modified by mechanisms other than the frame dragging effect, such as radiation pressure and magnetic precession.
The opportunity for a stricter test of the Lense-Thirring precession model was provided by the discovery of QPOs in the Hz pulsar, IGR J17480–2446, in the globular cluster Terzan 5. Shortly after the source was discovered, Altamirano et al. [6] reported on a QPO in its power spectrum with frequency evolving from 35-50 Hz, which is far too high to be driven by Lense-Thirring precession around a NS with a spin of only Hz. This QPO was also accompanied by a kHz QPO and broad band noise. Using well-known correlations between the frequencies of the different power spectral components [252], and by examining its general characteristics (quality factor, rms amplitude, overall power-spectral shape), Altamirano et al. [6] classified the 35-50 Hz QPO as an HBO (thought to be the Z-source analogy of Type-C QPOs - see Section 2.4). This classification implies that HBOs cannot be due to Lense-Thirring precession, and the association between HBOs and Type-C QPOs also throws doubt on the Lense-Thirring model for BHs.
We note, however, that a search for QPOs in the frequency range expected for Lense-Thirring precession around an 11 Hz NS ( Hz) has never been carried out for this source, due partially to the presence of a large number of type-I X-ray bursts in the data [155] and the relatively short length of the observations. The detection of such a very low frequency QPO in this source would cast doubt on the HBO classification of the 35-50 Hz QPO and thus re-establish the possibility that HBOs in general could be due to Lense-Thirring precession. It is also important to note that IGR J17480–2446 was behaving as a Z-source when these QPOs were observed, and therefore the Lense-Thirring precession frequency of particles close to the NS surface can be quite significantly modified by radiation pressure [143].
We can also consider whether it is reasonable for the NS spin axis to be misaligned with the binary rotation axis in accreting millisecond X-ray pulsars, given the standard paradigm in which the NS has been spun up by accretion over its lifetime by a factor of hundreds [186]. Is it possible for the spin magnitude to increase this much without the system aligning? We can adapt the calculations of King and Nixon [111] to make a back of the envelope estimate, starting by expressing the magnitude of the spin-up torque on the NS as
| (26) |
where and are respectively the NS mass and radius, and we have assumed for simplicity that the accretion disc reaches the NS surface. Integrating over time for a constant mass accretion rate, ignoring any NS mass increase caused by accretion and assuming that today’s spin frequency is the birth frequency, the total mass that must be transferred to achieve a spin frequency of is
| (27) |
where the NS moment of inertia is . Assuming (solid sphere), , km and Hz, we find . We recall from Section 7.2 that this is on the edge of how much mass can be transferred without significant alignment, implying that more NS XRBs should be aligned than BH XRBs, but not ruling out the possibility that some are still misaligned today.
7.5 Future outlook
New and upcoming X-ray missions promise to further increase our understanding of QPOs. Some of the best constraints to date have been obtained by QPO phase-resolved spectroscopy, which requires a large number of photons. High throughput X-ray detectors will therefore increase the quality and quantity of QPO phase-resolved spectroscopy studies. NICER, which was recently installed on the International Space Station, is ideal for phase-resolved spectroscopy due to its good spectral resolution and ability to measure high count rates (unlike XMM-Newton, it does not suffer from instrumental problems associated with high count rates such as pile-up or dead time). The bright BH XRB outbursts that have recently been extensively monitored by NICER therefore promise to soon deliver insights into the physics of QPOs. In future, proposed missions with a large area X-ray instrument, such as eXTP and STROBE-X will further enhance our phase-resolved spectroscopy constraints, as well as enabling new tests such as QPO phase-resolved reverberation mapping. The hard X-ray capabilities of these missions will additionally enable the detection of more HF QPOs, and therefore more QPO triplets. Since the best current evidence that LF QPOs are specifically Lense-Thirring precession comes from the QPO triplet in GRO J1655-40, this will be extremely valuable.
Perhaps the most distinctive test for a precession origin of LF QPOs is to search for QPOs in the X-ray polarization degree and angle. Ingram et al. [91] calculated the modulations in polarization degree and angle that would result from precession of a Comptonising torus. They found that the swings in polarization angle are greater when the torus is viewed more face-on. This is because an edge-on observer only sees the side of the precession cone, whereas a face-on observed sees the base of the precession cone, and so sees the polarization vector rotate through all angles. However, the mean polarization degree should be larger for a torus viewed more edge-on [218], essentially because its image on the observer plane is less symmetric. Since polarization angle is easier to measure for a higher polarization degree, this introduces a trade-off. The Imaging X-ray Polarimetry Explorer (IXPE; [251]), due to be launched in 2021, will provide the first opportunity to measure the predicted polarization QPOs. This will, however, be a challenging measurement because many photons must be collected to make a significant detection of polarization. For the expected IXPE count rate ( cps) and BH XRB polarization degree (), each polarization measurement will require a minute exposure. It will therefore not be possible to probe the sub-second timescales of interest simply by making light curves of polarization degree and angle. Ingram and Maccarone [98] introduced a statistical method to circumvent this problem, and showed that it should be possible for IXPE to measure the predicted modulations with high statistical significance providing that the mean polarization degree for a high inclination source is . eXTP is proposed to have an X-ray polarimeter of very similar design to the IXPE instrument, but with higher effective area. This, combined with the possibility to enhance the signal by cross-correlating with the signal from the large area detector, will provide much more sensitive constraints on the variability of X-ray polarization [98].
8 Conclusions
Much progress has been recently made in the physical interpretation of LF QPOs in BH XRBs. The observational evidence points strongly to a geometric origin of Type-C and Type-B QPOs, whereas Type-A QPOs are very rare and weak features that only have their own classification for historical reasons. Moreover, an azimuthally asymmetric geometry is required to explain Type-C QPOs, favouring a precession origin. Since the LF QPO is far stronger in the hard (i.e. Comptonised) emission than in the disc emission, it is likely that it is the X-ray corona that undergoes precession, as opposed to the disc. If the QPO mechanism is specifically Lense-Thirring precession (as implied by the QPO triplet in GRO J1655-40), this implies that the BH spin axis in most BH XRBs has to be misaligned with the binary rotation axis by . This could result from an asymmetric kick in the natal supernova and is supported by some observations of jet lobes.
An important caveat is that some of the strongest constraints come from phase-resolved spectroscopy of a single observation of H 1743-322, and so it is important to carry out the same analysis for more observations of more sources. In particular, tracking how the phase-resolved spectral properties of a given object evolve with QPO frequency will help diagnose what causes the QPO frequency to change. All QPO models summarised here associate QPO frequency changes with a moving characteristic radius, usually the inner disc radius. However, observations in which the broad iron line profile appears to stay constant as the characteristic frequencies in the power spectrum increase imply that the disc inner radius may instead (at least at times) be fixed, or only move by a small amount, during the bright outburst phase [104]. If such a paradigm is confirmed, some creativity will be required to determine how the observed two orders of magnitude increase in QPO frequency can be achieved without a moving radius. New, future and proposed X-ray missions promise further tests of the QPO mechanism through high count rate capabilities (e.g. NICER, STROBE-X) and polarimetry (IXPE, eXTP).
We thank Michiel van der Klis, Chris Fragile and Peggy Varniere for valuable and informative discussions. AI acknowledges support from the Royal Society. SME acknowledges support from the STFC and the Oxford Hintze Centre for Astrophysical Surveys. We thank the anonymous referee for insightful comments.
References
- Abramowicz and Kluźniak [2001] Abramowicz, M.A., Kluźniak, W., 2001. A precise determination of black hole spin in GRO J1655-40. A&A 374, L19–L20. doi:10.1051/0004-6361:20010791, arXiv:arXiv:astro-ph/0105077.
- Alston et al. [2014] Alston, W.N., Markeviciute, J., Kara, E., Fabian, A.C., Middleton, M., 2014. Detection of a QPO in five XMM-Newton observations of RE J1034+396. MNRAS 445, L16–L20. doi:10.1093/mnrasl/slu127, arXiv:1407.7657.
- Alston et al. [2015] Alston, W.N., Parker, M.L., Markevičiūtė, J., Fabian, A.C., Middleton, M., Lohfink, A., Kara, E., Pinto, C., 2015. Discovery of a 2-h high-frequency X-ray QPO and iron K alpha reverberation in the active galaxy MS 2254.9-3712. MNRAS 449, 467–476. doi:10.1093/mnras/stv351, arXiv:1411.0684.
- Altamirano and Belloni [2012] Altamirano, D., Belloni, T., 2012. Discovery of High-frequency Quasi-periodic Oscillations in the Black Hole Candidate IGR J17091-3624. ApJ 747, L4. doi:10.1088/2041-8205/747/1/L4, arXiv:1201.2106.
- Altamirano et al. [2008] Altamirano, D., Casella, P., Patruno, A., Wijnands, R., van der Klis, M., 2008. Intermittent Millisecond X-Ray Pulsations from the Neutron Star X-Ray Transient SAX J1748.9-2021 in the Globular Cluster NGC 6440. ApJ 674, L45–L48. doi:10.1086/528983, arXiv:0708.1316.
- Altamirano et al. [2012] Altamirano, D., Ingram, A., van der Klis, M., Wijnands, R., Linares, M., Homan, J., 2012. Low-frequency Quasi-periodic Oscillation from the 11 Hz Accreting Pulsar in Terzan 5: Not Frame Dragging. ApJ 759, L20. doi:10.1088/2041-8205/759/1/L20, arXiv:1210.1494.
- Altamirano and Strohmayer [2012] Altamirano, D., Strohmayer, T., 2012. Low-frequency (11 mHz) Oscillations in H1743-322: A New Class of Black Hole Quasi-periodic Oscillations? ApJ 754, L23. doi:10.1088/2041-8205/754/2/L23, arXiv:1206.0476.
- Arévalo and Uttley [2006] Arévalo, P., Uttley, P., 2006. Investigating a fluctuating-accretion model for the spectral-timing properties of accreting black hole systems. MNRAS 367, 801–814. doi:10.1111/j.1365-2966.2006.09989.x, arXiv:astro-ph/0512394.
- Armas Padilla et al. [2014] Armas Padilla, M., Wijnands, R., Altamirano, D., Méndez, M., Miller, J.M., Degenaar, N., 2014. An X-ray view of the very faint black hole X-ray transient Swift J1357.2-0933 during its 2011 outburst. MNRAS 439, 3908–3915. doi:10.1093/mnras/stu243, arXiv:1308.4326.
- Arur and Maccarone [2019] Arur, K., Maccarone, T.J., 2019. Nonlinear Variability of Quasi-Periodic Oscillations in GX 339-4. MNRAS doi:10.1093/mnras/stz1052, arXiv:1904.05895.
- Axelsson et al. [2005] Axelsson, M., Borgonovo, L., Larsson, S., 2005. Evolution of the 0.01-25 Hz power spectral components in Cygnus X-1. A&A 438, 999–1012. doi:10.1051/0004-6361:20042362, arXiv:astro-ph/0504446.
- Axelsson and Done [2016] Axelsson, M., Done, C., 2016. Revealing the nature of the QPO and its harmonic in GX 339-4 using frequency-resolved spectroscopy. MNRAS 458, 1778–1784. doi:10.1093/mnras/stw464, arXiv:1506.01102.
- Axelsson et al. [2014] Axelsson, M., Done, C., Hjalmarsdotter, L., 2014. An imperfect double: probing the physical origin of the low-frequency quasi-periodic oscillation and its harmonic in black hole binaries. MNRAS 438, 657–662. doi:10.1093/mnras/stt2236, arXiv:1307.4396.
- Bachetti et al. [2014] Bachetti, M. et al., 2014. An ultraluminous X-ray source powered by an accreting neutron star. Nature 514, 202–204. doi:10.1038/nature13791, arXiv:1410.3590.
- Bailyn et al. [1995] Bailyn, C.D., Orosz, J.A., McClintock, J.E., Remillard, R.A., 1995. Dynamical evidence for a black hole in the eclipsing X-ray nova GRO J1655 - 40. Nature 378, 157–159. doi:10.1038/378157a0.
- Bakala et al. [2014] Bakala, P. et al., 2014. Power density spectra of modes of orbital motion in strongly curved space-time: obtaining the observable signal. MNRAS 439, 1933–1939. doi:10.1093/mnras/stu076, arXiv:1401.4468.
- Balbus and Hawley [1991] Balbus, S.A., Hawley, J.F., 1991. A powerful local shear instability in weakly magnetized disks. I - Linear analysis. II - Nonlinear evolution. ApJ 376, 214–233. doi:10.1086/170270.
- Banerjee et al. [2019] Banerjee, S., Chakraborty, C., Bhattacharyya, S., 2019. Alignment and precession of a black hole misaligned with its accretion disc: Application to Low Mass X-ray Binaries. arXiv e-prints , arXiv:1905.12858arXiv:1905.12858.
- Bardeen and Petterson [1975] Bardeen, J.M., Petterson, J.A., 1975. The Lense-Thirring Effect and Accretion Disks around Kerr Black Holes. ApJ 195, L65. doi:10.1086/181711.
- Bardeen et al. [1972] Bardeen, J.M., Press, W.H., Teukolsky, S.A., 1972. Rotating Black Holes: Locally Nonrotating Frames, Energy Extraction, and Scalar Synchrotron Radiation. ApJ 178, 347–370. doi:10.1086/151796.
- Beer and Podsiadlowski [2002] Beer, M.E., Podsiadlowski, P., 2002. The quiescent light curve and the evolutionary state of GRO J1655-40. MNRAS 331, 351–360. doi:10.1046/j.1365-8711.2002.05189.x, arXiv:arXiv:astro-ph/0109136.
- Belloni and Hasinger [1990] Belloni, T., Hasinger, G., 1990. An atlas of aperiodic variability in HMXB. A&A 230, 103–119.
- Belloni et al. [2005] Belloni, T., Homan, J., Casella, P., van der Klis, M., Nespoli, E., Lewin, W.H.G., Miller, J.M., Méndez, M., 2005. The evolution of the timing properties of the black-hole transient GX 339-4 during its 2002/2003 outburst. A&A 440, 207–222. doi:10.1051/0004-6361:20042457, arXiv:arXiv:astro-ph/0504577.
- Belloni et al. [2002] Belloni, T., Psaltis, D., van der Klis, M., 2002. A Unified Description of the Timing Features of Accreting X-Ray Binaries. ApJ 572, 392–406. doi:10.1086/340290, arXiv:arXiv:astro-ph/0202213.
- Belloni [2010] Belloni, T.M., 2010. States and Transitions in Black Hole Binaries. Lecture Notes in Physics 794, 53–+. doi:10.1007/978-3-540-76937-8_3, arXiv:0909.2474.
- Belloni and Altamirano [2013] Belloni, T.M., Altamirano, D., 2013. Discovery of a 34 Hz quasi-periodic oscillation in the X-ray emission of GRS 1915+105. MNRAS 432, 19–22. doi:10.1093/mnras/stt285, arXiv:1303.4934.
- Belloni et al. [2019] Belloni, T.M., Bhattacharya, D., Caccese, P., Bhalerao, V., Vadawale, S., Yadav, J.S., 2019. A variable-frequency HFQPO in GRS 1915+105 as observed with AstroSat. MNRAS 489, 1037–1043. doi:10.1093/mnras/stz2143, arXiv:1908.00437.
- Belloni and Motta [2016] Belloni, T.M., Motta, S.E., 2016. Transient Black Hole Binaries. ArXiv e-prints arXiv:1603.07872.
- Belloni et al. [2012] Belloni, T.M., Sanna, A., Méndez, M., 2012. High-frequency quasi-periodic oscillations in black hole binaries. MNRAS 426, 1701–1709. doi:10.1111/j.1365-2966.2012.21634.x, arXiv:1207.2311.
- Belloni and Stella [2014] Belloni, T.M., Stella, L., 2014. Fast Variability from Black-Hole Binaries. Space Science Reviews 183, 43–60. doi:10.1007/s11214-014-0076-0, arXiv:1407.7373.
- Benlloch et al. [2001] Benlloch, S., Wilms, J., Edelson, R., Yaqoob, T., Staubert, R., 2001. Quasi-periodic Oscillation in Seyfert Galaxies: Significance Levels. The Case of Markarian 766. The Astrophysical Journal 562, L121–L124. doi:10.1086/338252, arXiv:astro-ph/0110204.
- Boyd et al. [2000] Boyd, P.T., Smale, A.P., Homan, J., Jonker, P.G., van der Klis, M., Kuulkers, E., 2000. Canonical Timing and Spectral Behavior of LMC X-3 in the Low/Hard State. ApJ 542, L127–L130. doi:10.1086/312931, arXiv:astro-ph/0009036.
- Caballero-García et al. [2013] Caballero-García, M.D., Belloni, T., Zampieri, L., 2013. Quasi-periodic oscillations and energy spectra from the two brightest Ultra-Luminous X-ray sources in M82. MNRAS 436, 3262–3270. doi:10.1093/mnras/stt1807, arXiv:1309.6101.
- Cabanac et al. [2010] Cabanac, C., Henri, G., Petrucci, P.O., Malzac, J., Ferreira, J., Belloni, T.M., 2010. Variability of X-ray binaries from an oscillating hot corona. MNRAS 404, 738–748. doi:10.1111/j.1365-2966.2010.16340.x, arXiv:1001.2116.
- Casella et al. [2004] Casella, P., Belloni, T., Homan, J., Stella, L., 2004. A study of the low-frequency quasi-periodic oscillations in the X-ray light curves of the black hole candidate ¡ASTROBJ¿XTE J1859+226¡/ASTROBJ¿. A&A 426, 587–600. doi:10.1051/0004-6361:20041231, arXiv:arXiv:astro-ph/0407262.
- Casella et al. [2005] Casella, P., Belloni, T., Stella, L., 2005. The ABC of Low-Frequency Quasi-periodic Oscillations in Black Hole Candidates: Analogies with Z Sources. ApJ 629, 403–407. doi:10.1086/431174, arXiv:arXiv:astro-ph/0504318.
- Chakrabarti et al. [2008] Chakrabarti, S.K., Debnath, D., Nandi, A., Pal, P.S., 2008. Evolution of the quasi-periodic oscillation frequency in GRO J1655-40 - Implications for accretion disk dynamics. A&A 489, L41–L44. doi:10.1051/0004-6361:200810136, arXiv:0809.0876.
- Chakraborty and Bhattacharyya [2017] Chakraborty, C., Bhattacharyya, S., 2017. A tilted and warped inner accretion disc around a spinning black hole: an analytical solution. MNRAS 469, 3062–3068. doi:10.1093/mnras/stx1088, arXiv:1705.01850.
- Chen et al. [1993] Chen, W., Livio, M., Gehrels, N., 1993. The secondary maxima in black hole X-ray nova light curves - Clues toward a complete picture. ApJ 408, L5–L8. doi:10.1086/186817.
- Chen et al. [1997] Chen, W., Shrader, C.R., Livio, M., 1997. The Properties of X-Ray and Optical Light Curves of X-Ray Novae. ApJ 491, 312–338. doi:10.1086/304921, arXiv:astro-ph/9707138.
- Corbel et al. [2005] Corbel, S., Kaaret, P., Fender, R.P., Tzioumis, A.K., Tomsick, J.A., Orosz, J.A., 2005. Discovery of X-Ray Jets in the Microquasar H1743-322. ApJ 632, 504–513. doi:10.1086/432499, arXiv:arXiv:astro-ph/0505526.
- De Falco and Motta [2018] De Falco, V., Motta, S., 2018. Polynomial approximation of the Lense-Thirring rigid precession frequency. MNRAS 476, 2040–2044. doi:10.1093/mnras/sty361, arXiv:1802.02866.
- de Ruiter et al. [2019] de Ruiter, I., van den Eijnden, J., Ingram, A., Uttley, P., 2019. A systematic study of the phase difference between QPO harmonics in black hole X-ray binaries. MNRAS 485, 3834–3844. doi:10.1093/mnras/stz665, arXiv:1903.03135.
- Debnath et al. [2014] Debnath, D., Chakrabarti, S.K., Mondal, S., 2014. Implementation of two-component advective flow solution in XSPEC. MNRAS 440, L121–L125. doi:10.1093/mnrasl/slu024, arXiv:1402.0989.
- Done et al. [2007] Done, C., Gierlinski, M., Kubota, A., 2007. Modelling the behaviour of accretion flows in X-ray binaries. Everything you always wanted to know about accretion but were afraid to ask. A&A 15, 1–66. doi:10.1007/s00159-007-0006-1, arXiv:0708.0148.
- Dunn et al. [2010] Dunn, R.J.H., Fender, R.P., Körding, E.G., Belloni, T., Cabanac, C., 2010. A global spectral study of black hole X-ray binaries. MNRAS 403, 61–82. doi:10.1111/j.1365-2966.2010.16114.x, arXiv:0912.0142.
- Durant et al. [2009] Durant, M., Gandhi, P., Shahbaz, T., Peralta, H.H., Dhillon, V.S., 2009. Multiwavelength spectral and high time resolution observations of SWIFTJ1753.5-0127: new activity? MNRAS 392, 309–324. doi:10.1111/j.1365-2966.2008.14044.x, arXiv:0810.1141.
- Eardley et al. [1975] Eardley, D.M., Lightman, A.P., Shapiro, S.L., 1975. Cygnus X-1 - A two-temperature accretion disk model which explains the observed hard X-ray spectrum. ApJ 199, L153–L155. doi:10.1086/181871.
- Fabian et al. [1975] Fabian, A.C., Pringle, J.E., Rees, M.J., 1975. Tidal capture formation of binary systems and X-ray sources in globular clusters. MNRAS 172, 15. doi:10.1093/mnras/172.1.15P.
- Fabian et al. [1989] Fabian, A.C., Rees, M.J., Stella, L., White, N.E., 1989. X-ray fluorescence from the inner disc in Cygnus X-1. MNRAS 238, 729–736.
- Fender et al. [1999] Fender, R. et al., 1999. Quenching of the Radio Jet during the X-Ray High State of GX 339-4. ApJ 519, L165–L168. doi:10.1086/312128, arXiv:astro-ph/9905121.
- Fender et al. [2004] Fender, R.P., Belloni, T.M., Gallo, E., 2004. Towards a unified model for black hole X-ray binary jets. MNRAS 355, 1105–1118. doi:10.1111/j.1365-2966.2004.08384.x, arXiv:arXiv:astro-ph/0409360.
- Fender et al. [2009] Fender, R.P., Homan, J., Belloni, T.M., 2009. Jets from black hole X-ray binaries: testing, refining and extending empirical models for the coupling to X-rays. MNRAS 396, 1370–1382. doi:10.1111/j.1365-2966.2009.14841.x, arXiv:0903.5166.
- Fragile [2009] Fragile, P.C., 2009. Effective Inner Radius of Tilted Black Hole Accretion Disks. ApJ 706, L246–L250. doi:10.1088/0004-637X/706/2/L246, arXiv:0910.5721.
- Fragile et al. [2007] Fragile, P.C., Blaes, O.M., Anninos, P., Salmonson, J.D., 2007. Global General Relativistic Magnetohydrodynamic Simulation of a Tilted Black Hole Accretion Disk. ApJ 668, 417–429. doi:10.1086/521092, arXiv:0706.4303.
- Fragile et al. [2001] Fragile, P.C., Mathews, G.J., Wilson, J.R., 2001. Bardeen-Petterson Effect and Quasi-periodic Oscillations in X-Ray Binaries. ApJ 553, 955–959. doi:10.1086/320990, arXiv:astro-ph/0007478.
- Fragile et al. [2016] Fragile, P.C., Straub, O., Blaes, O., 2016. High-Frequency and Type-C QPOs from Oscillating, Precessing Hot, Thick Flow. ArXiv e-prints arXiv:1602.08082.
- Fragos et al. [2010] Fragos, T., Tremmel, M., Rantsiou, E., Belczynski, K., 2010. Black Hole Spin-Orbit Misalignment in Galactic X-ray Binaries. ApJ 719, L79–L83. doi:10.1088/2041-8205/719/1/L79, arXiv:1001.1107.
- Franchini et al. [2017] Franchini, A., Motta, S.E., Lodato, G., 2017. Constraining black hole spins with low-frequency quasi-periodic oscillations in soft states. MNRAS 467, 145–154. doi:10.1093/mnras/stw3363, arXiv:1701.01760.
- Frank et al. [2002] Frank, J., King, A., Raine, D.J., 2002. Accretion Power in Astrophysics: Third Edition. Cambridge University Press.
- Fürst et al. [2016] Fürst, F. et al., 2016. Discovery of Coherent Pulsations from the Ultraluminous X-Ray Source NGC 7793 P13. ApJ 831, L14. doi:10.3847/2041-8205/831/2/L14, arXiv:1609.07129.
- Galeev et al. [1979] Galeev, A.A., Rosner, R., Vaiana, G.S., 1979. Structured coronae of accretion disks. ApJ 229, 318–326. doi:10.1086/156957.
- Gandhi et al. [2010] Gandhi, P. et al., 2010. Rapid optical and X-ray timing observations of GX339-4: multicomponent optical variability in the low/hard state. MNRAS 407, 2166–2192. doi:10.1111/j.1365-2966.2010.17083.x, arXiv:1005.4685.
- García et al. [2013] García, J., Dauser, T., Reynolds, C.S., Kallman, T.R., McClintock, J.E., Wilms, J., Eikmann, W., 2013. X-Ray Reflected Spectra from Accretion Disk Models. III. A Complete Grid of Ionized Reflection Calculations. ApJ 768, 146. doi:10.1088/0004-637X/768/2/146, arXiv:1303.2112.
- García and Kallman [2010] García, J., Kallman, T.R., 2010. X-ray Reflected Spectra from Accretion Disk Models. I. Constant Density Atmospheres. ApJ 718, 695–706. doi:10.1088/0004-637X/718/2/695, arXiv:1006.0485.
- García et al. [2015] García, J.A., Steiner, J.F., McClintock, J.E., Remillard, R.A., Grinberg, V., Dauser, T., 2015. X-Ray Reflection Spectroscopy of the Black Hole GX 339–4: Exploring the Hard State with Unprecedented Sensitivity. ApJ 813, 84. doi:10.1088/0004-637X/813/2/84, arXiv:1505.03607.
- Gierliński et al. [2008] Gierliński, M., Middleton, M., Ward, M., Done, C., 2008. A periodicity of 1hour in X-ray emission from the active galaxy RE J1034+396. Nature 455, 369–371. doi:10.1038/nature07277.
- Gierliński and Zdziarski [2005] Gierliński, M., Zdziarski, A.A., 2005. Patterns of energy-dependent variability from Comptonization. MNRAS 363, 1349–1360. doi:10.1111/j.1365-2966.2005.09527.x, arXiv:arXiv:astro-ph/0506388.
- Gilfanov et al. [2000] Gilfanov, M., Churazov, E., Revnivtsev, M., 2000. Frequency-resolved spectroscopy of Cyg X-1: fast variability of the reflected emission in the soft state. MNRAS 316, 923–928. doi:10.1046/j.1365-8711.2000.03686.x, arXiv:astro-ph/0001450.
- Greene et al. [2001] Greene, J., Bailyn, C.D., Orosz, J.A., 2001. Optical and Infrared Photometry of the Microquasar GRO J1655-40 in Quiescence. ApJ 554, 1290–1297. doi:10.1086/321411, arXiv:arXiv:astro-ph/0101337.
- Haardt and Maraschi [1991] Haardt, F., Maraschi, L., 1991. A two-phase model for the X-ray emission from Seyfert galaxies. ApJ 380, L51–L54. doi:10.1086/186171.
- Hasinger and van der Klis [1989] Hasinger, G., van der Klis, M., 1989. Two patterns of correlated X-ray timing and spectral behaviour in low-mass X-ray binaries. A&A 225, 79–96.
- Heil et al. [2015] Heil, L.M., Uttley, P., Klein-Wolt, M., 2015. Inclination-dependent spectral and timing properties in transient black hole X-ray binaries. MNRAS 448, 3348–3353. doi:10.1093/mnras/stv240, arXiv:1405.2026.
- Heil et al. [2011] Heil, L.M., Vaughan, S., Uttley, P., 2011. Quasi-periodic oscillations in XTE J1550-564: the rms-flux relation. MNRAS 411, L66–L70. doi:10.1111/j.1745-3933.2010.00997.x, arXiv:1011.6321.
- Hiemstra et al. [2011] Hiemstra, B., Méndez, M., Done, C., Díaz Trigo, M., Altamirano, D., Casella, P., 2011. A strong and broad Fe line in the XMM-Newton spectrum of the new X-ray transient and black hole candidate XTE J1652-453. MNRAS 411, 137–150. doi:10.1111/j.1365-2966.2010.17661.x, arXiv:1004.4442.
- Hjellming and Rupen [1995] Hjellming, R.M., Rupen, M.P., 1995. Episodic ejection of relativistic jets by the X-ray transient GRO J1655 - 40. Nature 375, 464–468. doi:10.1038/375464a0.
- Homan [2001] Homan, J., 2001. X-ray timing studies of low-mass x-ray binaries. Ph.D. thesis. University of Amsterdam.
- Homan et al. [2005] Homan, J., Buxton, M., Markoff, S., Bailyn, C.D., Nespoli, E., Belloni, T., 2005. Multiwavelength Observations of the 2002 Outburst of GX 339-4: Two Patterns of X-Ray-Optical/Near-Infrared Behavior. ApJ 624, 295–306. doi:10.1086/428722, arXiv:arXiv:astro-ph/0501349.
- Homan et al. [2001] Homan, J., Wijnands, R., van der Klis, M., Belloni, T., van Paradijs, J., Klein-Wolt, M., Fender, R., Méndez, M., 2001. Correlated X-Ray Spectral and Timing Behavior of the Black Hole Candidate XTE J1550-564: A New Interpretation of Black Hole States. ApJ 132, 377–402. doi:10.1086/318954, arXiv:arXiv:astro-ph/0001163.
- Huang et al. [2018] Huang, Y. et al., 2018. INSIGHT-HXMT Observations of the New Black Hole Candidate MAXI J1535-571: Timing Analysis. ApJ 866, 122. doi:10.3847/1538-4357/aade4c, arXiv:1808.05318.
- Huppenkothen et al. [2017] Huppenkothen, D. et al., 2017. Detection of Very Low-frequency, Quasi-periodic Oscillations in the 2015 Outburst of V404 Cygni. ApJ 834, 90. doi:10.3847/1538-4357/834/1/90, arXiv:1610.08653.
- Hynes et al. [2003a] Hynes, R. I. et al., 2003a. The remarkable rapid X-ray, ultraviolet, optical and infrared variability in the black hole XTE J1118+480. Monthly Notices of the Royal Astronomical Society 345, 292–310. doi:10.1046/j.1365-8711.2003.06938.x, arXiv:astro-ph/0306626.
- Hynes et al. [2003b] Hynes, R.I., Steeghs, D., Casares, J., Charles, P.A., O’Brien, K., 2003b. Dynamical Evidence for a Black Hole in GX 339-4. ApJ 583, L95–L98. doi:10.1086/368108, arXiv:arXiv:astro-ph/0301127.
- Ichimaru [1977] Ichimaru, S., 1977. Bimodal behavior of accretion disks - Theory and application to Cygnus X-1 transitions. ApJ 214, 840–855. doi:10.1086/155314.
- Imamura et al. [1990] Imamura, J.N., Kristian, J., Middleditch, J., Steiman-Cameron, T.Y., 1990. The 8 Second Optical Quasi-periodic Oscillations in GX 339-4. The Astrophysical Journal 365, 312. doi:10.1086/169484.
- Ingram and Done [2010] Ingram, A., Done, C., 2010. A physical interpretation of the variability power spectral components in accreting neutron stars. MNRAS 405, 2447–2452. doi:10.1111/j.1365-2966.2010.16614.x, arXiv:0907.5485.
- Ingram and Done [2011] Ingram, A., Done, C., 2011. A physical model for the continuum variability and quasi-periodic oscillation in accreting black holes. MNRAS 415, 2323–2335. doi:10.1111/j.1365-2966.2011.18860.x, arXiv:1101.2336.
- Ingram and Done [2012a] Ingram, A., Done, C., 2012a. Modelling variability in black hole binaries: linking simulations to observations. MNRAS 419, 2369–2378. doi:10.1111/j.1365-2966.2011.19885.x, arXiv:1108.0789.
- Ingram and Done [2012b] Ingram, A., Done, C., 2012b. The effect of frame dragging on the iron K line in X-ray binaries. MNRAS 427, 934–947. doi:10.1111/j.1365-2966.2012.21907.x, arXiv:1208.0728.
- Ingram et al. [2009] Ingram, A., Done, C., Fragile, P.C., 2009. Low-frequency quasi-periodic oscillations spectra and Lense-Thirring precession. MNRAS 397, L101–L105. doi:10.1111/j.1745-3933.2009.00693.x.
- Ingram et al. [2015] Ingram, A., Maccarone, T.J., Poutanen, J., Krawczynski, H., 2015. Polarization Modulation from Lense-Thirring Precession in X-Ray Binaries. ApJ 807, 53. doi:10.1088/0004-637X/807/1/53, arXiv:1505.00015.
- Ingram et al. [2019] Ingram, A., Mastroserio, G., Dauser, T., Hovenkamp, P., van der Klis, M., García, J.A., 2019. A public relativistic transfer function model for X-ray reverberation mapping of accreting black holes. MNRAS 488, 324–347. doi:10.1093/mnras/stz1720, arXiv:1906.08310.
- Ingram and Motta [2014] Ingram, A., Motta, S., 2014. Solutions to the relativistic precession model. MNRAS 444, 2065–2070. doi:10.1093/mnras/stu1585, arXiv:1408.0884.
- Ingram and van der Klis [2015] Ingram, A., van der Klis, M., 2015. Phase-resolved spectroscopy of low-frequency quasi-periodic oscillations in GRS 1915+105. MNRAS 446, 3516–3525. doi:10.1093/mnras/stu2373, arXiv:1411.1967.
- Ingram et al. [2017] Ingram, A., van der Klis, M., Middleton, M., Altamirano, D., Uttley, P., 2017. Tomographic reflection modelling of quasi-periodic oscillations in the black hole binary H 1743-322. MNRAS 464, 2979–2991. doi:10.1093/mnras/stw2581, arXiv:1610.00948.
- Ingram et al. [2016] Ingram, A., van der Klis, M., Middleton, M., Done, C., Altamirano, D., Heil, L., Uttley, P., Axelsson, M., 2016. A quasi-periodic modulation of the iron line centroid energy in the black hole binary H1743-322. MNRAS 461, 1967–1980. doi:10.1093/mnras/stw1245, arXiv:1607.02866.
- Ingram and van der Klis [2013] Ingram, A., van der Klis, M.v.d., 2013. An exact analytic treatment of propagating mass accretion rate fluctuations in X-ray binaries. MNRAS 434, 1476–1485. doi:10.1093/mnras/stt1107, arXiv:1306.3823.
- Ingram and Maccarone [2017] Ingram, A.R., Maccarone, T.J., 2017. An observational method for fast stochastic X-ray polarimetry timing. MNRAS 471, 4206–4217. doi:10.1093/mnras/stx1881, arXiv:1707.06659.
- Israel et al. [2017a] Israel, G. L. et al., 2017a. An accreting pulsar with extreme properties drives an ultraluminous x-ray source in NGC 5907. Science 355, 817–819. doi:10.1126/science.aai8635, arXiv:1609.07375.
- Israel et al. [2017b] Israel, G. L. et al., 2017b. Discovery of a 0.42-s pulsar in the ultraluminous X-ray source NGC 7793 P13. MNRAS 466, L48–L52. doi:10.1093/mnrasl/slw218, arXiv:1609.06538.
- Ivanov and Illarionov [1997] Ivanov, P.B., Illarionov, A.F., 1997. The oscillatory shape of the stationary twisted disc around a Kerr black hole. MNRAS 285, 394–402. doi:10.1093/mnras/285.2.394.
- Jonker et al. [1999] Jonker, P.G., van der Klis, M., Wijnands, R., 1999. A Persistent ~1 HZ Quasi-periodic Oscillation in the Dipping Low-Mass X-Ray Binary 4U 1323-62. ApJ 511, L41–L44. doi:10.1086/311840, arXiv:astro-ph/9811404.
- Kalamkar et al. [2015] Kalamkar, M., Casella, P., Uttley, P., O’Brien, K., Russell, D., Maccarone, T., van der Klis, M., Vincentelli, F., 2015. Detection of the first infra-red quasi periodic oscillation in a black hole X-ray binary. ArXiv e-prints arXiv:1510.08907.
- Kara et al. [2019] Kara, E. et al., 2019. The corona contracts in a black-hole transient. Nature 565, 198–201. doi:10.1038/s41586-018-0803-x, arXiv:1901.03877.
- Karas et al. [2001] Karas, V., Martocchia, A., Subr, L., 2001. Variable Line Profiles Due to Non-Axisymmetric Patterns in an Accretion Disc around a Rotating Black Hole. PASJ 53, 189–199. doi:10.1093/pasj/53.2.189, arXiv:astro-ph/0102460.
- Kato [2001] Kato, S., 2001. Basic Properties of Thin-Disk Oscillations 1. PASJ 53, 1–24. doi:10.1093/pasj/53.1.1.
- Kato [2004] Kato, S., 2004. Resonant Excitation of Disk Oscillations by Warps: A Model of kHz QPOs. PASJ 56, 905–922. doi:10.1093/pasj/56.5.905, arXiv:astro-ph/0409051.
- Kato and Fukue [1980] Kato, S., Fukue, J., 1980. Trapped Radial Oscillations of Gaseous Disks around a Black Hole. PASJ 32, 377.
- Kerr [1963] Kerr, R.P., 1963. Gravitational Field of a Spinning Mass as an Example of Algebraically Special Metrics. Physical Review Letters 11, 237–238. doi:10.1103/PhysRevLett.11.237.
- Kim and Powers [1979] Kim, Y.C., Powers, E.J., 1979. Digital bispectral analysis and its applications to nonlinear wave interactions. IEEE Transactions on Plasma Science 7, 120–131. doi:10.1109/TPS.1979.4317207.
- King and Nixon [2016] King, A., Nixon, C., 2016. Black holes in stellar-mass binary systems: expiating original spin? MNRAS 462, 464–467. doi:10.1093/mnras/stw1598, arXiv:1607.02144.
- Kumar and Pringle [1985] Kumar, S., Pringle, J.E., 1985. Twisted accretion discs - The Bardeen-Petterson effect. MNRAS 213, 435–442. doi:10.1093/mnras/213.3.435.
- Kuulkers et al. [1995] Kuulkers, E., van der Klis, M., van Paradijs, J., 1995. Burstlike Events in the Z Source Cygnus X-2. The Astrophysical Journal 450, 748. doi:10.1086/176180.
- Kylafis and Belloni [2015] Kylafis, N.D., Belloni, T.M., 2015. Accretion and ejection in black-hole X-ray transients. A&A 574, A133. doi:10.1051/0004-6361/201425106, arXiv:1412.7662.
- Lachowicz and Done [2010] Lachowicz, P., Done, C., 2010. Quasi-periodic oscillations under wavelet microscope: the application of Matching Pursuit algorithm. A&A 515, A65+. doi:10.1051/0004-6361/200913144, arXiv:0908.2740.
- Lense and Thirring [1918] Lense, J., Thirring, H., 1918. Über den Einfluß der Eigenrotation der Zentralkörper auf die Bewegung der Planeten und Monde nach der Einsteinschen Gravitationstheorie. Physikalische Zeitschrift 19, 156.
- Lewin et al. [1988] Lewin, W.H.G., van Paradijs, J., van der Klis, M., 1988. A review of quasi-periodic oscillations in low-mass X-ray binaries. Space Science Reviews 46, 273–377. doi:10.1007/BF00212242.
- Lightman and Rybicki [1980] Lightman, A.P., Rybicki, G.B., 1980. Inverse Compton reflection - The steady-state theory. ApJ 236, 928–944. doi:10.1086/157820.
- Lin et al. [2009] Lin, D., Altamirano, D., Homan, J., Remillard, R.A., Wijnands, R., Belloni, T., 2009. Type I X-ray Bursts from the Neutron-star Transient XTE J1701-462. ApJ 699, 60–65. doi:10.1088/0004-637X/699/1/60, arXiv:0904.2187.
- Liska et al. [2018] Liska, M., Hesp, C., Tchekhovskoy, A., Ingram, A., van der Klis, M., Markoff, S., 2018. Formation of precessing jets by tilted black hole discs in 3D general relativistic MHD simulations. MNRAS 474, L81–L85. doi:10.1093/mnrasl/slx174, arXiv:1707.06619.
- Liska et al. [2019a] Liska, M., Hesp, C., Tchekhovskoy, A., Ingram, A., van der Klis, M., Markoff, S.B., 2019a. A Phase Lag between Disk and Corona in GRMHD Simulations of Precessing Tilted Accretion Disks. arXiv e-prints , arXiv:1901.05970arXiv:1901.05970.
- Liska et al. [2019b] Liska, M., Hesp, C., Tchekhovskoy, A., Ingram, A., van der Klis, M., Markoff, S.B., Van Moer, M., 2019b. Disc Tearing and Bardeen-Petterson Alignment in GRMHD Simulations of Highly Tilted Thin Accretion Discs. arXiv e-prints , arXiv:1904.08428arXiv:1904.08428.
- Liska et al. [2019c] Liska, M., Tchekhovskoy, A., Ingram, A., van der Klis, M., 2019c. Bardeen-Petterson alignment, jets, and magnetic truncation in GRMHD simulations of tilted thin accretion discs. MNRAS 487, 550–561. doi:10.1093/mnras/stz834.
- Liu and Melia [2002] Liu, S., Melia, F., 2002. Spin-induced Disk Precession in the Supermassive Black Hole at the Galactic Center. ApJ 573, L23–L26. doi:10.1086/341991, arXiv:astro-ph/0205487.
- Lodato and Price [2010] Lodato, G., Price, D.J., 2010. On the diffusive propagation of warps in thin accretion discs. MNRAS 405, 1212–1226. doi:10.1111/j.1365-2966.2010.16526.x, arXiv:1002.2973.
- Lubow and Ogilvie [2000] Lubow, S.H., Ogilvie, G.I., 2000. On the Tilting of Protostellar Disks by Resonant Tidal Effects. ApJ 538, 326–340. doi:10.1086/309101, arXiv:astro-ph/0003028.
- Lubow et al. [2002] Lubow, S.H., Ogilvie, G.I., Pringle, J.E., 2002. The evolution of a warped disc around a Kerr black hole. MNRAS 337, 706–712. doi:10.1046/j.1365-8711.2002.05949.x, arXiv:astro-ph/0208206.
- Luminet [1979] Luminet, J.P., 1979. Image of a spherical black hole with thin accretion disk. A&A 75, 228–235.
- Lyubarskii [1997] Lyubarskii, Y.E., 1997. Flicker noise in accretion discs. MNRAS 292, 679. doi:10.1093/mnras/292.3.679.
- Maccarone [2002] Maccarone, T.J., 2002. On the misalignment of jets in microquasars. MNRAS 336, 1371–1376. doi:10.1046/j.1365-8711.2002.05876.x, arXiv:astro-ph/0209105.
- Maccarone [2005] Maccarone, T.J., 2005. Constraints on jet X-ray emission in low/hard-state X-ray binaries. MNRAS 360, L68–L72. doi:10.1111/j.1745-3933.2005.00047.x, arXiv:arXiv:astro-ph/0503689.
- Maccarone [2013] Maccarone, T.J., 2013. The biphase explained: understanding the asymmetries in coupled Fourier components of astronomical time series. MNRAS 435, 3547–3558. doi:10.1093/mnras/stt1546, arXiv:1308.3150.
- Maccarone et al. [2011] Maccarone, T.J., Uttley, P., van der Klis, M., Wijnands, R.A.D., Coppi, P.S., 2011. Coupling between QPOs and broad-band noise components in GRS 1915+105. MNRAS 413, 1819–1827. doi:10.1111/j.1365-2966.2011.18273.x, arXiv:1101.1979.
- Machida and Matsumoto [2008] Machida, M., Matsumoto, R., 2008. Excitation of Low-Frequency QPOs in Black-Hole Accretion Flows. PASJ 60, 613–626. doi:10.1093/pasj/60.3.613, arXiv:0802.3779.
- Madejski et al. [1993] Madejski, G.M., Done, C., Turner, T.J., Mushotzky, R.F., Serlemitsos, P., Fiore, F., Sikora, M., Begelman, M.C., 1993. Solving the mystery of the X-ray periodicity in the Seyfert galaxy NGC6814. Nature 365, 626–628. doi:10.1038/365626a0.
- Mancuso et al. [2019] Mancuso, G.C., Altamirano, D., García, F., Lyu, M., Méndez, M., Combi, J.A., Díaz-Trigo, M., in’t Zand, J.J.M., 2019. Discovery of millihertz quasi-periodic oscillations in the X-ray binary EXO 0748-676. Monthly Notices of the Royal Astronomical Society 486, L74–L79. doi:10.1093/mnrasl/slz057, arXiv:1905.01956.
- Martin et al. [2008] Martin, R.G., Tout, C.A., Pringle, J.E., 2008. Alignment time-scale of the microquasar GRO J1655-40. MNRAS 387, 188–196. doi:10.1111/j.1365-2966.2008.13148.x, arXiv:0802.3912.
- Mastroserio et al. [2018] Mastroserio, G., Ingram, A., van der Klis, M., 2018. Multi-time-scale X-ray reverberation mapping of accreting black holes. MNRAS 475, 4027–4042. doi:10.1093/mnras/sty075, arXiv:1801.03100.
- Méndez et al. [2013] Méndez, M., Altamirano, D., Belloni, T., Sanna, A., 2013. The phase lags of high-frequency quasi-periodic oscillations in four black hole candidates. MNRAS doi:10.1093/mnras/stt1431, arXiv:1308.0142.
- Merloni et al. [1999] Merloni, A., Vietri, M., Stella, L., Bini, D., 1999. On gravitomagnetic precession around black holes. MNRAS 304, 155–159. doi:10.1046/j.1365-8711.1999.02307.x, arXiv:astro-ph/9811198.
- Middleditch and Priedhorsky [1986] Middleditch, J., Priedhorsky, W.C., 1986. Discovery of rapid quasi-periodic oscillations in Scorpius X-1. ApJ 306, 230–237. doi:10.1086/164335.
- Middleton and Done [2010] Middleton, M., Done, C., 2010. The X-ray binary analogy to the first AGN quasi-periodic oscillation. Monthly Notices of the Royal Astronomical Society 403, 9–16. doi:10.1111/j.1365-2966.2009.15969.x.
- Miller [1999] Miller, M.C., 1999. Effects of Radiation Forces on the Frequency of Gravitomagnetic Precession near Neutron Stars. ApJ 520, 256–261. doi:10.1086/307420, arXiv:astro-ph/9801295.
- Miller-Jones et al. [2019] Miller-Jones, J. C. A. et al., 2019. A rapidly changing jet orientation in the stellar-mass black-hole system V404 Cygni. Nature 569, 374–377. doi:10.1038/s41586-019-1152-0.
- Mirabel [2017] Mirabel, F., 2017. The formation of stellar black holes. New Astronomy Reviews 78, 1–15. doi:10.1016/j.newar.2017.04.002.
- Mittaz and Branduardi-Raymont [1989] Mittaz, J.P.D., Branduardi-Raymont, G., 1989. The flux and spectral variability of NGC 6814 as observed with EXOSAT. Monthly Notices of the Royal Astronomical Society 238, 1029–1046. doi:10.1093/mnras/238.3.1029.
- Miyamoto et al. [1991] Miyamoto, S., Kimura, K., Kitamoto, S., Dotani, T., Ebisawa, K., 1991. X-ray variability of GX 339 - 4 in its very high state. ApJ 383, 784–807. doi:10.1086/170837.
- Miyamoto and Kitamoto [1991] Miyamoto, S., Kitamoto, S., 1991. A jet model for a very high state of GX 339 - 4. ApJ 374, 741–743. doi:10.1086/170158.
- Miyamoto et al. [1995] Miyamoto, S., Kitamoto, S., Hayashida, K., Egoshi, W., 1995. Large Hysteretic Behavior of Stellar Black Hole Candidate X-Ray Binaries. The Astrophysical Journal 442, L13. doi:10.1086/187804.
- Miyamoto et al. [1992] Miyamoto, S., Kitamoto, S., Iga, S., Negoro, H., Terada, K., 1992. Canonical time variations of X-rays from black hole candidates in the low-intensity state. ApJ 391, L21–L24. doi:10.1086/186389.
- Molteni et al. [1996] Molteni, D., Sponholz, H., Chakrabarti, S.K., 1996. Resonance Oscillation of Radiative Shock Waves in Accretion Disks around Compact Objects. ApJ 457, 805. doi:10.1086/176775, arXiv:astro-ph/9508022.
- Morgan et al. [1997] Morgan, E.H., Remillard, R.A., Greiner, J., 1997. RXTE Observations of QPOs in the Black Hole Candidate GRS 1915+105. ApJ 482, 993–+. doi:10.1086/304191.
- Morsink and Stella [1999] Morsink, S.M., Stella, L., 1999. Relativistic Precession around Rotating Neutron Stars: Effects Due to Frame Dragging and Stellar Oblateness. ApJ 513, 827–844. doi:10.1086/306876, arXiv:astro-ph/9808227.
- Motch et al. [1983] Motch, C., Ricketts, M.J., Page, C.G., Ilovaisky, S.A., Chevalier, C., 1983. Simultaneous X-ray/optical observations of GX339-4 during the May 1981 optically bright state. A&A 119, 171–176.
- Motta et al. [2011a] Motta, S. et al., 2011a. X-ray bursts and burst oscillations from the slowly spinning X-ray pulsar IGR J17480-2446 (Terzan 5). MNRAS 414, 1508–1516. doi:10.1111/j.1365-2966.2011.18483.x, arXiv:1102.1368.
- Motta et al. [2012] Motta, S., Homan, J., Muñoz Darias, T., Casella, P., Belloni, T.M., Hiemstra, B., Méndez, M., 2012. Discovery of two simultaneous non-harmonically related quasi-periodic oscillations in the 2005 outburst of the black hole binary GRO J1655-40. MNRAS 427, 595–606. doi:10.1111/j.1365-2966.2012.22037.x, arXiv:1209.0327.
- Motta et al. [2011b] Motta, S., Muñoz-Darias, T., Casella, P., Belloni, T., Homan, J., 2011b. Low-frequency oscillations in black holes: a spectral-timing approach to the case of GX 339-4. MNRAS 418, 2292–2307. doi:10.1111/j.1365-2966.2011.19566.x, arXiv:1108.0540.
- Motta et al. [2014a] Motta, S.E., Belloni, T.M., Stella, L., Muñoz-Darias, T., Fender, R., 2014a. Precise mass and spin measurements for a stellar-mass black hole through X-ray timing: the case of GRO J1655-40. MNRAS 437, 2554–2565. doi:10.1093/mnras/stt2068, arXiv:1309.3652.
- Motta et al. [2015] Motta, S.E., Casella, P., Henze, M., Muñoz-Darias, T., Sanna, A., Fender, R., Belloni, T., 2015. Geometrical constraints on the origin of timing signals from black holes. MNRAS 447, 2059–2072. doi:10.1093/mnras/stu2579, arXiv:1404.7293.
- Motta et al. [2018] Motta, S.E., Franchini, A., Lodato, G., Mastroserio, G., 2018. On the different flavours of Lense-Thirring precession around accreting stellar mass black holes. MNRAS 473, 431–439. doi:10.1093/mnras/stx2358, arXiv:1709.02608.
- Motta et al. [2014b] Motta, S.E., Muñoz-Darias, T., Sanna, A., Fender, R., Belloni, T., Stella, L., 2014b. Black hole spin measurements through the relativistic precession model: XTE J1550-564. MNRAS doi:10.1093/mnrasl/slt181, arXiv:1312.3114.
- Motta et al. [2017] Motta, S.E., Rouco-Escorial, A., Kuulkers, E., Muñoz-Darias, T., Sanna, A., 2017. Links between quasi-periodic oscillations and accretion states in neutron star low mass X-ray binaries. ArXiv e-prints arXiv:1703.01263.
- Muñoz-Darias et al. [2014] Muñoz-Darias, T., Fender, R.P., Motta, S.E., Belloni, T.M., 2014. Black hole-like hysteresis and accretion states in neutron star low-mass X-ray binaries. MNRAS 443, 3270–3283. doi:10.1093/mnras/stu1334, arXiv:1407.1318.
- Muñoz-Darias et al. [2011] Muñoz-Darias, T., Motta, S., Stiele, H., Belloni, T.M., 2011. The black hole candidate MAXI J1659-152: spectral and timing analysis during its 2010 outburst. MNRAS 415, 292–300. doi:10.1111/j.1365-2966.2011.18702.x, arXiv:1103.2309.
- Mucciarelli et al. [2006] Mucciarelli, P., Casella, P., Belloni, T., Zampieri, L., Ranalli, P., 2006. A variable Quasi-Periodic Oscillation in M82 X-1. Timing and spectral analysis of XMM-Newton and RossiXTE observations. MNRAS 365, 1123–1130. doi:10.1111/j.1365-2966.2005.09754.x, arXiv:astro-ph/0509796.
- Nealon et al. [2015] Nealon, R., Price, D.J., Nixon, C.J., 2015. On the Bardeen-Petterson effect in black hole accretion discs. MNRAS 448, 1526–1540. doi:10.1093/mnras/stv014, arXiv:1501.01687.
- Nelson and Papaloizou [2000] Nelson, R.P., Papaloizou, J.C.B., 2000. Hydrodynamic simulations of the Bardeen-Petterson effect. MNRAS 315, 570–586. doi:10.1046/j.1365-8711.2000.03478.x, arXiv:astro-ph/0001439.
- Nespoli et al. [2003] Nespoli, E., Belloni, T., Homan, J., Miller, J.M., Lewin, W.H.G., Méndez, M., van der Klis, M., 2003. A transient variable 6 Hz QPO from GX 339-4. A&A 412, 235–240. doi:10.1051/0004-6361:20031423, arXiv:arXiv:astro-ph/0309437.
- Nixon and King [2016] Nixon, C., King, A., 2016. Warp Propagation in Astrophysical Discs. volume 905. p. 45. doi:10.1007/978-3-319-19416-5_2.
- Nixon et al. [2012] Nixon, C., King, A., Price, D., Frank, J., 2012. Tearing up the Disk: How Black Holes Accrete. ApJ 757, L24. doi:10.1088/2041-8205/757/2/L24, arXiv:1209.1393.
- Novikov and Thorne [1973] Novikov, I.D., Thorne, K.S., 1973. Astrophysics of black holes., in: Dewitt, C., Dewitt, B.S. (Eds.), Black Holes (Les Astres Occlus), Gordon and Breach, New York. pp. 343–450.
- Ogilvie [1999] Ogilvie, G.I., 1999. The non-linear fluid dynamics of a warped accretion disc. MNRAS 304, 557–578. doi:10.1046/j.1365-8711.1999.02340.x, arXiv:astro-ph/9812073.
- Okazaki et al. [1987] Okazaki, A.T., Kato, S., Fukue, J., 1987. Global trapped oscillations of relativistic accretion disks. PASJ 39, 457–473.
- O’Neill et al. [2011] O’Neill, S.M., Reynolds, C.S., Miller, M.C., Sorathia, K.A., 2011. Low-frequency Oscillations in Global Simulations of Black Hole Accretion. ApJ 736, 107. doi:10.1088/0004-637X/736/2/107, arXiv:1009.1882.
- Papaloizou and Pringle [1983] Papaloizou, J.C.B., Pringle, J.E., 1983. The time-dependence of non-planar accretion discs. MNRAS 202, 1181–1194.
- Pasham et al. [2019] Pasham, D. R. et al., 2019. A loud quasi-periodic oscillation after a star is disrupted by a massive black hole. Science 363, 531–534. doi:10.1126/science.aar7480, arXiv:1810.10713.
- Pasham et al. [2014] Pasham, D.R., Strohmayer, T.E., Mushotzky, R.F., 2014. A 400-solar-mass black hole in the galaxy M82. Nature 513, 74–76. doi:10.1038/nature13710, arXiv:1501.03180.
- Pawar et al. [2015] Pawar, D.D., Motta, S., Shanthi, K., Bhattacharya, D., Belloni, T., 2015. On the modulation of low-frequency quasi-periodic oscillations in black hole transients. MNRAS 448, 1298–1304. doi:10.1093/mnras/stv024, arXiv:1501.01823.
- Press et al. [1992] Press, W.H., Teukolsky, S.A., Vetterling, W.T., Flannery, B.P., 1992. Numerical recipes in FORTRAN. The art of scientific computing. Cambridge: University Press, —c1992, 2nd ed.
- Pringle [1992] Pringle, J.E., 1992. A simple approach to the evolution of twisted accretion discs. MNRAS 258, 811–818. doi:10.1093/mnras/258.4.811.
- Pringle [1996] Pringle, J.E., 1996. Self-induced warping of accretion discs. MNRAS 281, 357–361. doi:10.1093/mnras/281.1.357.
- Pringle [1999] Pringle, J.E., 1999. The General Physics of WARPS, in: Sellwood, J.A., Goodman, J. (Eds.), Astrophysical Discs - an EC Summer School, volume 160 of Astronomical Society of the Pacific Conference Series. p. 53.
- Psaltis et al. [1999] Psaltis, D., Belloni, T., van der Klis, M., 1999. Correlations in Quasi-periodic Oscillation and Noise Frequencies among Neutron Star and Black Hole X-Ray Binaries. ApJ 520, 262–270. doi:10.1086/307436, arXiv:arXiv:astro-ph/9902130.
- Psaltis and Norman [2000] Psaltis, D., Norman, C., 2000. On the Origin of Quasi-Periodic Oscillations and Broad-band Noise in Accreting Neutron Stars and Black Holes. ArXiv Astrophysics e-prints arXiv:arXiv:astro-ph/0001391.
- Qu et al. [2010] Qu, J.L., Lu, F.J., Lu, Y., Song, L.M., Zhang, S., Ding, G.Q., Wang, J.M., 2010. The Energy Dependence of the Centroid Frequency and Phase Lag of the Quasi-periodic Oscillations in GRS 1915+105. ApJ 710, 836–842. doi:10.1088/0004-637X/710/1/836, arXiv:0912.4769.
- Radhakrishnan and Srinivasan [1982] Radhakrishnan, V., Srinivasan, G., 1982. On the origin of the recently discovered ultra-rapid pulsar. Current Science 51, 1096–1099.
- Rao et al. [2010] Rao, F., Belloni, T., Stella, L., Zhang, S.N., Li, T., 2010. Low-frequency Oscillations in XTE J1550-564. ApJ 714, 1065–1071. doi:10.1088/0004-637X/714/2/1065, arXiv:1003.3285.
- Rapisarda et al. [2014] Rapisarda, S., Ingram, A., van der Klis, M., 2014. Evolution of the hot flow of MAXI J1543-564. MNRAS 440, 2882–2893. doi:10.1093/mnras/stu461, arXiv:1403.2308.
- Rapisarda et al. [2017] Rapisarda, S., Ingram, A., van der Klis, M., 2017. Modelling hard and soft states of Cygnus X-1 with propagating mass accretion rate fluctuations. MNRAS 472, 3821–3832. doi:10.1093/mnras/stx2110, arXiv:1708.04182.
- Ratti et al. [2012] Ratti, E. M. et al., 2012. The black hole candidate XTE J1752-223 towards and in quiescence: optical and simultaneous X-ray-radio observations. MNRAS 423, 2656–2667. doi:10.1111/j.1365-2966.2012.21071.x, arXiv:1204.2735.
- Remillard and McClintock [2006] Remillard, R., McClintock, J., 2006. X-Ray Properties of Black-Hole Binaries. Annual Reviews 44, 49–92. doi:10.1146/annurev.astro.44.051905.092532, arXiv:arXiv:astro-ph/0606352.
- Remillard et al. [1999] Remillard, R.A., Morgan, E.H., McClintock, J.E., Bailyn, C.D., Orosz, J.A., 1999. RXTE Observations of 0.1-300 HZ Quasi-periodic Oscillationsin the Microquasar GRO J1655-40. ApJ 522, 397–412. doi:10.1086/307606.
- Remillard et al. [2002] Remillard, R.A., Muno, M.P., McClintock, J.E., Orosz, J.A., 2002. Evidence for Harmonic Relationships in the High-Frequency Quasi-periodic Oscillations of XTE J1550-564 and GRO J1655-40. ApJ 580, 1030–1042. doi:10.1086/343791, arXiv:arXiv:astro-ph/0202305.
- Revnivtsev et al. [2001] Revnivtsev, M., Churazov, E., Gilfanov, M., Sunyaev, R., 2001. New class of low frequency QPOs: Signature of nuclear burning or accretion disk instabilities? A&A 372, 138–144. doi:10.1051/0004-6361:20010434, arXiv:arXiv:astro-ph/0011110.
- Revnivtsev et al. [1999] Revnivtsev, M., Gilfanov, M., Churazov, E., 1999. The frequency resolved spectroscopy of CYG X-1: fast variability of the Fe K_ line. A&A 347, L23–L26. arXiv:astro-ph/9906198.
- Revnivtsev et al. [2000] Revnivtsev, M.G., Borozdin, K.N., Priedhorsky, W.C., Vikhlinin, A., 2000. Rossi X-Ray Timing Explorer Observations of an Outburst of Recurrent X-Ray Nova GS 1354-644. ApJ 530, 955–965. doi:10.1086/308386, arXiv:astro-ph/9905380.
- Ryu et al. [1997] Ryu, D., Chakrabarti, S.K., Molteni, D., 1997. Zero-Energy Rotating Accretion Flows near a Black Hole. ApJ 474, 378–388. doi:10.1086/303461, arXiv:astro-ph/9607051.
- Samimi et al. [1979] Samimi, J. et al., 1979. GX339-4: a new black hole candidate. Nature 278, 434–436. doi:10.1038/278434a0.
- Schnittman et al. [2006a] Schnittman, J.D., Homan, J., Miller, J.M., 2006a. A Precessing Ring Model for Low-Frequency Quasi-periodic Oscillations. ApJ 642, 420–426. doi:10.1086/500923, arXiv:astro-ph/0512595.
- Schnittman et al. [2006b] Schnittman, J.D., Krolik, J.H., Hawley, J.F., 2006b. Light Curves from an MHD Simulation of a Black Hole Accretion Disk. ApJ 651, 1031–1048. doi:10.1086/507421, arXiv:astro-ph/0606615.
- Shakura and Sunyaev [1973] Shakura, N.I., Sunyaev, R.A., 1973. Black holes in binary systems. Observational appearance. A&A 24, 337–355.
- Shaposhnikov and Titarchuk [2006] Shaposhnikov, N., Titarchuk, L., 2006. Comprehensive Analysis of RXTE Data from Cygnus X-1: Spectral Index-Quasi-Periodic Oscillation Frequency-Luminosity Correlations. ApJ 643, 1098–1113. doi:10.1086/503272, arXiv:arXiv:astro-ph/0602091.
- Smith et al. [1997] Smith, D.M., Heindl, W.A., Swank, J., Leventhal, M., Mirabel, I.F., Rodriguez, L.F., 1997. X-Ray Timing in 1E 1740.7-2942 and GRS 1758-258. ApJ 489, L51–L54. doi:10.1086/310963.
- Sobczak et al. [2000] Sobczak, G.J., Remillard, R.A., Muno, M.P., McClintock, J.E., 2000. Characterizing the Low-Frequency QPO behavior of the X-ray Nova XTE J1550-564. arXiv e-prints , astro–ph/0004215arXiv:astro-ph/0004215.
- Sobolewska and Życki [2006] Sobolewska, M.A., Życki, P.T., 2006. Spectral and Fourier analyses of X-ray quasi-periodic oscillations in accreting black holes. MNRAS 370, 405–414. doi:10.1111/j.1365-2966.2006.10489.x, arXiv:arXiv:astro-ph/0603024.
- Steiner and McClintock [2012] Steiner, J.F., McClintock, J.E., 2012. Modeling the Jet Kinematics of the Black Hole Microquasar XTE J1550-564: A Constraint on Spin-Orbit Alignment. ApJ 745, 136. doi:10.1088/0004-637X/745/2/136, arXiv:1110.6849.
- Steiner et al. [2012] Steiner, J.F., McClintock, J.E., Reid, M.J., 2012. The Distance, Inclination, and Spin of the Black Hole Microquasar H1743-322. ApJ 745, L7. doi:10.1088/2041-8205/745/1/L7, arXiv:1111.2388.
- Stella and Vietri [1998] Stella, L., Vietri, M., 1998. Lense-Thirring Precession and Quasi-periodic Oscillations in Low-Mass X-Ray Binaries. ApJ 492, L59+. doi:10.1086/311075, arXiv:arXiv:astro-ph/9709085.
- Stella et al. [1999] Stella, L., Vietri, M., Morsink, S.M., 1999. Correlations in the Quasi-periodic Oscillation Frequencies of Low-Mass X-Ray Binaries and the Relativistic Precession Model. ApJ 524, L63–L66. doi:10.1086/312291, arXiv:arXiv:astro-ph/9907346.
- Stevens and Uttley [2016] Stevens, A.L., Uttley, P., 2016. Phase-Resolved Spectroscopy of Type B Quasi-Periodic Oscillations in GX 339-4. ArXiv e-prints arXiv:1605.01753.
- Stiele et al. [2013] Stiele, H., Belloni, T.M., Kalemci, E., Motta, S., 2013. Relations between X-ray timing features and spectral parameters of Galactic black hole X-ray binaries. MNRAS 429, 2655–2661. doi:10.1093/mnras/sts548, arXiv:1212.0866.
- Strohmayer [2001] Strohmayer, T.E., 2001. Discovery of a 450 HZ Quasi-periodic Oscillation from the Microquasar GRO J1655-40 with the Rossi X-Ray Timing Explorer. ApJ 552, L49–L53. doi:10.1086/320258.
- Strohmayer et al. [2018] Strohmayer, T. E. et al., 2018. NICER Discovers mHz Oscillations in the “Clocked” Burster GS 1826-238. The Astrophysical Journal 865, 63. doi:10.3847/1538-4357/aada14, arXiv:1808.04294.
- Strohmayer and Mushotzky [2009] Strohmayer, T.E., Mushotzky, R.F., 2009. Evidence for an Intermediate-mass Black Hole in NGC 5408 X-1. ApJ 703, 1386–1393. doi:10.1088/0004-637X/703/2/1386, arXiv:0911.1076.
- Strohmayer and Smith [2011] Strohmayer, T.E., Smith, E.A., 2011. Discovery of mHz QPOs from the LMXB 4U 1323-619. The Astronomer’s Telegram 3258, 1.
- Strohmayer et al. [1996] Strohmayer, T.E., Zhang, W., Swank, J.H., Smale, A., Titarchuk, L., Day, C., Lee, U., 1996. Millisecond X-Ray Variability from an Accreting Neutron Star System. ApJ 469, L9. doi:10.1086/310261.
- Su et al. [2015] Su, Y.H., Chou, Y., Hu, C.P., Yang, T.C., 2015. Characterizing Intermittency of 4-Hz Quasi-periodic Oscillation in XTE J1550-564 Using Hilbert-Huang Transform. ApJ 815, 74. doi:10.1088/0004-637X/815/1/74, arXiv:1510.09122.
- Sunyaev and Titarchuk [1985] Sunyaev, R.A., Titarchuk, L.G., 1985. Comptonization of low-frequency radiation in accretion disks Angular distribution and polarization of hard radiation. A&A 143, 374–388.
- Sunyaev and Truemper [1979] Sunyaev, R.A., Truemper, J., 1979. Hard X-ray spectrum of CYG X-1. Nature 279, 506–508. doi:10.1038/279506a0.
- Tagger [2007] Tagger, M., 2007. Disk instabilities and Quasi-Periodic Oscillations, in: Revista Mexicana de Astronomia y Astrofisica, vol. 27, volume 27 of Revista Mexicana de Astronomia y Astrofisica, vol. 27. pp. 26–35.
- Tagger and Pellat [1999] Tagger, M., Pellat, R., 1999. An accretion-ejection instability in magnetized disks. A&A 349, 1003–1016. arXiv:arXiv:astro-ph/9907267.
- Tetarenko et al. [2016] Tetarenko, B.E., Sivakoff, G.R., Heinke, C.O., Gladstone, J.C., 2016. WATCHDOG: A Comprehensive All-sky Database of Galactic Black Hole X-ray Binaries. ApJ 222, 15. doi:10.3847/0067-0049/222/2/15, arXiv:1512.00778.
- Thorne and Price [1975] Thorne, K.S., Price, R.H., 1975. Cygnus X-1 - an interpretation of the spectrum and its variability. ApJ 195, L101–L105. doi:10.1086/181720.
- Timmer and Koenig [1995] Timmer, J., Koenig, M., 1995. On generating power law noise. A&A 300, 707.
- Titarchuk and Hua [1995] Titarchuk, L., Hua, X.M., 1995. A Comparison of Thermal Comptonization Models. ApJ 452, 226–+. doi:10.1086/176293.
- Tomsick and Kaaret [2001] Tomsick, J.A., Kaaret, P., 2001. The X-Ray Properties of Low-Frequency Quasi-periodic Oscillations from GRS 1915+105 Up to 120 KEV. ApJ 548, 401–409. doi:10.1086/318683, arXiv:astro-ph/0009354.
- Trudolyubov et al. [2001] Trudolyubov, S.P., Borozdin, K.N., Priedhorsky, W.C., 2001. RXTE observations of 4U 1630-47 during the peak of its 1998 outburst. MNRAS 322, 309–320. doi:10.1046/j.1365-8711.2001.04073.x, arXiv:astro-ph/9911345.
- Tsang and Butsky [2013] Tsang, D., Butsky, I., 2013. Iron line variability of discoseismic corrugation modes. MNRAS 435, 749–765. doi:10.1093/mnras/stt1334, arXiv:1307.4971.
- Tsang and Lai [2009] Tsang, D., Lai, D., 2009. Corotational damping of discoseismic c modes in black hole accretion discs. MNRAS 393, 992–998. doi:10.1111/j.1365-2966.2008.14228.x, arXiv:0810.1299.
- Uttley and Klein-Wolt [2015] Uttley, P., Klein-Wolt, M., 2015. The remarkable timing properties of a ‘hypersoft’ state in GRO J1655-40. Monthly Notices of the Royal Astronomical Society 451, 475–485. doi:10.1093/mnras/stv978, arXiv:1504.08313.
- Uttley et al. [2005] Uttley, P., McHardy, I.M., Vaughan, S., 2005. Non-linear X-ray variability in X-ray binaries and active galaxies. MNRAS 359, 345–362. doi:10.1111/j.1365-2966.2005.08886.x, arXiv:astro-ph/0502112.
- van den Eijnden et al. [2016] van den Eijnden, J., Ingram, A., Uttley, P., 2016. Probing the origin of quasi-periodic oscillations: the short-timescale evolution of phase lags in GRS 1915+105. ArXiv e-prints arXiv:1603.03392.
- van den Eijnden et al. [2017] van den Eijnden, J., Ingram, A., Uttley, P., Motta, S.E., Belloni, T.M., Gardenier, D.W., 2017. Inclination dependence of QPO phase lags in black hole X-ray binaries. MNRAS 464, 2643–2659. doi:10.1093/mnras/stw2634, arXiv:1610.03469.
- van der Hooft et al. [1999] van der Hooft, F. et al., 1999. Hard X-Ray Variability of the Black Hole Candidate GRO J0422+32 during Its 1992 Outburst. ApJ 513, 477–490. doi:10.1086/306845, arXiv:astro-ph/9810492.
- van der Klis [1989a] van der Klis, M., 1989a. Fourier techniques in X-ray timing, in: Ögelman, H., van den Heuvel, E.P.J. (Eds.), NATO Advanced Science Institutes (ASI) Series C, volume 262 of NATO Advanced Science Institutes (ASI) Series C. p. 27.
- van der Klis [1989b] van der Klis, M., 1989b. Quasi-periodic oscillations and noise in low-mass X-ray binaries. Annual Reviews 27, 517–553. doi:10.1146/annurev.aa.27.090189.002505.
- van der Klis [2006] van der Klis, M., 2006. Overview of QPOs in neutron-star low-mass X-ray binaries. Advances in Space Research 38, 2675–2679. doi:10.1016/j.asr.2005.11.026.
- van der Klis et al. [1985] van der Klis, M., Jansen, F., van Paradijs, J., Lewin, W.H.G., van den Heuvel, E.P.J., Trumper, J.E., Szatjno, M., 1985. Intensity-dependent quasi-periodic oscillations in the X-ray flux of GX5 - 1. Nature 316, 225–230. doi:10.1038/316225a0.
- van der Klis et al. [1996] van der Klis, M., Swank, J.H., Zhang, W., Jahoda, K., Morgan, E.H., Lewin, W.H.G., Vaughan, B., van Paradijs, J., 1996. Discovery of Submillisecond Quasi-periodic Oscillations in the X-Ray Flux of Scorpius X-1. ApJ 469, L1. doi:10.1086/310251, arXiv:astro-ph/9607047.
- van Doesburgh and van der Klis [2017] van Doesburgh, M., van der Klis, M., 2017. Testing the relativistic precession model using low-frequency and kHz quasi-periodic oscillations in neutron star low-mass X-ray binaries with known spin. MNRAS 465, 3581–3606. doi:10.1093/mnras/stw2961, arXiv:1611.05860.
- van Straaten et al. [2002] van Straaten, S., van der Klis, M., di Salvo, T., Belloni, T., 2002. A Multi-Lorentzian Timing Study of the Atoll Sources 4U 0614+09 and 4U 1728-34. ApJ 568, 912–930. doi:10.1086/338948, arXiv:astro-ph/0107562.
- Vanhoff and Elgar [1997] Vanhoff, B., Elgar, S., 1997. Simulating Quadratically Nonlinear Random Processes. International Journal of Bifurcation and Chaos 7, 1367–1374. doi:10.1142/s0218127497001084.
- Varnière et al. [2002] Varnière, P., Rodriguez, J., Tagger, M., 2002. Accretion-ejection instability and QPO in black-hole binaries. II. Relativistic effects. A&A 387, 497–506. doi:10.1051/0004-6361:20020401, arXiv:astro-ph/0203325.
- Varnière and Tagger [2002] Varnière, P., Tagger, M., 2002. Accretion-Ejection Instability in magnetized disks: Feeding the corona with Alfvén waves. A&A 394, 329–338. doi:10.1051/0004-6361:20021135, arXiv:astro-ph/0208120.
- Vaughan and Uttley [2005] Vaughan, S., Uttley, P., 2005. Where are the X-ray quasi-periodic oscillations in active galaxies? MNRAS 362, 235–244. doi:10.1111/j.1365-2966.2005.09296.x, arXiv:astro-ph/0506455.
- Veledina and Poutanen [2015] Veledina, A., Poutanen, J., 2015. Reprocessing model for the optical quasi-periodic oscillations in black hole binaries. MNRAS 448, 939–945. doi:10.1093/mnras/stu2737, arXiv:1409.6523.
- Veledina et al. [2013] Veledina, A., Poutanen, J., Ingram, A., 2013. A Unified Lense-Thirring Precession Model for Optical and X-Ray Quasi-periodic Oscillations in Black Hole Binaries. ApJ 778, 165. doi:10.1088/0004-637X/778/2/165, arXiv:1310.3821.
- Vignarca et al. [2003] Vignarca, F., Migliari, S., Belloni, T., Psaltis, D., van der Klis, M., 2003. Tracing the power-law component in the energy spectrum of black hole candidates as a function of the QPO frequency. A&A 397, 729–738. doi:10.1051/0004-6361:20021542, arXiv:arXiv:astro-ph/0210517.
- Wagoner [1999] Wagoner, R.V., 1999. Relativistic diskoseismology. Physics Reports 311, 259–269. doi:10.1016/S0370-1573(98)00104-5, arXiv:astro-ph/9805028.
- Wang et al. [2012] Wang, Z.Y., Huang, C.Y., Wang, D.X., Wang, J.Z., 2012. A model of low-frequency quasi-periodic oscillations in black hole X-ray binaries. Research in Astronomy and Astrophysics 12, 661–670. doi:10.1088/1674-4527/12/6/006, arXiv:1203.0080.
- Weisskopf et al. [2016] Weisskopf, M. C. et al., 2016. The Imaging X-ray Polarimetry Explorer (IXPE), in: Society of Photo-Optical Instrumentation Engineers (SPIE) Conference Series, volume 9905 of Proceedings of SPIE. p. 990517. doi:10.1117/12.2235240.
- Wijnands et al. [1999] Wijnands, R., Homan, J., van der Klis, M., 1999. The Complex Phase-Lag Behavior of the 3-12 HZ Quasi-Periodic Oscillations during the Very High State of XTE J1550-564. ApJ 526, L33–L36. doi:10.1086/312365, arXiv:arXiv:astro-ph/9909515.
- Wijnands and van der Klis [1999] Wijnands, R., van der Klis, M., 1999. The Broadband Power Spectra of X-Ray Binaries. ApJ 514, 939–944. doi:10.1086/306993, arXiv:astro-ph/9810342.
- You et al. [2018] You, B., Bursa, M., Życki, P.T., 2018. X-Ray Quasi-periodic Oscillations in the Lense-Thirring Precession Model. I. Variability of Relativistic Continuum. ApJ 858, 82. doi:10.3847/1538-4357/aabd33, arXiv:1801.04028.
- Życki [2003] Życki, P.T., 2003. Simulations of X-ray spectral/timing properties in a propagation model of variability of accreting black holes. MNRAS 340, 639–646. doi:10.1046/j.1365-8711.2003.06357.x, arXiv:astro-ph/0209496.
- Zycki et al. [2016] Zycki, P.T., Done, C., Ingram, A., 2016. Energy spectra of X-ray quasi-periodic oscillations in the Lense-Thirring precession model. arXiv e-prints arXiv:1610.07871.