A new approach to monitor 13C-targets degradation in situ
for 13C(,n)16O cross-section measurements at LUNA
Abstract
Direct measurements of reaction cross-sections at astrophysical energies often require the use of solid targets able to withstand high ion beam currents for extended periods of time. Thus, monitoring target thickness, isotopic composition, and target stoichiometry during data taking is critical to account for possible target modifications and to reduce uncertainties in the final cross-section results. A common technique used for these purposes is the Nuclear Resonant Reaction Analysis (NRRA), which however requires that a narrow resonance be available inside the dynamic range of the accelerator used. In cases when this is not possible, as for example the 13C(,n)16O reaction recently studied at low energies at the Laboratory for Underground Nuclear Astrophysics (LUNA) in Italy, alternative approaches must be found. Here, we present a new application of the shape analysis of primary rays emitted by the 13C(p,)14N radiative capture reaction. This approach was used to monitor 13C target degradation in situ during the 13C(,n)16O data taking campaign. The results obtained are in agreement with evaluations subsequently performed at Atomki (Hungary) using the NRRA method. A preliminary application for the extraction of the 13C(,n)16O reaction cross-section at one beam energy is also reported.
Keywords:
13C enriched solid target, NRRA, ion beam, -shape analysis, nuclear astrophysicspacs:
26.00.00,29.90.+r1 Introduction
Knowledge of the stoichiometric composition of solid state targets and their behaviour during ion beam irradiation is of great importance in various fields of ion beam physics, from material analysis to nuclear astrophysics JESUS2001229 ; Cruz ; SILVA2017135 ; Caciolli . The main goal of the latter is to measure nuclear reaction cross-sections at, or near, the energy region of astrophysical interest (the so-called Gamow window), typically of the order of hundreds of keV or less. Since cross-sections drop exponentially with decreasing energy in this energy region, counting rates can be of the order of one event per hour or lower. Therefore, high beam currents (hundreds of A) and long irradiation times (weeks or months) are often necessary to achieve high enough signal-to-noise ratios for a successful cross-section measurement at low energies. Yet, target modification processes (such as diffusion, melting, sputtering or contamination of target surface Paine1985 ; Radek2017 ) that occur under intense beam irradiation may result in significant changes of target composition and/or stoichiometry as a function of irradiation depth Wang1984 and an in-situ monitoring of target properties is generally required.
Typically, this is achieved by using the well-established Nuclear Resonant Reaction Analysis (NRRA) (see, for example, tesmer1995handbook ; MCGLONE1991201 and refs. therein), which requires a narrow resonance111A narrow resonance is defined as one whose total width is much smaller that the target thickness in energy units. The latter represents the energy lost by the ion beam in going through the target and depends on the initial beam energy as well as on the target composition and physical thickness. to exist in the reaction of interest and to be accessible within the dynamic range of the particle accelerator. If no resonance is present or accessible, for example because of beam energy restrictions, other methods must be employed.
This was the case of the astrophysically important 13C(,n)16O reaction Cristallo2018 recently studied in direct kinematics at the Laboratory for Underground Nuclear Astrophysics (LUNA) FORMICOLA ; Review2018 of the Laboratori Nazionali del Gran Sasso (LNGS), INFN, Italy. Because of the small cross-sections involved at the energies investigated ( keV), intense -particle beams were needed, leading to severe target degradation and frequent target replacements. Unfortunately, no resonances exist in the 13C(,n)16O reaction at keV and the NRRA method could not be used to monitor the state of 13C targets during irradiation. Alternatively, one could use a proton beam, also available at LUNA, on the same targets and exploit the 13C(p,)14N reaction for NRRA analysis. However, also in this case no resonance exists that can be accessed with the 400 kV accelerator, hence a new approach to monitor the deterioration of 13C targets during -beam irradiation had to be used.
In this paper, we report about an innovative application of the so-called -shape analysis Imbriani2005 . The approach consists in a detailed study of the shape of the -ray lines emitted in the radiative proton-capture process 13C(p,)14N so as to periodically check both the thickness and stoichiometry of 13C targets used during the 13C(,n)16O campaign at LUNA. To validate the approach developed here, complementary NRRA measurements were also performed off-site (at Atomki in Debrecen, Hungary) on some targets, both before and after -beam irradiation at LUNA.
The paper is organized as follows: first, we describe the NRRA technique used to characterize 13C targets at Atomki (sect. 2); then, we present the -shape approach applied to a primary transition in the 13C(p,)14N reaction to assess target deterioration during the 13C(,n)16O campaign at LUNA (sect. 3); and finally, we report the results of the validation procedure (sect. 4), together with a preliminary application of the -shape analysis to the evaluation of the 13C(,n)16O reaction cross-section (sect. 5).
2 Reaction yields and target properties: The NRRA approach
The NRRA method is frequently used in measurements of reaction cross-sections of astrophysical interest and has already been extensively exploited in previous studies at LUNA Imbriani2005 ; Caciolli2011 ; Bruno2016 ; Bruno2019 ; Boeltzig2019 .
Briefly, the yield of a nuclear reaction can be determined from experimental quantities as rolfs1988cauldrons :
| (1) |
where is the number of reactions (producing either particles or rays) and is the number of beam particles incident on the target. The latter quantity can be determined as , where is the charge accumulated on target during beam irradiation, is the elementary charge and is the charge state of the projectile. On the other hand, is a function of the reaction cross-section and the number of active nuclei222For targets consisting of chemical compounds, active nuclei are defined as those of a given species that take part in the nuclear reaction under study. All other nuclear species present in the target do not contribute to the reaction yield and are regarded as inactive. (per square centimetre) in the target.
For targets of thickness , corresponding to the energy lost by a beam of initial energy in traversing the target, and taking into account the energy dependence of the cross-section, the relationship between and the cross-section (at an energy within the target) can be expressed as rolfs1988cauldrons :
| (2) |
Here, is the so-called stopping power which, for a given beam ion and energy, depends only on the chemical composition and stoichiometry of the target. For compound targets containing both active and inactive nuclei, the effective stopping power is used instead, which can be parametrized using the Bragg’s addition rule333For the present work a target composed of 13C and Ta was assumed (see sect. 2.1) and further corrections to Bragg’s rule, typically required for carbon compounds with O and H, can safely be neglected. Iliadis :
| (3) |
Here is the ratio between inactive and active nuclei, and and are the stopping powers of the corresponding (active and inactive) pure materials. Their values are available in the literature and can be calculated using SRIM Ziegler2008 .
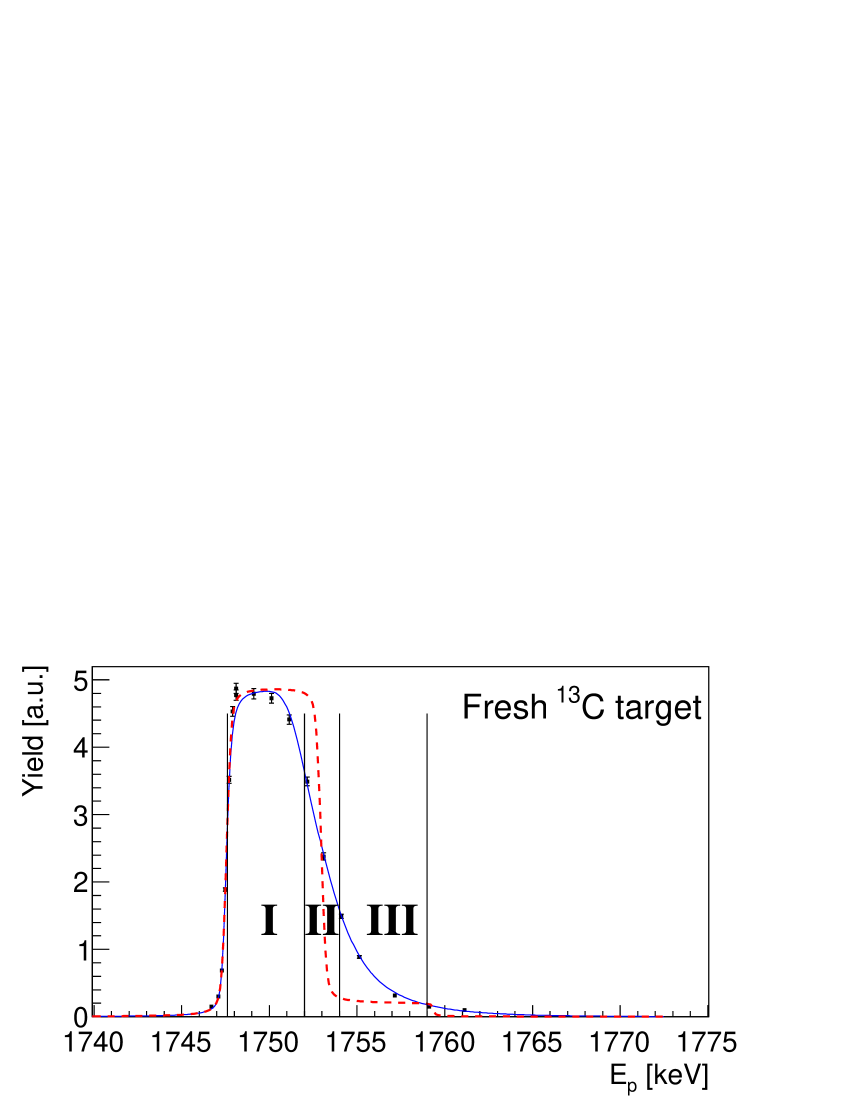
If the nuclear reaction cross-section is well known, a measurement of the yield (eq. 2) can be used to experimentally determine the effective stopping power and thus to monitor the degree of deterioration of the target during beam irradiation. In particular, the NRRA method exploits the existence of a narrow and isolated resonance in a given reaction, whose cross-section is known and can be well described by the Breit-Wigner expression, Iliadis . By measuring the yield as a function of beam energies in the proximity of the resonance and for targets of thickness much larger than the resonance width , a characteristic resonance yield curve is obtained (see for example Fig.1), which contains information about the target thickness and composition. Specifically, the height of the yield plateau depends on the target stoichiometry, while the FWHM of the yield profile provides a measure of the target thickness. If either or both the target thickness and stoichiometry change as a result of intense ion beam bombardment, so will the shape of the (thick-target, resonant) yield profile and repeated resonance scans can be used to quantify the degree of target deterioration.
2.1 NRRA measurements at Atomki
Solid targets were produced by evaporating 99% enriched 13C powder (by Sigma Aldrich) on 4 cm diameter tantalum backings. In order to remove traces of light elements from the Ta surface, a cleaning procedure cleaning with citric acid solution was used before evaporating the targets. The evaporation was performed by the electron gun technique using a Leybold UNIVEX 350 vacuum evaporator at Atomki. The vacuum chamber of the evaporator consists of a copper melting pot, an adjustable arm used to hold the tantalum disk at 10 cm from the melting pot, and an electron gun (similar to the setup described in WOLFE2000142 ). An oscillator quartz mounted inside the vacuum chamber at 15 cm from the melting pot was used to monitor the evaporation.
NRRA measurements were carried out at the 2 MV Medium-Current Plus Tandetron Accelerator Rajta2018 at Atomki immediately after target production. For these measurements, a narrow resonance in the 13C(p,)14N reaction ( keV) was used. The resonance is located at a proton beam energy keV and has a width () eV Ajzenberg1991 . Thus, resonance scans were performed at beam energies in the range keV.
Targets were irradiated with typical proton beam currents of nA, covering a beam spot size of about 5 mm diameter. Given the low beam intensity on target, neither a cooling system nor a cold trap were needed for this setup. The target chamber was isolated from other beam-line components and acted as a Faraday cup for charge integration. An electrically insulated collimator biased to V was placed at the entrance of the chamber to suppress secondary electrons. A 100% relative efficiency n-type coaxial HPGe detector was mounted in close geometry, at a distance of about 3 cm from the target, and at 0∘ with respect to the beam axis.
Spectra of the emitted rays were collected with an ORTEC MCA (model ASPEC 927) and the ORTEC MAESTRO software. The region of interest (ROI) in the -ray spectra was set to MeV () so as to include both the full-energy peak and the single- and double-escape peaks of the direct capture transition to the ground state of the 14N compound nucleus. Given the magnitude of the resonant cross-section ( mb TENDL2017 ), it was possible to reach a statistical uncertainty below 1% in less than 3 minutes of proton irradiation at the given currents, with negligible environmental background.
At a proton beam energy keV, the average target thickness was found to be 5 keV, corresponding to a physical thickness of about 170 nm and to an areal density atoms/cm2. The heights of the yield plateau of all fresh targets were consistent with each other within experimental uncertainties, indicating that all targets had the same initial stoichiometry and confirming the reproducibility of the evaporation procedure.
For some targets, the thickness uniformity was also verified by repeating the resonance scan on three different spots of the same target, 6 mm apart from each other. This requirement was especially important for the LUNA experiment because the -particle beam has a typical diameter of about 15 mm on target, so uniformity of the evaporated layer had to be guaranteed over the whole beam-spot area. In the three spots examined, the shapes of the resonance profile were consistent within the uncertainties Ciani2017 . Based on the test measurements, no modification of stoichiometry was observed during irradiation at Atomki. In addition, NRRA was performed also on a few natural carbon targets, whose 13C content is known to be 1.1%. The comparison of the plateau heights confirmed a 13C abundance in the enriched targets compatible with the 99% value guaranteed by Sigma Aldrich CianiPhD .
2.2 The NRRA results
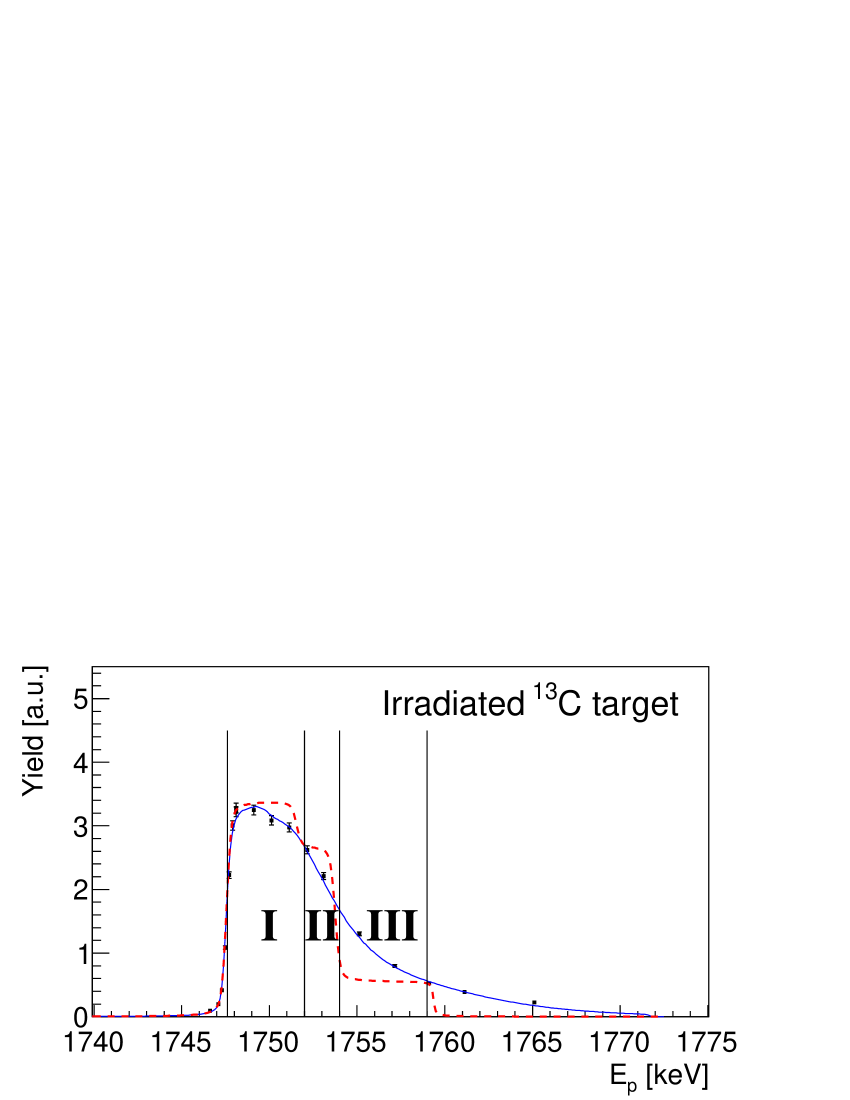
Figure 1 shows a typical resonance yield curve obtained on a fresh target (upper panel) and on a target exposed to about 2.1 C of -beam irradiation at LUNA (lower panel). As can be seen, the shapes of the resonance profiles differ significantly as a result of beam exposure, both in height and FWHM of the yield plateau.
 |
 |
In order to quantify the degree of deterioration, experimental data (black points in fig. 1) were fit taking into account a number of experimental effects, such as beam energy resolution and beam straggling StragglingBemmerer within the target. These factors can be folded into the expression of the yield (eq. 2) as Iliadis :
|
|
(4) |
Here, is a normalization constant that includes the branching ratio of the transition and the -ray detection efficiency at the resonance energy; describes the energy distribution of particles in the beam; and describes the beam energy loss and straggling through the target (see Iliadis for more details). Provided all other quantities are known, a measurement of the resonance yield profile can be used to determine (i.e., the stoichiometric ratio ) at the resonance energy.
For the present analysis, the 13C(p,)14N reaction cross-section (E) was taken from the TENDL-2017 nuclear data library TENDL2017 and evaluated as the sum of a non-resonant and a resonant component described by a second order polynomial and the Breit-Wigner formula, respectively. The stopping power was assumed to be constant over the total width ( eV) of the resonance. The function was assumed to follow a normal distribution with a FWHM of eV Rajta2018 .
As for the calculation of the function, assumptions on some target properties were needed. Here, it was assumed that the targets initially consisted of 13C and Ta only, but with varying stoichiometric ratios as a function of depth. The TRIM software TRIM was then used to calculate the energy loss and energy straggling of the beam for a given ratio. It was found that the resonance profiles could be well-reproduced by assuming three layers of different stoichiometric ratios (calculated using a minimization), but with homogeneous composition within each layer. For fresh targets we assumed . The calculated yield curves obtained including the beam spread with and without beam straggling effects are shown in fig. 1 as solid (blue) and dashed (red) lines, respectively. Vertical lines indicate the boundaries of the layers with different stoichiometries. In fitting the yield profiles, the ratios in the various layers and their thickness were treated as free parameters.
Finally, NRRA measurements were also repeated on a sample of four targets after target irradiation at LUNA with different accumulated charges. The results from these measurements were used to validate the -shape analysis method (see sect. 4). Figure 2 shows the NRRA profiles obtained on targets with different amounts of accumulated -beam charges.
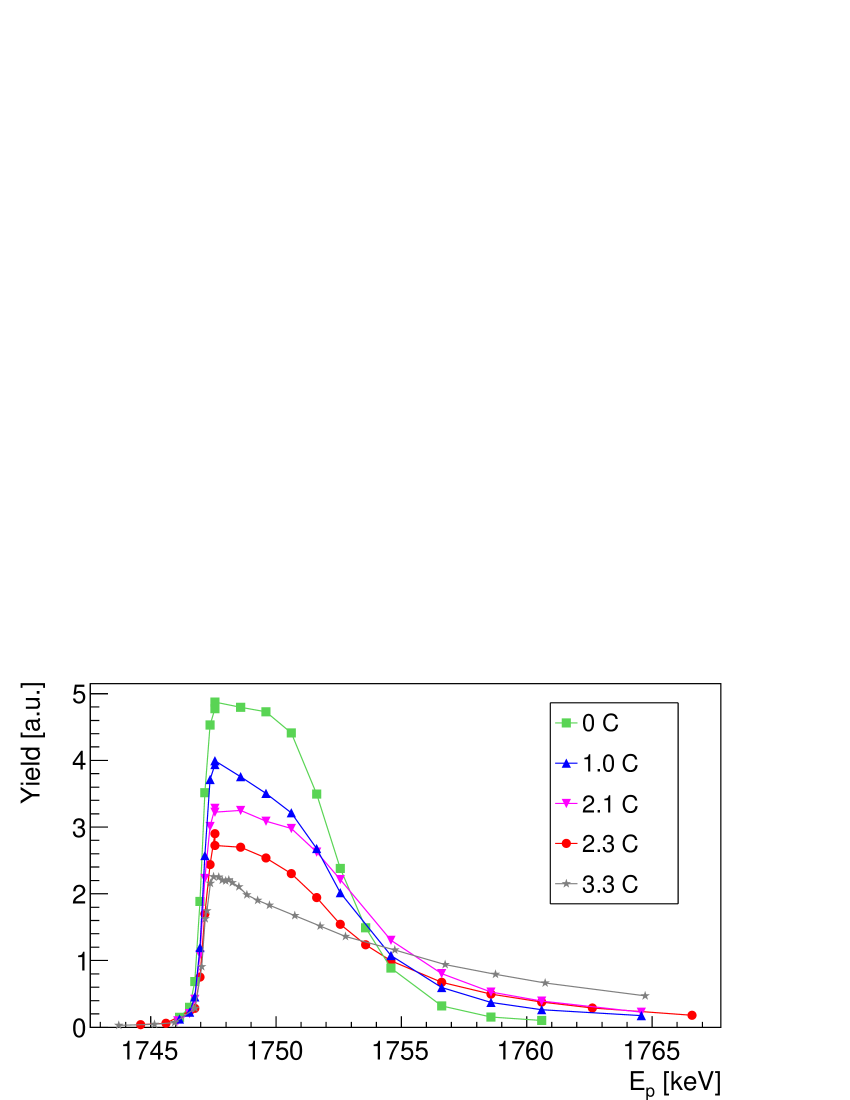
A significant modification of the resonance yield curve was observed with increasing accumulated charge during -beam irradiation at LUNA. In particular, the plateau becomes lower and the falling edge becomes longer. The observed depth profile indicates strong diffusion of 13C into the Ta backings. However, the position of the leading edge of the yield curves does not change appreciably, indicating negligible carbon build-up on target surface during irradiation.
The extracted effective stopping power values given in table 1 (see sect. 4.3 for an evaluation of the uncertainties) are those corresponding to layer I444Indeed, as the cross-section of 13C(,n)16O reaction drops exponentially with energy, the outermost layers of the target gives the main contribution to the reaction yield. Thus, only the stoichiometric ratio of layer I are of interest here..
| Target | Charge [C] | ||
|---|---|---|---|
| T29 | 0 | 0.000 | 3.120.16 |
| T26 | 1.00 | 0.0470.001 | 3.840.19 |
| T29 | 2.10 | 0.1010.002 | 4.620.23 |
| T28 | 2.34 | 0.1490.003 | 5.410.27 |
| MT10 | 3.30 | 0.2020.004 | 6.320.32 |
3 The -shape analysis method
For a non-resonant radiative capture reaction AB at sub-Coulomb energies, the shape of a primary -ray transition is governed by the behaviour of the reaction cross-section over the energy range covered by the incident beam as it loses energy in traversing the target Imbriani2005 . For a thick target, the shape is also influenced by the energy dependence of the stopping power, and by the concentration profile of active nuclei as a function of target depth (which may change during irradiation).
Additional experimental effects may further contribute to the exact shape of the -ray line and must be taken into account. Specifically, the high-energy rise of the peak may be Doppler-shifted by the recoil of the compound nucleus, while its low-energy tail may be affected by beam straggling effects. Thus d, the number of counts per unit of charge in channel of the acquired -ray spectrum, with central value (Ei is the corresponding projectile energy) and width is given by the expression Imbriani2005 :
| (5) |
where is a normalization constant that includes the branching ratio of the transition and the -ray detection efficiency, is a Gaussian function accounting for the energy resolution of the -ray detector, describes the concentration profile of active nuclei within the target (see below), and describes the energy broadening due to beam straggling effects.
The target concentration profile can be modelled as the product of two Fermi functions Caciolli :
| (6) |
where is the incident beam energy, the target thickness, and and are two parameters accounting, respectively, for the slopes of the falling and leading edges of the thick-target profile.
The analysis of -ray line shapes has been extensively used in the past to extract information on unknown cross-sections of astrophysical reactions (15Npg ; Scott ; DiLeva ), provided that the target profile could be measured independently (e.g., through NRRA analysis).
In the present study, we exploited instead the -shape analysis approach to determine and the effective stopping power using the well-known cross-section of the 13C(p,)14N reaction, as explained in the following sections.
3.1 The -shape measurements at LUNA
In order to monitor the target degradation during the 13C(,n)16O measurements, data taking at LUNA consisted of long -beam runs with accumulated charges of C per run, interspersed by short proton-beam runs with typical accumulated charges of 0.2 C at most, so as to minimize possible changes in target stoichiometry caused by the proton irradiation itself.
Proton beam runs were all performed at the same reference energy, keV. The choice for this energy was dictated by the need to maximize counting statistics while minimizing beam-induced background from a broad resonance at keV in the 19F(p,)16O reaction on ever present 19F contaminants in the experimental setup. Note that at such a low proton-beam energy the resulting target thickness is keV and neither the 13C(p,)14N reaction cross-section nor the effective stopping power can be regarded as constant.
Primary rays (keV) arising from the 13C(p,)14N direct capture transition into the 14N ground state (hereafter, DC GS transition) were detected using a HPGe detector with a relative efficiency of 120% and FWHM of 2.8 keV at keV. The detector was mounted at 55° to the beam axis and brought to a distance of 5 mm from the target holder Csedreki2017 . The same type of electronics and DAQ used in the NRRA measurement was used to acquire the -spectrum at LUNA.
3.2 The -shape analysis and results
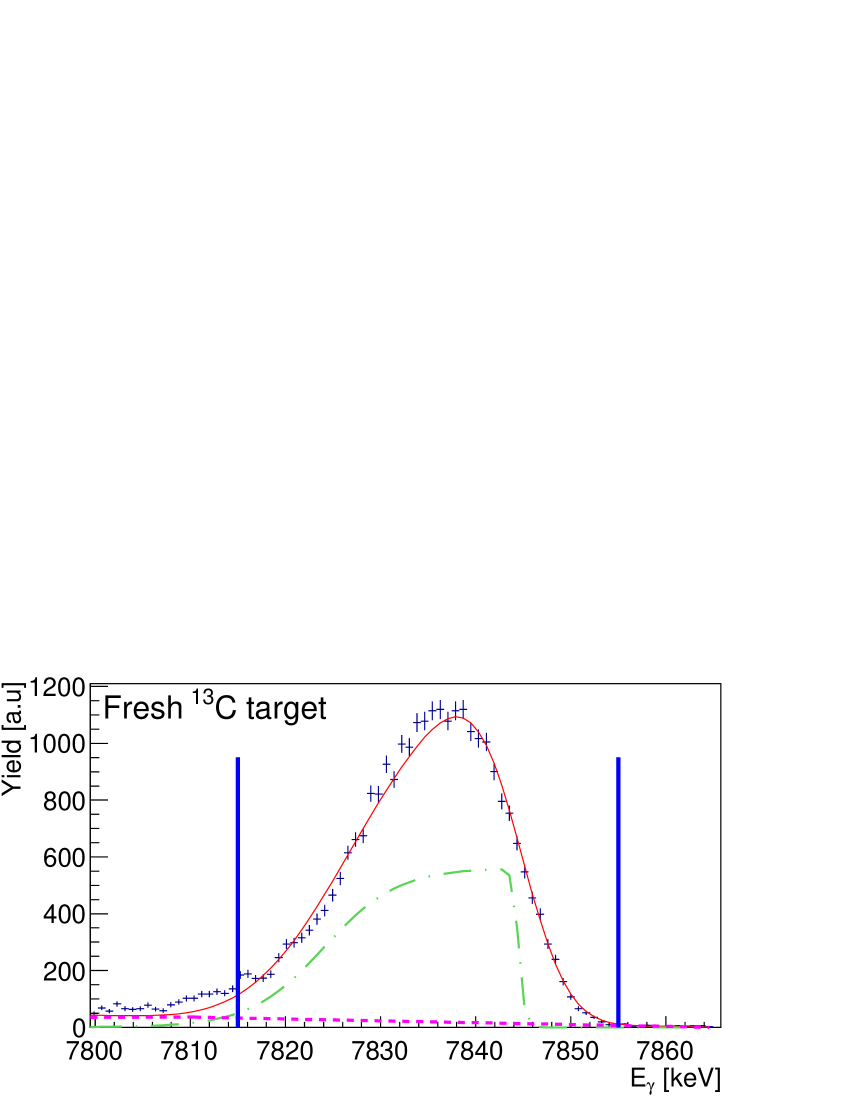
Figure 3 shows the peak (keV) of two -ray spectra acquired on a fresh target (upper panel) and after an -beam irradiation of 3.3 C of total accumulated charge (lower panel).
Experimental spectra (blue crosses) were fit using eq. (5), where the low-energy trend of the 13C(p,)14N reaction cross-section was taken from King et al. KING1994354 and Genard et al. 13Cpg14N_res511 , and the beam straggling distribution function was evaluated by Monte Carlo simulations using TRIM.
For runs on fresh targets, parameters , , and in eq. 5 and 6 were left free to vary, while the stoichiometric ratio was set to 0, as no degradation had yet occurred. For runs on irradiated targets, parameters and were fixed to the fit values of the “fresh” target, leaving , and as free parameters.
The results of the fitting procedure are shown as red curves in Fig. 3, while dash-dotted green curves show target profiles defined in eq. (6) in arbitrary units. Note the change in the shape of the target profile following irradiation with the -beam. A linear background (dashed line) was included in the ROI of the fit to account for multiple Compton-scatter events in the HPGe detector. The was minimized in the region delimited by vertical lines, for a number of degrees of freedom . We obtained a reduced for both plots shown.
 |
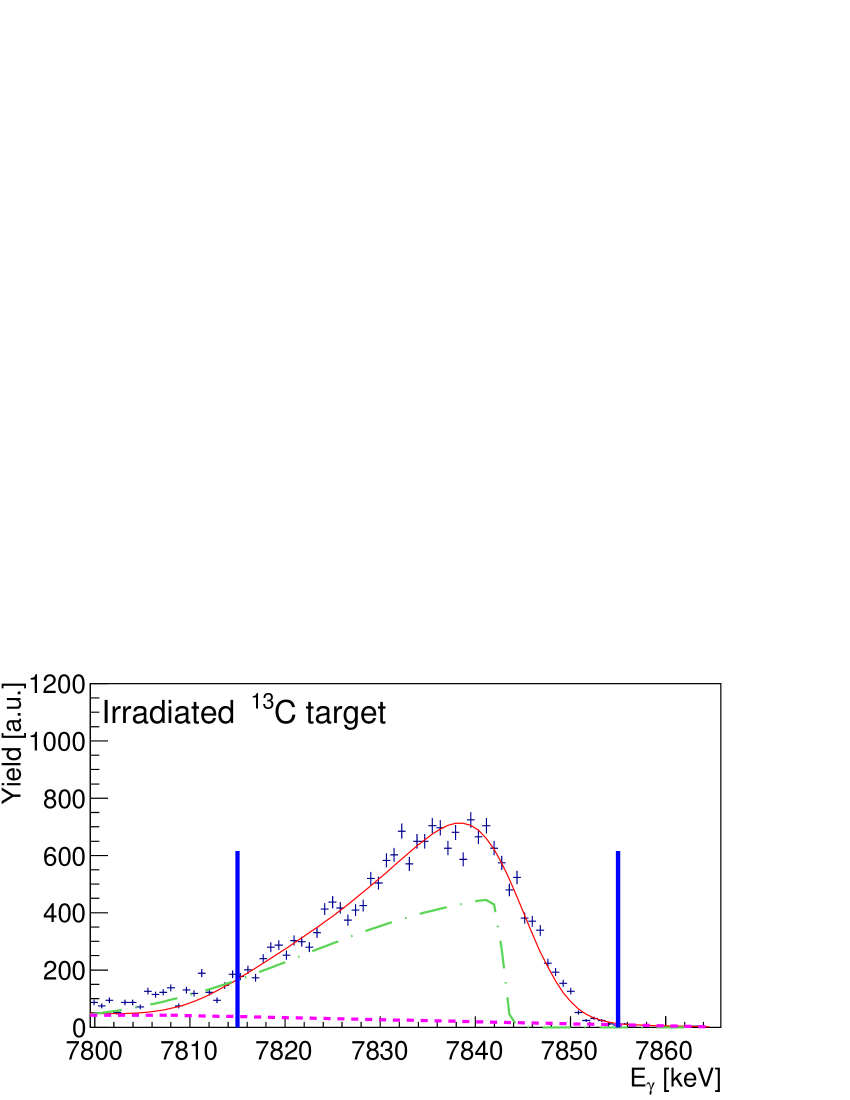 |
Table 2 reports the values of the fit parameters for both spectra shown in fig. 3. As expected, and show a significant change, indicating a strong modification in the target stoichiometry and a likely diffusion of 13C nuclei into the backing.
| [C] | [keV] | [keV] | [keV] | |
| 0 | 0 | 21.70.1 | 0.330.03 | 4.130.22 |
| 3.3 | 0.160.011 | 22.20.1 | 0.330.03 | 10.190.22 |
4 Validation and discussion
4.1 Role of inactive nuclides in the -shape analysis
In order to check the effect of possible light contaminants (e.g., H, He, C, O) on the effective stopping power, we performed several SRIM calculations for proton energies keV, and alpha energies keV (relevant to the 13C(,n)16O data taking campaign). In the energy ranges considered, the energy dependence of stopping power for each element (H, He, C, O), assumed as the only contaminant in the target, changes by less than 3% for proton projectiles and less than 5% for alpha particles. Similar conclusions can be drawn in the case where more than one contaminant is present at the same time. These conclusions were further supported by additional ERDA analysis performed on irradiated targets at the Ion Beam Center of Helmholtz-Zentrum Dresden-Rossendorf. The analysis confirmed that the concentration of elements such as H, He and O after the -beam irradiation at LUNA was at most 10% ERDA . We conclude that, for our -shape analysis, the effective stopping power is essentially insensitive to the actual species of inactive nuclei present in the target CianiPhD . Stoichiometric values obtained from the -shape fit are reported in table 3 for each one of the inactive species considered, together with the associated stopping powers for proton and beams.
| Inactive | |||
| species | [keV/atoms/cm2] | [keV/atoms/cm2] | |
| H | 1.920.15 | 14.361.44 | 59.963.21 |
| He | 1.190.11 | 14.511.45 | 54.794.14 |
| 12C | 0.550.023 | 14.511.45 | 57.673.15 |
| O | 0.480.016 | 14.651.46 | 56.652.80 |
| Ta | 0.160.011 | 14.531.45 | 53.452.64 |
4.2 Comparison of NRRA and -shape analysis results
To validate the results of the -shape analysis approach, a comparison to the results obtained with the well-established NRRA method was made. To this end, the effective stopping powers arising from the stoichiometric ratios obtained with the NRRA at keV (table 1) were recalculated at keV using eq. (3) assuming that the targets consist of a compound of only 13C and Ta.
Table 4 reports the values of the effective stopping powers obtained with the two methods for different accumulated (-beam) charges. The results obtained are in agreement within uncertainties (see sect. 4.3 for the uncertainties evaluation).
| Target | Charge | -shape | NRRA |
|---|---|---|---|
| [C] | |||
| T29 | 0 | 9.380.48 | 9.37 0.47 |
| T26 | 1.00 | 10.531.05 | 10.830.54 |
| T29 | 2.10 | 12.151.21 | 12.510.63 |
| T28 | 2.34 | 13.491.35 | 14.010.70 |
| MT10 | 3.30 | 14.531.45 | 15.640.78 |
4.3 Uncertainties budget
The overall uncertainty on the effective stopping power evaluation has three main contributions: a 4-5% systematic error on SRIM tabulated values of stopping powers for pure materials (common to both methods); a 1% and a 3% systematic error on the charge integration on target for measurements at Atomki (NRRA) and LUNA (-shape), respectively; a 2% and an 8% fit uncertainty on the extracted stoichiometric ratios from the NRRA and the -shape approaches, respectively. In both approaches, fit uncertainties were calculated PhysRevD.98.030001 by varying the within a range until the value increased by a fixed amount (which depends on the number of fit parameters, 3.2 in this specific case) around its minimum value. The overall uncertainty on the effective stopping power was then obtained by summing in quadrature all sources of errors and resulted in an overall 5% error for the NRRA measurements and an overall 10% error for the -shape analysis, respectively. A summary of the main uncertainties for the two techniques is presented in table 5.
| Uncertainty source | NRRA | -shape |
|---|---|---|
| Charge accumulation | 1% | 3% |
| Stopping power from SRIM | 5% | 5% |
| Evaluation of stioichimetric ratio | 2% | 8% |
| Total uncertainty | 5% | 10% |
5 Target degradation correction applied to the evaluation of the 13C(,n)16O reaction cross-section
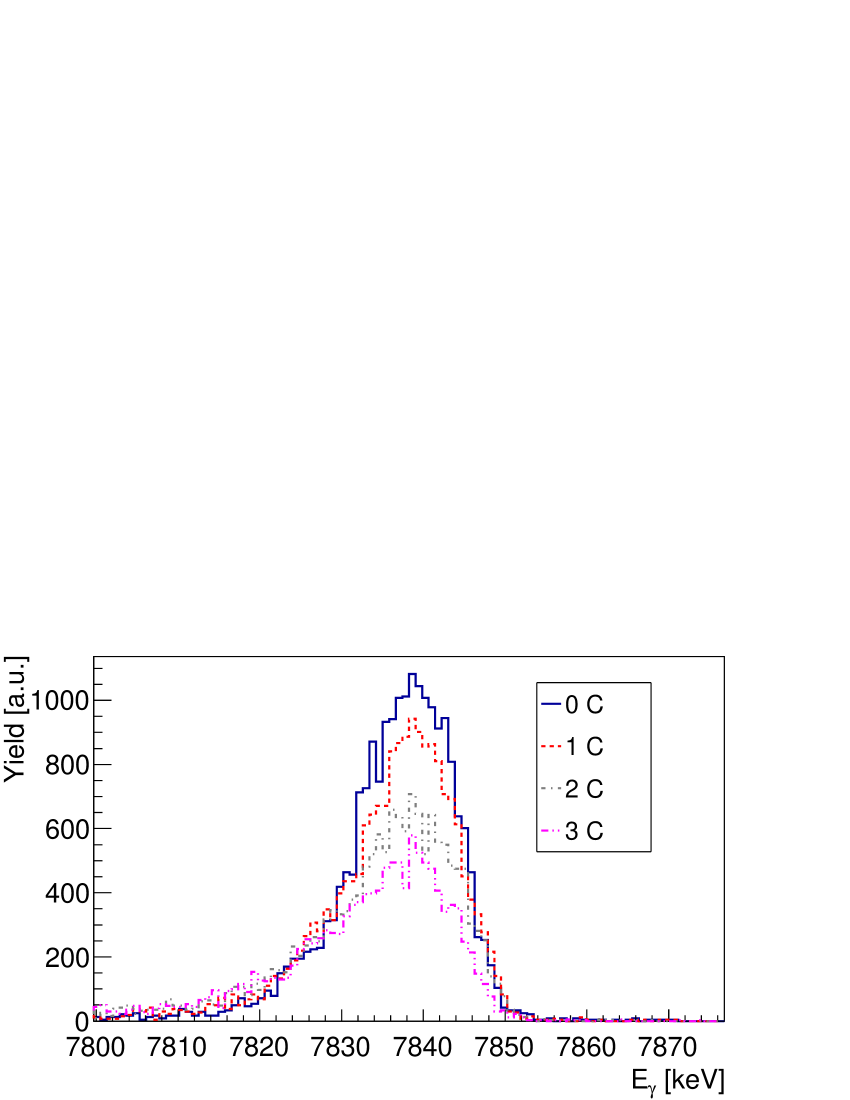
During the 13C(,n)16O data taking campaign, over a hundred 13C targets were used for an overall accumulated -beam charge of about 300 C. For each target, -ray spectra acquired during short proton runs, taken before and after long -beam irradiation runs, were analyzed following the procedure described in sect. 3 to correct for target degradation effects in the evaluation of the 13C(,n)16O reaction cross-section.
As an example, fig. 4 shows a superposition of the DC GS peak in four -ray spectra acquired on the same target at increasing values of accumulated (-beam) charge. As expected, the higher the accumulated charge, the lower the (p,) yield and the broader the shape of the -ray line.
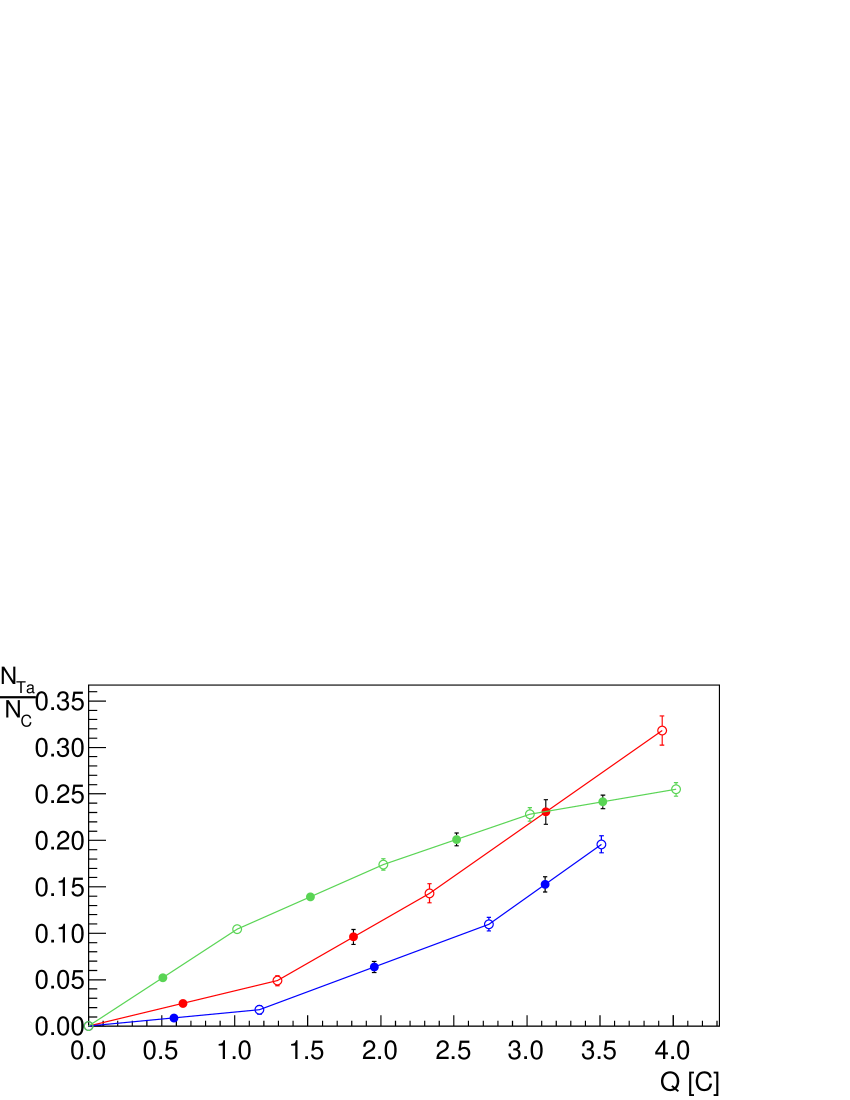
From fits to each peak, we extracted values of at the target surface and plotted them as a function of the accumulated charge (see fig. 5, where for clarity, results are displayed for three targets only). Open symbols in the figure correspond to stoichiometric ratios determined with the -shape analysis method on reference proton runs, while filled symbols correspond to linearly interpolated values. The latter were used to calculate average effective stopping powers (eq. 3) to be used in the evaluation of the 13C(,n)16O reaction cross-section, thus accounting for target degradation during long -beam irradiation in-between successive proton runs.
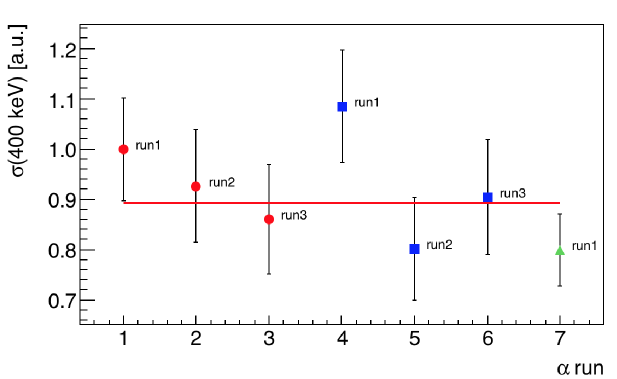
Figure 6 shows the 13C(,n)16O cross-sections (in arbitrary units) evaluated from measurements performed at the same beam energy ( keV) on three different targets. The error bars shown arise from a combination of statistical and systematic uncertainties in the evaluation. All data points are within 2 from the weighed average (red line).
Final results on the 13C(,n)16O cross-section over the full energy range ( keV) covered at LUNA will be presented in a forthcoming publication.
6 Conclusions
In this paper we reported on a new application of the -shape analysis used to monitor in situ the degradation of 13C targets exposed to intense -beam irradiation during the 13C(,n)16O reaction study at LUNA. Specifically, fits to the peak shape of the DC GS -ray transition in the 13C(p,)14N reaction were used to obtain quantitative information on target degradation as a function of accumulated (-beam) charge on target.
The -shape analysis was used as an alternative to the standard NRRA, whose application at LUNA was precluded by the lack of appropriate resonances in the energy range accessible with the 400 kV accelerator. NRRA measurements were, instead, performed at Atomki, both to characterize initial target thickness and stoichiometry and, for a subset of targets, as a way to validate the -shape analysis. A comparison of the stoichiometric values obtained with both methods shows agreement within experimental uncertainties.
We also verified that the effective stopping powers used in the evaluation of the 13C(,n)16O reaction cross-sections were independent from the assumption of inactive contaminant(s) present in the target.
The effective stopping power values obtained with the -shape analysis were extracted with an overall 10% uncertainty. While the use of the -shape analysis was validated specifically for 13C targets in the present study, this approach may have wider applications especially where the use of traditional analytical methods, such as the NRRA is not possible.
Acknowledgement
The authors would like to thank Donatello Ciccotti and the LNGS and INFN Naples mechanical workshops for technical support. The authors are grateful to Jaakko Julin and Frans Munnik for ERDA measurements at the Ion Beam Center of Helmholtz-Zentrum Dresden Rossendorf (HZDR). Support from the National Research, Development and Innovation Office NKFIH (contract numbers PD 129060 and K120666) is also acknowledged, as well as funding from STFC (ST/P004008/1), DFG (BE 4100/4-1), HGF (ERC-RA-0016) and the grant STAR from the University of Naples/Compagnia di San Paolo. This work is supported by “ChETEC” COST Action (CA16117). This is a pre-print of an article published in European Physical Journal A. The final authenticated version is available online at: https://doi.org/10.1140/epja/s10050-020-00077-0.
References
- (1) A. Jesus, B. Braizinha, J. Cruz, J. Ribeiro, Nuclear Instruments and Methods in Physics Research Section B: Beam Interactions with Materials and Atoms 174, 229 (2001)
- (2) J. Cruz, M. Fonseca, H. Luis, R. Mateus, H. Marques, A.P. Jesus, J.P. Ribeiro, O.M.N.D. Teodoro, C. Rolfs, Nuclear Instruments and Methods in Physics Research B 267, 478 (2009)
- (3) H. Silva, J. Cruz, A. Sánchez-Benítez, C. Santos, H. Luís, M. Fonseca, A. Jesus, Nuclear Instruments and Methods in Physics Research Section B: Beam Interactions with Materials and Atoms 406, 135 (2017)
- (4) A. Caciolli, D. A. Scott, A. Di Leva, A. Formicola, M. Aliotta, M. Anders, A. Bellini, D. Bemmerer, C. Broggini, M. Campeggio et al., European Physical Journal A 48, 144 (2012)
- (5) B. Paine, R. Averback, Nuclear Instruments and Methods in Physics Research Section B 7-8, 666 (1985)
- (6) M. Radek, B. Liedke, B. Schmidt, M. Voelskow, L. Bischoff, J. Hansen, A. Larsen, D. Bougeard, R. Böttger, S. Prucnal et al., Materials 10, 813 (2017)
- (7) Z. Wang, Nuclear Instruments and Methods in Physics Research Section B 2, 784 (1984)
- (8) J. Tesmer, M. Nastasi, Handbook of Modern Ion Beam Materials Analysis, Mrs Symposium Proceedings Series (Materials Research Society, 1995), ISBN 9781558992542
- (9) V. McGlone, P. Johnson, Nuclear Instruments and Methods in Physics Research Section B: Beam Interactions with Materials and Atoms 61, 201 (1991)
- (10) S. Cristallo, M.L. Cognata, C. Massimi, A. Best, S. Palmerini, O. Straniero, O. Trippella, M. Busso, G.F. Ciani, F. Mingrone et al., The Astrophysical Journal 859, 105 (2018)
- (11) A. Formicola, G. Imbriani, M. Junker, D. Bemmerer, R. Bonetti, C. Broggini, C. Casella, P. Corvisiero, H. Costantini, G. Gervino et al., Nuclear Instruments and Methods in Physics Research Section A: Accelerators, Spectrometers, Detectors and Associated Equipment 507, 609 (2003)
- (12) C. Broggini, D. Bemmerer, A. Caciolli, D. Trezzi, Progress in Particle and Nuclear Physics 98, 55 (2018)
- (13) G. Imbriani, H. Costantini, A. Formicola, A. Vomiero, C. Angulo, D. Bemmerer, R. Bonetti, C. Broggini, F. Confortola, P. Corvisiero et al., The European Physical Journal A - Hadrons and Nuclei 25, 455 (2005)
- (14) A. Caciolli, C. Mazzocchi, V. Capogrosso, D. Bemmerer, C. Broggini, P. Corvisiero, H. Costantini, Z. Elekes, A. Formicola, Zs. Fülöp et al., Astronomy & Astrophysics 533, A66 (2011)
- (15) C.G. Bruno, D.A. Scott, M. Aliotta, A. Formicola, A. Best, A. Boeltzig, D. Bemmerer, C. Broggini, A. Caciolli, F. Cavanna et al. (LUNA Collaboration), Physics Review Letters 117, 142502 (2016)
- (16) G. C.Bruno, M. Aliotta, P. Descouvemont, A. Best, T. Davinson, D. Bemmerer, A. Boeltzig, C. Broggini, A. Caciolli, F. Cavanna et al., Physics Letters B 790, 237 (2019)
- (17) A. Boeltzig, A. Best, F. Pantaleo, G. Imbriani, M. Junker, M. Aliotta, J. Balibrea-Correa, D. Bemmerer, C. Broggini, C. Bruno et al., Physics Letters B 795, 122 (2019)
- (18) C. Rolfs, W. Rodney, Cauldrons in the Cosmos: Nuclear Astrophysics, Theoretical Astrophysics (University of Chicago Press, 1988), ISBN 9780226724577
- (19) C. Iliadis, Nuclear Physics of Stars (Wiley-VCH, 2008), ISBN 9783527406029
- (20) J.F. Ziegler, J.P. Biersack, M.D. Ziegler, SRIM, the stopping and range of ions in matter (SRIM Co., 2008), ISBN 096542071, http://www.srim.org/
- (21) D. Vermilyea, Acta Metallurgica 1, 282 (1953)
- (22) D.E. Wolfe, J. Singh, Surface and Coatings Technology 124, 142 (2000)
- (23) I. Rajta, I. Vajda, G. Gyürky, L. Csedreki, Á.Z. Kiss, S. Biri, H.A.P. van Oosterhout, N.C. Podaru, D.J.W. Mous, Nuclear Instruments and Methods in Physics Research Section A 880, 125 (2018)
- (24) F. Ajzenberg-Selove, Nuclear Physics A 523, 1 (1991)
- (25) D. Rochman, A.J. Koning, J.Ch. Sublet, M. Fleming, E. Bauge, S. Hilaire, P. Romain, B. Morillon, H. Duarte, S. Goriely et al., EPJ Web of Conferences 146, 02006 (2017)
- (26) G.F. Ciani, A. Best, L. Csedreki, Gy. Gyürky, I. Kochanek, European Physical Journal Web of Conferences 165, 01012 (2017)
- (27) G. Ciani, Ph.D. thesis, Gran Sasso Science Institute and SISSA (2019)
- (28) D. Bemmerer, F. Cavanna, R. Depalo, M. Aliotta, M. Anders, A. Boeltzig, C. Broggini, C. Bruno, A. Caciolli, T. Chillery et al., Europhysics Letters 122, 52001 (2018)
- (29) J. Ziegler, J. Manoyan, Nuclear Instruments and Methods in Physics Research Section B: Beam Interactions with Materials and Atoms 35, 215 (1988)
- (30) P.J. LeBlanc, G. Imbriani, J. Görres, M. Junker, R. Azuma, M. Beard, D. Bemmerer, A. Best, C. Broggini, A. Caciolli et al., Physical Review C 82, 055804 (2010)
- (31) D.A. Scott, A. Caciolli, A. Di Leva, A. Formicola, M. Aliotta, M. Anders, D. Bemmerer, C. Broggini, M. Campeggio, P. Corvisiero et al. (LUNA Collaboration), Physics Review Letters 109, 202501 (2012)
- (32) A. Di Leva, D.A. Scott, A. Caciolli, A. Formicola, F. Strieder, M. Aliotta, M. Anders, D. Bemmerer, C. Broggini, P. Corvisiero et al., Physical Review C 89, 015803 (2014)
- (33) L. Csedreki, G. F. Ciani, I. Kochanek, A. Best, European Physical Journal Web of Conferences 165, 01017 (2017)
- (34) J. King, R. Azuma, J. Vise, J. Görres, C. Rolfs, H. Trautvetter, A. Vlieks, Nuclear Physics A 567, 354 (1994)
- (35) G. Genard, P. Descouvemont, G. Terwagne, Journal of Physics: Conference Series 202, 012015 (2010)
- (36) J. Julin, F. Munnik, Private Communication (2019)
- (37) M. Tanabashi, K. Hagiwara, K. Hikasa, K. Nakamura, Y. Sumino, F. Takahashi, J. Tanaka, K. Agashe, G. Aielli, C. Amsler et al. (Particle Data Group), Physical Review D 98, 030001 (2018)