Tensor-based grading: a novel patch-based grading approach for the analysis of deformation fields in Huntington’s disease
Abstract
The improvements in magnetic resonance imaging have led to the development of numerous techniques to better detect structural alterations caused by neurodegenerative diseases. Among these, the patch-based grading framework has been proposed to model local patterns of anatomical changes. This approach is attractive because of its low computational cost and its competitive performance. Other studies have proposed to analyze the deformations of brain structures using tensor-based morphometry, which is a highly interpretable approach. In this work, we propose to combine the advantages of these two approaches by extending the patch-based grading framework with a new tensor-based grading method that enables us to model patterns of local deformation using a log-Euclidean metric. We evaluate our new method in a study of the putamen for the classification of patients with pre-manifest Huntington’s disease and healthy controls. Our experiments show a substantial increase in classification accuracy ( vs. ) compared to the existing patch-based grading methods, and a good complement to putamen volume, which is a primary imaging-based marker for the study of Huntington’s disease.
Index Terms— Patch-based grading, tensor-based morphometry, Huntington’s disease
1 Introduction
Huntington’s disease (HD) is a fatal autosomal dominant inherited disorder that causes motor, behavioral and cognitive symptoms. Imaging studies have shown structural changes in the striatum [1]. Moreover, it has been demonstrated that the volume of the putamen is a sensitive imaging-based marker for the tracking of changes that occur in the lifespan of patients with HD [2]. Unlike many other degenerative diseases, gene status can be established via a genetic test well before the onset of first symptoms, which makes HD a good candidate for the evaluation of new imaging-based methods.
Numerous advanced methods have been developed to detect the structural modifications earlier in the course of neurodegenerative diseases using anatomical MRI [3]. On the one hand, studies have proposed to perform analysis based on MRI intensity. Among these methods, the patch-based grading framework has shown attractive characteristics such as low computational cost and competitive performance to recent methods based on deep-learning [4, 5]. In addition, patch-based grading methods also provides the localization of structural differences. Indeed, these approaches aim to measure the local similarity of anatomical patterns by comparing the MRI under study to a template library composed of MRIs representing two distinct populations. Patch-based grading has been successfully applied to various intensity-based features, such as gray matter density maps [6], features extracted using texture filters [7], and diffusion-weighted imaging parameters [8]. On the other hand, many studies have proposed to assess anatomical changes among MRIs with the analysis of the deformation tensor fields resulting from image registration [9]. Features derived from deformation tensors are highly interpretable since they provide both localization and geometric characteristic of the brain alterations. Indeed, these methods register the MRIs under study into the same stereotaxic space and use the resulting deformation fields to capture regional changes of brain structures (e.g., local expansion or shrinkage). In particular, the log-Euclidean approach has been proposed as an efficient Riemannian framework for tensor-based morphometry [10]. The efficiency of tensor-based approaches has been demonstrated in diverse applications such as disease detection, longitudinal studies, clinical trials, and stability control of acquisition protocols [11, 12, 13].
In this paper, we propose to combine the respective advantages of patch-based grading and tensor-based morphometry in a novel tensor-based grading framework. We evaluate our method with the classification of pre-manifest HD patients and control subjects. The performance of our new method is compared with the volume of the putamen, the original patch-based grading using T1w intensities, and a recent texture-based grading approach. In addition, we also investigate the complementary nature of these different methods. These experiments show that our new method has competitive performance and also suggest complementarity with volumetric features.
2 Materials and Methods
2.1 Dataset
All T1-weighted (T1w) MRIs come from the PREDICT-HD study [14], which is a multi-site longitudinal study of HD. The MRIs have been acquired using 3 Tesla MRI scanners from different vendors (e.g., GE, Phillips, and Siemens). The cohort used in the study includes 683 MPRAGE images from subjects representing three populations: control subjects (CN), pre-manifest HD that is composed of subjects with the expanded cytosine-adenine-guanine (CAG) repeat but who have not yet had a motor diagnosis at the time of the scan, and manifest HD which refers to patients who already have a motor diagnosis by the time of the scan (see Table 1). Only subjects with CAG length from 41 to 43 repeats and at least 2 longitudinal scans at 3T have been embedded in this study.
| Control | Huntington’s disease | ||
|---|---|---|---|
| Pre-manifest | Manifest | ||
| Number of MRIs | 327 | 300 | 56 |
| Age (years) | 49.311.9 | 43.410.1 | 56.86.5 |
| Sex (F/M) | 206/121 | 199/101 | 28/28 |
| CAG length | 15-35 | 41-43 | 41-43 |
2.2 Preprocessing
The preprocessing has been conducted with the BRAINSAutoWorkup pipeline [15]. This pipeline is composed of the following steps: (1) denoising with non-local means filter, (2) anterior/posterior commissure and intra-subject alignments with rigid transformation, (3) bias-field correction, and (4) regional segmentation mask with a multi-atlas method using atlases from Neuromorphometrics111http://www.neuromorphometrics.com. After rigid alignment, we take the union of the putamen masks of all subjects. The bounding box of this union is used as a region of interest (ROI). All images are cropped with this common ROI.
2.3 Deformation-based tensor computation
A non-rigid symmetric normalization registration [16] has been conducted to estimate deformation fields in the ICBM 152 nonlinear stereotaxic space222http://www.bic.mni.mcgill.ca/ServicesAtlases/ICBM152NLin2009 . Next, the Jacobian matrix of the resulting deformation field, defined at each voxel as:
| (1) |
has been used to compute the deformation-based tensor that describes the geometry of local deformation at each voxel.
2.4 Tensor-based grading
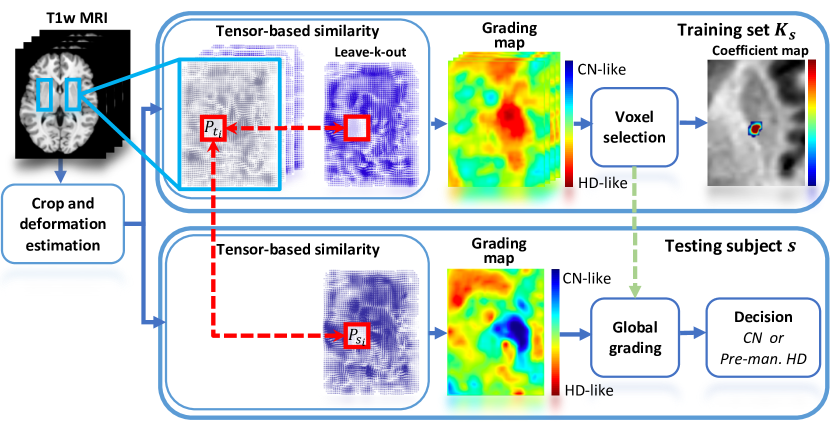
Once the deformation-based tensor field is computed, local similarities are estimated at each voxel to estimate the degree of the structural changes (see Fig. 1). We use a patch-based grading approach [4] instead of analyzing each tensor independently of its neighborhood, in contrast to tensor-based morphometry [9, 10]. We hypothesize that such a patch-wise analysis will enable us to better model the deformation patterns.
First, for each subject , a template library composed of the tensor fields from CN and manifest HD patients is built using an age matching preselection. This preselection technique aims to reduce the bias introduced by age-related differences. Then, at each voxel (i.e., image coordinate) of the subject , the patch-based grading is computed as,
| (2) |
where is used to normalize the patch similarity at each voxel. is a binary indicator of the pathological status of the template , set to for manifest HD and for control. The distance is based on the log-Euclidean framework [10]. describes the similarity of two tensor patches and surrounding voxel and is defined as follows:
| (3) |
where is the number of voxels in each patch, and is the index (ranging from ) within the patch of tensors centered around voxel , such that and are individual tensors in the patches and in subject and template , respectively.
2.5 Feature selection and global grading computation
Since the images have been deformably registered into the same space, we can compare the grading values at a given voxel across the set of images and use these as features for classification. This further allows us to use feature selection techniques to select the most discriminant voxels [5]. In our work, we used an elastic-net regularization model that provides a sparse representation of the most discriminative features, defined as follows:
| (4) |
where represents the regularization coefficients computed using the tensor-based grading maps composed of the as defined in Eq. 2, computed on an inner fold of the cross-validation within the template library . represents the vector of pathological status composed of the binary indicators defined in Sec. 2.4. Finally, a global tensor-based grading feature for the subject is computed as,
| (5) |
Thus, represents a measure that estimates the global deformation differences of the subject under study.
2.6 Evaluation and implementation details
We evaluate our new method by classifying pre-manifest HD patients and control subjects. For each subject , the template library has been built using 100 deformation-based tensor fields, 50 from CN MRI and 50 from manifest HD MRI pre-selected via age matching to the subject . Moreover, all longitudinal scans of a given subject have been removed from its template library to avoid double-dipping. The tensor fields have been estimated using a non-rigid diffeomorphic registration computed using ANTs [16]. The registration has been performed using the cross-correlation metric and the smoothing parameter has been set to 2mm. The elastic-net regularization model has been computed using the Matlab Statistic and Machine Learning toolbox, with and (see Eq. 4). The classification has been computed using a linear support vector machine with the soft margin parameter set to . Finally, a stratified cross-validation procedure iterated 100 times has been conducted.
2.7 Comparison with state-of-the-art
To evaluate the performance of the proposed tensor-based grading method, we conduct single-feature and two-feature classification experiments. The features compared are the volume of putamen using the multi-atlas label fusion segmentation mask obtained from the BRAINSAutoWorkup pipeline [15], patch-based grading using T1w intensity [4], and a patch-based grading approach that fuses grading maps estimated from different texture maps [7]. These latter two features have been aggregated within the putamen segmentation mask to obtain the global grading. Moreover, for these two patch-based grading methods, a piece-wise linear histogram standardization has been used to normalize intensities. The mean accuracy (ACC), sensibility (SEN), and specificity (SPE) over the 100 iterations are reported.
3 Results and Discussion
| Accuracy | Sensitivity | Specificity | |
|---|---|---|---|
| 1x1x1 (voxel) | 82.10.5 | 81.70.7 | 82.50.8 |
| 3x3x3 (patch) | 87.50.5 | 88.20.7 | 86.90.6 |
| 5x5x5 (patch) | 86.10.5 | 86.00.7 | 86.20.7 |
First, we investigated the effect of patch size for the classification of pre-manifest HD patients and control subjects. Table 2 summarizes the obtained results. We compared voxel-wise (i.e., 111 voxel) and patch-wise (i.e., 333 and 555 voxels) tensor-based grading. The results of this experiment demonstrate the importance of embedding neighbor deformations. Indeed, patch-wise tensor-based grading using patches of 333 voxels obtained in average 87.5% accuracy, which improves the tensor-based grading using single voxel-wise similarity by 5 percentage points in accuracy and specificity, and 7 percentage points in sensitivity. In our experiments, we limited our investigation to patch sizes up to 555 voxels since the computational cost becomes prohibitive.
| Accuracy | Sensitivity | Specificity | |
|---|---|---|---|
| Putamen volume | 82.90.5 | 84.30.6 | 81.30.6 |
| Intensity-based grading | 73.80.7 | 77.01.0 | 70.80.7 |
| Texture-based grading | 81.30.6 | 82.10.7 | 80.70.9 |
| Proposed method | 87.50.5 | 88.20.7 | 86.90.6 |
Second, the proposed tensor-based grading method was compared to putamen volume, which is provided as baseline, the original patch-based grading using T1w intensities [4], and a texture-based grading approach [7]. The results are summarized in Table 3. The classification performance of intensity-based grading is low compared to the volume of putamen. This result is unexpected given the detection performance of this approach obtained for other neurodegenerative diseases (e.g., Alzheimer’s disease [4]). We note that this low performance may be caused by the highly heterogeneous nature of the dataset used to evaluate our method. As described in Sec. 2.1, the PREDICT-HD dataset includes MRIs from diverse scanners and acquisition sequences [14]. The grading performance is somewhat improved by the use of texture, which obtains comparable accuracy to the volume of putamen. In contrast, our novel tensor-based grading obtains 87.5% accuracy for the classification of pre-manifest HD patients. This improves the accuracy by 5 percentage points compared to putamen volume and texture-based grading and by 13 percentage points compared to intensity-based grading. We hypothesize that the superior performance of tensor-based grading compared to traditional grading approaches may partially come from the use of tensor fields instead of features derived from MRI intensity, since deformation-based tensor fields might be less impacted by the heterogeneous nature of acquisition sequences than intensity-based features. Tensor-based grading also provides a potentially more interpretable description of the structural differences since it indicates not only the localization but also the local geometry of the detected differences. Another advantage of this method is that it does not require an explicit segmentation of the structure.
| Accuracy | Sensitivity | Specificity | |
|---|---|---|---|
| Volume + Texture | 84.40.6 | 84.60.7 | 84.30.9 |
| Volume + Tensor | 89.10.4 | 88.50.6 | 89.60.7 |
| Tensor + Texture | 87.90.4 | 88.40.7 | 87.40.6 |
Next, as described in Table 4, the complementarity of the different methods for the classification of pre-manifest HD patients and control subjects has been investigated. The results of this experiment show that the combination of volume with texture-based grading, and volume with tensor-based grading improve the classification performance compared to the use of single feature. Indeed, the combination of putamen volume and tensor-based grading obtains 89.1% accuracy, which mainly benefits from a higher specificity than the tensor-based grading method alone. In contrast, the combination of texture and tensor-based features does not improve classification performance.
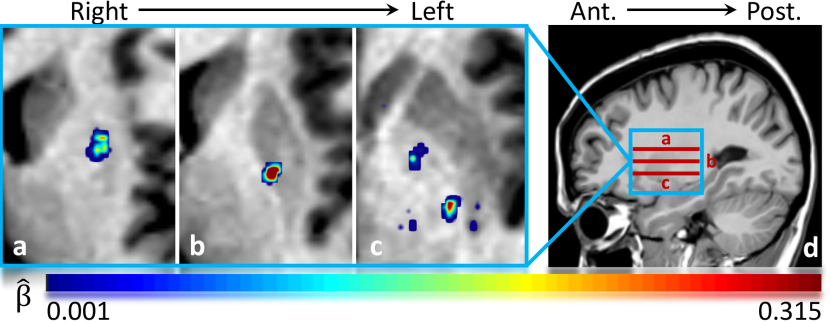
Finally, Fig. 2 presents the coefficient map of the left putamen area estimated from Eq. 4. This illustrates the interpretability of the results obtained from the proposed method. Indeed, our method enables us to highlight the areas where the most discriminant deformations occur. In our work, results indicate a discriminant deformation of the superior part of putamen (Fig. 2-a). Our results also show an abnormal deformation on the medial side of the putamen (Fig. 2-b), and around the globus pallidus (Fig. 2-c). These results are in line with previous imaging-based anatomical studies that used volumetric measurements [17]. It is noteworthy that while we focused our current experiments on the putamen, nevertheless we also found discriminant features in the surrounding structures such as the globus pallidus. In future work, we will extend this work to whole brain analysis.
4 Conclusion
In this work, we proposed a novel tensor-based grading method for the analysis of tensor fields obtained from non-rigid registration. The proposed method has been evaluated with the classification of pre-manifest HD and control subjects by analyzing the putamen area. Our approach has shown an increase of performance compared to previous patch-based approaches based on MRI intensity and texture. It also outperformed the classification results using the volume of putamen. In addition, our experiments indicate the complementary nature of putamen volume and tensor-based grading.
References
- [1] C A Ross, E H Aylward, E J Wild, D R Langbehn, J D Long, J H Warner, R I Scahill, B R Leavitt, J C Stout, J S Paulsen, et al., “Huntington disease: natural history, biomarkers and prospects for therapeutics,” Nature Reviews Neurology, vol. 10, no. 4, pp. 204, 2014.
- [2] J S Paulsen, J D Long, H J Johnson, E H Aylward, C A Ross, J K Williams, M A Nance, C J Erwin, H K Westervelt, D L Harrington, et al., “Clinical and biomarker changes in premanifest huntington disease show trial feasibility: a decade of the PREDICT-HD study,” Frontiers in aging neuroscience, vol. 6, pp. 78, 2014.
- [3] M R Arbabshirani, S Plis, J Sui, and V D Calhoun, “Single subject prediction of brain disorders in neuroimaging: promises and pitfalls,” Neuroimage, vol. 145, pp. 137–165, 2017.
- [4] P Coupé, S F Eskildsen, J V Manjón, V S Fonov, J C Pruessner, M Allard, D L Collins, Alzheimer’s Disease Neuroimaging Initiative, et al., “Scoring by nonlocal image patch estimator for early detection of Alzheimer’s disease,” NeuroImage: clinical, vol. 1, no. 1, pp. 141–152, 2012.
- [5] T Tong, Q Gao, R Guerrero, C Ledig, L Chen, D Rueckert, Alzheimer’s Disease Neuroimaging Initiative, et al., “A novel grading biomarker for the prediction of conversion from mild cognitive impairment to Alzheimer’s disease,” IEEE Transactions on Biomedical Engineering, vol. 64, no. 1, pp. 155–165, 2016.
- [6] M Komlagan, V-T Ta, X Pan, J-P Domenger, D L Collins, P Coupé, Alzheimer’s Disease Neuroimaging Initiative, et al., “Anatomically constrained weak classifier fusion for early detection of Alzheimer’s disease,” in International Workshop on Machine Learning in Medical Imaging. Springer, 2014, pp. 141–148.
- [7] K Hett, V-T Ta, J V Manjón, P Coupé, Alzheimer’s Disease Neuroimaging Initiative, et al., “Adaptive fusion of texture-based grading for Alzheimer’s disease classification,” Computerized Medical Imaging and Graphics, vol. 70, pp. 8–16, 2018.
- [8] K Hett, V-T Ta, G Catheline, T Tourdias, J V Manjón, and P Coupe, “Multimodal hippocampal subfield grading for Alzheimer’s disease classification,” Scientific Reports, vol. 9, no. 1, pp. 1–16, 2019.
- [9] J Ashburner and K J Friston, “Voxel-based morphometry–the methods,” NeuroImage, vol. 11, no. 6, pp. 805–821, 2000.
- [10] V Arsigny, P Fillard, X Pennec, and N Ayache, “Log-Euclidean metrics for fast and simple calculus on diffusion tensors,” Magnetic Resonance in Medicine: An Official Journal of the International Society for Magnetic Resonance in Medicine, vol. 56, no. 2, pp. 411–421, 2006.
- [11] X Hua, B Gutman, C P Boyle, P Rajagopalan, A D Leow, I Yanovsky, A R Kumar, A W Toga, C R Jack Jr, N Schuff, et al., “Accurate measurement of brain changes in longitudinal MRI scans using tensor-based morphometry,” NeuroImage, vol. 57, no. 1, pp. 5–14, 2011.
- [12] A D Leow, A D Klunder, C R Jack Jr, A W Toga, A M Dale, M A Bernstein, P J Britson, J L Gunter, C P Ward, J L Whitwell, et al., “Longitudinal stability of MRI for mapping brain change using tensor-based morphometry,” NeuroImage, vol. 31, no. 2, pp. 627–640, 2006.
- [13] J Koikkalainen, J Lötjönen, L Thurfjell, D Rueckert, G Waldemar, H Soininen, Alzheimer’s Disease Neuroimaging Initiative, et al., “Multi-template tensor-based morphometry: application to analysis of Alzheimer’s disease,” NeuroImage, vol. 56, no. 3, pp. 1134–1144, 2011.
- [14] J S Paulsen, D R Langbehn, J C Stout, E Aylward, C A Ross, M Nance, M Guttman, S Johnson, M MacDonald, L J Beglinger, et al., “Detection of Huntington’s disease decades before diagnosis: the Predict-HD study,” Journal of Neurology, Neurosurgery & Psychiatry, vol. 79, no. 8, pp. 874–880, 2008.
- [15] R Pierson, H Johnson, G Harris, H Keefe, J S Paulsen, N C Andreasen, and V A Magnotta, “Fully automated analysis using BRAINS: AutoWorkup,” NeuroImage, vol. 54, no. 1, pp. 328–336, 2011.
- [16] B B Avants, N J Tustison, G Song, P A Cook, A Klein, and J C Gee, “A reproducible evaluation of ANTs similarity metric performance in brain image registration,” NeuroImage, vol. 54, no. 3, pp. 2033–2044, 2011.
- [17] L Younes, J T Ratnanather, T Brown, E Aylward, P Nopoulos, H Johnson, V A Magnotta, J S Paulsen, R L Margolis, R L Albin, et al., “Regionally selective atrophy of subcortical structures in prodromal HD as revealed by statistical shape analysis,” Human Brain Mapping, vol. 35, no. 3, pp. 792–809, 2014.