A Large Scale Event-based Detection Dataset for Automotive
Abstract
We introduce the first very large detection dataset for event cameras. The dataset is composed of more than 39 hours of automotive recordings acquired with a 304x240 GEN1 sensor. It contains open roads and very diverse driving scenarios, ranging from urban, highway, suburbs and countryside scenes, as well as different weather and illumination conditions.
Manual bounding box annotations of cars and pedestrians contained in the recordings are also provided at a frequency between 1 and 4Hz, yielding more than 255,000 labels in total. We believe that the availability of a labeled dataset of this size will contribute to major advances in event-based vision tasks such as object detection and classification. We also expect benefits in other tasks such as optical flow, structure from motion and tracking, where for example, the large amount of data can be leveraged by self-supervised learning methods.
1 Introduction
Large datasets are a fundamental ingredient for modern computer vision [9, 28]. On one side, the availability of large benchmarked datasets allowed objective and common evaluation of novel algorithms against the state-of-the-art [11, 21, 28]. The diverse and large amount of samples in these datasets guarantee robustness in real-world applications, compared to small datasets. On another side, large labeled datasets opened the possibility to train very deep machine learning models [21, 23, 17], able to generalize well also on samples drawn from different distributions than the train set.
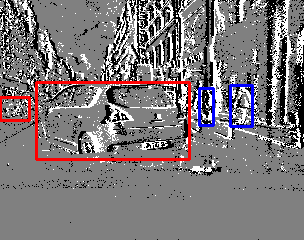
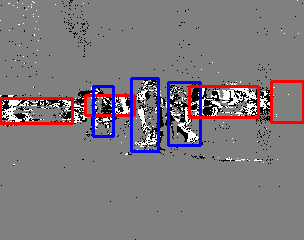
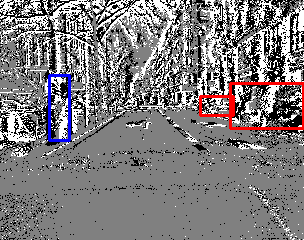
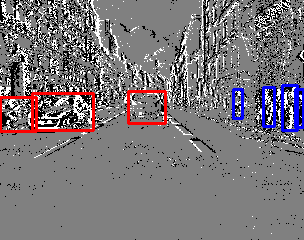
Event-based vision, which is the field of performing visual tasks from the output of an event camera [13], is a much younger research filed compared to standard frame-based computer vision. Event cameras [27, 35, 40] are a recent sensor representing visual information in the form of an asynchronous stream of events, representing log-luminosity contrast changes at time and location . With a binary variable indicating the sign of the contrast change, Fig. 1.
 |
 |
 |
 |
Event cameras are characterized by very high dynamic range (120dB), extremely high temporal resolution (in the order of microseconds) and adaptive data rate (in fact, events are produced only at the time and positions of a contrast change). As a consequence, event cameras do not suffer from oversampling, undersampling and motion blur.
Similarly to frame-based vision, low-level event-based vision tasks such as noise filtering [19], edge detection [22, 25], clustering [3], etc. have been addressed using analytical and geometrical methods.
However, as the complexity of the task increases, the number of variables and parameters of a system aiming at solving them also increases. Tuning this large number of parameters without a data-driven approach becomes soon impractical.
For this reason, event-based vision is increasingly adopting machine learning techniques [45, 30, 29, 37]. Together with these methods, several datasets have been released [34, 42, 44, 4].
However, the size of these datasets is much smaller compared to their frame-based counterparts. To give an example, the largest labeled event-based dataset to date for classification [4] is composed of 100,800 samples, while Imagenet [9] contains 14 millions labeled images!
Due to the scarce availability of real event-based dataset, many researchers turned to simulator-based solutions [36, 14]. This approach is appealing because it simplifies label generation and it can be complementary to real data collection. However, real sequences remain fundamental in order to capture the unique properties of the event-based sensors, which can not be obtained starting from sequences of frames, and to be robust to noise and unidealities, which are hard to simulate with an idealized model.
With this work, we release more than 39 hours of automotive recordings taken with an GEN1 [35] event camera in realistic driving conditions. Each recording has a variable duration between tens of minutes and several hours. We also collect and release 228,123 cars and 27,658 pedestrians bounding boxes, obtained by manually labeling the gray-level images provided by the GEN1 sensor, at a frequency of 1Hz, 2Hz or 4Hz, depending on the sequence.
To the best of our knowledge, this is the largest event-based dataset ever released in terms of both total number of hours and total number of labels. It is also the only automotive one providing accurate bounding box localization for a multi-class detection task.
Thanks to this dataset, we reduce the gap between frame-based datasets and event-based datasets. In this way, we hope that also the gap in accuracy between frame-based and event-based vision systems will sharply decrease. We expect benefits for both supervised tasks, such as detection and classification, and self-supervised ones, such as optical flow, monocular-depth estimation as well as tracking.
2 Related Work
In this section, we describe the main existing event-based datasets. We start by describing labeled datasets for recognition and classification tasks, and then we describe datasets generated for other tasks, such as visual odometry and optical flow.
Event-based Datasets for Recognition
Early event-based datasets have been generated by converting existing frame-based datasets to an event representation [34, 41, 18]. For example in [34], the MMINST [24] and Caltech-101 [12] datasets have been converted to events by moving an event camera in front of a screen displaying the images. Similarly in [18] the [20, 15, 38] frame-based datasets have been converted by positioning a static event-based camera in front of a monitor playing the datasets.
The advantage of these approaches is that it is possible to create large datasets without the need of costly manual labeling. The drawback is that the planar display and the limited frequency of the screen results in unnatural and very constrained event sequences.
Because of this, recent works have focused in realizing real world datasets for recognition.
For example, in [42] 12,336 car examples were manually labeled and extracted from open road driving recordings, together with 11,693 background samples.
In [2] and [4] instead, two gesture recognition datasets were built by asking several human subjects to perform the gestures in front of the camera. For example, [4] contains 100,800 examples and it is the largest classification dataset available to date in terms of number of labels. However, each sample contains only 100ms of data, cropped from longer sequences. This reduces the actual variability contained in the training data and amounts to less than 3 hours of data.
The authors of [31] acquired several recordings from an event camera to build 3 datasets for surveillance applications: one for pedestrian detection, one for an action recognition and one for fall detection. The labels for the pedestrian dataset were obtained by building image-like representation from 20ms of events and then manually annotating them. This is the first event-based dataset from real data for detection. However, the dataset is composed by only 12 sequences of 30 seconds.
Finally, the authors of [7] collect an event-based datasets for 3D pose estimation. Ground-truth was obtained using motion capture and infrared cameras together with reflective markers positioned on the human subjects joints.
Event-based Datasets for Visual Odometry, Optical Flow and Stereo
Other datasets focus on different applications than recognition, and they can leverage complementary sensors or techniques for automated labeling.
In [5], 12 hours of driving sequences are obtained during day and night time. Various car information, such as vehicle speed, GPS position, driver steering angle, are associated to the dataset. The dataset has been used for end-to-end steering angle prediction [30] and also to generate pseudo-labels for event data, by running standard frame-based detectors on the graylevel images provided with the dataset [8].
The authors of [44], collected sequences using several complementary sensors coupled to the event camera. In particular, depth ground truth is provided thanks to the use of a lidar. This dataset has been extended to obtain optical flow ground-truth [45].
In [26] 10 hours of stereo recordings have been acquired together with pose ground-truth at 100Hz. In [33] a motion segmentation dataset is realized, while the autors of [29] focus instead of the problem of corner detection by realizing a dataset in the same spirit of the frame-based [32]. Finally, it is worth mentioning the first color event-based dataset [39].
An event-based simulator is available in [36] to generate event sequences from standard videos. For example, it has been used in [37] for learning to reconstruct a graylevel images from events. And in [14] together with a slowmotion frame-based method to convert frame-based datasets to event-based ones.
Using a simulator to convert frame-based data into event-based is a valid and complementary approach to real data collection. However, the need of real data is still essential to fully leverage properties of the event cameras, such as high-dynamic range and high temporal resolution, which are not properly captured by standard frame-based cameras. Moreover, accurately replicating noise, sensor unidealities, read-out effects, etc. of real event-based cameras can be challenging using an idealized simulation model.
The amount of datasets released in the past years confirms the growing interest in event-based vision and a very active community. However, the size and the annotations of the available datasets is still very minor compared to frame-based datasets such as Imagenet [9] or COCO [28]. Yet, accurate annotations and very large datasets are critical for designing and evaluating vision systems that can operate reliably in realworld situations.
In the next section, we describe the first detection event-based dataset with accurate manual annotation of cars and pedestrians in real driving conditions. The datasets contains more that 39 hours of data, and it is the largest event-based dataset ever made available to the public.
3 The ATIS Automotive Detection Dataset
3.1 Event Cameras
Event cameras are a relatively recent type of sensor encoding visual information in the form of asynchronous events [27, 35, 40]. An event corresponds to a change in the log-luminosity intensity at a given pixel location.
In an event camera, the photosensitive part is composed by a 2D array of independent pixels. Whenever a pixel detects a change in illuminance intensity, it emits an event containing its position in the pixel array, the microsecond timestamp of the observed change and its polarity . The polarity encodes whether the illuminance intensity increased () or decreased ().
Compared to standard frame cameras, event cameras have higher temporal resolution, higher dynamic range and lower power consumption. Thanks to these characteristics, event cameras find many applications in automotive, robotics and IoT, where low latency, robustness to challenging lighting conditions and power consumption are critical requirements.
Many event cameras are currently available in the market [1, 43, 16, 6]. Some of them also provide graylevel information in forms of synchronous frames [6, 16] or by asynchronous event-based measurements [1].
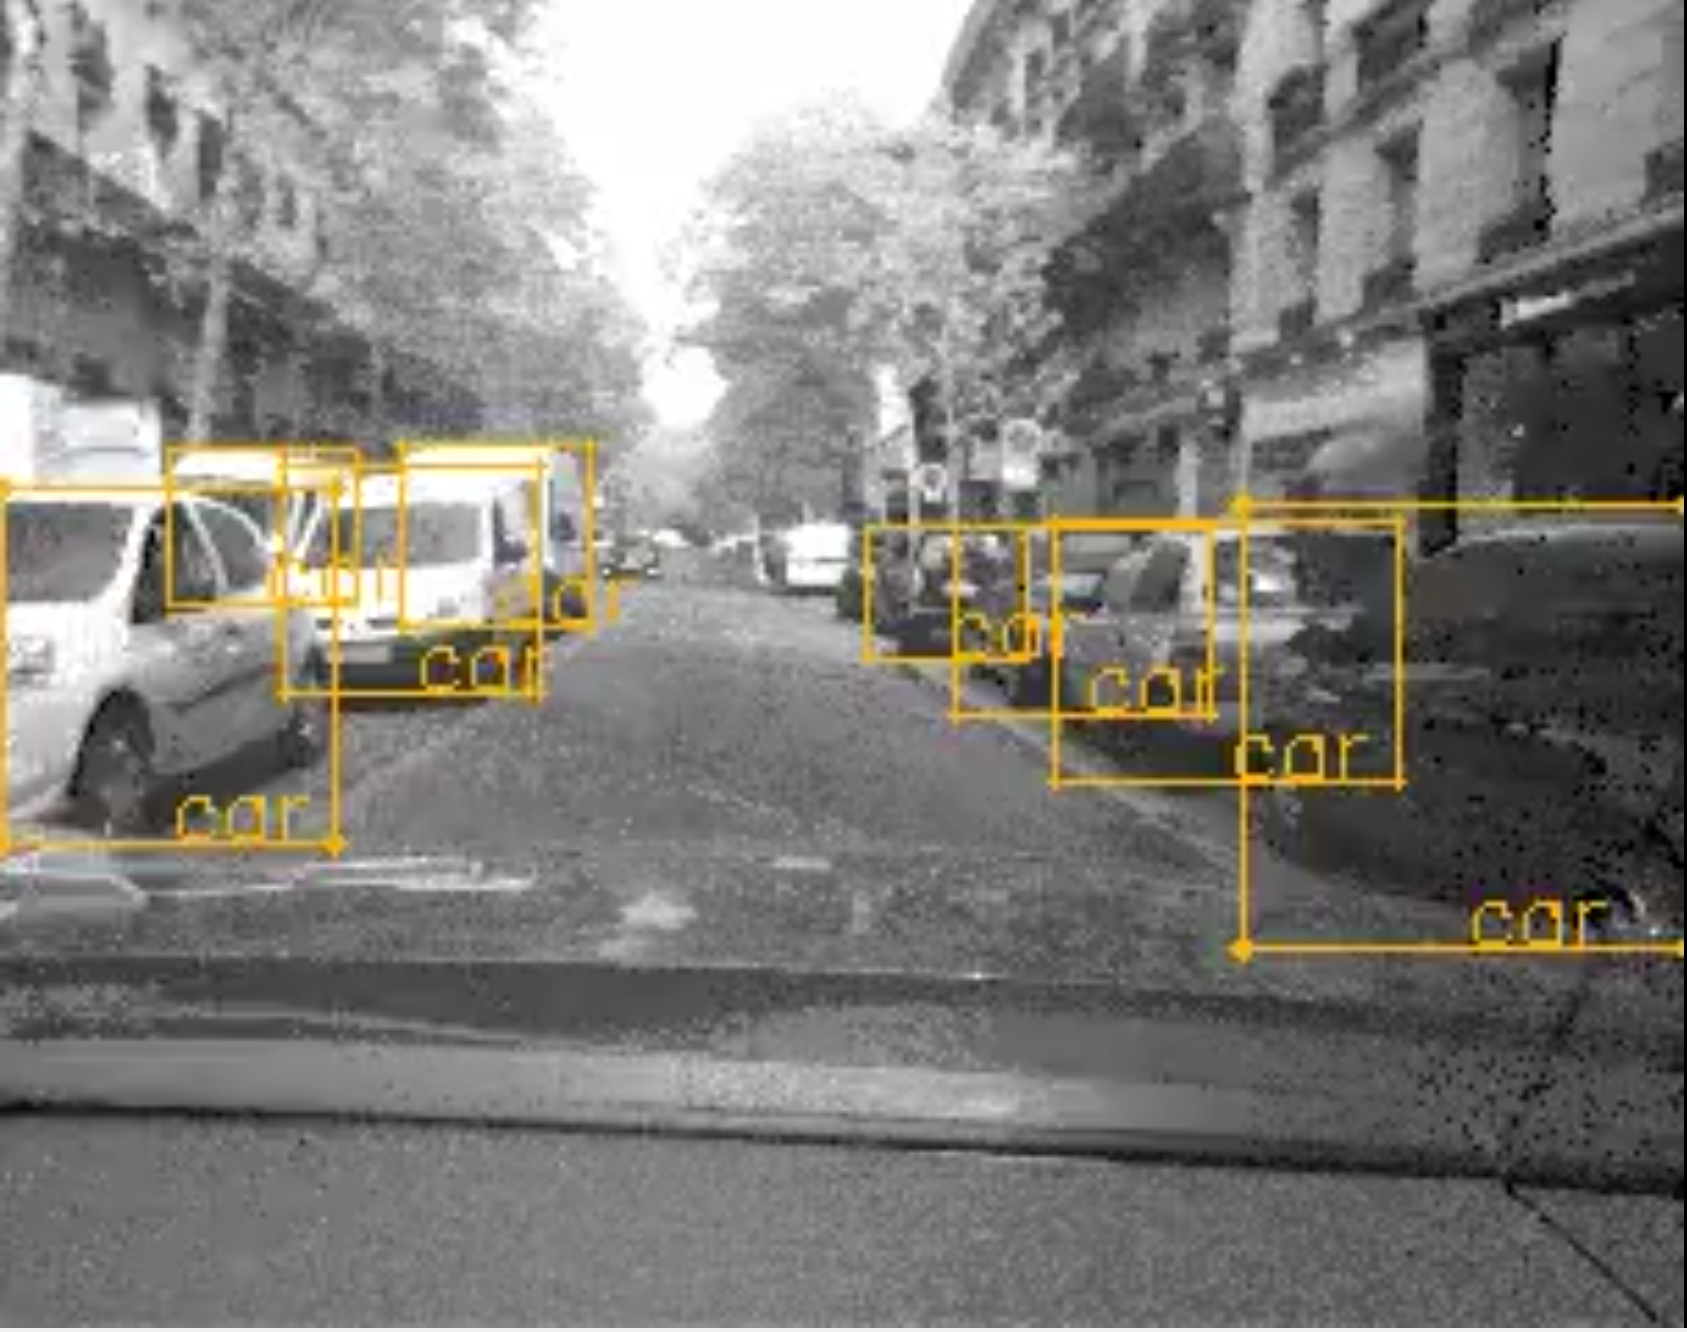
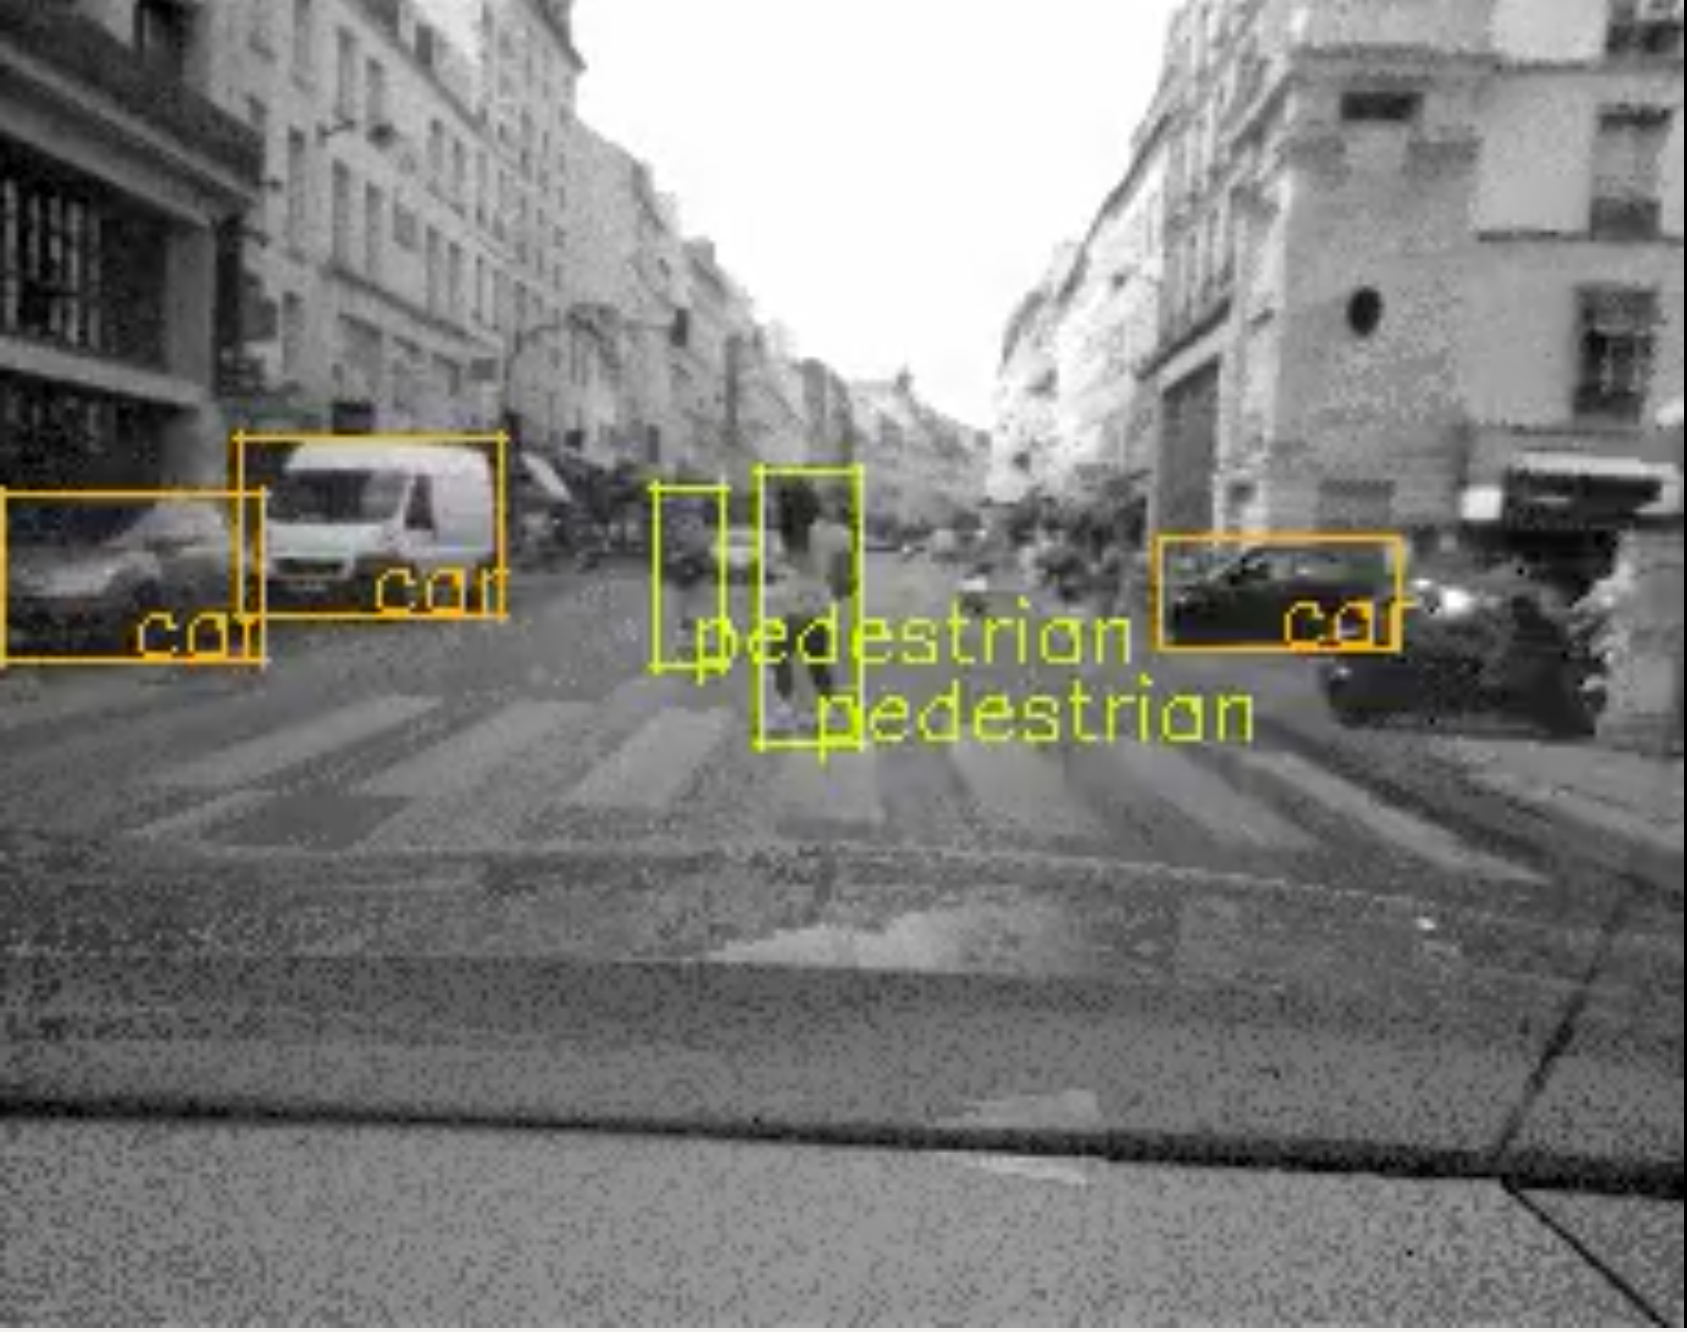
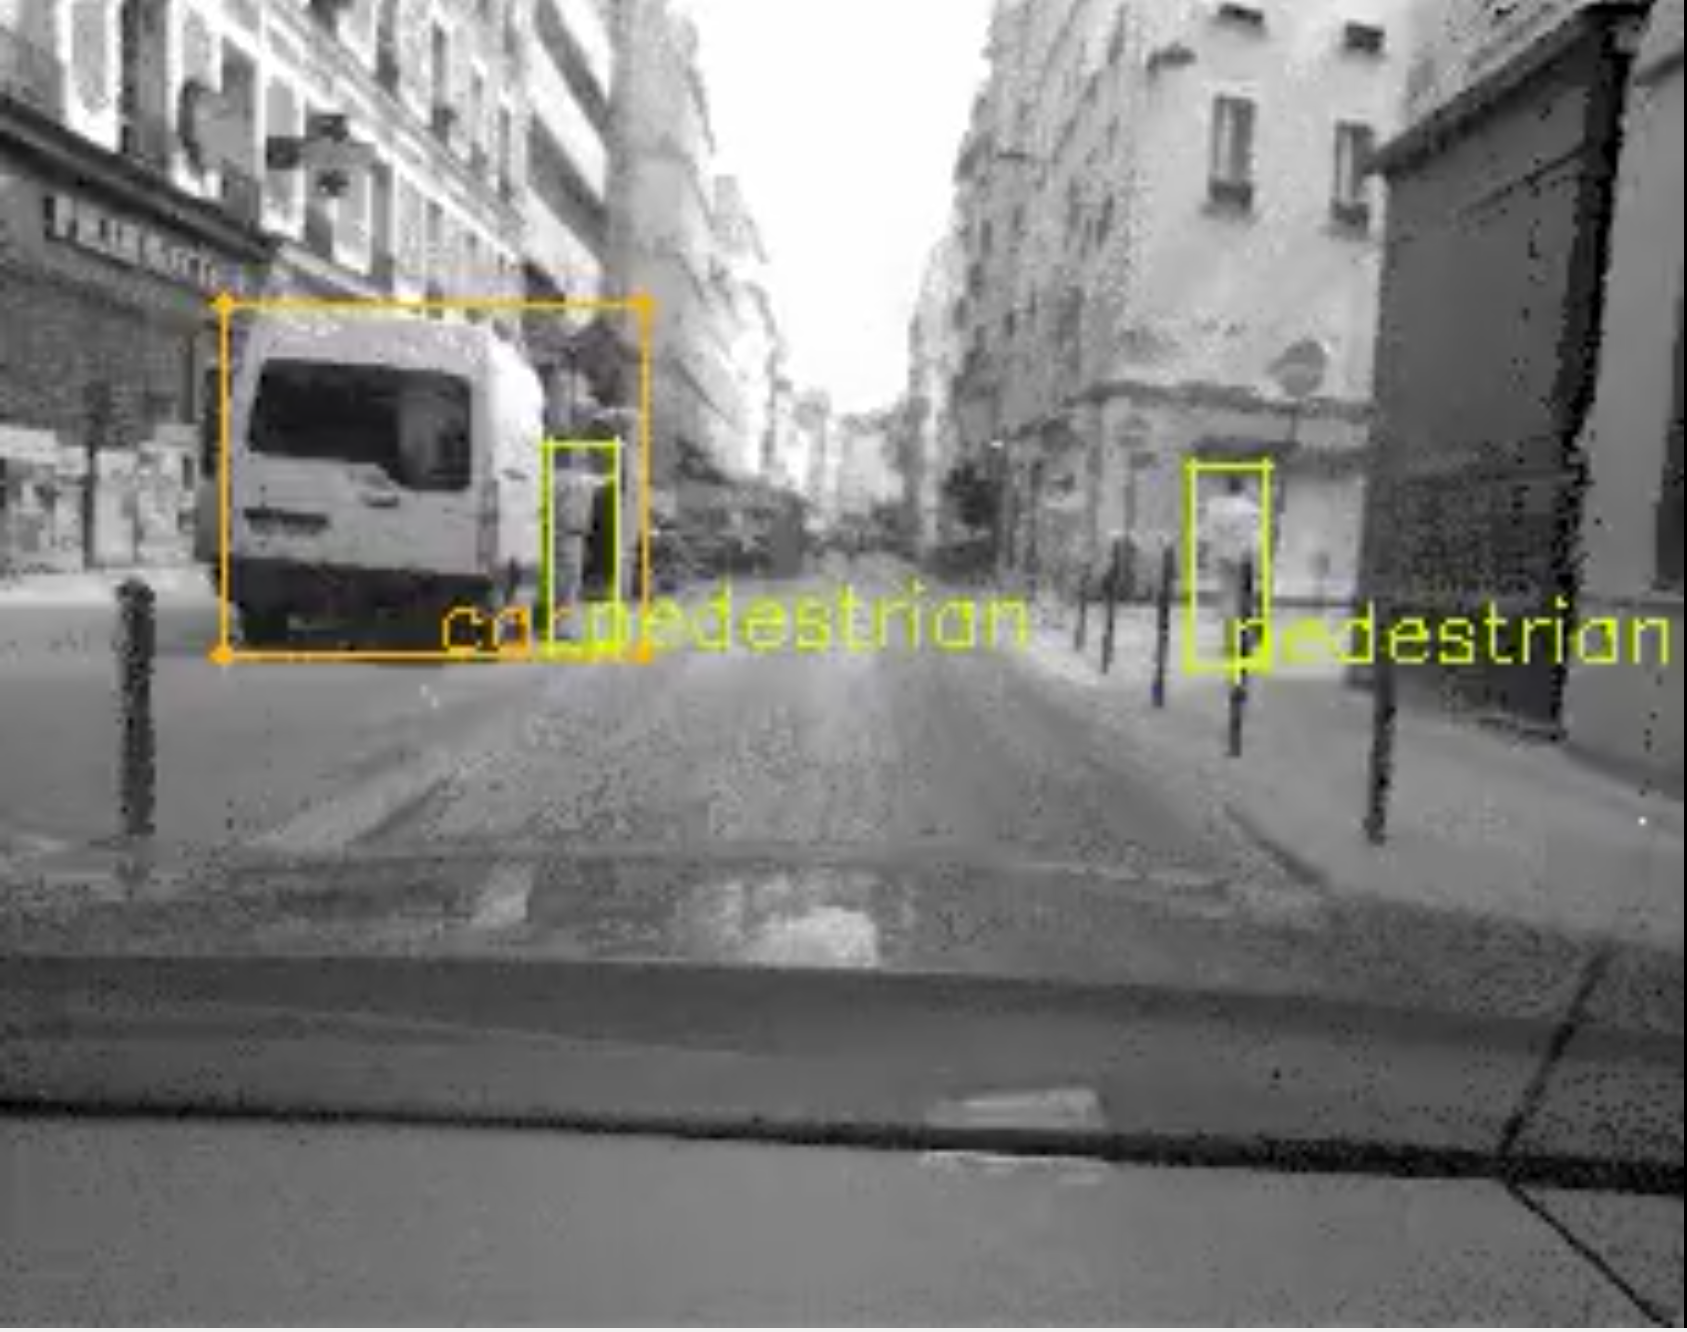
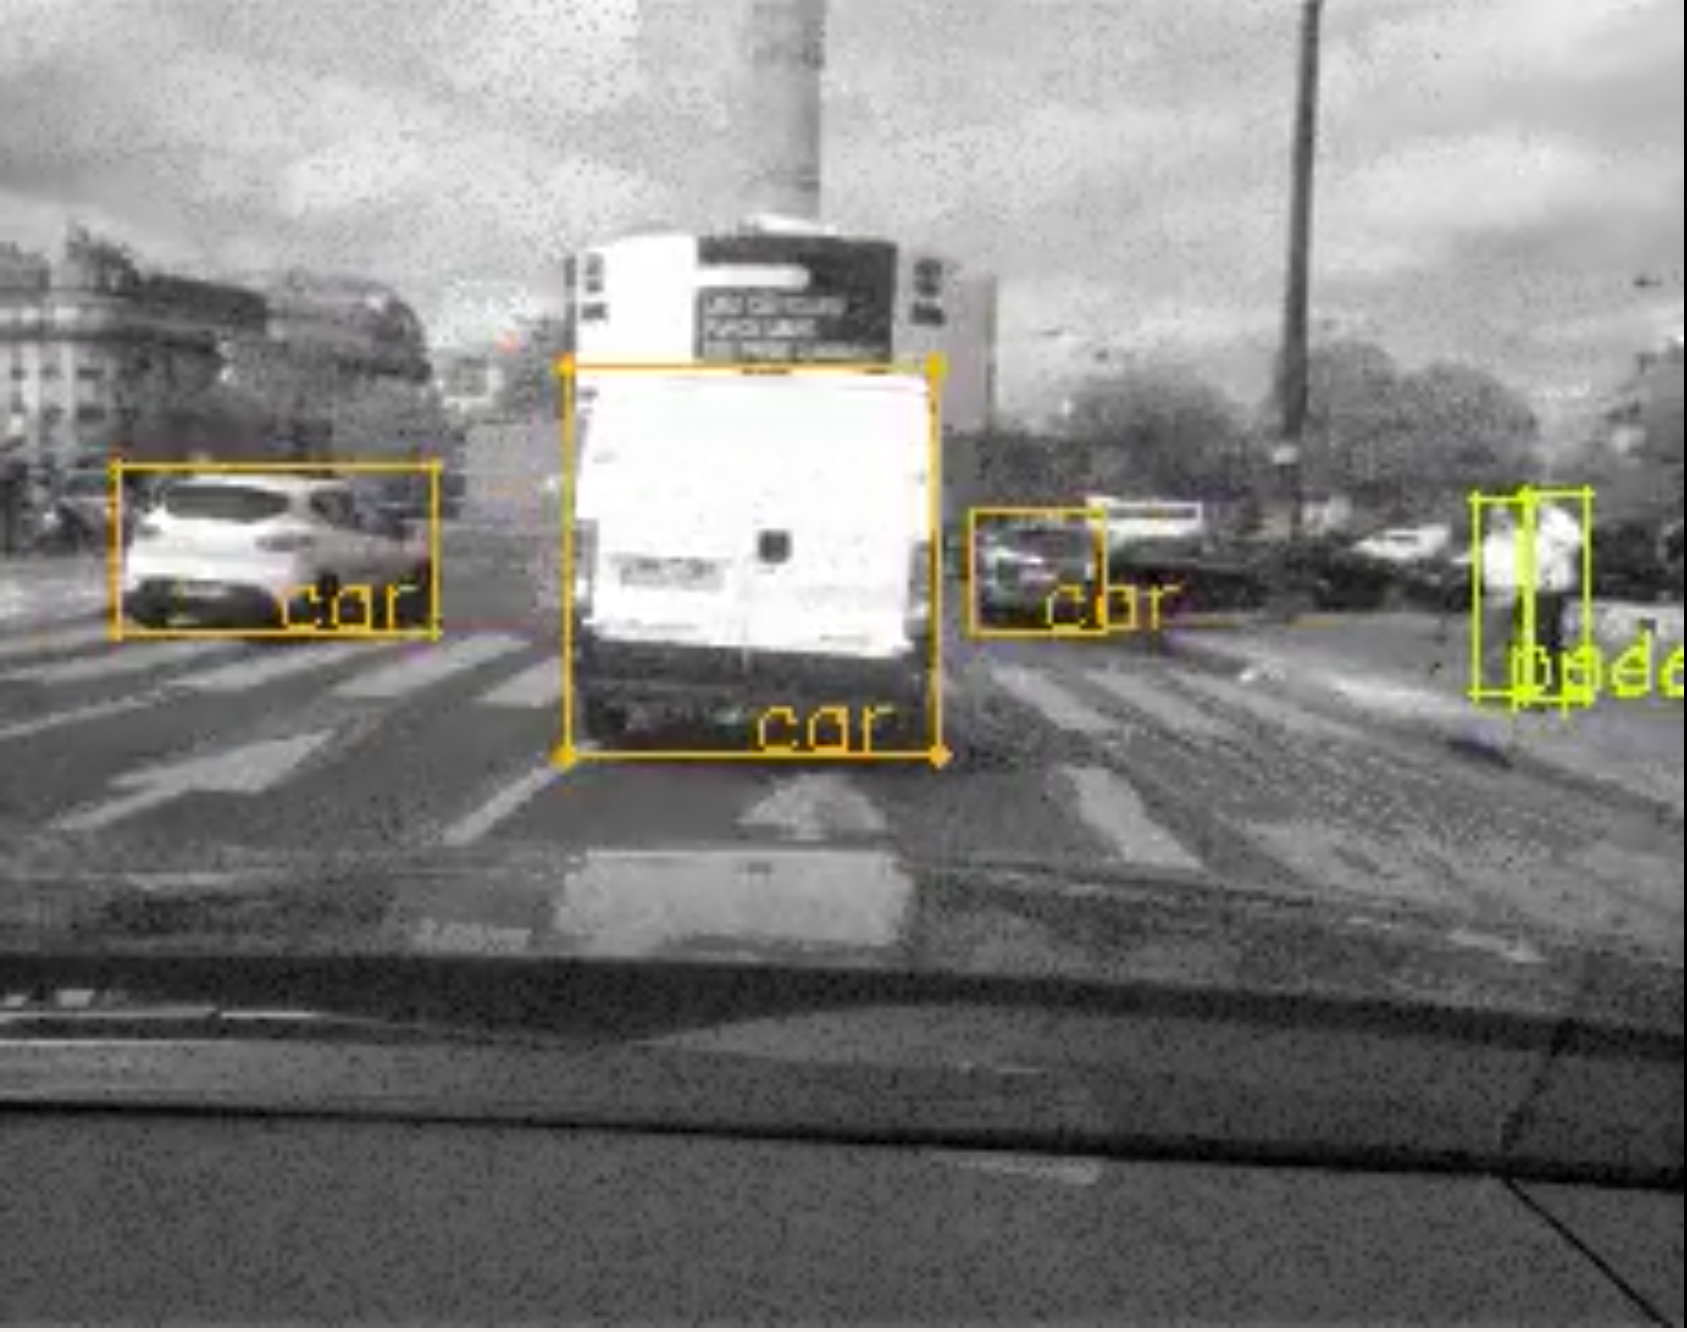
In this work, we consider a Gen1 304x240 camera [35]. The luminous intensity measures from the camera were used to generate standard gray-level images at a given frequency. The images were then manually annotated by human subjects to generate ground-truth bounding boxes around objects of interest. The labeling procedure is explained in detail in Sec. 3.3.
3.2 Data Collection
A GEN1 camera was mounted behind the windshield of a car and connected to a laptop for data recording. Different human drivers, independent from the authors, were asked to perform several rides in different scenarios, but always driving naturally. There are minor variations in the camera position due to repeated mountings of the camera.
The scenarios include city with dense traffic, city with low traffic, highway, countryside, small villages and suburbs. All recordings were done on France roads, mainly in, but not limited to, the Ile-de-France region. Recordings duration varies from tens of minutes to a maximum of several consecutive hours.
 |
 |
 |
 |
The data collection campaign was conducted over an entire year, from March 2017 to March 2018, and at variable times of the day, assuring a large variety of lightening and weather conditions. A total of 39.32 hours, split among 121 recordings were collected, resulting in about 750GB of uncompressed raw event data. For comparison, a gray-scale frame-based camera working at the same resolution and acquiring at a frequency of 120fps (i.e. 100 times lower temporal resolution compared to the event camera), would generate more than 1.2TB of data 111Ignoring compression and assuming 1 byte per pixel.
In the next section, we describe how the data were manually annotated.
3.3 Labeling Protocol
The GEN1 sensor provides along with the change detection events, also gray-level measurements. These measurements can be used to build a gray-level image at any desired time. The time of the last measurement used to generate them is associated to the image, providing images with the same temporal resolution as the event stream. Moreover, since gray-level images and the events stream share the same pixels array, annotations on the images can directly be used as ground truth for the event stream, without the need of any calibration or rectification step.
Since our primary goal is object detection, we favor low-frequency annotations in order to maximize the variety of objects aspects and scenes. Because of this, we generate images at a 1, 2 or 4Hz. These images were then given to human annotators to draw bounding boxes around cars and pedestrians.
A detailed set of instruction has been provided to the annotators to reduce ambiguity and discrepancies between annotations.
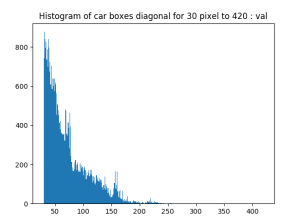
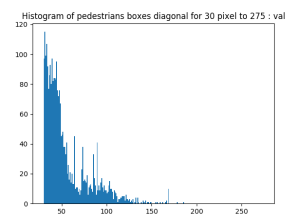
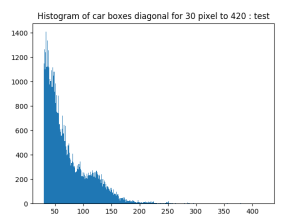
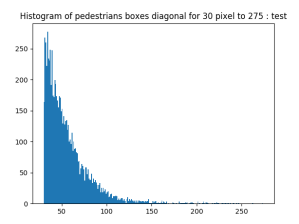
Due to the resolution and image quality of GEN1 images, objects of size smaller than 30 pixels have been discarded. Concerning occlusions, an object is annotated if it is visible for more than 75%. In which case, the bounding box is drawn on the whole extend of the object.
Buses, trucks, and large vehicles are not considered as cars and therefore have not been annotated. Similarly, for motorbikes and two-wheelers. People moving on skateboards or kick-scooters have been labeled as pedestrians, while people sitting inside cars or in buildings have been ignored.
3.4 Dataset Format and Download
We split the recordings into train, validation and test sets. To avoid overlap between train and test splits, each single recording session is the same split.
In order to facilitate the training of deep learning methods, we cut the continuous recordings into 60 seconds chunks. This yield to a total of 2359 samples: 1460 for train, 470 for test and 429 for validation.
Each sample is provided in a binary .dat format, where events are encoded using 4 bytes for the timestamps and 4 bytes for the position and the polarity. More precisely, 14 bits are used for the position, 14 bits for the position and 1 bit for the polarity. Gray-level measurements are not provided with the dataset.
Bounding box annotations are provided in a numpy format. Each numpy array contains the following fields:
-
•
ts, timestamp of the box in microseconds
-
•
x, abscissa of the top left corner in pixels
-
•
y, ordinate of the top left corner in pixels
-
•
w, width of the boxes in pixel
-
•
h, height of the boxes in pixel
-
•
class_id, class of the object: 0 for cars and 1 for pedestrians
We make the obtained dataset publicly available through the following link
https://www.prophesee.ai/2020/01/24/
prophesee-gen1-automotive-detection-dataset/.
We also provide a sample code together with the dataset to load and visualize
some samples from the dataset with the corresponding annotations.
For evaluating the accuracy of a detection method, we consider the same metrics used for the COCO dataset [28]. Together with the released code, we provide a wrapper and an example on how to apply the evaluation metrics on our dataset.
4 Analysis and Statistics
In this section, we extract some statistics from the ATIS Automotive Detection Dataset and we compare it to existing event-based datasets.
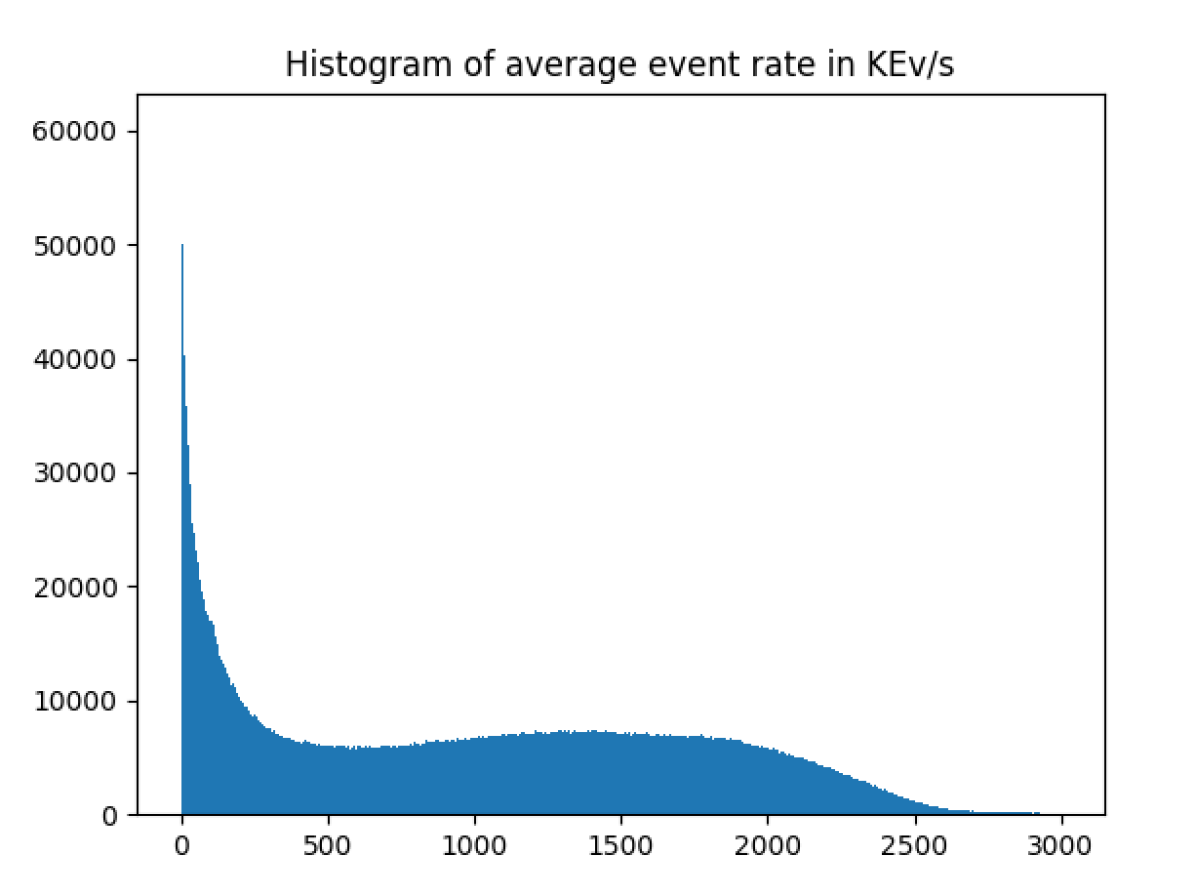
We start by analyzing the properties of raw events stream. In particular, we study the rate of event stream generated during the recordings. In order to do this, we split the recordings in intervals and compute the average event rate in this interval, without any filtering or noise removal. We then build an histogram from these measurements. As we can see from Fig. 3, the majority of the samples contain very low data rate, below . However, the distribution has a long tail, with maximum peaks reaching up to . These peaks corresponds to scene with very strong lightening changes, such as flickering lights or fast repeated transitions from bright sun to shadow.
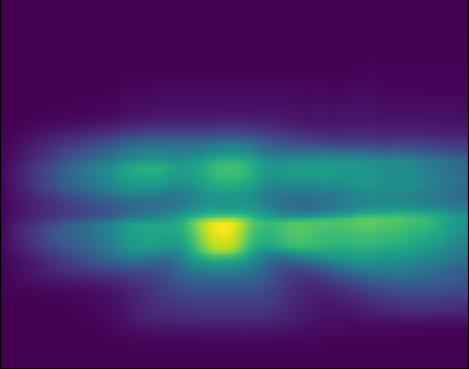
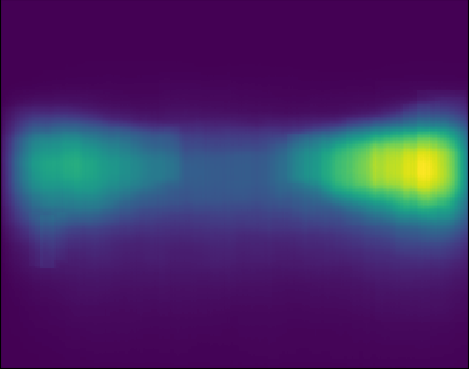
We then study the distribution of the annotated bounding boxes. Similarly to [10], we compute the heat map on the location of the bounding box (Fig. 4). For cars, we observe two principal horizontal axis, corresponding to two main positioning of the camera inside the car. This is less visible in the pedestrian heatmap, probably because pedestrians are mostly seen in city recordings, where the camera position was most stable. We also notice a larger number of boxes in the right part of the image. This is due to the fact that driving is mostly conducted on the right lane of the road and therefore objects on the left part appear smaller and are more often discarded by the 30 pixel diagonal threshold.
 |
 |
| (a) | (b) |
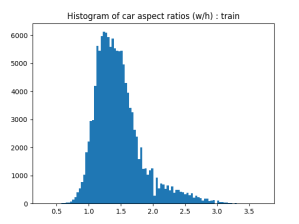
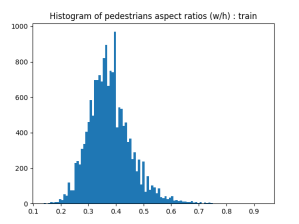
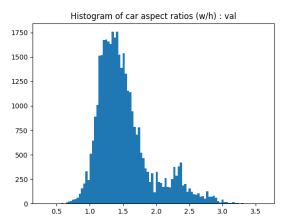
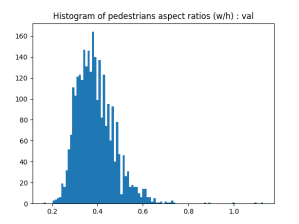
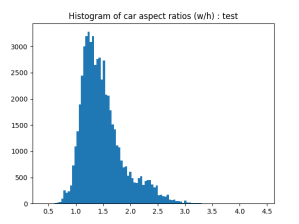
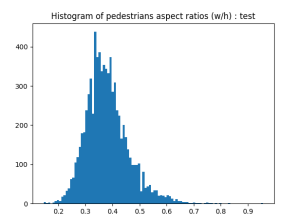
In Fig. 5(a,b) we show the histogram of the bounding box aspect ratio, computed as width over height. Histograms are computed on the train, validation and test splits independently. For pedestrians, the aspect ratio has a gaussian distribution, with mean around 0.35; while for cars, the histogram is closer to a two-modal distribution. This is due to fact that the aspect ratio varies depending on the point of view of the car: cars seen from the front or from behind have ratio closer to 1, while cars seen from the side have larger aspect ratio.
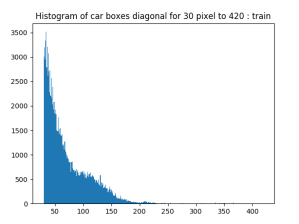
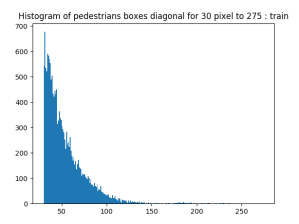
In Fig. 5(c,d), we show instead the histogram of the bounding box diagonal. For both cars and pedestrian we observe a long tail distribution, starting from the 30 pixel threshold set for manual annotation. Finally, we observe that train, validation and test splits, have similar statistics.
 |
 |
 |
 |
 |
 |
 |
 |
 |
 |
 |
 |
| (a) | (b) | (c) | (d) |
Finally, we compare the dataset with other existing event-based dataset. As shown by Tab. 1, the GEN1 Automotive Detection Dataset is 3 time larger than the DDD17 [5] dataset in terms of hours and has about 22 times more labels than the [31] pedestrian dataset. In terms of number of labels, the [4] dataset is the second largest one, with approximately 2.5 less labels than ours. However, [4] considers a classification task and each sample is only 100 ms long.
| Dataset | Task | Max Sample Time (s) | Total Time (h) | # Labels | # Classes |
| AAD Dataset (this work) | Detection for Automotive | 60 (10,020∗) | 39.32 | 255,781 | 2 |
| Pedestrian Dataset [31] | Detection for Surveillance | 30 | 0.10 | 11,667 | 1 |
| N-Mnist [34] | Object Classification | 0.3 | 5.83 | 70,000 | 10 |
| N-Caltech101 [34] | Object Classification | 0.3 | 0.76 | 9,146 | 101 |
| N-Cars [42] | Object Classification | 0.1 | 0.68 | 24,029 | 2 |
| DVS-Gestures [2] | Gesture Recognition | 6 | 2.24 | 1,342 | 11 |
| ASL-DVS [4] | Gesture Recognition | 0.1 | 2.80 | 100,800 | 24 |
| MVSEC [44] | Stereo, Flow, VO | 1,500 | 1.13 | - | - |
| DDD17 [5] | Autonomous Driving | 3,135 | 12 | - | - |
| ∗ Samples are obtained by splitting continuous recordings into 60s chunks. The longest of the original recordings is 10,020s long. | |||||
5 Conclusion
We presented the first large automotive dataset for detection with event cameras. Thanks to this dataset, we open the way to the training of deep learning models for detection on event-based cameras. We also expect benefits in other applications, such as object tracking, and unsupervised learning of optical flow and monocular depth, among others.
We hope that the event-based research community will greatly benefit from this dataset and that it will soon become a reference benchmark. We also believe that thanks to the availability of such a large dataset, the accuracy of event-based vision systems will undergo considerable advances.
References
- [1] https://www.prophesee.ai/event-based-evk/. 2018.
- [2] A. Amir, B. Taba, D. Berg, T. Melano, J. McKinstry, C. Di Nolfo, T. Nayak, A. Andreopoulos, G. Garreau, M. Mendoza, et al. A low power, fully event-based gesture recognition system. In Proceedings of the IEEE Conference on Computer Vision and Pattern Recognition, 2017.
- [3] F. Barranco, C. Fermuller, and E. Ros. Real-time clustering and multi-target tracking using event-based sensors. In 2018 IEEE/RSJ International Conference on Intelligent Robots and Systems (IROS). IEEE, 2018.
- [4] Y. Bi, A. Chadha, A. Abbas, , E. Bourtsoulatze, and Y. Andreopoulos. Graph-based object classification for neuromorphic vision sensing. In ICCV. IEEE, 2019.
- [5] J. Binas, D. Neil, S.-C. Liu, and T. Delbruck. Ddd17: End-to-end davis driving dataset. arXiv preprint arXiv:1711.01458, 2017.
- [6] C. Brandli, R. Berner, M. Yang, S.-C. Liu, and T. Delbruck. A 240 180 130 db 3 s latency global shutter spatiotemporal vision sensor. IEEE Journal of Solid-State Circuits, 2014.
- [7] E. Calabrese, G. Taverni, C. Awai Easthope, S. Skriabine, F. Corradi, L. Longinotti, K. Eng, and T. Delbruck. Dhp19: Dynamic vision sensor 3d human pose dataset. In Proceedings of the IEEE Conference on Computer Vision and Pattern Recognition Workshops, 2019.
- [8] N. F. Y. Chen. Pseudo-labels for supervised learning on dynamic vision sensor data, applied to object detection under ego-motion. In The IEEE Conference on Computer Vision and Pattern Recognition (CVPR) Workshops, June 2018.
- [9] J. Deng, W. Dong, R. Socher, L.-J. Li, K. Li, and L. Fei-Fei. Imagenet: A Large-Scale Hierarchical Image Database. In CVPR, 2009.
- [10] P. Dollar, C. Wojek, B. Schiele, and P. Perona. Pedestrian detection: An evaluation of the state of the art. TPAMI, 2012.
- [11] M. Everingham, L. Van Gool, C. K. Williams, J. Winn, and A. Zisserman. The pascal visual object classes (voc) challenge. International journal of computer vision, 2010.
- [12] L. Fei-Fei, R. Fergus, and P. Perona. One-shot learning of object categories. TPAMI, 2006.
- [13] G. Gallego, T. Delbruck, G. Orchard, C. Bartolozzi, B. Taba, A. Censi, S. Leutenegger, A. Davison, J. Conradt, K. Daniilidis, et al. Event-based vision: A survey. arXiv preprint arXiv:1904.08405, 2019.
- [14] d. Gehrig, M. Gehrig, J. Hidalgo-Carrio, and D. Scaramuzza. Video to events: Bringing modern computer vision closer to event cameras. arXiv preprint, 2019.
- [15] G. Griffin, A. Holub, and P. Perona. Caltech-256 object category dataset. 2007.
- [16] M. Guo, J. Huang, and S. Chen. Live demonstration: A 768 640 pixels 200meps dynamic vision sensor. In 2017 IEEE International Symposium on Circuits and Systems (ISCAS). IEEE, 2017.
- [17] K. He, X. Zhang, S. Ren, and J. Sun. Deep residual learning for image recognition. In Proceedings of the IEEE conference on computer vision and pattern recognition, 2016.
- [18] Y. Hu, H. Liu, M. Pfeiffer, and T. Delbruck. Dvs benchmark datasets for object tracking, action recognition, and object recognition. Frontiers in neuroscience, 2016.
- [19] A. Khodamoradi and R. Kastner. O (n)-space spatiotemporal filter for reducing noise in neuromorphic vision sensors. IEEE Transactions on Emerging Topics in Computing, 2018.
- [20] M. Kristan, J. Matas, A. Leonardis, M. Felsberg, L. Cehovin, G. Fernandez, T. Vojir, G. Hager, G. Nebehay, and R. Pflugfelder. The visual object tracking vot2015 challenge results. In Proceedings of the IEEE international conference on computer vision workshops, 2015.
- [21] A. Krizhevsky, I. Sutskever, and G. Hinton. ImageNet Classification with Deep Convolutional Neural Networks. In NIPS, 2012.
- [22] X. Lagorce, S.-H. Ieng, X. Clady, M. Pfeiffer, and R. B. Benosman. Spatiotemporal features for asynchronous event-based data. Frontiers in neuroscience, 2015.
- [23] Y. LeCun, Y. Bengio, and G. Hinton. Deep learning. nature, 2015.
- [24] Y. LeCun, L. Bottou, Y. Bengio, P. Haffner, et al. Gradient-based learning applied to document recognition. Proceedings of the IEEE, 1998.
- [25] S. Lee, H. Kim, and H. J. Kim. Edge detection for event cameras using intra-pixel-area events. arXiv preprint arXiv:1907.07469, 2019.
- [26] S. Leung, E. J. Shamwell, C. Maxey, and W. D. Nothwang. Toward a large-scale multimodal event-based dataset for neuromorphic deep learning applications. In Micro-and Nanotechnology Sensors, Systems, and Applications X. International Society for Optics and Photonics, 2018.
- [27] P. Lichtsteiner, C. Posch, and T. Delbruck. A 128x128 120db 15us latency asynchronous temporal contrast vision sensor. IEEE Journal of Solid State Circuits, 2008.
- [28] T.-Y. Lin, M. Maire, S. Belongie, J. Hays, P. Perona, D. Ramanan, P. Dollár, and C. Zitnick. Microsoft COCO: Common Objects in Context. In ECCV, 2014.
- [29] J. Manderscheid, A. Sironi, N. Bourdis, D. Migliore, and V. Lepetit. Speed invariant time surface for learning to detect corner points with event-based cameras. In CVPR, 2019.
- [30] A. I. Maqueda, A. Loquercio, G. Gallego, N. Garcıa, and D. Scaramuzza. Event-based vision meets deep learning on steering prediction for self-driving cars. In CVPR, 2018.
- [31] S. Miao, G. Chen, X. Ning, Y. Zi, K. Ren, Z. Bing, and A. C. Knoll. Neuromorphic benchmark datasets for pedestrian detection, action recognition, and fall detection. Frontiers in neurorobotics, 2019.
- [32] K. Mikolajczyk, T. Tuytelaars, C. Schmid, A. Zisserman, J. Matas, F. Schaffalitzky, T. Kadir, and L. Van Gool. A comparison of affine region detectors. International journal of computer vision, 2005.
- [33] A. Mitrokhin, C. Ye, C. Fermuller, Y. Aloimonos, and T. Delbruck. Ev-imo: Motion segmentation dataset and learning pipeline for event cameras. arXiv preprint arXiv:1903.07520, 2019.
- [34] G. Orchard, A. Jayawant, G. K. Cohen, and N. Thakor. Converting static image datasets to spiking neuromorphic datasets using saccades. Frontiers in Neuroscience, 2015.
- [35] C. Posch, D. Matolin, and R. Wohlgenannt. A QVGA 143 dB Dynamic Range Frame-Free PWM Image Sensor With Lossless Pixel-Level Video Compression and Time-Domain CDS. Solid-State Circuits, IEEE Journal of, 2011.
- [36] H. Rebecq, D. Gehrig, and D. Scaramuzza. Esim: an open event camera simulator. In Conference on Robot Learning, 2018.
- [37] H. Rebecq, R. Ranftl, V. Koltun, and D. Scaramuzza. Events-to-video: Bringing modern computer vision to event cameras. In Proceedings of the IEEE Conference on Computer Vision and Pattern Recognition, 2019.
- [38] K. K. Reddy and M. Shah. Recognizing 50 human action categories of web videos. Machine Vision and Applications, 2013.
- [39] C. Scheerlinck, H. Rebecq, T. Stoffregen, N. Barnes, R. Mahony, and D. Scaramuzza. Ced: Color event camera dataset. In Proceedings of the IEEE Conference on Computer Vision and Pattern Recognition Workshops, 2019.
- [40] T. Serrano-Gotarredona and B. Linares-Barranco. A 128 x 128 1.5% contrast sensitivity 0.9% fpn 3 s latency 4 mw asynchronous frame-free dynamic vision sensor using transimpedance preamplifiers. Solid-State Circuits, IEEE Journal of, 2013.
- [41] T. Serrano-Gotarredona and B. Linares-Barranco. Poker-dvs and mnist-dvs. their history, how they were made, and other details. Frontiers in neuroscience, 2015.
- [42] A. Sironi, M. Brambilla, N. Bourdis, X. Lagorce, and R. Benosman. Hats: Histograms of averaged time surfaces for robust event-based object classification. In CVPR, 2018.
- [43] B. Son, Y. Suh, S. Kim, H. Jung, J.-S. Kim, C.-W. Shin, K. Park, K. Lee, J. M. Park, J. Woo, Y. Roh, H. Lee, Y. M. Wang, I. A. Ovsiannikov, and H. Ryu. 4.1 a 640×480 dynamic vision sensor with a 9µm pixel and 300meps address-event representation. 2017 IEEE International Solid-State Circuits Conference (ISSCC), 2017.
- [44] A. Z. Zhu, D. Thakur, T. Özaslan, B. Pfrommer, V. Kumar, and K. Daniilidis. The multivehicle stereo event camera dataset: An event camera dataset for 3d perception. IEEE Robotics and Automation Letters, 2018.
- [45] A. Z. Zhu, L. Yuan, K. Chaney, and K. Daniilidis. Ev-flownet: Self-supervised optical flow estimation for event-based cameras. arXiv preprint arXiv:1802.06898, 2018.