Investigation of electron and phonon transport in Bi-doped CaMnO3 for thermoelectric applications
Abstract
The electron and phonon transports in and in one of its Bi-doped counterparts, namely, , are investigated using the thermoelectric transport measurements and first-principles calculations. We find that antiferromagnetic insulator breaks the Wiedemann–Franz law with the Lorenz number reaching four times that of ordinary metals at room temperature. Bismuth doping reduces both the electrical resistivity and Seebeck coefficient of ; thus, it recovers the Wiedemann–Franz law behavior. In addition, possesses a shorter phonon lifetime according to the transport measurements. As a result, exhibits superior thermoelectric properties over pristine owing to the lower thermal conductivity and electrical resistivity.
keywords:
Oxides , thermoelectrics, thermal conductivity , electronic structure.e-mail]edis008@lipi.go.id
e-mail]t_seetawan@snru.ac.th
e-mail]eddw001@lipi.go.id
1 Introduction
Perovskite oxides have attracted extensive attention in the last decades owing to their rich physical properties [1, 2, 3]. Strongly correlated electrons that originate from transition-metal atoms cause various ground states, such as antiferromagnetic (AFM) insulators [4, 5], ferromagnetic metals [6], and high- superconductors [7]. These strongly correlated perovskite oxides can, in particular, be applied to sensor technology by utilizing their piezoelectric and giant magnetoresistance [8, 9] as well as in energy-harvesting technology, e.g., in solar cells and thermoelectric (TE) devices [10, 11, 12, 13].
TE materials are a class of materials that can convert heat into electricity [14, 15]. Efficient TE materials are thermally inert while simultaneously being electrically conducting. These requirements provide researchers a challenge in designing TE materials because the moving electrons that constitute current in regular metals also carry heat. According to the Wiedemann–Franz (WF) law, the ratio of electron thermal conductivity to electrical conductivity is proportional to the temperature [16]. Thus, a possible method of improving the TE efficiency is by breaking the WF law. Breaking the WF law might be realized, e.g., by introducing strongly correlated Coulomb interactions [17, 18, 19].
Perovskite oxides are considered strongly correlated electronic systems. In this regard, we propose that one of the simplest perovskite oxides, i.e., (or “CMO”) with proper doping can be a potential candidate for nontoxic and easily prepared TE materials. CMO is structurally stable even at temperatures above ; thus, it is suitable for high-temperature TE materials [20]. At its ground state, CMO behaves as an insulator with an AFM order that originates from the Mott-like correlation [11, 21]. The strongly correlated interaction in this system is responsible for the gap opening and AFM ground states of CMO. At higher temperature, its electrical conductivity increases, thus allowing better TE performance. When it is doped with into the site, a double-exchange interaction between two different Mn ions, which is mediated by oxygen, delocalizes electrons, which allows metal ferromagnetic ground states [22]. We must note that whereas electronic contribution to the transport properties has been well understood, the phonon contribution to the thermal conductivity and the role of Bi doping in the phonon transport in CMO remain unclear.
The present study aims to investigate the electron and phonon transport properties in CMO and Bi-doped CMO (abbreviated as “BCMO”) using a combination of TE transport measurements and first-principles calculations of the Seebeck coefficient, electrical conductivity, and thermal conductivity. We choose as BCMO in the present study because of our expectation that this particular compound provides the best TE performance among various compositions of BCMO [13]. The Seebeck coefficients, electrical resistivities, and thermal conductivities are measurable quantities in the experiments compared with the first-principles calculations. By calculating the electronic structure and phonon energy of the materials (and comparing them with the experimental results), we can possibly obtain essential quantities that determine the transport properties of materials, such as the chemical potential, electron lifetime, phonon lifetime, phonon Debye temperature, and sound velocities. As a supplement, we also introduce Raman spectroscopy to understand the role of Bi doping in the phonon transport.
This paper is organized as follows. The experimental and theoretical methods are presented in Sections 2 and 3, respectively. The geometrical CMO structure is confirmed using X-ray diffraction (XRD), as discussed in Section 4.1. The electronic transport properties of CMO and BCMO are presented in Sections 4.2 and 4.3, respectively. The phonon contribution to thermal conductivity is presented in Section 4.4. Finally, conclusions are given in Section 5.
2 Experimental Methods
To prepare for the characterization of the TE properties, we synthesized the CMO and BCMO materials using the solid-state reaction and hot-press methods. The raw materials, including (from QReC, purity ), (Fisher Scientific; purity ), and (QReC, purity ), were mixed using a planetary ball mill (RETSCH PM 400) in ethanol for h. The mixed powder was calcined at K for h in the atmosphere and then hot-pressed at K for an hour under MPa pressure in argon atmosphere. The hot-pressed pellets were annealed at K for h in air. We pulverized the pellets into powder for crystal-structure analysis using the XRD technique (using Shimadzu 6100) with CuK radiation. The scan speed is /min, whereas the scan range is within of – .
The Seebeck coefficient () and electrical resistivity () were measured using the four-point probe method at a temperature range of – K in the atmosphere. The values of in this experiment were obtained from the formula , where is temperature and is the voltage. We obtain the values of from the formula , where R is the resistance, is the cross-sectional area of the material, and is the probe distance. The thermal conductivity () was measured using the steady-state method according to the relationship , where is the heat rate.
3 Theoretical Methods
To obtain accurate geometry and electronic structures of the materials, we perform first-principles density-functional theory (DFT) calculations using the projected augmented wave and spin-polarized bases, as implemented in the Quantum ESPRESSO package [23]. To consider the exchange-correlation effects, we employ the revised generalized-gradient approximation proposed by Perdew, Burke, and Ernzerhof, which was implemented in the so-called PBEsol functional [24] and was appropriate for a densely packed solid surface. At the ground state, CMO is an AFM material [25], and it belongs to a Pnma space group containing atoms in the unit cell (see Fig. 1). According to a previous study by Molinari et al. [11], we add Coloumb interaction potential on the DFT+U level to account for the localized Mn states. The converged result is obtained using the k-mesh sampling in the Monkhorst–Pack scheme and kinetic-energy cutoff of Ry. All atoms are relaxed until all forces are smaller than Ry/a.u. The density of states (DOS), which is defined as the number of states at given energy , is obtained using the tetrahedron method through the formula [26], where is the energy dispersion relationship in the -th electronic-energy band. We also calculate the phonon frequencies and eigenvectors of CMO at the point (center of the Brillouin zone). The force constant is obtained from the density-functional perturbation theory (DFPT)+U scheme [27], whereas the phonon frequencies and eigenvectors can be obtained by solving the dynamic matrix equation.
To understand the role of Bi doping in the electronic transport, we then calculate the electronic structure of BCMO by considering the supercell of CMO consisting of Ca atoms. We replace one Ca atom at the center of the supercell with one Bi atom to obtain 3.125% Bi doping. From the electronic structures () of CMO and BCMO, we can calculate the Seebeck coefficient (), electrical conductivity (), and electronic thermal conductivity () at the measurement temperature in the linear Boltzmann transport theory and the relaxation-time approximation (RTA) as implemented in the BoltzTraP package [28]. The equations for , , and are expressed as [14, 29, 30],
| (1) |
| (2) |
| (3) |
where is the fundamental carrier charge of the electron and hole, respectively, is the average temperature of the material, is the number of points in the Brillouin zone, is the volume of a unit cell, is the Fermi energy, is the Fermi–Dirac distribution, is the electronic group velocity at a particular direction, and is the relaxation-time constant. We assume that scattering rate is proportional to the temperature. We should also note that the summations in Eqs. (1)–(3) are performed over not only all possible points but also band index .
Phonon thermal conductivity is calculated using the Debye–Callaway model and RTA. Its formula is [31]
| (4) |
where , is the Boltzmann constant, is the effective sound velocity, is the reduced Plank constant, is the Debye temperature with being the largest phonon energy of the system, and is the phonon relaxation time. In this model, we assume that the Umklapp scattering dominates over the other scattering events, and it takes the following relaxation-time form [32]:
| (5) |
where is the Grüneissen parameter and is the average atomic mass.
4 Results and Discussion
4.1 CMO geometrical and electronic structure

Figure 1(a) shows the orthorhombic perovskite unit cell of pristine CMO. In this structure, the Mn ions are surrounded by six O ions, making an octahedral coordination. The magnetic properties of this material originate from the 3d orbitals of the Mn4+ ions. At the ground state, CMO favors AFM ordering because of the spin configuration of the Mn sublattices [33], as shown in Fig. 1(b). In the present study, we attempt to optimize the geometrical structure using the total energy minimization method. The relaxed structure is compared with the XRD of the CMO sample shown in Fig. 1(c). The blue line shows the experimental results, whereas the red line is obtained from DFT, which are in good agreement with those in the experiment. The calculated lattice constants are , , and , with a discrepancy of approximately from the experimental results.
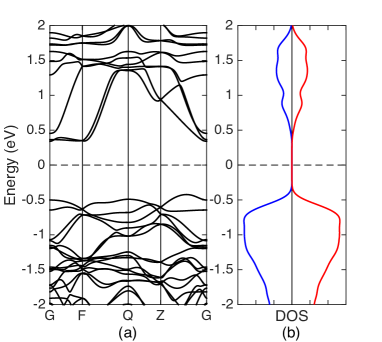
The electronic structure is calculated by considering the relaxed structure. We obtain the electronic-band structure of CMO as shown in Fig. 2(a), which is consistent with the previous calculations [34]. From the result, we obtain an indirect bandgap of approximately . Compared with our temperature of interest in the range of – K, the bandgap is relatively small. At the ground state, CMO exhibit an AFM insulating state, which is in good agreement with previous optical spectroscopy results [35]. The DOS of CMO in the spin-up (blue line) and spin-down (red line) cases are shown in Fig. 2(b).
4.2 CMO electronic transport
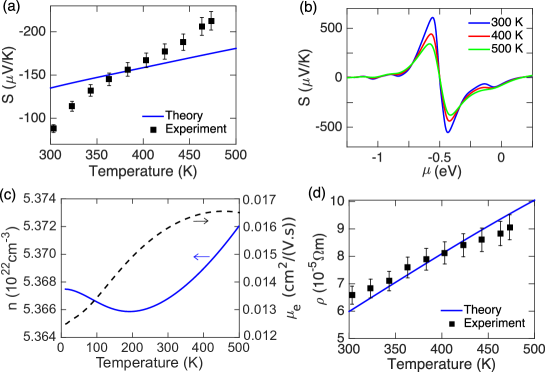
From the electronic-band structure, we can obtain the charge concentration and group velocity of the electrons to determine the electronic transport properties of the materials, according to Eqs. (1)–(3). The calculated Seebeck coefficients obtained from Eq. (1) are shown in Fig. 3(a) and compared with the experimental results (dots). The Seebeck coefficients modeled in Eq. (1) only depend on Fermi energy and the temperature. By fitting this coefficients with the experimental results of versus , we obtain Fermi energy , which is measured from the theoretical charge neutrality point (horizontal dashed line) shown in Fig. 2(a). This result means that the Fermi energy is at the edge of the conduction band. Although we obtain from a self-consistent DFT calculation, shifting within the gap does not change the geometrical structure at the ground state.
The negative sign of the Seebeck coefficient indicates that CMO is -doped. The inverse proportionality of with respect to originates from the semiconducting or insulating nature of CMO [14]. This inverse proportionality also persists in different . The sign change of occurs due to the ambipolar effect following the electron or hole charge as majority or minority carriers [36].
Theoretically, the Seebeck coefficient may be amplified by one order of magnitude if the Fermi energy is located near , as shown in Fig. 3(b). Such a high Seebeck coefficient has been obtained in organic perovskites and can be achieved in perovskite oxides [37]. Adjusting the Fermi energy to optimize involves modifying the carrier concentration or doping the system. In CMO, we find that the corresponding carrier concentration at room temperature should be approximately cm-3. Furthermore, the carrier mobility () can be directly derived from the formula , where is the electron conductivity, is the absolute value of the electron charge, and is the carrier concentration. The carrier concentration and carrier mobility as a function of temperature are plotted and shown in Fig. 3(c), which shows that the mobility values in CMO vary within – and reach an optimum value at a temperature near K.

We can further determine electrical resistivity from Eq. (2) and compare the calculated result with the experimental result. Figure 3(d) shows as a function of temperature. We obtain with and . Transport lifetime is proportional to the transport mobility and is needed to characterize the number of defects and device performance. is proportional to the temperature, as expected, in the electron–phonon scattering, i.e., the number of phonons increases due to the thermal excitation. The decrease in as a function of temperature is expected from the Drude model of semiconductors. is inversely proportional to the carrier concentration, whereas the carrier concentration increases due to the thermal excitation.
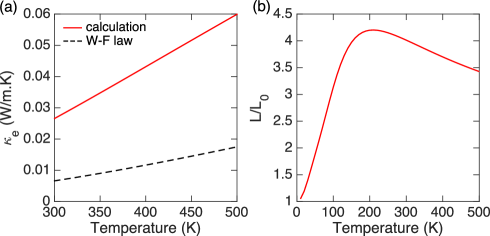
According to the previously obtained parameters ( and ), we show calculated electronic thermal conductivity from Eq. (3) in Fig. 4(a). We can compare the electron efficacy in the conducting heat versus current using the WF law, i.e., , where is the Lorenz number. For ordinary metals, we have , where . Introducing to that shown in Fig. 3(d), we obtain as indicated by the dashed line shown in Fig. 4(a). The value is typically approximately four times larger than expected from the WF law with temperature dependence, as shown in Fig. 4(b). These results imply that the localized electrons in the Mn orbitals more efficiently conduct heat than the current, resulting in a drawback for TE application. Violation of the WF law due to strong correlation [17, 18, 19] and bipolar effects [38] has been reported. However, the bipolar effects show weak dependence on versus . Thus, we attribute the breakdown of the WF law to the strong correlation. The relationship of with the strength of Coulomb interaction is very instructive to study in detail. However, to understand this phenomenon, an in-depth investigation will be presented elsewhere because it is not of primary importance in the present study where the value is negligible compared with the total value shown in Fig. 8. As shown in Fig. 7, the Bi substitution at the Ca site reduces the ratio, hence the recovery of the metallic nature.
4.3 BCMO electronic structure and transport
One way of improving the TE properties of CMO is by performing atomic substitution of Bi at the Ca site. With this substitution, the two different ions, namely, that sits next to the Bi ion and near the Ca ions, perform a double exchange (DE) mechanism mediated by oxygen [39]. This DE interaction delocalizes the electrons in the Mn orbitals and favors the metal ferromagnetic ground state [22], as shown in the DOS of BCMO in Fig. 5(c). From the electronic-band structure results shown in Figs. 5(a) and (b), the Fermi energy lies in the conduction band with an imbalanced spin-up population over the spin-down component. As a result, the electronic transport properties are expected to mimic a metallic Fermi gas. Nevertheless, the strongly correlated nature remains, as shown in the reduced band gap () below the Fermi level because of on-site Coulomb interaction .

In contrast to that of pristine CMO, the Seebeck coefficient of BCMO is proportional to the temperature [see Figs. 6(a) and 3(a)], as expected from the linear scaling in metal [14]. In this case, the Seebeck coefficient does not depend on . Thus, we can fit with the experimental data to obtain . We obtain from the charge neutrality point, which means that the Fermi energy is located at the edge of the conduction band. The optimum Seebeck coefficient is approximately or approximately four times smaller than that of the pristine sample. This optimum value can be achieved by positioning the Fermi energy near at the band gap and low temperature, as shown in Fig. 6(b). At room temperature, the carrier concentration of BCMO is approximately cm-3, as shown in Fig. 6(c). It has times more concentration than pristine CMO because of the Bi doping. We also find that the mobility values of BCMO vary within – and tend to increase with increasing temperature until reaching a maximum value at a temperature between and K, as shown in Fig. 6(c).
Opposite behavior of CMO with respect to BCMO transport can also be observed from electrical resistivity profile that proportionally increases with , as shown in Fig. 6(d). For a conventional metal with , the electrical conductivity takes the form of . Thus, the only dependence of on comes from the temperature dependence of relaxation time (). Indeed, by considering the relaxation rate as , calculated reproduces the experimental results with and . We parenthetically note that the scattering rate of BCMO is 1.5 times larger than that of CMO. In other words, the electron lifetime in BCMO is shown to be reduced due to the Bi doping. Notably, despite the reduction in the electronic lifetime, the values of BCMO decrease by one order of magnitude compared with the CMO because of the metallic nature of BCMO. Hence, better TE performance is achieved.
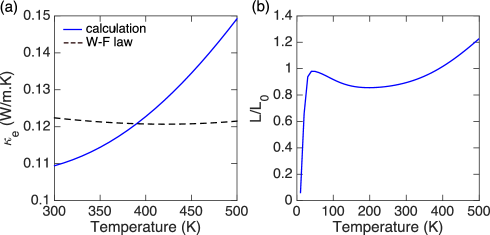
The electronic thermal conductivity of BCMO is shown to be linearly proportional to the temperature. However, this trend cannot be reproduced from the WF law [see Fig. 7(a)] because this system also possesses a Lorenz number that depends on the temperature [Fig. 7(b)]. Nevertheless, the ratio does not strongly depart from unity, which signifies the contribution from the Bi doping to recover the metallic characteristic of CMO. In contrast to pristine CMO, can be less than unity at a temperature below 400 K.
4.4 Phonon contribution to thermal conductivity
Using the simplified Callaway–Debye model in Eq. 4 and assuming that the Umklapp scattering is dominant, we can reproduce the measured thermal conductivity of pristine CMO, as shown in Fig. 8(a). The Debye frequency is assumed to be equal to the largest phonon peak in the Raman spectra (see A). For pristine CMO, we use the Debye temperature of and Debye frequency of from the Raman spectra. We also assume Grüneissen parameter from a previous work [40]. We then obtain effective sound velocity , which is typically comparable with a similar work by an Israel group [10]. For BCMO, we use the Debye temperature of 790 K (corresponding to the red-shifted Raman peak of ) and Grüneissen parameter . The sound velocity thus obtained for BCMO is .

We must note that Bi doping decreases thermal conductivity and electrical resistivity . The decrease in by times can overcome the Seebeck coefficient by two times, which makes BCMO power factor to be superior compared with pristine CMO, as shown in Fig. 8(b). We show in this figure, that the power factor of BCMO may, in principle, be amplified up to two times compared with that in the experiment if the Fermi level is located at the band gap with from the charge neutrality, as shown in Fig 6. The dimensionless figure of merit, in Fig. 8(c) shows that the TE performance in CMO can be improved by Bi doping.
Figures. 8(b) and (c) show that our current experiments have not yet reached the optimized values of PF and ZT from the theoretical prediction. We roughly estimate that to approach the optimized (theoretical) and , a subfraction of doping within – might be needed in the experiment. However, in reality, achieving the optimum doping by atomic substitution is highly complicated. The presence of Bi doping facilitates the DE mechanism. The Bi doping dramatically alters the CMO phase from an AFM insulator to an FM conductor. A slight change in the doping concentration might result in an abrupt change in the electronic-band structure. Thus, tuning the optimum doping concentration according to the theory could be difficult. Moreover, the measurement of carrier concentration can be performed using the Hall effect setup. However, this technique is only applicable to thin films and not to bulk samples. Nevertheless, we expect that the theoretical prediction of optimized PF and can trigger further experiments in the future to adjust the doping level (or chemical potential or Fermi energy) so that obtaining optimized (better) values of PF and becomes possible.
Our TE measurements show that CMO has a reasonably high Seebeck coefficient of approximately at room temperature, and optimizing the Seebeck coefficient up to five times is even possible if the chemical potential is correctly tuned (at the band edge). By Bi doping, the electrical resistivity is reduced by an order of magnitude, and the Seebeck coefficient becomes two times smaller than thatin pristine CMO, hence significantly improving the power factor. Additionally, the Bi doping adds more phonon scattering path via anharmonicity and increases the atomic average mass. As a result, the phonon lifetimes and thermal conductivity are reduced, as illustrated in the transport measurements. Combined with the reduced electrical resistivity, the TE figure of merit of BCMO is enhanced. Another notable phenomenon is the breakdown of WF law in CMO, where Lorenz number reaches four times that of conventional metals. The breakdown of the WF law comes from the strongly correlated nature of electrons in CMO, which suggests that the strong electron correlation in CMO separates the heat and charge transport. Moreover, the particular shape of the bands and scattering profiles can significantly differ from the metallic Lorenz value [41]. During the Bi-doping, this Lorenz number recovers from that of ordinary metals.
5 Conclusions
We have investigated the electron and phonon transport properties of and using TE transport measurements and first-principles calculations. Our calculations indicate that has AFM insulating ground states, which results in a significant Seebeck coefficient and electrical resistivity. The strongly correlated nature of manifests in the breakdown of the WF law in which the Lorenz number is four times larger than that of ordinary metals. In the Bi-doping, the electrical resistivity and conductivity decreases and increases, respectively, by an order of magnitude, whereas the Seebeck coefficient decreases by two times, providing a more prominent power factor than the pristine one. also recovers the correspondence with the WF law. The presence of Bi doping decreases the sound velocity as well as the phonon lifetime. Overall, the Bi doping enhances the TE figure of merit because of the improved electronic transport and phonon thermal-transport degradation.
Acknowledgments
This research was partially funded by a collaboration grant from the secretariat of Indonesian Institute of Sciences (LIPI) for a visit of the LIPI researchers to Thailand. We acknowledge HPC LIPI for computational facility. M. N. acknowledges a research grant from Brawijaya University No. 3/UN10.F09/PN/2019. B. K. acknowledges Ministry of Research and Technology/National Research and Innovation Agency of Indonesia (Kemenristek / BRIN) with PDUPT 2020 grant [NKB-2799/UN2.RST/HKP.05.00/2020]. W. B. K. P. acknowledges Raman research facilities in LIPI Research Center for Physics. T. S. and K. S. acknowledge TRF Research Career Development Grant RSA6180070.
Appendix A Raman Spectroscopy of CMO and BCMO

In addition to the TE measurements, we experimentally studied the phonon properties of CMO and BCMO via Raman spectroscopy. CMO and BCMO were prepared according to the standard sol–gel method. First, we mixed the stoichiometric reagents of (Merck, purity ), (Merck, purity ), Citric acid (Merck, purity ), (Fluka, purity ), and distilled water. The dried gel was crushed and ground into a powder and then calcined at K for h in air. Then, the powder was die-pressed into square-shaped pellets and sintered at K. To ensure quality of the final product, another round of sintering was applied at K for h, which were completed in the air atmosphere. Raman spectra were collected at room temperature using the iHR 320 modular Raman (Horiba Jobin Yvon) spectrometer equipped with a CCD detector and a solid-state laser source that operated at 532 nm wavelength with appropriate filters. The spectrometer had a spectral resolution of /pixel, 600 gr/mm grating, and an objective of 100.
Figure 9 shows the experimental Raman spectra of CMO and BCMO of the unpolarized light. The short lines below the spectra are the theoretical Raman active modes. Our results qualitatively reproduced those of Ref. [4]. We also observed a significant increase in the mode intensity from the Bi-doping. This peak is was due to defect scattering [4]. Therefore, we can expect an increase in intensity of BCMO. For the details of the modes, Table 1 lists the complete Raman active modes in CMO and BCMO along with their frequencies.
| symmetry | frequencies () | ||
|---|---|---|---|
| theory | exp. CMO | exp. BCMO | |
| Ag | 148 | 141 | 142 |
| B2g | 176 | 171 | 172 |
| B1g | 186 | 183 | 184 |
| B3g | 203 | 199 | 201 |
| B2g | 221 | 220 | 221 |
| Ag | 254 | 250 | 251 |
| Ag | 284 | 278 | 279 |
| Ag | 300 | 295 | 296 |
| B2g | 376 | 376 | 375 |
| B2g | 413 | 416 | 417 |
| B3g | 434 | 434 | 435 |
| B2g | 466 | 476 | 477 |
| B1g | 494 | 500 | 499 |
| Ag | 506 | 513 | 514 |
| Ag | 532 | 533 | 531 |
| B1g | 558 | 556 | 558 |
| B1g | 582 | 580 | 579 |
| B2g | 625 | 620 | 619 |
References
- [1] E. Oz, S. Demirel, S. Altin, E. Altin, O. Baglayan, A. Bayri, S. Avci, Fabrication of ––– compounds and their structural, electrical, magnetic and thermoelectric properties, Mater. Res. Express. 5 (2018) 036304.
- [2] J. Cong, K. Zhai, Y. Chai, D. Shang, D. D. Khalyavin, R. D. Johnson, D. P. Kozlenko, S. E. Kichanov, A. M. Abakumov, A. A. Tsirlin, L. Dubrovinsky, X. Xu, Z. Sheng, S. V. Ovsyannikov, Y. Sun, Spin-induced multiferroicity in the binary perovskite manganite , Nat. Commun. 9 (2018) 2996.
- [3] Neetika, A. Das, I. Dhiman, A. K. Nigam, A. K. Yadav, D. Bhattacharyya, S. S. Meena, Transport and magnetic properties of doped , J. Appl. Phys. 112 (2012) 123913.
- [4] M. V. Abrashev, J. Bäckström, L. Börjesson, V. N. Popov, R. A. Chakalov, N. Kolev, R. L. Meng, M. N. Iliev, Raman spectroscopy of : mode assignment and relationship between Raman line intensities and structural distortions, Phys. Rev. B 65 (2002) 184301.
- [5] C. R. Wiebe, J. E. Greedan, J. S. Gardner, Charge and magnetic ordering in the electron-doped magnetoresistive materials , Phys. Rev. B 64 (2001) 064421.
- [6] I. H. Lone, J. Aslam, N. R. E. Radwan, A. H. Bashal, A. F. A. Ajlouni, A. Akhter, Multiferroic transition metal oxides: a rare interaction of ferroelectricity and magnetism, Nanoscale Res. Lett. 14 (2019) 142.
- [7] C. N. R. Rao, Perovskite oxides and high-temperature superconductivity, Ferroelectrics 102 (1990) 297–308.
- [8] R. K. Zheng, H. U. Habermeier, H. L. W. Chan, C. L. Choy, H. S. Luo, Effects of substrate-induced strain on transport properties of and thin films using ferroelectric poling and converse piezoelectric effect, Phys. Rev. B 84 (2010) 104427.
- [9] Z. Zeng, M. Greenblatt, M. Croft, Large magnetoresistance in antiferromagnetic , Phys. Rev. B 59 (1999) 8784.
- [10] A. Baranovskiy, A. Graff, J. Klose, J. Mayer, Y. Amouyal, On the origin of vibrational properties of calcium manganate based thermoelectric compounds, Nano Energy 47 (2018) 451–462.
- [11] M. Molinari, D. A. Tompsett, S. C. Parker, F. Azough, R. Freer, Structural, electronic and thermoelectric behaviour of and , J. Mater. Chem. A 2 (2014) 14109–14117.
- [12] T. Seetawan, K. Singsoog, S. Srichai, C. Thanachayanont, V. Amornkitbamrung, P. Chindaprasirt, Thermoelectric energy conversion of p-/n- module, Energy Procedia 61 (2014) 1067–1070.
- [13] S. Paengson, P. Pilasuta, K. Singsoog, W. Namhongsa, W. Impho, T. Seetawan, Improvement in thermoelectric properties of by doping and hot pressing, Mater. Today: Proc. 4 (2017) 6289–6295.
- [14] H. J. Goldsmid, Introduction to thermoelectricity, Springer-Verlag, Berlin Heidelberg, 2010.
- [15] M. Zebarjadi, K. Esfarjani, M. S. Dresselhaus, Z. F. Ren, G. Chen, Perspectives on thermoelectrics: from fundamentals to device applications, Energ. Environ. Sci. 5 (2012) 5147–5162.
- [16] R. Franz, G. Wiedemann, Ueber die wärme-leitungsfähigkeit der metalle, Ann. Phys. 165 (1853) 497–531.
- [17] R. Mahajan, M. Barkeshli, S. A. Hartnoll, Non-Fermi liquids and the Wiedemann-Franz law, Phys. Rev. B 88 (2013) 125107.
- [18] A. Principi, G. Vignale, Violation of the Wiedemann-Franz law in hydrodynamic electron liquids, Phys. Rev. Lett. 115 (2015) 056603.
- [19] A. Lavasani, D. Bulmash, S. D. Sarma, Wiedemann-Franz law and Fermi liquids, Phys. Rev. B 99 (2019) 085104.
- [20] Y. H. Lin, J. Lan, C. Nan, Oxide Thermoelectric Materials, Wiley-VCH, 2019.
- [21] U. Aschauer, R. Pfenninger, S. M. Selbach, T. Grande, N. A. Spaldin, Strain-controled oxygen vacancy formation and ordering in , Phys. Rev. B 88 (2013) 054111.
- [22] P. W. Anderson, H. Hasegawa, Considerations on double exchange, Phys. Rev. 100 (1955) 675–681.
- [23] P. Giannozzi, S. Baroni, N. Bonini, M. Calandra, R. Car, C. Cavazzoni, D. Ceresoli, G. L. Chiarotti, M. Cococcioni, I. Dabo, et al., Quantum ESPRESSO: a modular and open-source software project for quantum simulations of materials, J. Phys. Condens. Matter 21 (2009) 395502.
- [24] J. P. Perdew, A. Ruzsinszky, G. I. Csonka, O. A. Vydrov, G. E. Scuseria, L. A. Constantin, X. Zhou, K. Burke, Restoring the density-gradient expansion for exchange in solids and surfaces, Phys. Rev. Lett. 100 (2008) 136406.
- [25] C. D. Ling, E. Granado, J. J. Neumeier, J. W. Lynn, D. N. Argyriou, Inhomogeneous magnetism in -doped . . mesoscopic phase separation due to lattice-coupled ferromagnetic interactions, Phys. Rev. B 68 (2003) 134439.
- [26] P. E. Blöchl, O. Jepsen, O. K. Andersen, Improved tetrahedron method for brillouin-zone integrations, Phys. Rev. B 49 (1994) 16223–16233.
- [27] M. Cococcioni, S. de Gironcoli, Linear response approach to the calculation of the effective interaction parameters in the method, Phys. Rev. B 71 (2005) 035105.
- [28] G. K. H. Madsen, D. J. Singh, Boltztrap. a code for calculating band-structure dependent quantities, Comput. Phys. Commun. 175 (2006) 67–71.
- [29] B. Liao, J. Zhou, B. Qiu, M. S. Dresselhaus, G. Chen, Ab initio study of electron-phonon interaction in phosphorene, Phys. Rev. B 91 (2015) 235419.
- [30] W. Li, Electrical transport limited by electron-phonon coupling from Boltzmann transport equation: An ab initio study of , , and , Phys. Rev. B 92 (2015) 075405.
- [31] J. Yang, Theory of Thermal Conductivity, Springer, Boston, MA, 2004.
- [32] G. A. Slack, S. Galginaitis, Thermal conductivity and phonon scattering by magnetic impurities in , Phys. Rev. 133 (1964) A253–A268.
- [33] J. B. Goodenough, Theory of the role of covalence in the perovskite-type manganites [,()], Phys. Rev. 100 (1955) 564.
- [34] F. P. Zhang, Q. M. Lu, X. Zhang, J. X. Zhang, First principle investigation of electronic structure of thermoelectric compound oxide, J. Alloys Compd. 509 (2011) 542–545.
- [35] J. H. Jung, K. H. Kim, D. J. Eom, T. W. Noh, E. J. Choi, J. Yu, Y. S. Kwon, Y. Chung, Determination of electronic band structures of and using optical-conductivity analyses, Phys. Rev. B 55 (1997) 15489.
- [36] N. T. Hung, A. R. T. Nugraha, E. H. Hasdeo, S. Dresselhaus, S. R., Diameter dependence of thermoelectric power of semiconducting carbon nanotubes, Phys. Rev. B 92 (2015) 165426.
- [37] T. Ye, X. Wang, X. Li, A. Q. Yan, S. Ramakrishna, J. Xu, Ultra-high Seebeck coefficient and low thermal conductivity of a centimeter-sized perovskite single crystal acquired by a modified fast growth method, J. Mater. Chem. C 5 (2017) 1255–1260.
- [38] H. Yoshino, K. Murata, Significant enhancement of electronic thermal conductivity of two-dimensional zero-gap systems by bipolar-diffusion effect, J. Phys. Soc. Jpn. 84 (2015) 024601.
- [39] N. N. Loshkareva, W. V. Mostovshchikova, Electron-doped manganites based on , Phys. Met. Metallogr. 113 (2012) 22–42.
- [40] A. Srivastava, N. K. Gaur, Bulk modulus and thermodynamic properties of electron-doped calcium manganate–, J. Magn. Magn. Mater. 321 (2009) 3854–3865.
- [41] X. Wang, V. Askarpour, J. Maassen, M. J. B. Lundstrom, On the calculation of Lorenz numbers for complex thermoelectric materials, J. Appl. Phys. 123 (2018) 055104.