Flare-like Variability of the Mg II 2798 Å Emission Line and UV Fe II band in the Blazar CTA 102
Abstract
We report on the detection of a statistically significant flare-like event in the Mg II 2798 Å emission line and the UV Fe II band of CTA 102 during the outburst of autumn 2017. The ratio between the maximum and minimum of 3000 Å continuum flux for the observation period () is 17915. Respectively, the max/min ratios 8.110.5 and 34.045.5 confirmed the variability of the Mg II emission line and of the Fe II band. The highest levels of emission lines fluxes recorded coincide with a superluminal jet component traversing through a stationary component located at 0.1 mas from the 43 GHz core. Additionally, comparing the Mg II line profile in the minimum of activity against the one in the maximum, we found that the latter is broader and blue-shifted. As a result of these findings, we can conclude that the non-thermal continuum emission produced by material in the jet moving at relativistic speeds is related to the broad emission line fluctuations. In consequence, these fluctuations are also linked to the presence of broad-line region (BLR) clouds located at 25 pc from the central engine, outside from the inner parsec, where the canonical BLR is located. Our results suggest that during strong activity in CTA 102, the source of non-thermal emission and broad-line clouds outside the inner parsec introduces uncertainties in the estimates of black hole (BH) mass. Therefore, it is important to estimate the BH mass, using single-epoch or reverberation mapping techniques, only with spectra where the continuum luminosity is dominated by the accretion disk.
1 Introduction
Since its discovery in 1959 (Harris & Roberts, 1960), the radio source CTA 102 has been studied fairly extensively in the entire electromagnetic spectrum. CTA 102 is a well-known quasi-stellar object, first identified in the optical band by Sandage & Wyndham (1965), with a redshift of 1.037 (Schmidt, 1965) showing flux fluctuations in the 32.5 cm band (Sholomitskii, 1965). Although it has been classified as an optically violent variable (OVV) QSO (Angel & Stockman, 1980), the long-term B-band monitoring () of Pica et al. (1988) shows that its variations are too slow and gentle to fit that classification. The optical linear polarization is strong, sometimes 11% (Moore & Stockman, 1981). Thus CTA 102 can be classified as a high polarization quasar (HPQ) and a blazar (Nolan et al., 1993). Currently, CTA 102 is well known as a flat-spectrum radio quasar (FSRQ). Furthermore, it demonstrates structural and flux variability on its pc-scale jet (Larionov et al., 2013; Fromm et al., 2015; Casadio et al., 2015, 2019) and also shows correlated variability among different wavebands (Bachev et al., 2017; Larionov et al., 2016; Raiteri et al., 2017; Kaur & Baliyan, 2018; Li et al., 2018; Prince et al., 2018; Shukla et al., 2018; D’Ammando et al., 2019). The extended giant flaring behavior of CTA 102 in late 2016 and early 2017 has permitted the assembly of an exquisite multiwavelength time-resolved database (see papers cited above). Despite the precious database compiled, no consensus about the location of the gamma-ray production zone in CTA 102 has been reached so far. Some studies (Zacharias et al., 2017; Kaur & Baliyan, 2018; Shukla et al., 2018) favor the scenario where the gamma-ray emission in CTA 102 is generated close to the central black hole (BH) within or close to the border of the canonical broad-line region (BLR), which is located within the inner pc. However, other works (Zacharias et al., 2017, 2019; Gasparyan et al., 2018; Costamante et al., 2018) find more feasible the scenario where gamma-rays are produced far from the central BH and canonical BLR, within or downstream of the radio core at distances much larger than 1 pc. In case the latter scenario is correct, a possible source of seed photons is the jet-excited BLR.
The existence of the jet-excited BLR outflowing downstream the jet was proposed to explain the link between jet kinematics on sub-pc scales, optical continuum and emission line variability (Arshakian et al., 2010; León-Tavares et al., 2010). Direct observational evidence of the BLR close to the radio core of the jet comes from a response of the broad emission lines to changes in the non-thermal continuum emission of the jet (León-Tavares et al., 2013). The highest levels of the Mg II 2798 Å emission line and the UV Fe II band fluxes and gamma-ray outburst happen when a jet component passes through (or is ejected from) the radio core of 3C 454.3. This remarkable event was also confirmed in consequent studies (Isler et al., 2013; Jorstad et al., 2013). The differences in slopes of the Baldwin Effect in radio-quiet (RQ) active galactic nuclei (AGN) and FSRQ can be explained by the presence of a second BLR that is related to the jet, probably in the form of an outflow (Patiño-Álvarez et al., 2016). The origin of the jet-excited outflow is most likely to be the wind from the accretion disk accelerated to sub-relativistic speeds by a twisted magnetic field of the jet. This possibility was previously suggested by Perez et al. (1989), and also for specific sources like 3C 273 (Paltani & Türler, 2003) and 3C 454.3 (Finke & Dermer, 2010).
Relativistic flows may also interact with a cloud from the atmosphere of a red giant star (Bosch-Ramon et al., 2012), or come from a star-forming region that passes through the jet. Barkov et al. (2012b) propose the former scenario to explain the TeV flaring activity in M87. The latter was invoked to explain the short timescale GeV flare-like event generated close to the radio core in 3C 454.3 (Khangulyan et al., 2013) and CTA 102 (Zacharias et al., 2019). Previous studies have addressed the dynamics of the interaction of a red giant star after entering an AGN jet (e.g. Araudo et al., 2010; Barkov et al., 2010, 2012a); while other works have studied the global impact on the jet propagation and content caused by stars or clouds as they interact with the jet (e.g. Komissarov, 1994; Steffen et al., 1997; Hubbard & Blackman, 2006; Choi et al., 2007; Sutherland & Bicknell, 2007; Jeyakumar, 2009).
In this work, we explore the variability of the broad emission lines in CTA 102 to use it as an auxiliary piece of information to probe the geometry and physics of the innermost regions of CTA 102 and to provide evidence for the above scenarios of gamma-ray production. Although CTA 102 has been monitored extensively at all wavelengths, the variability of the broad emission lines was not systematically studied. However, some studies (Larionov et al., 2016; Bachev et al., 2017; Raiteri et al., 2017) demonstrated the evolution of the shape of optical spectra and the Mg II broad-line emission during the flaring events.
The present work is the first one to address the variability of emission lines in CTA 102 during the Fermi/LAT era with the largest sample of its optical spectra ever compiled.
The cosmological parameters adopted throughout this paper are H km s-1 Mpc-1, , , . At the redshift of the source, z=1.037, the spatial scale of 1″corresponds to a physical scale of 21.2 kpc and the luminosity distance is 6.933 Gpc.
2 Observations
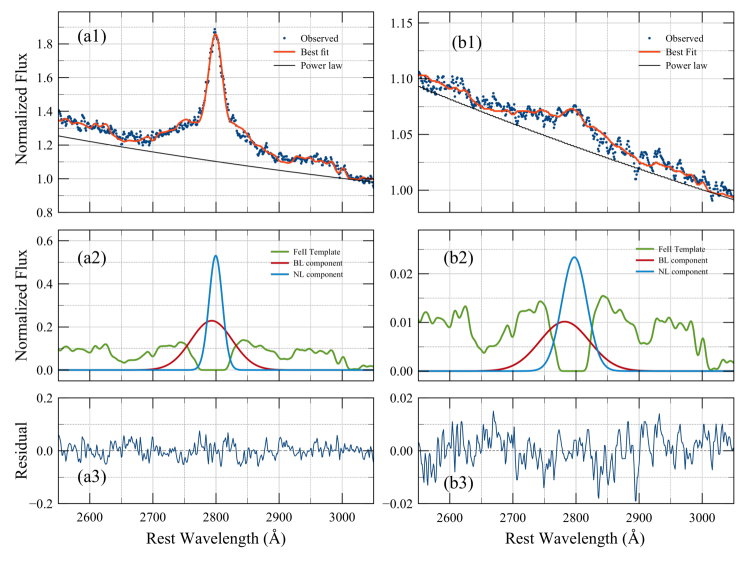
For the analyses performed in this work, we used 271 optical spectra of CTA102 observed in different epochs, calibrated against the V-band magnitude taken from the Ground-based Observational Support of the Fermi Gamma-ray Space Telescope at the University of Arizona monitoring program111http://james.as.arizona.edu/~psmith/Fermi/. The details regarding the observational setup and the process of data reduction can be examined in Smith et al. (2009). We took the spectra to the rest frame of the object and perform a cosmological correction to the flux of the form . We did not apply correction for galactic reddening. To accurately measure the flux of the Mg II 2798 Å emission line, an appropriate subtraction of the UV Fe II band emission, as well as the continuum, is necessary. Here, we present a brief description of our spectral fitting, which is based on using the SPECFIT task from the IRAF package222http://iraf.noao.edu/ (Tody, 1986, 1993). To subtract the featureless continuum from the spectrum, we approximate it with a power-law function. Next, we removed the contribution of the Fe II emission by fitting it using the template of Vestergaard & Wilkes (2001). After performing this procedure to all spectra, we integrated the line profile of the Mg II emission line from Å to measure its flux. The Fe II emission was measured by integrating the fitted Fe II template in the wavelength range of Å, where the red UV Fe II bump is found. The UV continuum flux at Å was measured from the iron-subtracted spectrum, by taking the average value between the wavelength range Å; this is done to avoid measurement errors due to noise in the spectrum. Examples of this decomposition process for the spectrum at the minimum continuum flux, and for a spectrum during the flare of late 2016 early 2017 are shown in Figure 1. Unfortunately, we could not perform an analysis of the Mg II emission line FWHM evolution because the spectra were taken with different slit sizes, 3″ being the smallest and 7.6″ the largest. Hence, this gives a difference in the resolution of .
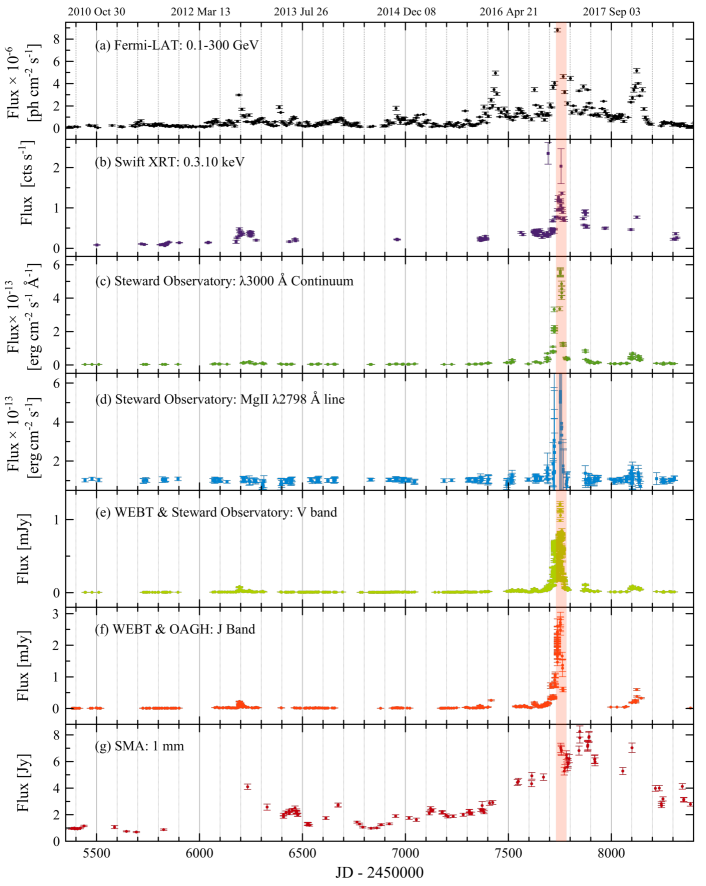
We calculated the error associated with the Mg II flux measurement accounting for two different contributions. The main contribution is due to the random error produced by the dispersion of the spectra and the signal-to-noise ratio (S/N), estimated following Tresse et al. (1999). The second contribution to the error is the one produced by the subtraction of the Fe II emission, estimated as in León-Tavares et al. (2013). We consider that in the range Å no iron subtraction was performed. For the error associated to the Fe II emission, we are only taking into account the random error, which can be estimated in the same way as that of the Mg II line (applying the methodology in Tresse et al., 1999). On the other hand, the error in the 3000 Å continuum flux is estimated as the rms of the iron-subtracted spectrum around 300050 Å. The measured fluxes and errors are shown in Table 1. The light curves for continuum emission and Mg II line are shown in Figure 2 panels (c) and (d).
| JD-2450000 | Mg II 2798 Å Flux | Error | Fe II Flux | Error | Continuum 3000 Å Flux | Error |
|---|---|---|---|---|---|---|
| 5443.93 | 1.02 | 0.09 | 0.40 | 0.13 | 3.18 | 0.28 |
| 5477.76 | 1.09 | 0.09 | 0.43 | 0.12 | 3.47 | 0.26 |
| 5510.75 | 1.03 | 0.09 | 0.42 | 0.13 | 3.33 | 0.28 |
| 5726.92 | 0.99 | 0.12 | 0.34 | 0.17 | 3.46 | 0.37 |
| 5727.91 | 0.98 | 0.13 | 0.33 | 0.18 | 3.44 | 0.39 |
| 5738.88 | 1.04 | 0.12 | 0.33 | 0.16 | 3.40 | 0.35 |
| 5743.90 | 1.01 | 0.10 | 0.33 | 0.14 | 3.43 | 0.30 |
| 5819.91 | 1.04 | 0.15 | 0.41 | 0.20 | 3.57 | 0.45 |
| 5831.77 | 1.01 | 0.11 | 0.39 | 0.15 | 3.41 | 0.32 |
| 5833.75 | 1.06 | 0.09 | 0.38 | 0.13 | 3.43 | 0.27 |
The gamma-ray data were obtained from the public database of the Large Area Telescope (LAT) on board of the Fermi Gamma-Ray Space Telescope (Abdo et al., 2009). The weekly light curve in the energy range from 0.1-300 GeV was built by reducing the Fermi-LAT data with the Fermitools version 1.0.2. In the model, we included all sources within 15∘ of the location of CTA 102, extracted from the 4FGL catalog (The Fermi-LAT collaboration, 2019). The light curve is shown in Figure 2 panel (a). The X-ray data were obtained from the public database of the Swift-XRT333http://www.swift.psu.edu/monitoring/. The Swift-XRT data were processed using the most recent versions of the standard SWIFT tools: Swift Software version 3.9, FTOOLS version 6.12 (Blackburn, 1995) and XSPEC version 12.7.1 (Arnaud, 1996). Light curves are generated using xrtgrblc version 1.6 and are shown in Figure 2 panel (b). Full details of the reduction procedure can be found in Stroh & Falcone (2013). The optical V band data were obtained from two different sources, shown in Figure 2 panel (e), the Ground-based Observational Support of the Fermi Gamma-ray Space Telescope at the University of Arizona (Steward Observatory, Smith et al., 2009), and the Whole Earth Blazar Telescope (WEBT, Villata et al., 2006). In Figure 2 panel (f) are presented the Near-Infrared (NIR) J-band data which were obtained from two different sources, the Observatorio Astrofísico Guillermo Haro (OAGH) using the Cananea Near-Infrared Camera (CANICA, Carrasco et al., 2017), and the WEBT project (Villata et al., 2006). The OAGH J-band data was observed using the dithering technique in order to accurately subtract the background, and the photometry calibration was done against magnitudes of bright standard stars found in the Two Micron All-Sky Survey (2MASS). The 1 mm data were retrieved from the Sub-Millimeter Array (SMA) public database444http://sma1.sma.hawaii.edu/callist/callist.html; shown in Figure 2 panel (g), and full details on the observations and the data reduction process can be found in Gurwell et al. (2007).
3 Variability
3.1 Multiwavelength Variability
We performed cross-correlation analysis between all the bands studied in this paper. The results can be found in Table 2.
| Bands | First delay | Second delay |
|---|---|---|
| Gamma-rays vs X-rays | 1023 | 32223 ∗ |
| Gamma-rays vs 3000 Å | 3.17.1 | -360.07.1 ∗ |
| Gamma vs Mg II | 6.97.1 | -360.07.1 ∗ |
| Gamma vs Fe II | 10.09.7 | -361.79.7 ∗ |
| V-band vs Gamma-rays | -4.17.0 | -314.97.0 ∗ |
| J-band vs Gamma-rays | -1.47.0 | -314.57.0 ∗ |
| Gamma-rays vs 1mm | -42 | — |
| 3000 Å vs X-rays | 18.722.6 | — |
| Mg II vs X-rays | 5.322.6 | — |
| Fe II vs X-rays | 2.422.6 | — |
| V-band vs X-rays | 66.4 | — |
| J-band vs X-rays | 7.722.6 | — |
| 1mm vs X-rays | 1923 | — |
| Mg II vs 3000 Å | 0.07.1 | — |
| Fe II vs 3000 Å | 0.07.1 | — |
| V-band vs 3000 Å | 4.57.1 | -222.752.7 ∗∗ |
| J-band vs 3000 Å | -0.77.1 | -210.719.4 ∗∗ |
| 3000 Åvs 1mm | 2.1 | — |
| Fe II vs Mg II | 0.07.1 | — |
| V-band vs Mg II | 2.47.1 | — |
| J-band vs Mg II | 0.07.1 | — |
| Mg II vs 1mm | 141.9 | — |
| V-band vs Fe II | 9.59.6 | — |
| J-band vs Fe II | 4.99.6 | — |
| Fe II vs 1mm | 2.1 | — |
| V-band vs J-band | -0.13.1 | — |
| V-band vs 1mm | -25 | — |
| J-band vs 1mm | 19.0 | — |
It is worth noting that most of the cross-correlations involving the 1mm band, result in a large uncertainty in the delay, due to the great difference of the variability timescale and amplitude between the 1mm light curve and the other bands. This can be attributed to the difference in sizes of the emission regions (León-Tavares et al., 2011).
We performed an alias check via Fourier analysis, to determine the truthfulness of the delays obtained with the cross-correlation analysis (Press et al., 2007)555https://www.cambridge.org/numericalrecipes. We found that the delays obtained around 200 days in the cross-correlation functions between the 3000 Å continuum light curve and the J and V-bands are aliases. On the other hand, we attribute the delays obtained around 300 days that involve the gamma-ray light curve, to the multiple peaks it shows. These differ from the highest one (in the gamma-rays and in the other bands as well) by 300 days.
3.2 Spectral Variability
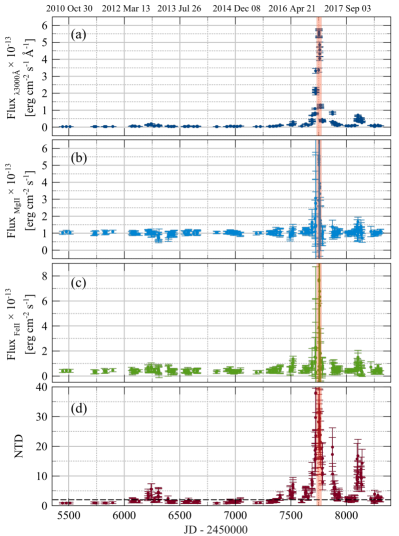
The flux light curves for the Mg II 2798 Å line, the UV Fe II band, and the 3000 Å continuum are shown in Figure 3 panels (a) through (c). The main focus of this paper is the study of the significant flaring period in late 2016 and early 2017. This flaring period also marks the highest gamma-ray fluxes the source has shown since the Fermi/LAT was launched. The ratio between the maximum and the minimum of continuum flux for the entire observation period is 17915, which represents the highest activity for CTA 102 in over a decade. The variability of the Mg II emission line and the Fe II band is already notorious from a visual inspection of the light curves. It is confirmed by the large ratios between maximum and minimum flux of 8.110.5 and 34.045.5, respectively. The highest fluxes recorded during the flaring event are at 6.1- and 6.3- of the weighted mean for the Mg II and the Fe II, respectively. We performed cross-correlation analysis (for details on the cross-correlation methodology applied, see Patiño-Álvarez et al., 2018) between the Mg II emission line, Fe II, and the continuum emission. After accounting for possible correlated bias, the resultant lag is 0.07.1 days (uncertainty at 90%) for all permutations between these three light curves. The uncertainty is the same in all cases, due to all observation dates being the same since they are all measured from the same spectra.
3.3 Luminosity Relations
Since the cross-correlation analysis results in a correlation between the continuum emission and both emission features (Mg II and Fe II), we look for the relationship between the luminosities, which can be seen in Figure 4. We tested for correlations between the 3000 Å continuum luminosities and the Mg II 2798 Å luminosities, as well as the UV Fe II band luminosities using the Spearman rank correlation test. Between the continuum and the Mg II we found a correlation coefficient of 0.48 with a p-value of 2.210-14, indicating a weak albeit significant correlation; while the test between the continuum and Fe II yields a correlation coefficient of 0.66 with a p-value of 4.910-35, indicating a strong and significant correlation. Subsequently, we noted that the luminosities of Mg II and Fe II do not increase monotonically as the continuum luminosity increases. There is a luminosity range in which the continuum emission increases, but the Mg II and the Fe II seem to fluctuate around a constant luminosity value. Similar behavior can be seen in the blazar 3C 454.3 (see Figure 4, León-Tavares et al., 2013). In order to quantify the luminosity ranges in which the emission features do not vary significantly, we applied an error-weighted linear fit to the logarithmic luminosities using a Levenberg-Marquardt algorithm. First, we fit the 11 points with lower continuum luminosity (11 points is the minimum number required so that a calculated correlation coefficient is statistically meaningful, Alexander, 1997). In the case that the slope yielded a result within 1- from zero (indicating no correlation), we add the next point sorted by continuum luminosity, until the resulting slope is outside 1- of zero. This marks the threshold when the Mg II and Fe II luminosities started correlating with the continuum luminosity.
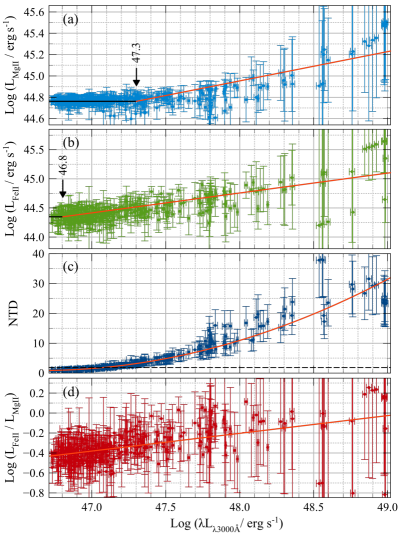
These correlations were further tested by applying the Spearman correlation rank test, to the points before and after this threshold, separately. For the Mg II emission line the threshold lies at . The Spearman rank correlation yields a correlation coefficient of 0.06 along with a p-value of 0.48 for the points before this threshold, indicating no correlation. While it yields a correlation coefficient of 0.67 with a p-value of for the points after the threshold, indicating a strong and significant correlation (we consider a correlation as significant when the chance of obtaining the correlation coefficient by chance is 5% or less, i.e. p-value 0.05). For the UV Fe II band the threshold is found at . The Spearman rank correlation yields a correlation coefficient of 0.36 and a p-value of 0.14 for the points before the threshold, indicating a weak and not significant correlation. While for the points after the threshold, the correlation is strong and significant with a correlation coefficient of 0.66 and a p-value of .
Now that we have shown that the variability of Mg II and Fe II in CTA 102 is statistically significant, it is instructive to investigate if there is a causal link between major emission lines flux variations and variability at other wavelengths and their nature.
In order to determine whether the continuum flare has a thermal or non-thermal origin, we calculated the Non-Thermal Dominance parameter, NTD (see Shaw et al., 2012). An expanded definition of NTD for FSRQ is presented by Patiño-Álvarez et al. (2016). The authors define alternative NTD for FSRQ as , where is the observed continuum luminosity, is the predicted disk continuum luminosity estimated from the emission line luminosity, is the continuum luminosity emitted by the accretion disk, and is the jet contribution to the continuum luminosity. If the emission line is only ionized by the disk , so that , which shows that . If the it means that the continuum is due only to thermal emission, shows that a superluminal jet exists that contributes to the continuum luminosity, and means that . We estimated by applying the bisector fit to the relationship between the luminosity of the Mg II, and continuum luminosity found by Shen et al. (2011) for a non-blazar sample (see Figure 6). The NTD light curve is shown in Figure 3 panel (d).
During the flare the NTD reached values up to 38, which is a clear indication that the continuum flare was dominated by emission from the jet (non-thermal synchrotron emission).
The 1 mm light curve also shows an increase in activity during the flaring period in the emission line and continuum, as well as the gamma-rays and X-rays (Figure 2). This, along with the strong variability of the polarization fraction in the jet (Raiteri et al., 2017), points to the flaring event being caused by non-thermal processes. Moreover, Casadio et al. (2019) found that during the multiwavelength outbursts, a component that was ejected from the core in July 2016 was crossing another stationary feature located very close to the core (0.1 mas) increasing its flux density; which further supports the hypothesis that the multiwavelength outburst was caused by non-thermal processes in the jet.
3.4 Disk-dominated light curves
Given the predominance of the jet emission during the flaring event, we decided to analyze separately the parts of the spectroscopic light curves where the accretion disk is expected to be the dominant source of continuum emission, i.e., when . This was done under the assumption that if we analyze these time-ranges, then the results from the cross-correlation would mostly reflect the relationship between the accretion disk and the canonical broad line region. In an attempt to avoid the possible bias from the disk dominated (DD) light curves to exhibit alias, due to the continuum and emission features being measured from the same spectrum, we identified the time ranges where the in the spectra. Afterwards, we selected the V-band flux observations that lie between these time ranges, and performed cross-correlation between the DD V-band light curve, and the DD Mg II and Fe II light curves. We also performed cross-correlation between the DD V-band and the DD 3000 Å continuum, to ensure that their behavior is as close as expected. We obtained a delay of days, well within the range of simultaneous variability. We did not find a significant correlation between the DD V-band light curve and the DD Mg II line light curve, nor with the DD UV Fe II band.
3.5 Line Profile Variability
All the spectra in the peak of the flare were taken using a slit width of 7.6″ and a exposure time of 240 seconds, reflecting in the spectra by being of low resolution and having very poor S/N ratio, respectively. We looked for spectra in the minimum flux taken with the same resolution, to compare the profiles at these activity levels, and were lucky to find a spectrum taken with this particular slit width, this being the only one in the entire dataset.
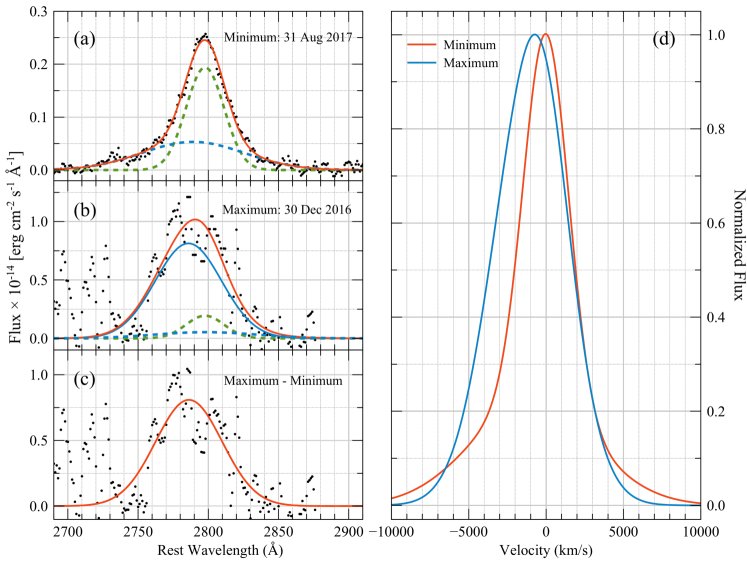
If we assume that the accretion disk activity is not changing, it means that the two components used to fit the profile in the minimum flux do not change either. Under this assumption, we approximated the additional component we argue is related to jet activity. The FWHM of the components used to fit the Mg II line profiles were estimated as upper limits since we need the correction for instrumental profile to determine the value precisely and this information is not publicly available. In Figure 5 panel (a), the narrow and broad components (referring to the relative width of the components, instead of the emission line region) from the minimum of activity show FWHM and FWHM , respectively. The additional component needed to fit the profile in the maximum of activity shows a FWHM 2900 km/s. In Figure 5 panel (a), it is evident that the broad component is blue shifted (V ) and, in the panel (b), the third component is also blue shifted (V ). For the same reason as for FWHM, the shifts can not be determined with precision. The best fit to the resulting profile from the subtraction of the profile in the minimum flux to the profile in the maximum flux, shown in Figure 5 panel (c), is assumed to be the third component needed to fit the profile in the maximum of activity. We can speculate that this additional component is the one responsible for the flare in the Mg II emission line and hence, comes from an additional emission region.
The total Mg II line profiles in the maximum and minimum were normalized to be able to compare the profile shape during the two different states of activity is presented in Figure 5 panel (d). The fit corresponding to the maximum flux seems to be blue shifted (V ) and broader than the one in the minimum flux.
It was not possible to analyze and make conclusions regarding the shape and displacement of the Fe II profile, in the same way as for the Mg II line profile, since the spectra do not have sufficient resolution and, due to big errors.
4 Discussion
4.1 Mg II and Fe II variability
The fact that the Mg II 2798 Å and UV Fe II band flaring events occurred at a time where the continuum was being dominated by non-thermal emission, suggests that the ionization source for the broad-line region material responsible for this emission line event is the jet itself.
The variability of the Mg II emission line has been subject of study before. Clavel et al. (1991) concluded that the amplitude of variation of a given emission line seems to depend on the degree of ionization of its ion, by studying for 8 months the variability in NGC 5548 with the International Ultraviolet Explorer (IUE). The highest ionization lines show the strongest variations. On the other hand, the Mg II, the lowest ionization line displays the smallest amplitude fluctuations. This might explain why the DD Mg II light curve did not show a significant correlation with the continuum emission. In the SWIFT/UVOT grism monitoring of NGC 5548, Cackett et al. (2015) showed that the Mg II emission line is not strongly correlated with the continuum variability, and there is no significant lag between the two. However, more recent studies of CTS C30.10 (radio quiet quasar) and 3C 454.3 (blazar) Czerny et al. (2019) and Nalewajko et al. (2019) show that there are time delays of and 600 days, respectively, between the continuum variations and the response of the Mg II emission line.
León-Tavares et al. (2013) and Isler et al. (2013) reported the statistically significant flare-like event in the Mg II emission line in the blazar 3C 454.3. This flare coincides with a superluminal jet component traversing through the radio core and correlated with the flares in gamma-rays, UV continuum, and R band flares (León-Tavares et al., 2013). It is important to mention that during the flare-like event (brightest flare in 3C 454.3) in the UV continuum in the middle of 2014, Nalewajko et al. (2019) did not identify short-term flaring activity of the Mg II line flux, unlike the previously reported event.
The physics of broad emission lines with high ionization and high excitation is relatively simple, and they are in good agreement with the observations. However, this does not apply to some lines with low ionization, especially Fe+ lines. These lines are observed in most type 1 AGN in the infrared, visible and ultraviolet spectrum. Currently, there is a disagreement between theoretical calculations assuming photoionization by the central source, with the observations. For more details about the physics of Fe+ emission lines see Netzer (2013).
The variability behavior of the optical Fe II emission in radio-quiet AGN, specifically in Seyfert galaxies, is well studied but not yet well understood (e.g. Shapovalova et al., 2012; Barth et al., 2013, and references therein). Shapovalova et al. (2012) found that the correlations between the continuum and emission lines are weak, whereas between the optical Fe II and the continuum is slightly higher and more significant. The authors also conclude that the correlation between the continuum flux and the different Fe II emission of groups depends on the type of transition. Barth et al. (2013) showed for NGC 4593 and Mrk 1511 highly correlated variations between Fe II and continuum emission. From reverberation lags, the authors demonstrate that the Fe II emission in these galaxies originates in photoionized gas, located predominantly in the outer portion of the broad-line region. These results coincide with ours, in that the Fe II correlates better with the continuum emission than the Mg II emission line does, for the full data set (see Sec. 3.3).
A recent study of the UV Fe II line complex over the 2000-3000Å region of NGC 5548 is presented by Cackett et al. (2015). The authors found that the UV Fe II light curve does not show any clear variability correlated with the continuum light curve. This coincides with our result for the DD light curves.
The flare-like variability of UV Fe II emission for a blazar type source (3C 454.3) was reported for the first time in León-Tavares et al. (2013), which resulted to be very similar to the Mg II flare.
4.2 Implications of the luminosity relations
Regarding the behavior of the Mg II emission line and Fe II, at luminosities lower than the aforementioned luminosity thresholds, Cackett et al. (2015) found that the source NGC 5548 behaves in a similar manner. When the continuum luminosity increases, the emission features fluxes remain relatively constant. On the other hand, Shapovalova et al. (2008) found in the source NGC 4151, that for low continuum fluxes, there is a correlation between the optical continuum emission and optical emission lines (H, He II, H and H). However, for high continuum fluxes, there is no correlation between the continuum emission and any of the emission lines, with the emission line fluxes remaining relatively constant. One possible interpretation for the emission line behavior in CTA 102, and the aforementioned sources, is to consider that the Mg and Fe contained within the canonical BLR, is already fully ionized or becomes fully ionized (in the case of NGC 4151). This would mean that even when the rate of ionizing photons is increased, the total amount of emission line photons emitted by the canonical BLR does not change significantly.
We cannot exclude the possibility that the variability is weak and is not detected due to relatively large errors. In this case, the other interpretation is that the clouds of Mg II and Fe II are close to the external physical limit of the canonical BLR (e.g. Barth et al., 2013; Guo et al., 2019, and references therein). Guo et al. (2019) show that the observed weak variability of the Mg II line comes naturally from photoionization calculations that capture various excitation mechanisms, radiative transfer effects, and variability dilution due to the larger average distances the Mg II gas reaches. All these effects likely also contribute to the difference between the Mg II and the Balmer lines variability. For either of the two possibilities, the accretion disk is assumed to be the main source of ionizing continuum, which means that these scenarios are only valid for times when .
As concluded before, the large flaring event in the emission features is considered to be related to the jet. This tells us that the Mg II and Fe II luminosities, after their respective continuum luminosities thresholds, can be assumed to be dominated by jet activity, just as the continuum emission is. This would explain comprehensively why is there a region where there is no significant change in the emission features while the continuum increases. This can be interpreted as the disk-dominance zone (including the canonical BLR); while after the threshold we have the jet-dominance zone. We assess this by looking for a correlation between the NTD parameter and the continuum luminosity. The Spearman rank correlation test yields a correlation coefficient of 0.99 with a probability of obtaining this value by chance, of zero (to machine accuracy), indicating that the continuum luminosity increases, as the jet-dominance increases. Figure 4 panel (c) shows the comparison between the continuum luminosity and the NTD parameter, in which we can see that for low continuum luminosities, the NTD has values lower than 2, suggesting that the accretion disk is the dominant source of the continuum. While at continuum luminosities near the continuum thresholds, we obtain , suggesting that the found thresholds indeed indicate a change in regime between disk-dominance and jet-dominance.
These results open the question of why the continuum luminosity thresholds between Mg II and Fe II are so different, considering that their ionization energies are similar (7.64 eV for the Mg and 7.9 eV for the Fe), which means that the ionizing continuum capable of ionizing Fe is also capable of ionizing Mg. The first possible explanation is that there are simply more Fe atoms than Mg atoms. Therefore, the probability of ionizing a Fe atom is higher, which will cause it to increase its emission with a lower rate of ionizing photons than the Mg would need, due to the lower quantity of available atoms. This could also explain the effect observed in figure 4 panel (d), the Fe II luminosity increases faster than the Mg II line luminosity (Spearman rank correlation coefficient of 0.58 with a p-value of 1). Therefore, a higher number of Fe II photons are emitted as the ionizing continuum increases, thus more Fe atoms are being ionized than Mg atoms. This possibility was studied by Verner et al. (2003), by using an 830 level model atom for Fe II in photoionization calculations, and reproducing the expected physical conditions in the BLR of quasars. The modeling reveals that interpretations of high values of UV Fe II/Mg II are sensitive not only to Fe and Mg abundance, but also to other factors such as micro-turbulence, density, and properties of the radiation field.
As mentioned above, we conclude that the flaring behavior in the Mg II and Fe II, is produced in a region separated from the canonical BLR. The matter to solve is the location of said emission region. It has been shown that the continuum emission flaring behavior is caused by the interaction between a moving jet component at pc-scales (K1, Casadio et al., 2019) with a stationary feature (C1, Jorstad et al., 2005, 2017; Casadio et al., 2019). This was interpreted as a recollimation shock, which can trigger both radio (Fromm et al., 2013b) and gamma-ray outbursts (Casadio et al., 2015). The cross-correlation analysis shows a delay of 0.07.1 days, between the continuum flux and the emission features, which means that the line emission production zone is nearly co-spatial with the source of the continuum emission. Hence, the additional line emission region, active during the studied flaring event, is close or around the stationary component C1, at 0.1 mas from the 43 GHz core (Jorstad et al., 2005, 2017; Casadio et al., 2015). It translates to a projected distance of 2.12 pc (de-projected distance of 18 pc at a viewing angle of 2.6∘, Fromm et al., 2013a). Fromm et al. (2015) estimated the distance from the 43 GHz core to the black hole, from the core shift measurements, yielding a distance of pc. This means that the stationary component C1, which we speculate is associated with an additional BLR component, is located at 25 pc from the black hole and far from the expected sizes for the canonical BLR.
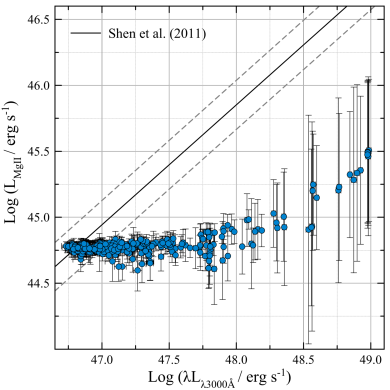
In an attempt to assess how the jet presence affects the luminosity relation, we compared our data to a well-defined correlation between the luminosity of the Mg II emission line to the for the non-blazar sample of Shen et al. (2011), as it is illustrated in Figure 6. If the optical continuum of strong radio-loud sources is significantly increased by the emission of a jet, its (and therefore the virial mass) will be systematically overestimated. If jet contamination is important, we would expect that strong radio objects remain systematically to the right of the best fit relationships for radio-quiet objects (black line) shown in Figure 6. As was shown by Greene & Ho (2005) for the relation, strong radio sources do not show a significant displacement from the radio-quiet sample. However, our data show a significant displacement concerning the non-blazar sample and are to the right of the relation of Shen et al. (2011). When the jet activity is higher (see panels (d) and (c) in Figures 3 and 4, respectively), the difference is more noticeable.
A remaining unknown that follows is the nature of the additional BLR component at 25 pc from the black hole. The existence of a dynamic and extended BLR has been suggested before (Popović et al., 2001; Elitzur & Shlosman, 2006), while the existence of an outflowing BLR excited by the jet was previously proposed as an explanation for the link between optical continuum and emission lines with observed jet kinematics on sub-pc scale in other sources (Arshakian et al., 2010; León-Tavares et al., 2010, 2013). A wind from the accretion disk later accelerated by magnetic fields in the jet, is a likely origin for the jet-excited outflow.
The other scenario widely studied is the one in which the relativistic flows may also interact with a cloud coming from the atmosphere of a red giant star (Bosch-Ramon et al., 2012), or come from a star-forming region that passes through the jet.
5 Summary
The blazar CTA 102 is part of a sample of objects in the Ground-based Observational Support of the Fermi Gamma-ray Space Telescope at the University of Arizona monitoring program, which allowed us to analyze its behavior over seven years (). The redshift of this particular object () allows us to access the near-UV region of the spectrum. Therefore, allowing us to analyze the light curves of the Mg II 2798 Å emission line, the UV Fe II band, and the corresponding 3000 Å continuum. The results of this work are summarized as follows:
-
1.
We find a statistically significant flare-like event in the Mg II emission line and the Fe II band. The ratio between the maximum and the minimum of continuum flux for the entire observation period is 17915. The variability in Mg II and Fe II show ratios of 8.110.5 and 34.045.5, respectively. The highest fluxes recorded during the flaring event are at 6.1- and 6.3- of the weighted mean for Mg II and Fe II, respectively. The Mg II line profile in the maximum flux seems to be broader and shifted to the blue (with an apparent blue asymmetry), compared to the Mg II profile in the minimum flux.
-
2.
The highest flux levels in the continuum and emission features coincide with the time when a superluminal moving jet component was crossing a recollimation shock (stationary component). The fact that the Mg II and Fe II flaring events occurred at a time when the continuum was being dominated by non-thermal emission, suggests that the ionization source for the broad-line region material responsible for this emission line event is the jet itself.
-
3.
The luminosities of the Mg II line and the Fe II band do not increase monotonically as the continuum luminosity increases, but rather, there is a luminosity range in which the continuum emission increases while the flux of the emission features oscillates around a constant value. We found the threshold value for continuum emission after which there is a strong and significant correlation between the continuum and the emission features. The threshold lies at and for Mg II and Fe II respectively. Since we concluded that the flaring event in the Mg II and Fe II is jet-related, we can infer that the emission at continuum luminosities higher than the thresholds is dominated by the jet as well.
These results prove that there is a relation between the non-thermal continuum from the jet, and the variability of broad emission lines; suggesting the existence of BLR material at a distance of 25 pc from the central black hole (BH). This jet-excited BLR may also serve as a source of seed photons for high energy production along the jet by means of external inverse Compton, during flaring activity in emission lines.
The Mg II emission line study of Popović et al. (2019) for a representative sample of 284 AGN type 1, found that Mg II is more complex in nature compared to H. It seems to be composed of two components, one virialized, and the other, related to a region of outflows-inflows. The last one contributes to the emission of the Mg II broad line wings. The authors suggest that the width at half the maximum of Mg II can be used to estimate the mass of BH when the virial component is dominant and care should be taken when the Mg II FWHM and/or in the case of strong blue asymmetry. In the most recent study of a sample of 16 extreme variability quasars (EVQs), Yang et al. (2019) showed that the Mg II emission line varies in the same direction than the continuum flux. However, line width (FWHM) is not varying accordingly with continuum flux variations in most sources (see also, Homan et al., 2019). They conclude, that estimating the BH mass via the width of the broad Mg II emission line introduces bias due to luminosity dependence.
The fact that the BLR at a distance of 25 pc from the BH in CTA 102 responds to changes in the non-thermal continuum makes it difficult to estimate the virial mass of BH from a single-epoch (Vestergaard & Peterson, 2006) or by applying the reverberation mapping technique (Blandford & McKee, 1982; Peterson, 1993), for the Mg II emission line (Wang et al., 2009) in the case of our source. These mass estimation methods depend on there being a single source of ionization (the accretion disk) and virial equilibrium of the BLR clouds. These assumptions cannot be fulfilled during episodes of strong activity in CTA 102, therefore, the ionization source of non-thermal emission and the existence of BLR clouds outside the internal parsec introduces uncertainties in the estimates of BH mass. In this regard, the authors suggest that to obtain the BH mass in blazar-type AGN, using single-epoch or reverberation mapping techniques, only spectra where (continuum luminosity dominated by the accretion disk) should be used for the estimations.
References
- Abdo et al. (2009) Abdo, A. A., Ackermann, M., Ajello, M., et al. 2009, Astroparticle Physics, 32, 193, doi: 10.1016/j.astropartphys.2009.08.002
- Alexander (1997) Alexander, T. 1997, in Astrophysics and Space Science Library, Vol. 218, Astronomical Time Series, ed. D. Maoz, A. Sternberg, & E. M. Leibowitz, 163
- Angel & Stockman (1980) Angel, J. R. P., & Stockman, H. S. 1980, ARA&A, 18, 321, doi: 10.1146/annurev.aa.18.090180.001541
- Araudo et al. (2010) Araudo, A. T., Bosch-Ramon, V., & Romero, G. E. 2010, A&A, 522, A97, doi: 10.1051/0004-6361/201014660
- Arnaud (1996) Arnaud, K. A. 1996, Astronomical Society of the Pacific Conference Series, Vol. 101, XSPEC: The First Ten Years, ed. G. H. Jacoby & J. Barnes, 17
- Arshakian et al. (2010) Arshakian, T. G., León-Tavares, J., Lobanov, A. P., et al. 2010, MNRAS, 401, 1231, doi: 10.1111/j.1365-2966.2009.15714.x
- Bachev et al. (2017) Bachev, R., Popov, V., Strigachev, A., et al. 2017, MNRAS, 471, 2216, doi: 10.1093/mnras/stx1818
- Barkov et al. (2012a) Barkov, M. V., Aharonian, F. A., Bogovalov, S. V., Kelner, S. R., & Khangulyan, D. 2012a, ApJ, 749, 119, doi: 10.1088/0004-637X/749/2/119
- Barkov et al. (2010) Barkov, M. V., Aharonian, F. A., & Bosch-Ramon, V. 2010, ApJ, 724, 1517, doi: 10.1088/0004-637X/724/2/1517
- Barkov et al. (2012b) Barkov, M. V., Bosch-Ramon, V., & Aharonian, F. A. 2012b, ApJ, 755, 170, doi: 10.1088/0004-637X/755/2/170
- Barth et al. (2013) Barth, A. J., Pancoast, A., Bennert, V. N., et al. 2013, ApJ, 769, 128, doi: 10.1088/0004-637X/769/2/128
- Blackburn (1995) Blackburn, J. K. 1995, Astronomical Society of the Pacific Conference Series, Vol. 77, FTOOLS: A FITS Data Processing and Analysis Software Package, ed. R. A. Shaw, H. E. Payne, & J. J. E. Hayes, 367
- Blandford & McKee (1982) Blandford, R. D., & McKee, C. F. 1982, ApJ, 255, 419, doi: 10.1086/159843
- Bosch-Ramon et al. (2012) Bosch-Ramon, V., Perucho, M., & Barkov, M. V. 2012, A&A, 539, A69, doi: 10.1051/0004-6361/201118622
- Cackett et al. (2015) Cackett, E. M., Gültekin, K., Bentz, M. C., et al. 2015, ApJ, 810, 86, doi: 10.1088/0004-637X/810/2/86
- Carrasco et al. (2017) Carrasco, L., Hernández Utrera, O., Vázquez, S., et al. 2017, Rev. Mexicana Astron. Astrofis., 53, 497
- Casadio et al. (2015) Casadio, C., Gómez, J. L., Jorstad, S. G., et al. 2015, ApJ, 813, 51, doi: 10.1088/0004-637X/813/1/51
- Casadio et al. (2019) Casadio, C., Marscher, A. P., Jorstad, S. G., et al. 2019, A&A, 622, A158, doi: 10.1051/0004-6361/201834519
- Choi et al. (2007) Choi, E., Wiita, P. J., & Ryu, D. 2007, ApJ, 655, 769, doi: 10.1086/510120
- Clavel et al. (1991) Clavel, J., Reichert, G. A., Alloin, D., et al. 1991, ApJ, 366, 64, doi: 10.1086/169540
- Costamante et al. (2018) Costamante, L., Cutini, S., Tosti, G., Antolini, E., & Tramacere, A. 2018, MNRAS, 477, 4749, doi: 10.1093/mnras/sty887
- Czerny et al. (2019) Czerny, B., Olejak, A., Rałowski, M., et al. 2019, ApJ, 880, 46, doi: 10.3847/1538-4357/ab2913
- D’Ammando et al. (2019) D’Ammando, F., Raiteri, C. M., Villata, M., et al. 2019, MNRAS, 490, 5300, doi: 10.1093/mnras/stz2792
- Elitzur & Shlosman (2006) Elitzur, M., & Shlosman, I. 2006, ApJ, 648, L101, doi: 10.1086/508158
- Finke & Dermer (2010) Finke, J. D., & Dermer, C. D. 2010, ApJ, 714, L303, doi: 10.1088/2041-8205/714/2/L303
- Fromm et al. (2015) Fromm, C. M., Perucho, M., Ros, E., Savolainen, T., & Zensus, J. A. 2015, A&A, 576, A43, doi: 10.1051/0004-6361/201322836
- Fromm et al. (2013a) Fromm, C. M., Ros, E., Perucho, M., et al. 2013a, A&A, 557, A105, doi: 10.1051/0004-6361/201321784
- Fromm et al. (2013b) —. 2013b, A&A, 551, A32, doi: 10.1051/0004-6361/201219913
- Gasparyan et al. (2018) Gasparyan, S., Sahakyan, N., Baghmanyan, V., & Zargaryan, D. 2018, ApJ, 863, 114, doi: 10.3847/1538-4357/aad234
- Greene & Ho (2005) Greene, J. E., & Ho, L. C. 2005, ApJ, 627, 721, doi: 10.1086/430590
- Guo et al. (2019) Guo, H., Shen, Y., He, Z., et al. 2019, arXiv e-prints, arXiv:1907.06669. https://arxiv.org/abs/1907.06669
- Gurwell et al. (2007) Gurwell, M. A., Peck, A. B., Hostler, S. R., Darrah, M. R., & Katz, C. A. 2007, in Astronomical Society of the Pacific Conference Series, Vol. 375, From Z-Machines to ALMA: (Sub)Millimeter Spectroscopy of Galaxies, ed. A. J. Baker, J. Glenn, A. I. Harris, J. G. Mangum, & M. S. Yun, 234
- Harris & Roberts (1960) Harris, D. E., & Roberts, J. A. 1960, PASP, 72, 237, doi: 10.1086/127521
- Homan et al. (2019) Homan, D., Macleod, C. L., Lawrence, A., Ross, N. P., & Bruce, A. 2019, arXiv e-prints, arXiv:1910.11364. https://arxiv.org/abs/1910.11364
- Hubbard & Blackman (2006) Hubbard, A., & Blackman, E. G. 2006, MNRAS, 371, 1717, doi: 10.1111/j.1365-2966.2006.10808.x
- Isler et al. (2013) Isler, J. C., Urry, C. M., Coppi, P., et al. 2013, ApJ, 779, 100, doi: 10.1088/0004-637X/779/2/100
- Jeyakumar (2009) Jeyakumar, S. 2009, Astronomische Nachrichten, 330, 287, doi: 10.1002/asna.200811177
- Jorstad et al. (2005) Jorstad, S. G., Marscher, A. P., Lister, M. L., et al. 2005, AJ, 130, 1418, doi: 10.1086/444593
- Jorstad et al. (2013) Jorstad, S. G., Marscher, A. P., Smith, P. S., et al. 2013, ApJ, 773, 147, doi: 10.1088/0004-637X/773/2/147
- Jorstad et al. (2017) Jorstad, S. G., Marscher, A. P., Morozova, D. A., et al. 2017, ApJ, 846, 98, doi: 10.3847/1538-4357/aa8407
- Kaur & Baliyan (2018) Kaur, N., & Baliyan, K. S. 2018, A&A, 617, A59, doi: 10.1051/0004-6361/201731953
- Khangulyan et al. (2013) Khangulyan, D. V., Barkov, M. V., Bosch-Ramon, V., Aharonian, F. A., & Dorodnitsyn, A. V. 2013, ApJ, 774, 113, doi: 10.1088/0004-637X/774/2/113
- Komissarov (1994) Komissarov, S. S. 1994, MNRAS, 269, 394, doi: 10.1093/mnras/269.2.394
- Larionov et al. (2013) Larionov, V. M., Blinov, D. A., Jorstad, S. G., et al. 2013, in European Physical Journal Web of Conferences, Vol. 61, 04019
- Larionov et al. (2016) Larionov, V. M., Villata, M., Raiteri, C. M., et al. 2016, MNRAS, 461, 3047, doi: 10.1093/mnras/stw1516
- León-Tavares et al. (2010) León-Tavares, J., Lobanov, A. P., Chavushyan, V. H., et al. 2010, ApJ, 715, 355, doi: 10.1088/0004-637X/715/1/355
- León-Tavares et al. (2011) León-Tavares, J., Valtaoja, E., Tornikoski, M., Lähteenmäki, A., & Nieppola, E. 2011, A&A, 532, A146, doi: 10.1051/0004-6361/201116664
- León-Tavares et al. (2013) León-Tavares, J., Chavushyan, V., Patiño-Álvarez, V., et al. 2013, ApJ, 763, L36, doi: 10.1088/2041-8205/763/2/L36
- Li et al. (2018) Li, X., Mohan, P., An, T., et al. 2018, ApJ, 854, 17, doi: 10.3847/1538-4357/aaa5ac
- Moore & Stockman (1981) Moore, R. L., & Stockman, H. S. 1981, ApJ, 243, 60, doi: 10.1086/158567
- Nalewajko et al. (2019) Nalewajko, K., Gupta, A. C., Liao, M., et al. 2019, A&A, 631, A4, doi: 10.1051/0004-6361/201935904
- Netzer (2013) Netzer, H. 2013, The Physics and Evolution of Active Galactic Nuclei (Cambridge University Press), doi: 10.1017/CBO9781139109291
- Nolan et al. (1993) Nolan, P. L., Bertsch, D. L., Fichtel, C. E., et al. 1993, ApJ, 414, 82, doi: 10.1086/173058
- Paltani & Türler (2003) Paltani, S., & Türler, M. 2003, ApJ, 583, 659, doi: 10.1086/345421
- Patiño-Álvarez et al. (2016) Patiño-Álvarez, V. M., Torrealba, J., Chavushyan, V., et al. 2016, Frontiers in Astronomy and Space Sciences, 3, 19, doi: 10.3389/fspas.2016.00019
- Patiño-Álvarez et al. (2018) Patiño-Álvarez, V. M., Fernandes, S., Chavushyan, V., et al. 2018, MNRAS, 479, 2037, doi: 10.1093/mnras/sty1497
- Perez et al. (1989) Perez, E., Penston, M. V., & Moles, M. 1989, MNRAS, 239, 75, doi: 10.1093/mnras/239.1.75
- Peterson (1993) Peterson, B. M. 1993, PASP, 105, 247, doi: 10.1086/133140
- Pica et al. (1988) Pica, A. J., Smith, A. G., Webb, J. R., et al. 1988, AJ, 96, 1215, doi: 10.1086/114875
- Popović et al. (2019) Popović, L. Č., Kovačević-Dojčinović, J., & Marčeta-Mand ić, S. 2019, MNRAS, 484, 3180, doi: 10.1093/mnras/stz157
- Popović et al. (2001) Popović, L. Č., Stanić, N., Kubičela, A., & Bon, E. 2001, A&A, 367, 780, doi: 10.1051/0004-6361:20000500
- Press et al. (2007) Press, W. H., Teukolsky, S. A., Vetterling, W. T., & Flannery, B. P. 2007, Numerical Recipes 3rd Edition: The Art of Scientific Computing, 3rd edn. (Cambridge University Press). https://www.cambridge.org/numericalrecipes
- Prince et al. (2018) Prince, R., Raman, G., Hahn, J., Gupta, N., & Majumdar, P. 2018, ApJ, 866, 16, doi: 10.3847/1538-4357/aadadb
- Raiteri et al. (2017) Raiteri, C. M., Villata, M., Acosta-Pulido, J. A., et al. 2017, Nature, 552, 374, doi: 10.1038/nature24623
- Sandage & Wyndham (1965) Sandage, A., & Wyndham, J. D. 1965, ApJ, 141, 328, doi: 10.1086/148125
- Schmidt (1965) Schmidt, M. 1965, ApJ, 141, 1295, doi: 10.1086/148217
- Shapovalova et al. (2008) Shapovalova, A. I., Popović, L. Č., Collin, S., et al. 2008, A&A, 486, 99, doi: 10.1051/0004-6361:20079111
- Shapovalova et al. (2012) Shapovalova, A. I., Popović, L. Č., Burenkov, A. N., et al. 2012, ApJS, 202, 10, doi: 10.1088/0067-0049/202/1/10
- Shaw et al. (2012) Shaw, M. S., Romani, R. W., Cotter, G., et al. 2012, ApJ, 748, 49, doi: 10.1088/0004-637X/748/1/49
- Shen et al. (2011) Shen, Y., Richards, G. T., Strauss, M. A., et al. 2011, ApJS, 194, 45, doi: 10.1088/0067-0049/194/2/45
- Sholomitskii (1965) Sholomitskii, G. B. 1965, Soviet Ast., 9, 516
- Shukla et al. (2018) Shukla, A., Mannheim, K., Patel, S. R., et al. 2018, ApJ, 854, L26, doi: 10.3847/2041-8213/aaacca
- Smith et al. (2009) Smith, P. S., Montiel, E., Rightley, S., et al. 2009, ArXiv e-prints. https://arxiv.org/abs/0912.3621
- Steffen et al. (1997) Steffen, W., Gómez, J. L., Raga, A. C., & Williams, R. J. R. 1997, ApJ, 491, L73, doi: 10.1086/311066
- Stroh & Falcone (2013) Stroh, M. C., & Falcone, A. D. 2013, ApJS, 207, 28, doi: 10.1088/0067-0049/207/2/28
- Sutherland & Bicknell (2007) Sutherland, R. S., & Bicknell, G. V. 2007, ApJS, 173, 37, doi: 10.1086/520640
- The Fermi-LAT collaboration (2019) The Fermi-LAT collaboration. 2019, arXiv e-prints, arXiv:1902.10045. https://arxiv.org/abs/1902.10045
- Tody (1986) Tody, D. 1986, Society of Photo-Optical Instrumentation Engineers (SPIE) Conference Series, Vol. 627, The IRAF Data Reduction and Analysis System, ed. D. L. Crawford, 733
- Tody (1993) —. 1993, Astronomical Society of the Pacific Conference Series, Vol. 52, IRAF in the Nineties, ed. R. J. Hanisch, R. J. V. Brissenden, & J. Barnes, 173
- Tresse et al. (1999) Tresse, L., Maddox, S., Loveday, J., & Singleton, C. 1999, MNRAS, 310, 262, doi: 10.1046/j.1365-8711.1999.02977.x
- Verner et al. (2003) Verner, E., Bruhweiler, F., Verner, D., Johansson, S., & Gull, T. 2003, ApJ, 592, L59, doi: 10.1086/377571
- Vestergaard & Peterson (2006) Vestergaard, M., & Peterson, B. M. 2006, ApJ, 641, 689, doi: 10.1086/500572
- Vestergaard & Wilkes (2001) Vestergaard, M., & Wilkes, B. J. 2001, ApJS, 134, 1, doi: 10.1086/320357
- Villata et al. (2006) Villata, M., Raiteri, C. M., Balonek, T. J., et al. 2006, A&A, 453, 817, doi: 10.1051/0004-6361:20064817
- Wang et al. (2009) Wang, J.-G., Dong, X.-B., Wang, T.-G., et al. 2009, ApJ, 707, 1334, doi: 10.1088/0004-637X/707/2/1334
- Yang et al. (2019) Yang, Q., Shen, Y., Chen, Y.-C., et al. 2019, arXiv e-prints, arXiv:1904.10912. https://arxiv.org/abs/1904.10912
- Zacharias et al. (2017) Zacharias, M., Böttcher, M., Jankowsky, F., et al. 2017, ApJ, 851, 72, doi: 10.3847/1538-4357/aa9bee
- Zacharias et al. (2019) —. 2019, ApJ, 871, 19, doi: 10.3847/1538-4357/aaf4f7