Lyman Continuum Escape Fraction in Ly Emitters at
Abstract
We measure the LyC escape fraction in 54 faint Lyman Alpha Emitters (LAEs) at in the GOODS-South field. With the average magnitude of AB (, ), these galaxies represent a population of compact young dwarf galaxies. Their properties are likely to resemble those in the galaxies responsible for reionising the Universe at . We do not detect LyC emission in any individual LAEs in the deep HST F336W images, which covers the rest-frame 820Å. We do not detect the LyC emission of these LAEs in the stacked F336W images, either. The upper limit of LyC escape fractions is . However, the high Ly rest-frame equivalent width, low stellar mass and UV luminosity of these LAEs suggest that they should have . The low LyC escape fraction from this work and other stacking analysis suggest that the LyC leaking galaxies with at do not follow the relation between the and UV luminosity and Ly equivalent width (EW) derived from typical galaxies at similar redshift. Therefore, the UV luminosity and Ly equivalent width (EW) are not the best indicators for the LyC escape fraction.
keywords:
cosmology: dark ages, reionisation, first stars – galaxies: high-redshift1 Introduction
The epoch of reionisation is a period when neutral hydrogen in the intergalactic medium (IGM) was ionised by the first generation energetic sources in the Universe. Current observations have relatively well constrained the cosmic reionisation history, which occurred at the redshift of and finished largely by (e.g, Fan et al., 2006a, b; Stark et al., 2011; Schroeder et al., 2013; Schenker et al., 2014; Bian et al., 2015; Bouwens et al., 2015b; Robertson et al., 2013; Planck Collaboration et al., 2016; Bañados et al., 2018; Itoh et al., 2018). However, it is still under debate what are the major sources that reionise the Universe due to the following two main uncertainties: (1) the faint-end luminosity function of star forming galaxies (e.g, Atek et al., 2018; Bouwens et al., 2017) and active galactic nuclei (AGN) (e.g., Giallongo et al., 2015; McGreer et al., 2018; Boutsia et al., 2018; Matsuoka et al., 2018) at high redshift, and (2) Lyman continuum (LyC) escape fraction () in galaxies, the fraction of the ionising photons (<912Å) that can escape from a galaxy to reach the IGM. If star-forming galaxies are the major sources to reionise the Universe, it requires a LyC escape fraction at least at the epoch of reionisation (e.g., Robertson et al., 2013; Naidu et al., 2019), by adopting a typical IGM clumping factor (e.g., Pawlik et al., 2009), galaxy luminosity function at (e.g., Atek et al., 2015; Atek et al., 2018; Bouwens et al., 2015a; Bouwens et al., 2017; Livermore et al., 2017), and LyC photon production efficiency (e.g., Bouwens et al., 2016; Tang et al., 2018; Chevallard et al., 2018).
However, LyC escape fraction can not be directly measured in galaxies beyond due to the high opacity of the IGM to LyC ionising photons (e.g., Vanzella et al., 2018). Thus we have to infer the LyC escape in the galaxies at the epoch of the reioisation based on either directly measuring LyC escape fraction in galaxies at lower redshift or correlating galaxy spatial positions with the Lyman alpha forest at (e.g., Kakiichi et al., 2018). In the last decade, people have conducted extensive studies of LyC escape fraction in galaxies at using a number of different approaches, including the rest-frame ultraviolet spectroscopy (e.g., Leitet et al., 2013; Leitherer et al., 2016; Izotov et al., 2016b; Izotov et al., 2016a; Steidel et al., 2001; Steidel et al., 2018; Shapley et al., 2006; Shapley et al., 2016; Nestor et al., 2013) and narrow/intermediate/broad-band UV imaging (e.g., Siana et al., 2007, 2015; Vanzella et al., 2010, 2016; Nestor et al., 2011; Cooke et al., 2014; Rutkowski et al., 2016, 2017; Vasei et al., 2016; Bian et al., 2017; Japelj et al., 2017; Naidu et al., 2017; Fletcher et al., 2018; Ji et al., 2019). However, accurately measuring the escape fraction remains difficult. Most of these studies yielded null or tentative detection of LyC emission. Furthermore, studies based on ground-based observations suffer from foreground contamination, resulting in overestimating the LyC escape fraction. To date, there are only several convincing detection of LyC emission in galaxies at , including and (Vanzella et al., 2016, 2018), Q1549-C25 (Shapley et al., 2016), A2218-Flanking (Bian et al., 2017), and Sunburst Arc (Rivera-Thorsen et al., 2019). In addition, the LyC escape fraction measured in individual galaxies has large uncertainty due to the opacity variations of the line of sight of IGM and galaxy ISM (Cen & Kimm, 2015). Furthermore, the high LyC escape fraction measured in individual objects is not necessarily representing the LyC escape fraction of typical galaxies at the epoch of reionisaition.
Studies have shown that the high-redshift galaxy luminosity function is steep at the faint end, thus sub- galaxies dominate the UV emission at the epoch of reionisation. It is essential to push the LyC escape fraction measurement to faint galaxies. In this study, we measure the LyC escape fraction in a sample of Ly emitters (LAEs) at with in the GOODS-South field (Dickinson et al., 2003). The redshift of these LAEs have been accurately measured by the MUSE Hubble Ultra-Deep Field (HUDF) survey and the MUSE-Wide survey based on their Ly emission lines (Japelj et al., 2017; Urrutia et al., 2018). Their LyC emission is well covered by the deep HST/WFC3 F336W images from the Hubble Deep UV Legacy Survey (HDUV, Oesch et al., 2018).
Throughout this paper, we use the following cosmological parameters: Hubble constant km s-1 Mpc-1, dark matter density , and dark energy density for a flat universe. All the magnitudes are expressed in the AB magnitude system (Oke & Gunn, 1983).
2 Sample Selection
In this study, we use the deep HST/WFC3 F336W images to measure the LyC escape fraction in a sample of LAEs at in the GOODS-South field. We use the HST/WFC3 F336W imaging data from the HDUV survey Oesch et al. (2018). The HDUV survey is a deep UV imaging legacy survey covering a total of area of about 100 armin2 in the two GOODS fields in F275W and F336W bands. The depths of the F275W and F336W bands are 27.6 and 28.0 (5), respectively. The deep F275W and F336W images from the HDUV survey have been used to study the LyC escape fraction in galaxies at and , respectively (Naidu et al., 2017; Rutkowski et al., 2017; Japelj et al., 2017). In particular, Japelj et al. (2017) studied the LyC escape fraction in a sample of galaxies at selected in 9 arcmin2 MUSE HUDF survey field using the HDUV F336W image and found the relative escape fraction < 0.6 for galaxies with . Here we extend the study to a 44 arcmin2 area using the newly published the MUSE wide survey (Urrutia et al., 2018). The MUSE-Wide survey is an integral filed spectroscopic survey, largely overlaps with the HDUV in the GOODS-South field. Thanks to the VLT/MUSE integral field spectrograph (Bacon et al., 2010), this survey is able to detect galaxies without photometric pre-selection, thus it provides a high complete rate on detecting emission line galaxies. In the MUSE-Wide survey, we select LAEs in the redshift range of . At this redshift range, the HST WFC3/F336W filter cover the Lyman continuum at the wavelength range of 750 to 890Å. In this study, we only use galaxies with redshift quality greater on equal to 2 (Urrutia et al., 2018). The lower limit redshift of corresponds to the Lyman limits at observer-frame 3684 Å. At this wavelength the throughput of the F336W filter is less than 1%, which minimises the contamination of the flux redward of the Lyman limit.
A total of 54 Ly emitting galaxies (LAEs) at the redshift range of are selected in the GOODS-south field with deep HDUV F336W images coverage. Among them, 26 LAEs are selected from the MUSE wide survey (Urrutia et al., 2018)., and 28 LAEs are from the MUSE HUDF survey (Japelj et al., 2017). Their median stellar mass is , and median dust extinction is . These LAEs represent a population of the galaxies with low stellar mass and young stellar population Urrutia et al. (2018).
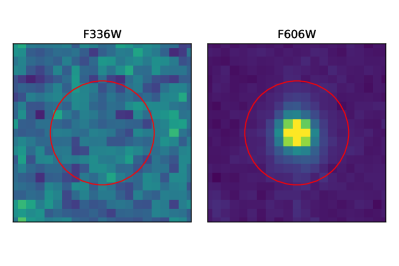
3 The Lyman Continuum Escape Fraction in LAEs at Z=3.1
The HST/WFC3 F336W image covers the LyC emission at the rest-frame wavelength of Å in the LAEs at . None of the 54 Ly emitting galaxies (LAEs) is detected in the F336W image at 3. Therefore, we try to detect and measure the LyC emission by stacking the F336W images. We generate a stamp image in F336W for each individual LAE based on the galaxy coordinate measured in the F606W images. Here we do not use the galaxy coordinate from the MUSE-Wide survey, because there exist small offsets () between the MUSE coordinates and the HST coordinates (Urrutia et al., 2018). The stacked F336W image is generated by combining the F336W stamp images of all 54 LAEs using the mean flux at each pixel (Figure 1). We measure the LyC flux in the F336W stacked image using a diameter aperture and find that LyC flux is not detected at 3 level. The flux upper limit in F336W band is Jy, which corresponds to AB magnitude. We use the flux in the HST/ACS F606W image, which corresponds to the rest-frame wavelength of 1500Å, as an anchor point to estimate the intrinsic LyC emission at 820Å. We use the ACS F606W images from the 3D-HST data release 4.5.1111https://3dhst.research.yale.edu/Data.php (Momcheva et al., 2016). We combine the F606W images for the LAEs following the same procedure used for the F336W images (Figure 1). Then the F606W flux is measured in the final combined F606W images using a diameter aperture. This aperture size is the same as used in the 3D-HST survey (Skelton et al., 2014), which includes a large fraction of the flux from the object and avoid flux from the neighbouring objects. The flux density of the F606W band is Jy. The apparent magnitude in F606W band is AB magnitude, and the absolute magnitude at the rest-frame wavelength of 1500Å is , which corresponds to at (e.g., Bian et al., 2013).
We measure the relative LyC escape fraction :
| (1) |
and absolute LyC escape fraction
| (2) |
where is the observed flux density ratio between 1500Å and 820Å measured in the HST F606W and F336W images. is the intrinsic luminosity density ratio between 1500Å and 820Å. Here, we adopt two values, and , to cover a wide range of possible star formation history (e.g., Siana et al., 2007; Chisholm et al., 2019). is the mean IGM opacity at 820Å at (e.g., Madau, 1995), and is the mean IGM transmission. In this study, we adopt the Inoue et al. (2014) recipe to estimate the mean IGM opacity and find at , corresponding to . represents the total dust extinction at 1500Å, which is estimated from the median extinction at the V-band, , by adopting the Gordon et al. (2003) Small Magellanic Cloud (SMC) dust extinction curve. At last, we find that the 3 upper limit of average LyC escape fractions in this sample of LAEs are and , for and , respectively.
4 Physical Properties of the Lyman-alpha Emitters
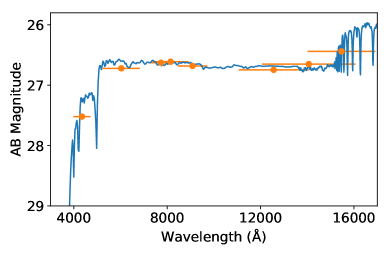
We study the physical properties of the LAEs in this work by fitting their mean spectral energy distribution (SED). We obtain the mean SED by stacking the HST F435W, F606W, F775W, F814W, F850LP, F120W, F140W, and F160W images. All the images are taken from the 3D-HST data release 4.5.1 (Momcheva et al., 2016). The images from each filter are combined by following the same method that is used to combine the F336W band images. The fluxes in each of these bands are measured within an aperture of in diameter. The Fitting and Assessment of Synthetic Templates (FAST) code is used to fit the mean SED (Kriek et al., 2009). We adopt the Bruzual & Charlot (2003) stellar synthesis models with a Chabrier Initial Mass Function (IMF; Chabrier, 2003), an SMC dust extinction curve (Gordon et al., 2003), a 0.2 solar metallicity (Z=0.004), and an exponentially declining star formation history. Figure 2 shows the best fit stellar synthesis model to the mean SED. We find the stellar mass of , the galaxy age of 120 Myr, and the average SFR of 4 yr-1. The average SFR and stellar mass derived from the SED fitting place these galaxies on the galaxy star formation main sequence at (Speagle et al., 2014).
The morphology of the LAEs is compact in the stacked F606W image (Figure 1), corresponding to the rest-frame UV (Å) images. We measure the galaxy size by fitting the stacked F606W image to a Sérsic profile using the GALFIT code (Peng et al., 2010). The angular size of the galaxy effective radius is , corresponding to physical size of kpc. The Sérsic index derived from the fitting is , suggesting an exponential disk-like morphology. The mean galaxy effective radius and mass place these galaxies on the mass-size relation at when extrapolating the relation to low mass end (e.g., van der Wel et al., 2014).
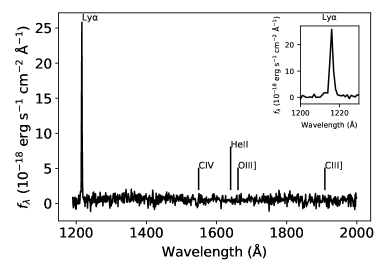
We obtain a composite spectrum of the LAEs by stacking the MUSE spectra. First, we de-redshift each MUSE spectrum to the rest-frame wavelength and re-sample spectrum to rest-frame wavelength from 1180Å to 1950Å with an interval of 1Å. The spectra were combined using the average flux density at each wavelength. Figure 3 shows the composite spectrum of the LAEs. The rest-frame equivalent width of Ly emission is EWÅ. The high Ly EW0 suggests that the ages of these LAEs are young, on the order of a few times years for a constant SFR model (Hashimoto et al., 2017). This is broadly consistent with the SED fitting results. The Ly flux is erg s-1 cm-2, corresponding to a luminosity of erg s-1. The the Ly emission escape fraction is based on the SFR of 4 yr-1 (Kennicutt, 1998; Verhamme et al., 2017).
5 Discussion
5.1 LyC emission and Galaxy Properties
The relations between the LyC escape fraction and galaxy properties have been established by both theoretical and observational studies(e.g., Reddy et al., 2016; Verhamme et al., 2017; Steidel et al., 2018). Galaxies with stronger Ly emission strength, weaker interstellar absorption strength, higher [OIII]/[OII] ratio, higher star formation surface density, lower stellar mass and UV luminosity tend to have higher escape fraction (cf. Bassett et al., 2019; Ji et al., 2019). Such studies help us to better understand the physical mechanism(s) that drives the LyC leaking from a galaxy; extrapolation of such relations to galaxies at higher redshift can be used to predict the LyC escape in galaxies at the epoch of reionisation.
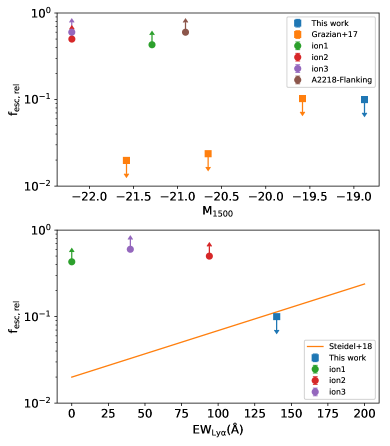
In this study, the galaxies are selected by their strong Ly emission lines. These LAEs show high Ly equivalent width and high Ly escape fraction. Studies have suggested that galaxies with high LyC escape fractions commonly shows strong Ly emission (EW0(LyÅ) and high Ly emission line escape fraction (e.g., Verhamme et al., 2017; Kimm et al., 2019). To our knowledge, the Ly EW0 in the composite spectrum of these LAEs is higher than all of the known LyC-leaking galaxies with (e.g., Verhamme et al., 2017; Vanzella et al., 2016, 2018)(Figure 4). The other properties of the LAEs in this work are also in favour to having high LyC escape fraction, including lower stellar mass and UV luminosity, compared to those individual galaxies with high LyC escape fraction () at the similar redshift range, such as Ion2, Ion3, and A2218-Flank (Figure 4). Based on these properties, these LAEs in this study are expected to have even larger LyC escape fraction . However, the non-detection of LyC emission in the stacked HST F336W image suggests a rather low () LyC escape fraction in these LAEs.
Figure 4 shows the relative LyC escape fraction vs. absolution UV magnitude and Ly EW. The relative LyC escape fraction measured in the individual galaxies have much higher LyC escape fraction measured in the stacked images or spectra. The individual galaxies with high LyC escape fraction do not follow the relation of the LyC escape fraction and the galaxies physical properties derived from the stacking analysis based on typical galaxies. Therefore, their high escape fractions may not represent the typical LyC escape fraction in the galaxies with similar UV luminosity and Ly EW at . It suggests that the UV luminosity and Ly EW may not be the best indicator for the LyC escape fraction, especially for galaxies with high LyC escape fractionn. Actually, it has been found that in some of the cases the Ly EW itself is not a good indicator of LyC escape fraction (e.g., Guaita et al., 2016; Grazian et al., 2017; Ji et al., 2019), because the Ly photons can escape via pure radiative transfer effects even in a relatively high H i column density (e.g., cm-2), which is completely optically thick for the LyC radiation (e.g., Verhamme et al., 2006). Therefore, the detailed Ly profile, such as the separation of the blue and red peaks and leaking of the Ly at systematic redshift, can also provide crucial information on the LyC leaking.
5.2 Systematic Uncertainties of LyC Escape Fraction
Our LyC escape fraction measurement also faces large systematic uncertainties as follows:
1. Galaxy viewing angle: Studies have shown that the LyC photons can only escape from chimneys and holes in the ISM of galaxy caved by the supernovae and other stellar feedbacks (e.g., Heckman et al., 2011). This indicates that the leaking LyC photons can only be detected in a small fraction of the solid angle of galaxies, and the LyC escape fraction measurements highly depends on the viewing angle of the galaxy. It can cause a large uncertainty on the LyC escape fraction based on the measurements in a small sample of galaxies. Cen & Kimm (2015) suggested that it requires to stack at least 100 galaxies to reduce the LyC escape fraction uncertainty down to 20%.
2. IGM transmission: LyC escape fraction measurement also depends on the IGM transmission. Japelj et al. (2017) found that the IGM transmission in F336W band at a random line of sight is . For a sample of 54 galaxies, the uncertainty of the IGM transmission is about 15%.
3. The spatial offset between the LyC and UV light centriods: The stacking strategy relies on the assumption that the LyC emission has the same location as the UV emission at 1500Å. Observations of gravitational lensed system, Sunburst, indicate that the LyC emission only emerges in some of the star-forming knots and varies significantly from one knot to other knots (Vanzella et al., 2019; Rivera-Thorsen et al., 2019). Therefore, the LyC and UV centroid positions are not necessary always well-aligned. The LyC signal will be diluted due to such misalignment during the stacking process, and the LyC escape fraction can be significantly underestimated.
6 Conclusions
In this letter, we study the LyC escape fraction in a sample of LAEs. These LAEs represent a population of compact young dwarfs at . We summarise the main results of this work as follows:
1. A sample of 54 Ly emitters (LAEs) at are selected from the MUSE Hubble Ultra Deep Field (HUDF) and MUSE MUSE-Wide integral field spectroscopic survey in the GOODS-South field based on their prominent Ly emission.
2. We fit stellar synthesis models to the composite SED of these LAEs and find the stellar mass of , the age of 120 Myr, and the SFR of 3.2 yr-1.
3. The galaxy size at the UV wavelength measured in the stacked HST F606W image is 1.2 kpc, and the rest-frame equivalent width of the Ly emission is 142Å, which is measured in the composite MUSE spectra of these LAEs.
4. The LyC emission of these LAEs is not detected at 3 level in the stacked HDUV deep HST F336W image, covering the rest-frame wavelength of 820Å in these LAES. The upper limits of LyC escape fraction are and , for and , respectively.
5. Such low LyC escape fraction of these LAEs suggests that the LyC leaking galaxies at do not follow the relation of LyC escape fraction and galaxy properties, including UV luminosity and Ly EW. It implies that the UV luminosity and Ly EW are not the best properties to predict the LyC escape fraction, particularly for galaxies with high escape fractions.
Acknowledgements
We thank the MUSE GTO, HDUV, and 3D-HST teams to release their data set to public, making this work possible. We thank Dr. J. Japelj to share the detailed information on the LAEs in the MUSE Hubble Ultra Deep Field Survey. We thank the anonymous referee for providing constructive comments and help in improving the manuscript.
References
- Atek et al. (2015) Atek H., et al., 2015, ApJ, 800, 18
- Atek et al. (2018) Atek H., Richard J., Kneib J.-P., Schaerer D., 2018, MNRAS, 479, 5184
- Bañados et al. (2018) Bañados E., et al., 2018, Nature, 553, 473
- Bacon et al. (2010) Bacon R., et al., 2010, in Ground-based and Airborne Instrumentation for Astronomy III. p. 773508, doi:10.1117/12.856027
- Bassett et al. (2019) Bassett R., et al., 2019, MNRAS, 483, 5223
- Bian et al. (2013) Bian F., et al., 2013, ApJ, 774, 28
- Bian et al. (2015) Bian F., et al., 2015, ApJ, 806, 108
- Bian et al. (2017) Bian F., Fan X., McGreer I., Cai Z., Jiang L., 2017, ApJ, 837, L12
- Boutsia et al. (2018) Boutsia K., Grazian A., Giallongo E., Fiore F., Civano F., 2018, ApJ, 869, 20
- Bouwens et al. (2015a) Bouwens R. J., et al., 2015a, ApJ, 803, 34
- Bouwens et al. (2015b) Bouwens R. J., Illingworth G. D., Oesch P. A., Caruana J., Holwerda B., Smit R., Wilkins S., 2015b, ApJ, 811, 140
- Bouwens et al. (2016) Bouwens R. J., Smit R., Labbé I., Franx M., Caruana J., Oesch P., Stefanon M., Rasappu N., 2016, ApJ, 831, 176
- Bouwens et al. (2017) Bouwens R. J., Oesch P. A., Illingworth G. D., Ellis R. S., Stefanon M., 2017, ApJ, 843, 129
- Bruzual & Charlot (2003) Bruzual G., Charlot S., 2003, MNRAS, 344, 1000
- Cen & Kimm (2015) Cen R., Kimm T., 2015, ApJ, 801, L25
- Chabrier (2003) Chabrier G., 2003, PASP, 115, 763
- Chevallard et al. (2018) Chevallard J., et al., 2018, MNRAS, 479, 3264
- Chisholm et al. (2019) Chisholm J., Rigby J. R., Bayliss M., Berg D. A., Dahle H., Gladders M., Sharon K., 2019, ApJ, 882, 182
- Cooke et al. (2014) Cooke J., Ryan-Weber E. V., Garel T., Díaz C. G., 2014, MNRAS, 441, 837
- Dickinson et al. (2003) Dickinson M., Giavalisco M., GOODS Team 2003, in Bender R., Renzini A., eds, The Mass of Galaxies at Low and High Redshift. p. 324 (arXiv:astro-ph/0204213), doi:10.1007/10899892_78
- Fan et al. (2006a) Fan X., Carilli C. L., Keating B., 2006a, ARA&A, 44, 415
- Fan et al. (2006b) Fan X., et al., 2006b, AJ, 132, 117
- Fletcher et al. (2018) Fletcher T. J., Robertson B. E., Nakajima K., Ellis R. S., Stark D. P., Inoue A., 2018, arXiv e-prints,
- Giallongo et al. (2015) Giallongo E., et al., 2015, A&A, 578, A83
- Gordon et al. (2003) Gordon K. D., Clayton G. C., Misselt K. A., Landolt A. U., Wolff M. J., 2003, ApJ, 594, 279
- Grazian et al. (2017) Grazian A., et al., 2017, A&A, 602, A18
- Guaita et al. (2016) Guaita L., et al., 2016, A&A, 587, A133
- Hashimoto et al. (2017) Hashimoto T., et al., 2017, A&A, 608, A10
- Heckman et al. (2011) Heckman T. M., et al., 2011, ApJ, 730, 5
- Inoue et al. (2014) Inoue A. K., Shimizu I., Iwata I., Tanaka M., 2014, MNRAS, 442, 1805
- Itoh et al. (2018) Itoh R., et al., 2018, ApJ, 867, 46
- Izotov et al. (2016a) Izotov Y. I., Schaerer D., Thuan T. X., Worseck G., Guseva N. G., Orlitová I., Verhamme A., 2016a, MNRAS, 461, 3683
- Izotov et al. (2016b) Izotov Y. I., Orlitová I., Schaerer D., Thuan T. X., Verhamme A., Guseva N. G., Worseck G., 2016b, Nature, 529, 178
- Japelj et al. (2017) Japelj J., et al., 2017, MNRAS, 468, 389
- Ji et al. (2019) Ji Z., et al., 2019, arXiv e-prints, p. arXiv:1908.00556
- Kakiichi et al. (2018) Kakiichi K., et al., 2018, MNRAS, 479, 43
- Kennicutt (1998) Kennicutt Jr. R. C., 1998, ARA&A, 36, 189
- Kimm et al. (2019) Kimm T., Blaizot J., Garel T., Michel-Dansac L., Katz H., Rosdahl J., Verhamme A., Haehnelt M., 2019, MNRAS, 486, 2215
- Kriek et al. (2009) Kriek M., van Dokkum P. G., Labbé I., Franx M., Illingworth G. D., Marchesini D., Quadri R. F., 2009, ApJ, 700, 221
- Leitet et al. (2013) Leitet E., Bergvall N., Hayes M., Linné S., Zackrisson E., 2013, A&A, 553, A106
- Leitherer et al. (2016) Leitherer C., Hernandez S., Lee J. C., Oey M. S., 2016, ApJ, 823, 64
- Livermore et al. (2017) Livermore R. C., Finkelstein S. L., Lotz J. M., 2017, ApJ, 835, 113
- Madau (1995) Madau P., 1995, ApJ, 441, 18
- Matsuoka et al. (2018) Matsuoka Y., et al., 2018, ApJ, 869, 150
- McGreer et al. (2018) McGreer I. D., Fan X., Jiang L., Cai Z., 2018, AJ, 155, 131
- Momcheva et al. (2016) Momcheva I. G., et al., 2016, ApJS, 225, 27
- Naidu et al. (2017) Naidu R. P., et al., 2017, ApJ, 847, 12
- Naidu et al. (2019) Naidu R. P., Tacchella S., Mason C. A., Bose S., Oesch P. A., Conroy C., 2019, arXiv e-prints, p. arXiv:1907.13130
- Nestor et al. (2011) Nestor D. B., Shapley A. E., Steidel C. C., Siana B., 2011, ApJ, 736, 18
- Nestor et al. (2013) Nestor D. B., Shapley A. E., Kornei K. A., Steidel C. C., Siana B., 2013, ApJ, 765, 47
- Oesch et al. (2018) Oesch P. A., et al., 2018, ApJS, 237, 12
- Oke & Gunn (1983) Oke J. B., Gunn J. E., 1983, ApJ, 266, 713
- Pawlik et al. (2009) Pawlik A. H., Schaye J., van Scherpenzeel E., 2009, MNRAS, 394, 1812
- Peng et al. (2010) Peng C. Y., Ho L. C., Impey C. D., Rix H.-W., 2010, AJ, 139, 2097
- Planck Collaboration et al. (2016) Planck Collaboration et al., 2016, A&A, 596, A108
- Reddy et al. (2016) Reddy N. A., Steidel C. C., Pettini M., Bogosavljević M., Shapley A. E., 2016, ApJ, 828, 108
- Rivera-Thorsen et al. (2019) Rivera-Thorsen T. E., et al., 2019, arXiv e-prints,
- Robertson et al. (2013) Robertson B. E., et al., 2013, ApJ, 768, 71
- Rutkowski et al. (2016) Rutkowski M. J., et al., 2016, ApJ, 819, 81
- Rutkowski et al. (2017) Rutkowski M. J., et al., 2017, ApJ, 841, L27
- Schenker et al. (2014) Schenker M. A., Ellis R. S., Konidaris N. P., Stark D. P., 2014, ApJ, 795, 20
- Schroeder et al. (2013) Schroeder J., Mesinger A., Haiman Z., 2013, MNRAS, 428, 3058
- Shapley et al. (2006) Shapley A. E., Steidel C. C., Pettini M., Adelberger K. L., Erb D. K., 2006, ApJ, 651, 688
- Shapley et al. (2016) Shapley A. E., Steidel C. C., Strom A. L., Bogosavljević M., Reddy N. A., Siana B., Mostardi R. E., Rudie G. C., 2016, ApJ, 826, L24
- Siana et al. (2007) Siana B., et al., 2007, ApJ, 668, 62
- Siana et al. (2015) Siana B., et al., 2015, ApJ, 804, 17
- Skelton et al. (2014) Skelton R. E., et al., 2014, ApJS, 214, 24
- Speagle et al. (2014) Speagle J. S., Steinhardt C. L., Capak P. L., Silverman J. D., 2014, ApJS, 214, 15
- Stark et al. (2011) Stark D. P., Ellis R. S., Ouchi M., 2011, ApJ, 728, L2
- Steidel et al. (2001) Steidel C. C., Pettini M., Adelberger K. L., 2001, ApJ, 546, 665
- Steidel et al. (2018) Steidel C. C., Bogosavljević M., Shapley A. E., Reddy N. A., Rudie G. C., Pettini M., Trainor R. F., Strom A. L., 2018, ApJ, 869, 123
- Tang et al. (2018) Tang M., Stark D., Chevallard J., Charlot S., 2018, arXiv e-prints, p. arXiv:1809.09637
- Urrutia et al. (2018) Urrutia T., et al., 2018, arXiv e-prints,
- Vanzella et al. (2010) Vanzella E., et al., 2010, ApJ, 725, 1011
- Vanzella et al. (2016) Vanzella E., et al., 2016, ApJ, 825, 41
- Vanzella et al. (2018) Vanzella E., et al., 2018, MNRAS, 476, L15
- Vanzella et al. (2019) Vanzella E., et al., 2019, MNRAS, p. 2218
- Vasei et al. (2016) Vasei K., et al., 2016, ApJ, 831, 38
- Verhamme et al. (2006) Verhamme A., Schaerer D., Maselli A., 2006, A&A, 460, 397
- Verhamme et al. (2017) Verhamme A., Orlitová I., Schaerer D., Izotov Y., Worseck G., Thuan T. X., Guseva N., 2017, A&A, 597, A13
- van der Wel et al. (2014) van der Wel A., et al., 2014, ApJ, 788, 28