\ce^13C^17O suggests gravitational instability in the HL Tau disc
Abstract
We present the first detection of the \ce^13C^17O –2 transition toward the HL Tau protoplanetary disc. We find significantly more gas mass (at least a factor of ten higher) than has been previously reported using \ceC^18O emission. This brings the observed total disc mass to 0.2 M⊙, which we consider to be a conservative lower limit. Our analysis of the Toomre profile suggests that this brings the disc into the regime of gravitational instability. The radial region of instability (50–110 au) coincides with the location of a proposed planet-carved gap in the dust disc, and a spiral in the gas. We therefore propose that if the origin of the gap is confirmed to be due to a forming giant planet, then it is likely to have formed via the gravitational fragmentation of the protoplanetary disc.
keywords:
stars: pre-main-sequence, individual: HL Tau – protoplanetary discs – techniques: interferometric – submillimetre: planetary systems1 Introduction
The early phases of protoplanetary disc evolution set the initial conditions for planet formation. There is increasing evidence that the processes that lead to planet formation happen quickly (e.g. the growth of dust grains; Harsono et al., 2018), and there is now evidence for fully-assembled protoplanetary systems in young discs (1 Myr; Clarke et al., 2018; Flagg et al., 2019). Characterising the properties of these discs in detail is essential if we are to understand the early evolution of young stars and systems of planets.
HL Tau is located in the nearby (140 pc) Taurus-Auriga star forming region (Rebull et al., 2004). Analysis of optical spectra classifies HL Tau as spectral type K5 (White & Hillenbrand, 2004), and spectral energy distribution (SED) modelling shows it to be a Class I–II protostar surrounded by both a circumstellar disc and envelope (Robitaille et al., 2007). The estimated visual extinction toward HL Tau is large, with (Close et al., 1997). It also appears to be accreting at a high rate ( M⊙ yr-1, Beck et al. 2010). This observational evidence makes HL Tau an example of an embedded, disc-hosting star with a young age ( Myr, Briceño et al., 2002).
HL Tau has therefore become a prime target for studies aiming to characterise young discs (Greaves et al., 2008; Carrasco-González et al., 2009). In particular, HL Tau was the first circumstellar disc observed with the long baselines of Atacama Large Millimetre/sub-millimetre Array (ALMA). This revealed an ordered series of concentric rings and gaps in the disc across multiple millimetre wavelengths (2.9 mm, 1.3 mm, 0.9 mm; ALMA Partnership et al., 2015). Many theories have been put forward to explain the origin of these structures (e.g. Zhang et al., 2015; Okuzumi et al., 2016), but one of the most persistent involves the growth of planets within the disc (Dipierro et al., 2015b). While efforts to detect thermal emission from young planets in the gaps have resulted in non-detections, the corresponding upper limits on their masses still lie at the higher end of the giant planet regime (10–15 MJup; Testi et al., 2015).
The combination of the potential for massive planets at large radii, coupled with evidence of a high disc mass (0.1–0.13 M⊙; Guilloteau et al., 2011; Kwon et al., 2011) has seen gravitational instability (GI; Boss 1997) being invoked to explain both the observed dust structures in HL Tau (Akiyama et al., 2016; Takahashi & Inutsuka, 2016), along with the origin of any planetary companions (Nero & Bjorkman, 2009). However, recent measurements of the gas mass in the HL Tau disc using \ceC^18O have shown appears to be too low for GI to occur (– M⊙; Wu et al., 2018).
In this Letter we present a detection of the \ce^13C^17O –2 transition toward the disc around HL Tau. We have demonstrated this line to be a robust tracer of disc gas mass (Booth et al., 2019). We use these data to derive a lower limit to the total gas disc mass and discuss how this impacts the gravitational stability of the HL Tau star-disc system.
2 Observations
HL Tau was observed by ALMA in Band 7 on the 24th of November 2017 for 1.46 hours with 49 antennae in configuration C43-8 under project code 2017.1.01178.S (P.I. E. Humphreys). Baseline lengths ranged from 92–8547 m, and the spectral window (SPW) covering the \ce^13C^17O –2 transition (321.852 GHz) had a native spectral resolution of 0.908 km s -1 (which we note does not resolve the –2 hyperfine structure).
Data (self-)calibration and imaging were performed with CASA version 5.1.1 (McMullin et al., 2007). Continuum subtraction was performed in the -plane using a constant baseline (fitorder 0). Line imaging was performed with the clean algorithm, using a Keplerian mask with the measured position and inclination angles of the disc (e.g. ° and °; ALMA Partnership et al., 2015). The native resolution of the data resulted in a natural beam size of 014 011 (°). We used a 02 -taper, which was found to maximise the signal-to-noise (S/N) of the line emission, resulting in a final beamsize of 028 024 (°). The emission is detected across 9 (1.0 km s -1) channels with a rms of 4 mJy beam-1 per channel measure from the line-free channels and a peak line emission of 30 mJy beam-1 per channel (S/N of 7.5).
3 Results
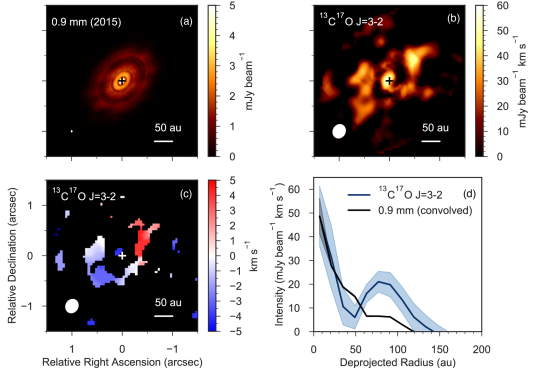
Figure 1 shows the ALMA Science Verification Band 7 (345 GHz) continuum image alongside our \ce^13C^17O –2 Keplerian-masked integrated intensity (zeroth moment) map and the \ce^13C^17O –2 intensity-weighted velocity (first moment) map made with a 2.5 clip. Also shown are the de-projected and azimuthally averaged \ce^13C^17O –2 integrated intensity and 0.9 mm continuum profiles derived from our dataset, binned to the same radial resolution.
The \ce^13C^17O emission is detected out to approximately 140 au from the central star, with a velocity pattern that consistent with observations of other gas tracers (e.g. ALMA Partnership et al., 2015). There appears to be a deficit of emission (seen in both the integrated intensity map and radial emission profile) at approximately 50 au. This feature is not coincident with any substructure in the dust continuum or molecular gas (e.g. CO, \ceHCO^+; Yen et al., 2016) observed at higher spatial resolution than our data. Multi-wavelength continuum observations have shown that the optical depth of the HL Tau disc at frequencies comparable to the \ce^13C^17O –2 transition (330 GHz) is high, with between 40–50 au (Carrasco-González et al., 2019). This deficit of emission is therefore likely due to the high continuum opacity at Band 7 obscuring the line emission originating from the midplane, rather than a bona-fide gap in the disc. The central peaking of the \ce^13C^17O profile may indicate that the line emission at radii au becomes optically thick at a higher height in the disc atmosphere than the dust at this frequency. Beyond approximately 70 au, the intensity profile follows the expected radially-decreasing power law trend.
4 Analysis
4.1 Conversion of line flux to disc gas mass
We use the \ce^13C^17O observations in order to indirectly measure the total gas mass of the disc. In our previous study of the HD 163296 disc we performed 2D radiative transfer models of multiple \ceCO isotopologues and transitions using a well tested 2D physical structure (Booth et al., 2019). Many molecular line observations toward HL Tau are significantly affected by absorption and complex velocity gradients from the surrounding cloud (see, e.g., ALMA Partnership et al., 2015; Yen et al., 2019), meaning a similar wealth of observational data is not readily available. We therefore employ a simpler method of analysis.
The HL Tau mm-dust surface density distribution has been shown to follow a power-law distribution:
| (1) |
with,
| (2) |
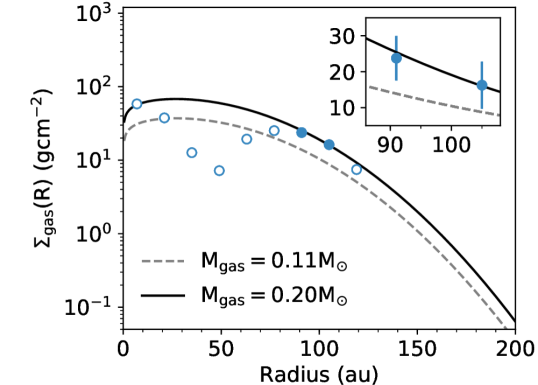
where the total disc mass is (assuming a gas-to-dust mass ratio of 100), is 80 au, is 8.78 au and is -0.20 (Kwon et al., 2015). This model is shown in Figure 2 as the grey dashed line. Although the observed emissivity profiles of the millimetre and centimetre sized dust are more complex, the above profile has been shown to be consistent with these (Pinte et al., 2016) and there is no evidence that these features are also present in the bulk gas distribution. We therefore utilise this profile in our analysis.
A range of midplane temperature profiles exist for the HL Tau disc (e.g. Kwon et al., 2015; Zhang et al., 2015; Okuzumi et al., 2016; Carrasco-González et al., 2019). The model from Kwon et al. (2015) is consistent with a for au. While this is colder than other temperature structures (e.g. Zhang et al., 2015), warmer models have no CO snowline ( K) within the radial extent of the disc. This is in tension with recent observations of a chemical tracer of the CO snowline, \ceN_2H^+, which has been detected in the HL Tau disc (C. Qi, priv. comm.). We therefore utilise the above temperature structure, which places the midplane CO snowline at approximately 50 au.
We convert the observed integrated line intensity of \ce^13C^17O to a column density of \ce^13C^17O under the assumption of both local thermodynamic equilibrium (LTE) and optically thin line emission. For each point in the radial profile we calculate
| (3) |
where is the integrated line intensity in , and are the semi-major and semi-minor axes of the synthesized beam in arcseconds, is the excitation temperature in K, and is the rest frequency of the transition in GHz (Remijan et al., 2003). The partition function (), upper energy level (, in K), and the temperature-independent transition strength and dipole moment (, in debye2) are taken from the CDMS database (Müller et al., 2005).
Since the innermost regions of the \ce^13C^17O emission are affected by continuum absorption, we concentrate our efforts toward reproducing the level of emission between 90–110 au. As this radial location is beyond the model midplane CO snowline, any emission will be tracing CO gas from the molecular layer down to the CO snow surface (see Miotello et al., 2014). We therefore adopt K for the excitation temperature in this region (see Akiyama et al., 2012), but note that a range of values for this parameter (20–80 K) result in values of column density that are well within the observed error in the integrated intensity profile.
To convert from \ce^13C^17O to \ce^12C^16O we assume isotope ratios consistent with the ISM, , , and (Wilson, 1999). We then extrapolate to a \ceH_2 column density assuming a moderately-depleted disc averaged (\ce^12C^16O)/(\ceH_2) ratio of . A total gas density is then calculated assuming 80% of the gas mass lies in \ceH_2 (e.g Rosenfeld et al., 2013).
Based on the above, we find that an increase in the total disc gas mass to M⊙ is required to match the observations between 90–110 au (where errors are propagated from the observed radial intensity profile). The resulting curve is shown in Figure 2 alongside our gas surface density values derived from the radial intensity profile of \ce^13C^17O.
4.2 Assumptions influencing the derived gas mass
The conversion of line flux to gas mass depends on several assumptions, which we discuss here. Our derived gas mass is sensitive to the chosen conversion factor between CO and \ceH_2 (see Bergin & Williams, 2018, for a review). While this factor is often taken to be 10-4, studies of individual protoplanetary discs have revealed carbon depletion from factors of five to orders of magnitude (e.g. McClure et al., 2016), and surveys have demonstrated this phenomenon is widespread (e.g. Miotello et al., 2017). Our chosen value of (\ce^12C^16O(\ceH_2 therefore accounts for a modest depletion factor of two, in agreement with disc chemical models at ages of 1 Myr (Schwarz et al., 2018; Bosman et al., 2018)111Though we note depletion factors depend on variables such as temperature and ionisation rate.. The derived disc gas mass scales linearly with the inverse of the depletion factor, so under the assumption of no carbon depletion (e.g. 10-4), our derived disc mass would be half our quoted value.
We have also assumed that our observations trace the full column of CO on both the ‘near’ and ‘far’ sides of the disc. This will not be the case if ) there is a significant fraction of CO frozen out in the disc midplane, or if the \ce^13C^17O –2 emission is optically thick. In addition (as discussed in Section 3), Carrasco-González et al. (2019) have determined that the continuum optical depth in the disc is high, with at 330 GHz. Therefore, our observations are not sensitive to CO emitting on the far side of the disc. In this scenario, the true gas mass in the disc would be (at least) a factor of two higher.
Observations of \ceCO rovibrational lines toward the HL Tau envelope have revealed a significantly higher n(\ce^12C^16O)/n(\ce^12C^18O) ratio of , which is consistent with isotope-selective photo-dissociation and self-shielding (Visser et al., 2009; Smith et al., 2015). But, as these higher energy infrared transitions do not trace the same reservoir of CO probed in our sub-mm observations, we adopted the ISM values. If the higher ratio applies, then a higher column of CO would be required to match our observations, increasing our derived gas mass (though by factors lower than the above examples).
The precise magnitude of these effects cannot be determined without dedicated modelling of the HL Tau disc. Nevertheless, we believe our estimates for these factors imply that our derived gas mass is a conservative lower limit. Future high spatial and spectral resolution observations of multiple CO isotopologues toward HL Tau will enable us to place more stringent constraints on the gas mass in the disc.
5 Discussion
5.1 Comparison to other mass measurements
Tapia et al. (2019) use combined dust and gas evolutionary disc models to reproduce ALMA and VLA continuum profiles of the HL Tau disc from to 0.87–7.8 mm. Their best fitting model possesses a dust mass of M⊙ with a gas-to-dust mass ratio of 50, resulting in a disc gas mass of 0.23 M⊙. Our result from \ce^13C^17O therefore brings mass measurements from dust continuum and molecular line emission into agreement for the first time in this disc.
Wu et al. (2018) use \ceC^18O –1 SMA observations of HL Tau to derive a total disc gas mass of 2– M⊙, which is between a factor of 50–1000 smaller than the gas mass implied by our results. However, the above work adopts a CO/\ceH_2 ratio of , which assumes no C depletion, and that all potential volatile carbon in the disk is the form of CO (given an ISM C/H ratio of ; Cardelli et al. 1996). If we adopt the same ratio as Wu et al. (2018), our resulting gas mass would be 0.04 M⊙, which is still a factor of 10–200 higher than the gas mass derived from \ceC^18O.
Using Equation 3 we can compare the values for N(\ce^13C^17O) and N(\ce^12C^18O). A column density ratio of 250 would imply that both lines are optically thin. However, using our data and the data from the radial profile presented in (Wu et al., 2018) for a radius of 100 au, we find that the ratio is only . This demonstrates that the \ceC^18O –1 emission is optically thick in the HL Tau disc, and is therefore not tracing the bulk gas mass in the molecular layer (as also found for HD 163296; Booth et al., 2019).
5.2 The (in)stability of the disc
The gravitational stability of the higher mass disc can be assessed using the Toomre parameter (Toomre, 1964),
| (4) |
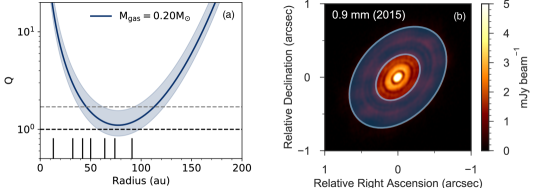
where is the sound speed of the gas (calculated from Tmid), is the surface density of the gas and dust, and is the epicyclic frequency (equal to the angular velocity in a Keplerian disc where we assume a central star mass of 1.7 M⊙, Pinte et al. 2016). The resulting radial profile of is shown in Figure 3a.
Regions of the disc with will be susceptible to gravitational instability (Durisen et al., 2007; Helled et al., 2014), leading to non-axisymmetric structure in the disc and potentially fragmentation. Our observations therefore support a picture in which the disc around HL Tau is gravitationally unstable () from approximately 50–110 au (with minimum at au). Taking into account observational uncertainties, it is also possible that between 60–100 au.
If the disc around HL Tau is threaded by a magnetic field, then this may offer an additional mechanism to support the disc against self-gravity. In these cases, is modified by a factor (where is the plasma parameter) and the threshold for instability lies within the range –1.4 (Kim & Ostriker, 2001). In general, values of range from 10 under ideal MHD conditions (Forgan et al., 2017) up to 104 for non-ideal MHD (Hasegawa et al., 2017). Such values do not alter our minimum Toomre value by more than 5 per cent, suggesting that even if the HL Tau disc possesses a strong magnetic field (), it would not be sufficient to move the disc into a stable regime.
5.3 The region of instability in context
Figure 3b shows the region of instability in the HL Tau disc with respect to the Band 7 (0.9 mm) continuum observations of ALMA Partnership et al. (2015). The unstable region spans several of the bright rings and dark gaps identified in the dust disc (B3–B7 and D4–D7). Modelling of unstable discs with a decoupled dust component shows grains concentrating in spiral arms (e.g. Rice et al., 2004; Dipierro et al., 2015a). Therefore it is not immediately clear how to reconcile such an apparently unstable disc with the ordered concentric rings observed in the dust.
Several studies have shown that the ‘double gap’ feature from 65–74 au (D5–B5–D6) can be reproduced by the presence of a planet with mass between 0.2–0.6 MJup (Dipierro et al., 2015b; Jin et al., 2016; Dong et al., 2018), which is supported by mm–cm observations across this radial region (Carrasco-González et al., 2019). The higher gas surface density revealed by our observations implies that mm-sized grains would be better coupled to gas than in the above works. Therefore, larger planet masses would be required to match the observed dust structures. When considering the lower bound of our observational errors, we find from 60–100 au. Here the local cooling time is expected to be short (e.g. Rafikov, 2005; Clarke & Lodato, 2009), meaning that this region of the disc would undergo gravitational fragmentation. This scenario is in agreement with dedicated modelling of star-disc systems with similar properties as HL Tau, which form fragments with masses between 1-5 MJup (Boss, 2011). Therefore, if such a planet is confirmed to be the origin of this observed gap structure, then we suggest it has likely formed via gravitational fragmentation.
Recently, Yen et al. (2019) detected a spiral feature in observations of \ceHCO^+ –2 toward HL Tau. While they attribute the spiral to in-falling material from the surrounding envelope, this feature crosses our region of instability in the disc. Chemical models of gravitationally unstable discs have predicted \ceHCO^+ to be a tracer of spiral structure (Ilee et al., 2011; Douglas et al., 2013). In light of this, we suggest that the spiral structure on small (100 au) scales could be due to gravitational instability within the disc.
6 Conclusions
We have presented the first detection of \ce^13C^17O in the HL Tau disc, revealing a significant reservoir of previously hidden gas mass. The total disc mass is now sufficient for the disc to be considered gravitationally unstable between 50–110 au. This region crosses a spiral feature observed in the gas, and a proposed planet-carved gap in the dust continuum. We suggest that if a massive planet is confirmed to be the origin of this gap, then it likely formed via gravitational fragmentation of the protoplanetary disc.
This work represents only the second detection of \ce^13C^17O in a protoplanetary disc. It further demonstrates the utility of rare CO isotopologues in probing the physical conditions in discs, with important implications for their evolution and the formation of planets within them.
Acknowledgements
We would like to thank Catherine Walsh, Duncan Forgan, Ken Rice, Cathie Clarke & Charlie Qi for extremely helpful discussions during the preparation of this manuscript. We also thank the anonymous referee for a constructive report. A.B. acknowledges the studentship funded by the Science and Technology Facilities Council of the United Kingdom (STFC) and J.D.I. acknowledges support from the STFC under ST/ R000549/1. This paper makes use of the following ALMA data: ADS/JAO.ALMA#2011.0.00015.SV, ADS/JAO.ALMA#2017.1.01178.S. ALMA is a partnership of ESO (representing its member states), NSF (USA) and NINS (Japan), together with NRC (Canada), MOST and ASIAA (Taiwan), and KASI (Republic of Korea), in cooperation with the Republic of Chile. The Joint ALMA Observatory is operated by ESO, AUI/NRAO and NAOJ.
References
- ALMA Partnership et al. (2015) ALMA Partnership et al., 2015, ApJ, 808, L3
- Akiyama et al. (2012) Akiyama E., Momose M., Hayashi H., Kitamura Y., 2012, arXiv e-prints, p. arXiv:1205.6573
- Akiyama et al. (2016) Akiyama E., Hasegawa Y., Hayashi M., Iguchi S., 2016, ApJ, 818, 158
- Beck et al. (2010) Beck T. L., Bary J. S., McGregor P. J., 2010, ApJ, 722, 1360
- Bergin & Williams (2018) Bergin E. A., Williams J. P., 2018, arXiv e-prints, p. arXiv:1807.09631
- Booth et al. (2019) Booth A. S., Walsh C., Ilee J. D., Notsu S., Qi C., Nomura H., Akiyama E., 2019, The Astrophysical Journal, 882, L31
- Bosman et al. (2018) Bosman A. D., Walsh C., van Dishoeck E. F., 2018, A&A, 618, A182
- Boss (1997) Boss A. P., 1997, Science, 276, 1836
- Boss (2011) Boss A. P., 2011, ApJ, 731, 74
- Briceño et al. (2002) Briceño C., Luhman K. L., Hartmann L., Stauffer J. R., Kirkpatrick J. D., 2002, ApJ, 580, 317
- Cardelli et al. (1996) Cardelli J. A., Meyer D. M., Jura M., Savage B. D., 1996, ApJ, 467, 334
- Carrasco-González et al. (2009) Carrasco-González C., Rodríguez L. F., Anglada G., Curiel S., 2009, ApJ, 693, L86
- Carrasco-González et al. (2019) Carrasco-González C., et al., 2019, ApJ, 883, 71
- Clarke & Lodato (2009) Clarke C. J., Lodato G., 2009, MNRAS, 398, L6
- Clarke et al. (2018) Clarke C. J., et al., 2018, ApJ, 866, L6
- Close et al. (1997) Close L. M., Roddier F., J. Northcott M., Roddier C., Elon Graves J., 1997, ApJ, 478, 766
- Dipierro et al. (2015a) Dipierro G., Pinilla P., Lodato G., Testi L., 2015a, MNRAS, 451, 974
- Dipierro et al. (2015b) Dipierro G., Price D., Laibe G., Hirsh K., Cerioli A., Lodato G., 2015b, MNRAS, 453, L73
- Dong et al. (2018) Dong R., Li S., Chiang E., Li H., 2018, ApJ, 866, 110
- Douglas et al. (2013) Douglas T. A., Caselli P., Ilee J. D., Boley A. C., Hartquist T. W., Durisen R. H., Rawlings J. M. C., 2013, MNRAS, 433, 2064
- Durisen et al. (2007) Durisen R. H., Boss A. P., Mayer L., Nelson A. F., Quinn T., Rice W. K. M., 2007, Protostars and Planets V, pp 607–622
- Flagg et al. (2019) Flagg L., Johns-Krull C. M., Nofi L., Llama J., Prato L., Sullivan K., Jaffe D. T., Mace G., 2019, ApJ, 878, L37
- Forgan et al. (2017) Forgan D., Price D. J., Bonnell I., 2017, MNRAS, 466, 3406
- Greaves et al. (2008) Greaves J. S., Richards A. M. S., Rice W. K. M., Muxlow T. W. B., 2008, MNRAS, 391, L74
- Guilloteau et al. (2011) Guilloteau S., Dutrey A., Piétu V., Boehler Y., 2011, A&A, 529, A105
- Harsono et al. (2018) Harsono D., Bjerkeli P., van der Wiel M. H. D., Ramsey J. P., Maud L. T., Kristensen L. E., Jørgensen J. K., 2018, Nature Astronomy, 2, 646
- Hasegawa et al. (2017) Hasegawa Y., Okuzumi S., Flock M., Turner N. J., 2017, ApJ, 845, 31
- Helled et al. (2014) Helled R., et al., 2014, in Beuther H., Klessen R. S., Dullemond C. P., Henning T., eds, Protostars and Planets VI. p. 643 (arXiv:1311.1142), doi:10.2458/azu_uapress_9780816531240-ch028
- Ilee et al. (2011) Ilee J. D., Boley A. C., Caselli P., Durisen R. H., Hartquist T. W., Rawlings J. M. C., 2011, MNRAS, 417, 2950
- Jin et al. (2016) Jin S., Li S., Isella A., Li H., Ji J., 2016, ApJ, 818, 76
- Kim & Ostriker (2001) Kim W.-T., Ostriker E. C., 2001, ApJ, 559, 70
- Kwon et al. (2011) Kwon W., Looney L. W., Mundy L. G., 2011, ApJ, 741, 3
- Kwon et al. (2015) Kwon W., Looney L. W., Mundy L. G., Welch W. J., 2015, ApJ, 808, 102
- McClure et al. (2016) McClure M. K., et al., 2016, ApJ, 831, 167
- McMullin et al. (2007) McMullin J. P., Waters B., Schiebel D., Young W., Golap K., 2007, in Shaw R. A., Hill F., Bell D. J., eds, Astronomical Society of the Pacific Conference Series Vol. 376, Astronomical Data Analysis Software and Systems XVI. p. 127
- Miotello et al. (2014) Miotello A., Bruderer S., van Dishoeck E. F., 2014, A&A, 572, A96
- Miotello et al. (2017) Miotello A., et al., 2017, A&A, 599, A113
- Müller et al. (2005) Müller H. S. P., Schlöder F., Stutzki J., Winnewisser G., 2005, JMoSt, 742, 215
- Nero & Bjorkman (2009) Nero D., Bjorkman J. E., 2009, ApJ, 702, L163
- Okuzumi et al. (2016) Okuzumi S., Momose M., Sirono S.-i., Kobayashi H., Tanaka H., 2016, ApJ, 821, 82
- Pinte et al. (2016) Pinte C., Dent W. R. F., Ménard F., Hales A., Hill T., Cortes P., de Gregorio-Monsalvo I., 2016, ApJ, 816, 25
- Rafikov (2005) Rafikov R. R., 2005, ApJ, 621, L69
- Rebull et al. (2004) Rebull L. M., Wolff S. C., Strom S. E., 2004, AJ, 127, 1029
- Remijan et al. (2003) Remijan A., Snyder L. E., Friedel D. N., Liu S. Y., Shah R. Y., 2003, ApJ, 590, 314
- Rice et al. (2004) Rice W. K. M., Lodato G., Pringle J. E., Armitage P. J., Bonnell I. A., 2004, MNRAS, 355, 543
- Robitaille et al. (2007) Robitaille T. P., Whitney B. A., Indebetouw R., Wood K., 2007, ApJS, 169, 328
- Rosenfeld et al. (2013) Rosenfeld K. A., Andrews S. M., Hughes A. M., Wilner D. J., Qi C., 2013, ApJ, 774, 16
- Schwarz et al. (2018) Schwarz K. R., Bergin E. A., Cleeves L. I., Zhang K., Öberg K. I., Blake G. A., Anderson D., 2018, The Astrophysical Journal, 856, 85
- Smith et al. (2015) Smith R. L., Pontoppidan K. M., Young E. D., Morris M. R., 2015, ApJ, 813, 120
- Takahashi & Inutsuka (2016) Takahashi S. Z., Inutsuka S.-i., 2016, AJ, 152, 184
- Tapia et al. (2019) Tapia C., Lizano S., Sierra A., Carrasco-González C., Bayona-Bobadilla E., 2019, arXiv e-prints, p. arXiv:1911.05108
- Testi et al. (2015) Testi L., et al., 2015, ApJ, 812, L38
- Toomre (1964) Toomre A., 1964, ApJ, 139, 1217
- Visser et al. (2009) Visser R., van Dishoeck E. F., Black J. H., 2009, A&A, 503, 323
- White & Hillenbrand (2004) White R. J., Hillenbrand L. A., 2004, ApJ, 616, 998
- Wilson (1999) Wilson T. L., 1999, Reports on Progress in Physics, 62, 143
- Wu et al. (2018) Wu C.-J., Hirano N., Takakuwa S., Yen H.-W., Aso Y., 2018, ApJ, 869, 59
- Yen et al. (2016) Yen H.-W., Liu H. B., Gu P.-G., Hirano N., Lee C.-F., Puspitaningrum E., Takakuwa S., 2016, ApJ, 820, L25
- Yen et al. (2019) Yen H.-W., Gu P.-G., Hirano N., Koch P. M., Lee C.-F., Liu H. B., Takakuwa S., 2019, ApJ, 880, 69
- Zhang et al. (2015) Zhang K., Blake G. A., Bergin E. A., 2015, ApJ, 806, L7