Helimagnetic Structure and Heavy-Fermion-Like Behavior
in the Vicinity of the Quantum Critical Point in Mn3P
Abstract
Antiferromagnet Mn3P with Neel temperature K is composed of Mn-tetrahedrons and zigzag chains formed by three inequivalent Mn sites. Due to the nearly frustrated lattice with many short Mn-Mn bonds, competition of the exchange interactions is expected. We here investigate the magnetic structure and physical properties including pressure effect in single crystals of this material, and reveal a complex yet well-ordered helimagnetic structure. The itinerant character of this materials is strong, and the ordered state with small magnetic moments is easily suppressed under pressure, exhibiting a quantum critical point at GPa. The remarkable mass renormalization, even in the ordered state, and an incoherent-coherent crossover in the low-temperature region, characterize an unusual electronic state in Mn3P, which is most likely effected by the underlying frustration effect.
The properties of interacting conduction electrons deviate from those of free electrons. Such interactions often result in renormalization of the electron mass, which is the essence in strongly correlated electron systems. They are generally remarkable near an instability, such as itinerant-localized crossover like the Kondo effect, the proximity of a Mott insulator, and criticality of some degrees of freedom. Rich physics has been developed in such backgrounds including their interplay, and quantum criticality has been enthusiastically investigated for its ability to induce peculiar behaviors of electrons Lohneysen ; Gegenwart ; Shibauchi ; Furukawa .
Magnetic frustration is also an important factor to induce a wide variety of physical phenomena. It can arise from geometrical constraint, or competition of various short-range exchange interactions. The effect is generally not well-established in itinerant magnetic systems, because it is thought to be weakened by long-range interactions. In itinerant systems, an aspect brought by competition of exchange interactions is a stabilization of helical magnetic structure, as has long been discussed in systems such as MnP-type materials Takeuchi ; Kallel ; Dobrzynski ; Yano . Additionally, in such systems, the Dzyaloshinsky-–Moriya (DM) interaction is often effective. It is also short-range exchange interaction, and contribution to the detailed helical structure has been suggested in MnP Yamazaki . The competing exchange interactions and the DM interaction are characterized by crystal symmetry, general to many materials, and are the key inducers of rich and intriguing phenomena Shiomi ; Nakatsuji_Mn3Sn ; Kurumaji . However, their role in the itinerant regime is poorly understood and remains an intriguing issue. Particularly, an interplay of the frustration and quantum phase transition has not been sufficiently explored in -electron systems.
Expecting a remarkable frustration effect and an induced quantum phase transition, we spotlighted Mn3P, whose properties have not been investigated sufficiently so far. An earlier study of polycrystalline samples had suggested an antiferromagnetic (AF) transition at K Gambino , but a recent report has corrected this result to K Liu . In a latter paper, the Mössbauer spectroscopy and neutron diffraction measurements on slightly Fe-substituted samples suggested an ordered moment below 1 , indicating a remarkable itineracy of the Mn 3 electrons. However, the details of the magnetic structure are unknown Liu .
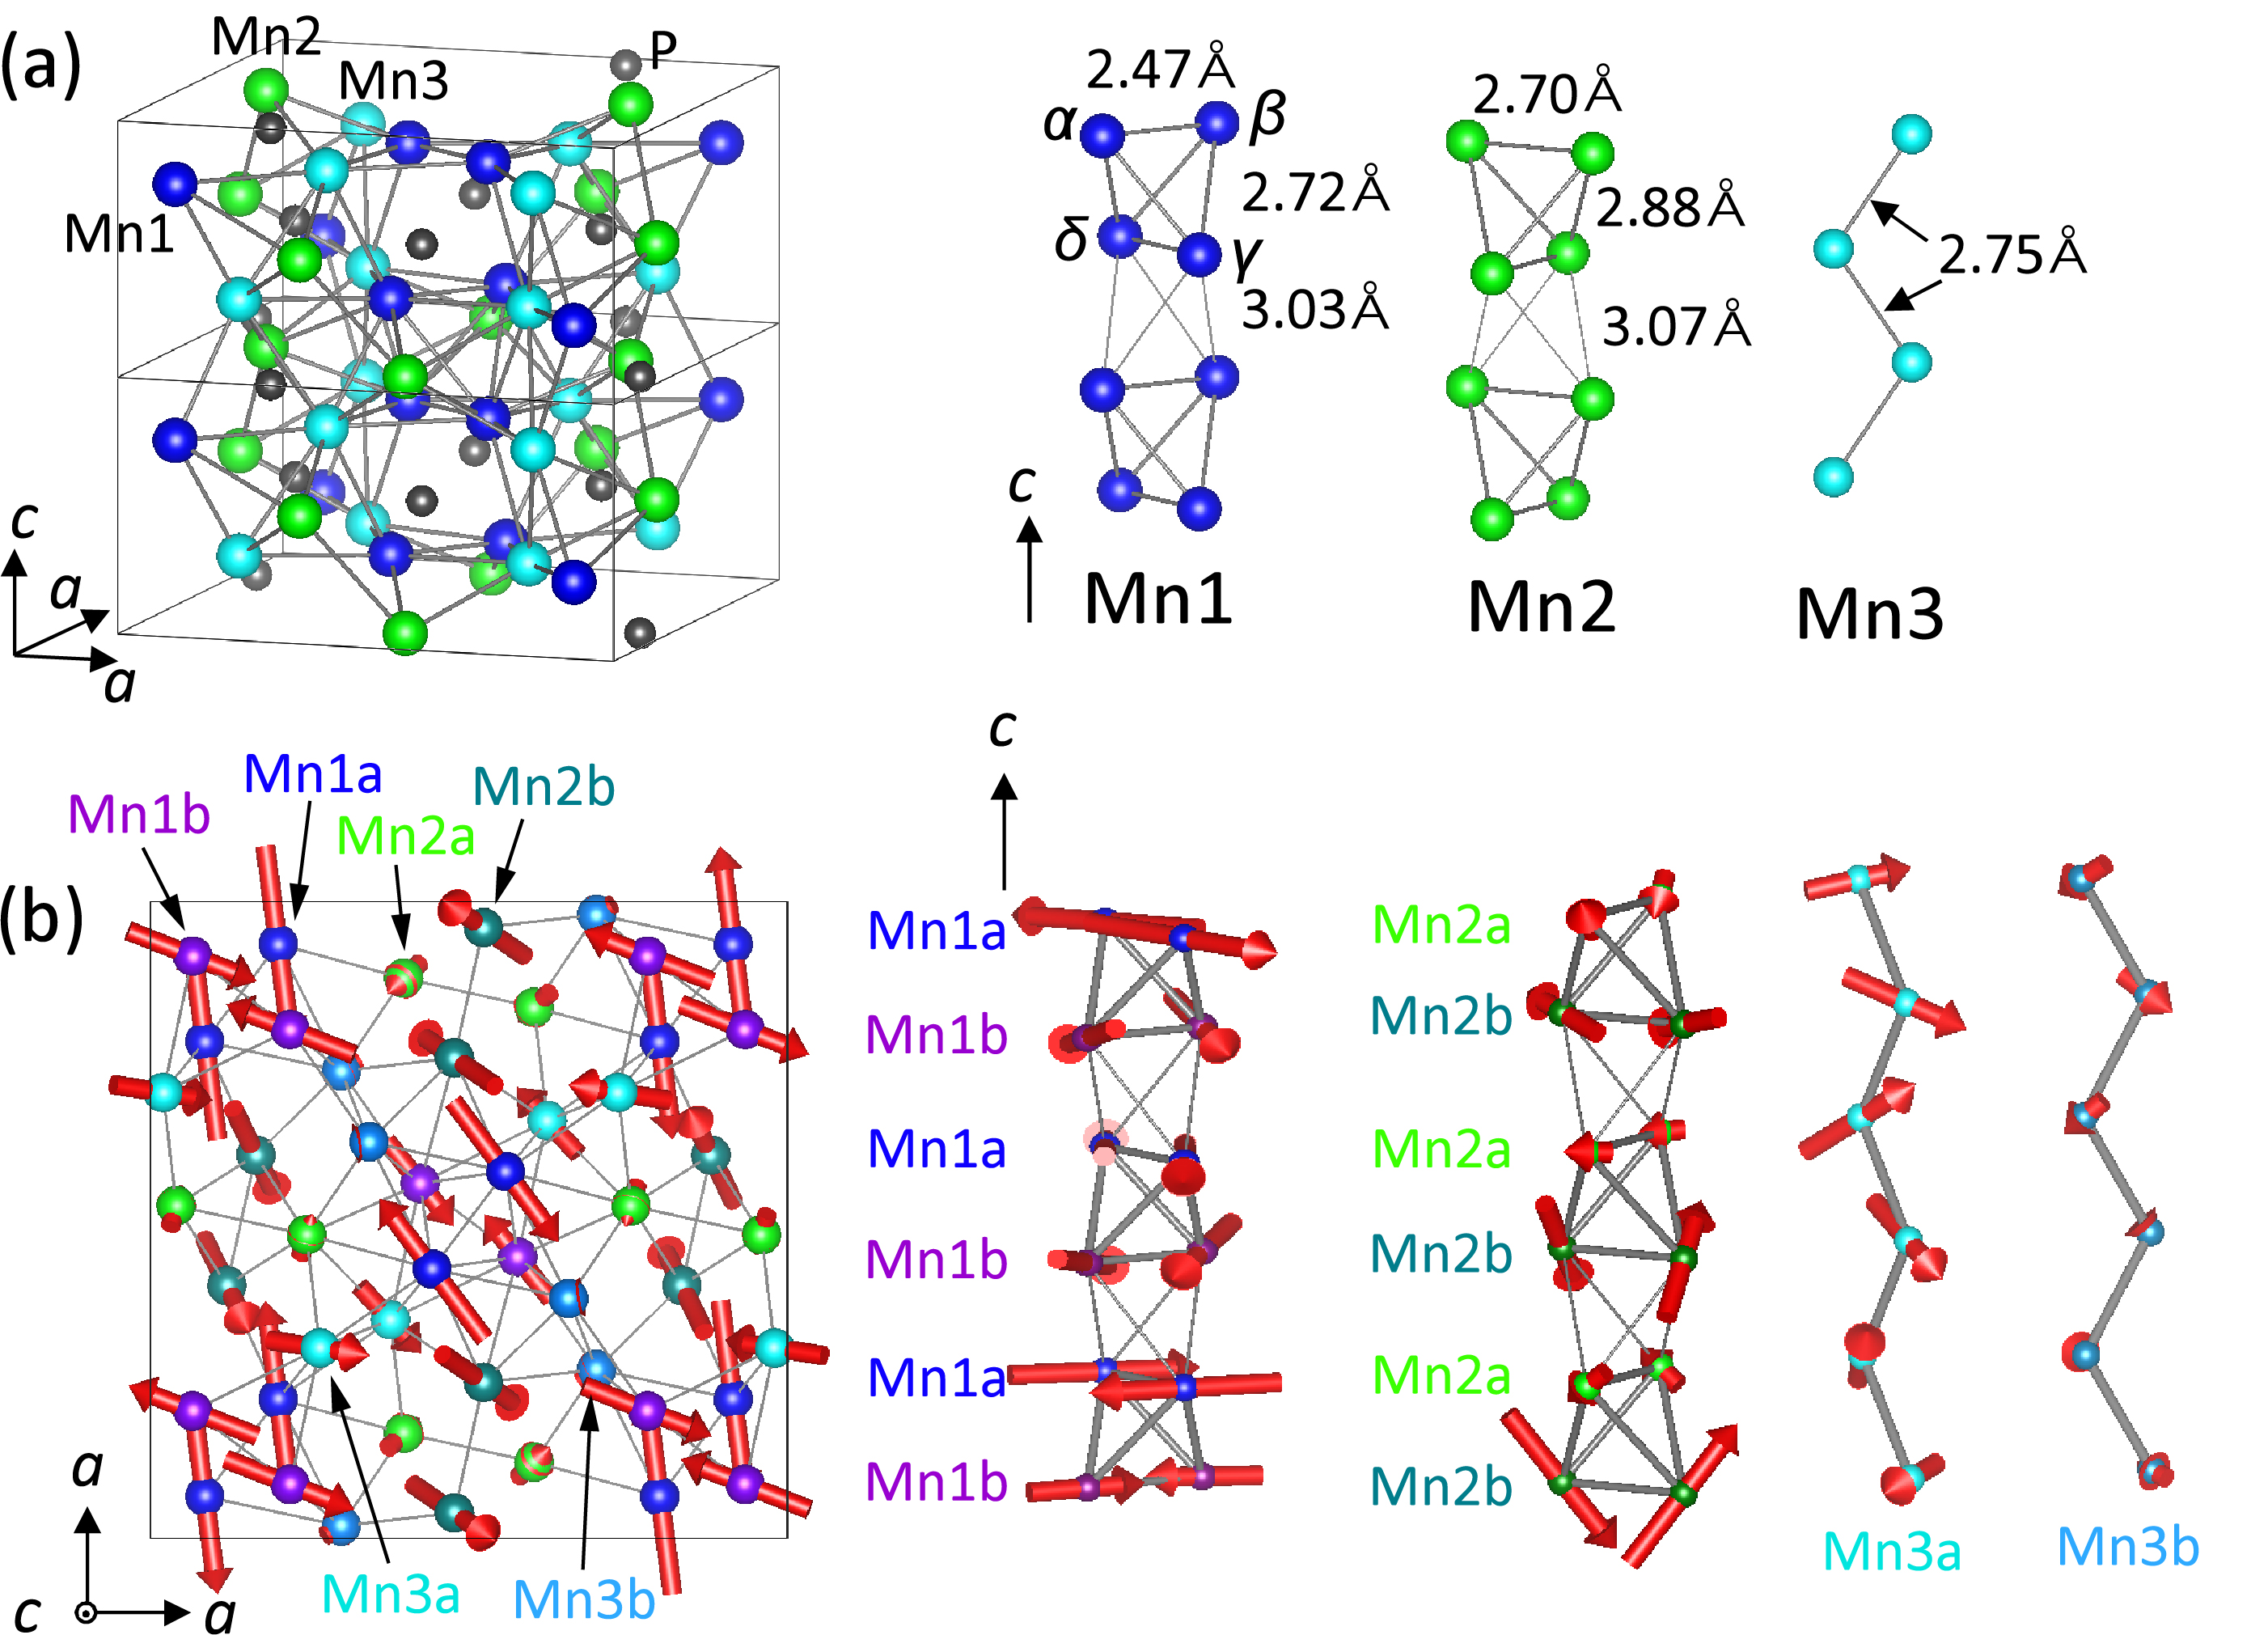
Mn3P crystallizes in a noncentrosymmetric tetragonal structure in the 4̄ space group (No. 82, ) Rundqvist . The crystal structure comprises three inequivalent Mn sites and one P site (see Fig. 1(a)). The four Mn1 sites, denoted as in Fig. 1, are equivalent and form a tetrahedron. By the symmetrical operation of 4̄, the “” bond is equivalent to the “” bond, leading to an isosceles triangle composed of and . The Mn2 sites are similar in structure to the Mn1 sites, whereas the Mn3 sites form a zigzag chain. Another important feature is the short distances between the inequivalent Mn sites: 2.70 Å for Mn1-Mn2, 2.54 Å for Mn1-Mn3, and 2.55 Å for Mn2-Mn3. Fifteen different types of Mn-Mn bonds exist within 3.0 Å. Competition of the exchange interactions is expected among so many Mn-Mn bonds.
In this single-crystal study, we revealed that the itinerant antiferromagnet Mn3P possesses unusual physical properties, such as a complex helimagnetic structure accompanied by a double transition and pressure-tuned quantum criticality accompanied by heavy-fermion-like behavior. The likely cause of these features is the frustration effect induced by the underlying structure.
Single crystals of Mn3P were grown by the self-flux method, as described in the Supplemental Material SM . We performed a range of experiments including resistivity, susceptibility, specific heat, neutron scattering, and NMR measurements. The resistivity and neutron scattering measurements were also conducted under pressure. We also calculated the band structure of Mn3P. The experimental method, NMR results and the band structure calculation are described in the Supplemental Material SM .

Figures 2 (a-c) plot the temperature dependences of (a) electrical resistivity (), (b) -divided specific heat (), and (c) magnetic susceptibility () of Mn3P at ambient pressure. The was characteristically convex below room temperature and exhibited two anomalies at K and K. The demonstrated that both anomalies were second-order-like phase transitions. They were also confirmed by successive suppressions in . As shown in the magnetization curve after field cooling to 2 K (Fig. 2(d)), no spontaneous magnetization occurred in the ground state. Consistent with a previous report Liu , the did not follow Curie-Weiss behavior (Fig. 2(c), inset), indicating the itinerant nature of the magnetism. The intrinsic nature of the double transition was further confirmed by NMR measurements SM , and the neutron scattering data shown below.


The magnetic structure of Mn3P in the ground state was determined by neutron scattering measurements. The magnetic wave vector was found to be with , which differs from the commensurate suggested in Ref. 14. Fig. 3(a) shows the temperature dependence of the scattering intensity at . At ambient pressure, the intensity started increasing below and exhibited a small kink at , similarly to our NMR results SM . The magnetic structure was refined using the 269 magnetic reflections measured at ambient pressure. We utilized two programs: the magnetic structure shown in Fig. 1(b) as given by Jana Jana , and the modulations of the magnetic moment along the axis given by Fullprof Fullprof and shown in Fig. 4. The resultant magnetic structures are consistent between the two programs. The crystal and magnetic-structure analyses are provided in the Supplemental Material SM . In the ordered state shown in Fig. 1(b), each Mn site is split into two Mn sites with independently modulated amplitudes and phases. Mn1a and Mn1b (Mn2a and Mn2b) alternate along the axis, and Mn3a and Mn3b form different zigzag chains. The complex non-collinear structure maintains a two-fold rotational symmetry . At most of the Mn sites, the size of the total magnetic moment oscillates along the axis (see Fig. 4), indicating clear ellipticity of the helix. The origin of elliptical helices in -electron systems is an interesting problem, and has been discussed in FeAs Rodriguez ; Frawley . At all Mn sites, the size of the magnetic moment was about 1 or less, and was extremely small at the Mn2a and Mn3b sites. At the Mn1a and Mn1b sites, the magnetic moments almost presented in the plane, and were approximately coupled in antiparallel between the shortest “” (Mn1a) and the “” (Mn1b) bonds owing to symmetry, indicating a dominance by AF exchange interactions. In the isosceles triangle composed of and , the AF interaction in the “” bond frustrates the equivalent interactions in the “” and “” bonds, similarly to geometrical frustration. This yields a significant contribution to disturb the collinear magnetic ordering. At the Mn2 and Mn3 sites, the magnetic moments have substantial -axis components. This helical state with the split sites, in which the sizes of the moments are significantly different, is conjectured to arise from reduced competition of the exchange interactions among the many Mn-Mn bonds. Contribution of the DM interaction is not clearly seen between the shortest Mn1-Mn1 bonds, which are almost coupled in antiparallel, but it will be important for reproducing the overall magnetic structure. At , the abruptly but continuously changed by 2 % SM . The anisotropy of the averaged magnetic moment also changed when passing SM , but the weak magnetic intensities in the intermediate phase preclude a detailed analysis of the magnetic structure. We consider that the six Mn sites undergo partial ordering at and that the disordered Mn sites are ordered below .
The neutron scattering experiment clarified that all the Mn sites possess static magnetic moments, but the ordered states are unusual. At low temperatures, the yielded a large electronic specific heat coefficient mJ/mol K2, as shown in Fig. 2(b), corresponding to mJ/cm3 K2 per volume. This is one of the larger values in electron systems Hussey . The coefficient of the term in the resistivity was also large value ( cm/K2 at ambient pressure). The ration was , of the same order as the Kadowaki-Woods ratio. In the band calculation in the PM state SM , was estimated as 16.3 mJ/mol K2 for a formula cell. The experimentally obtained in the ordered state was remarkably enhanced, suggesting that strong mass renormalization occurs in Mn3P and survives even in the magnetically ordered state.

The pressure application drastically changed the electronic state of Mn3P, as shown in Fig. 5(a). Both transitions (indicated by arrows) were quickly suppressed under pressure. The anomaly at disappeared above GPa, whereas tended to zero at GPa. The residual resistivity decreased drastically to cm at GPa, and was thereafter independent of pressure. Obviously, the large residual resistivity is inherent in the ordered state, although its origin is unclear. The pressure-independent in the PM state probably originates from imperfectness in the sample, and its small value indicates a high-quality single crystal. Figure 6 shows the pressure-temperature phase diagram of Mn3P, and the pressure dependences of and . The continuous suppression of the ordered state suggests a quantum critical point (QCP) at GPa. Among Mn-based systems, Mn3P is a rare example of an easily-inducible QCP; thus far, quantum phase transitions have been reported in only a few materials Takeda ; Pfleiderer ; Cheng_MnP . Another QCP, where reaches 0 K, is also expected at GPa. The phase diagram suggests that two ordered phases are almost degenerate at any pressure. The pressure dependence of the magnetic Bragg intensities is shown in Fig. 3(a). The incommensurate structure with =0.16 was robust and no pressure dependence was observed up to 1 GPa; specifically, was 0.1608(2) at 0 GPa, 0.160(1) at 0.5 GPa, and 0.162(2) at 1 GPa. The ordered magnetic moment gradually reduced with increasing pressure, reaching % of its ambient-pressure value (on average) at 1 GPa.

Figure 5(b) plots the temperature dependence of resistivity at 1.63 GPa, just above . The resistivity in the PM state was convex over a wide temperature range, reminiscent of -electron heavy fermion systems. The resistivity remarkably decreased below K, indicating a broad incoherent-coherent crossover in the low temperature region. As shown in the inset of Fig. 5(b), the resistivity at 1.63 GPa obeyed a dependence at low temperatures. The vicinity of the QCP was dominated by NFL behavior and a distinct peak in the , although was already large in the ordered state. This indicates an unusually small entropy release through and . The was suppressed at pressures above , and the FL state became stabilized. The observed in Mn3P (cm/K2) is comparable to those of -electron heavy fermion systems, and is times larger than that of MnP, even near the QCP Cheng_MnP where the helimagnetic phase terminates Matsuda_MnP ; Wang_MnP .
Several materials in -electron systems have been reported as heavy fermion systems with strong mass renormalization. Examples are -Mn, (Y,Sc)Mn2, LiV2O4, (Ca,Sr)RuO4, Na1.5Co2O4, CaCu3Ir4O12, and Fe2As2 (K, Cs) Shinkoda ; Shiga ; Kondo ; Urano ; Nakatsuji ; Miyoshi ; Cheng ; Wu . Such materials commonly exhibit a low characteristic temperature , which generally gives a large proportional to . Mn3P should be included in this category. In the above oxides and iron pnictides, obeys Curie-Weiss behavior at temperatures above Kondo ; Nakatsuji ; Miyoshi ; Cheng ; Hardy , suggesting the presence of localized moments at high temperatures. Accordingly, is generally interpreted as a localized-itinerant crossover, broadly analogous to that observed in the -electron systems. The localized moment in -electron systems primarily arises from proximity of a Mott insulator Arita ; Jonsson ; Anisimov ; Hardy . However, in Mn3P, the deviation of from Curie-Weiss law and the band calculation SM suggest the obvious itinerant character of the electrons. It is unlikely that Mn3P is compatible with models based on localized-itinerant crossover.
Heavy -electrons may also arise from the effects of geometrical frustration, as discussed for -Mn, Y0.95Sc0.05Mn2 and LiV2O4. They are divided into models with localized moments Fulde ; Lacroix ; Hopkinson ; Burdin ; Shannona ; Laad and itinerant models Pinettes ; Tsunetsugu ; Yamashita . In the itinerant models, it has been proposed that frustration enhances the fluctuations of degenerate orbitals Tsunetsugu ; Yamashita , but Mn3P prohibits such degeneracy in principle, because the local symmetry of each Mn site is low as represented by its notation 1 (). Another route to heavy mass is degeneracy of the magnetic correlations inherent in frustration Pinettes . This route may be qualitatively adapted to Mn3P, which is not a geometrically frustrated lattice but exhibits the unusual features of a strong frustration effect, such as the almost-degenerated magnetic transitions and the splitting into six Mn sites with quite different magnetic moment. In contrast to other itinerant heavy-fermion systems, -Mn and Y0.95Sc0.05Mn2, Mn3P is a clean system, which excludes the possibility that the disorder effect enhances the incoherency. The observed features in Mn3P are worthy of further theoretical and experimental elucidations.
In conclusion, we performed comprehensive experimental characterizations and calculations of antiferromagnet Mn3P. We first identified a complex helimagnetic structure, in which three Mn sites are separated into six sites of different sizes and directions of their magnetic moments. The helimagnetic structure accompanied by the double transition suggests competition of the exchange interactions, or frustration, in Mn3P. Second, the QCP was easily induced under pressure, a rare behavior in Mn-based materials. Third, Mn3P behaved similarly to -electron-heavy fermion systems, namely, it presented a convex resistivity curve, a larger electronic specific heat coefficient than that estimated by the band-structure calculation, and a large coefficient of the resistivity They demonstrate a strong mass renormalization in Mn3P. These noteworthy findings reveal that the itinerant system Mn3P comprehends the areas of magnetism with competing interactions, a quantum criticality, and -electron heavy fermion. It is an excellent example to merge them and to induce the novel interplay.
Acknowledgements
We thank Kazuto Akiba for experimental supports. This work was supported by JSPS KAKENHI Grant Number JP15H05882, JP15H05885, JP18H04320, and 18H04321 (J-Physics), 15H03689.and 15H05745. This research used resources at the High Flux Isotope Reactor and the Spallation Neutron Source, DOE Office of Science User Facilities operated by the Oak Ridge National Laboratory.
References
- (1) H. v. Löhneysen, A. Rosch, M. Vojta, and P. Wölfle, Rev. Mod. Phys. 79, 1015 (2007).
- (2) P. Gegenwart, Q. Si, and F. Steglich, Nat. Phys. 4, 186 (2008).
- (3) T. Shibauchi, A. Carrington, and Y. Matsuda, Annu. Rev. C. M. Phys. 5, 113 (2014).
- (4) T. Furukawa, K. Miyagawa, H. Taniguchi, R. Kato and K. Kanoda, Nat. Phys. 11, 221 (2015).
- (5) S. Takeuchi and K. Motizuki, J. Phys. Soc. Jpn. 24, 742 (1967).
- (6) A. Kallel, H. Boller, and E. F. Bertaut, J. Phys. Chem. Solids, 35, 1139 (1974).
- (7) L. Dobrzynski and A. F. Andresen, J. Magn. Magn. Mater. 82, 67 (1989).
- (8) S. Yano, J. Akimitsu, S. Itoh, T. Yokoo, S. Satoh, D. Kawana and Y. Endoh, J. Phys.: Conf. Ser. 391, 012113 (2012).
- (9) T. Yamazaki, Y. Tabata, T. Waki, T. J. Sato, M. Matsuura, K. Ohoyama, M. Yokoyama, and H. Nakamura, J. Phys. Soc. Jpn. 83, 054711 (2014).
- (10) Y. Shiomi, S. Iguchi, and Y. Tokura, Phys. Rev. B 86, 180404(R) (2012).
- (11) S. Nakatsuji, N. Kiyohara, and Y. Higo, Nature 527, 212 (2015).
- (12) T. Kurumaji, T. Nakajima, M. Hirschberger, A. Kikkawa, Y. Yamasaki, H. Sagayama, H. Nakao, Y. Taguchi, T. Arima, Y. Tokura, Science 365, 914 (2019).
- (13) R. J. Gambino, T. R. McGuire, Y. Nakamura, J. Appl. Phys. 38 1253 (1967).
- (14) H. -p Liu, Y. Andersson, P. James, D. Satula, B. Kalska, L. Häggström, O. Eriksson, A. Broddefalk, P. Nordblad, J. Magn. Magn. Mater. 256, 117 (2003).
- (15) S. Rundqvist, Acta Chem. Scand. 16, 992 (1962).
- (16) See Supplemental Material. It contains the sample preparation, details of the experimental methods, the NMR spectrum, the band structure calculation, additional results and analyses of the neutron scattering measurement, and resistivity data under several pressures. It includes Refs. [17-22].
- (17) G. M. Sheldrick, Acta Crystallogr., Sect. A 64, 112 (2008).
- (18) A. L. Spek, J. Appl. Crystallogr. 36, 7 (2003).
- (19) T. C. Kobayashi, H. Hidaka, H. Kotegawa, K. Fujiwara, and M. I. Eremets, Rev. Sci. Instrum. 78, 023909 (2007).
- (20) K. Murata, K. Yokogawa, H. Yoshino, S. Klotz, P. Munsch, A. Irizawa, M. Nishiyama, K. Iizuka, T. Nanba, T. Okada, Y. Shiraga, and S. Aoyama, Rev. Sci. Instrum. 79, 085101 (2008).
- (21) F. Ye, Y. Liu, R. Whitfield, R. Osborn and S. Rosenkranz, J. Appl. Crystallogr. 51, 315 (2018).
- (22) https://www.ill.eu/sites/fullprof/
- (23) V. Petricek, M. Dusek, and L. Palatinus, Z. Kristallogr. 229(5), 345 (2014); V. Petricek et al., Z. Krist.-Cryst. Mater. 231, 301 (2016).
- (24) J. Rodriguez-Carvajal, Physica B 192, 55 (1993).
- (25) E. E. Rodriguez, C. Stock, K. L. Krycka, C. F. Majkrzak, P. Zajdel, K. Kirshenbaum, N. P. Butch, S. R. Saha, J. Paglione, and M. A. Green, Phys. Rev. B 83, 134438 (2011).
- (26) T. Frawley, R. Schoonmaker, S. H. Lee, C.-H. Du, P. Steadman, J. Strempfer, Kh. A. Ziq, S. J. Clark, T. Lancaster, and P. D. Hatton, Phys. Rev. B 95, 064424 (2017).
- (27) N. E. Hussey, J. Phys. Soc. Jpn. 74, 1107 (2005).
- (28) K. Takeda, A. Miyake, K. Shimizu, T. C. Kobayashi, K. Amaya, J. Phys. Soc. Jpn. 77, 025001 (2008).
- (29) C. Pfleiderer, G. J. McMullan, and G. G. Lonzarich, Physica B 206&207, 847 (1995).; C. Pfleiderer, S. R. Julian and G. G. Lonzarich, Nature 414, 427 (2001).
- (30) J.-G. Cheng, K. Matsubayashi, W. Wu, J. P. Sun, F. K. Lin, J. L. Luo, and Y. Uwatoko, Phys. Rev. Lett. 114, 117001 (2015).
- (31) M. Matsuda, F. Ye, S. E. Dissanayake, J.-G. Cheng, S. Chi, J. Ma, H. D. Zhou, J.-Q. Yan, S. Kasamatsu, O. Sugino, T. Kato, K. Matsubayashi, T. Okada, and Y. Uwatoko, Phys. Rev. B 93, 100405(R) (2016).
- (32) Y. Wang, Y. Feng, J. -G. Cheng, W. Wu, J. L. Luo, and T. F. Rosenbaum, Nature Commun. 7, 13037 (2016).
- (33) T. Shinkoda, K. Kumagai, K. Asayama, J. Phys. Soc. Jpn. 46, 1754 (1979).
- (34) M. Shiga, K. Fujisawa, H. Wada, J. Phys. Soc. Jpn. 62, 1329 (1993).
- (35) S. Kondo, D. C. Johnston, C. A. Swenson, F. Borsa, A. V. Mahajan, L. L. Miller, T. Gu, A. I. Goldman, M. B. Maple, D. A. Gajewski, E. J. Freeman, N. R. Dilley, R. P. Dickey, J. Merrin, K. Kojima, G. M. Luke, Y. J. Uemura, O. Chmaissem, and J. D. Jorgensen, Phys. Rev. Lett. 78, 3729 (1997).
- (36) C. Urano, M. Nohara, S. Kondo, F. Sakai, H. Takagi, T. Shiraki, and T. Okubo, Phys. Rev. Lett. 85, 1052 (2000).
- (37) S. Nakatsuji, D. Hall, L. Balicas, Z. Fisk, K. Sugahara, M. Yoshioka, and Y. Maeno, Phys. Rev. Lett. 90, 137202 (2003); S. Nakatsuji and Y. Maeno, Phys. Rev. B 62, 6458 (2000).
- (38) K. Miyoshi, E. Morikuni, K. Fujiwara, J. Takeuchi, and T. Hamasaki, Phys. Rev. B 69, 132412 (2004).
- (39) J.-G. Cheng, J.-S. Zhou, Y.-F Yang, H. D. Zhou, K. Matsubayashi, Y. Uwatoko, A. MacDonald, and J. B. Goodenough, Phys. Rev. Lett, 111, 176403 (2013).
- (40) Y. P. Wu, D. Zhao, A. F. Wang, N. Z. Wang, Z. J. Xiang, X. G. Luo, T. Wu, and X. H. Chen, Phys. Rev. Lett, 116, 147001 (2016).
- (41) F. Hardy, A. E. Böhmer, D. Aoki, P. Burger, T. Wolf, P. Schweiss, R. Heid, P. Adelmann, Y. X. Yao, G. Kotliar, J. Schmalian, and C. Meingast, Phys. Rev. Lett. 111, 027002 (2013).
- (42) R. Arita, K. Held, A.V. Lukoyanov, and V. I. Anisimov, Phys. Rev. Lett. 98, 166402 (2007).
- (43) P. E. Jönsson, K. Takenaka, S. Niitaka, T. Sasagawa, S. Sugai, and H. Takagi, Phys. Rev. Lett. 99, 167402 (2007).
- (44) V. I. Anisimov, I. A. Nekrasov, D. E. Kondakov, T. M. Rice, and M. Sigrist, Eur. Phys. J. B 25, 191 (2002).
- (45) P. Fulde, A. N. Yaresko, A. A. Zvyagin, and Y. Grin, Europhys. Lett. 54, 779 (2001).
- (46) C. Lacroix, Can. J. Phys. 70, 1469 (2002).
- (47) J. Hopkinson and P. Coleman, Phys. Rev. Lett. 89, 267201 (2002).
- (48) S. Burdin, D. R. Grempel, and A. Georges, Phys. Rev. B 66, 045111 (2002).
- (49) N. Shannona, Eur. Phys. J. B 27, 527 (2002)
- (50) M. Laad, L. Craco, and E. Müller-Hartmann, Phys. Rev. B 67, 033105 (2003).
- (51) C. Pinetts and C. Lacroix, J. Phys.: Condens. Matter 6, 10093 (1994).
- (52) H. Tsunetsugu, J. Phys. Soc. Jpn. 71, 1844 (2002).
- (53) Y. Yamashita and K. Ueda, Phys. Rev. B 67, 195107 (2003).
- Supplemental Material-
I Sample preparation
Single crystals of Mn3P were synthesized using a self-flux method. A mixture of Mn : P = 4 : 1 was put into Al2O3 crucible and sealed in an evacuated quartz ampoule. The ampoule was heated slowly up to 800 oC and held there for 4 days to promote a homogeneous reaction. After that, the ampoule was heated up to 1100 oC for 2 hours and then cooled to 950 oC for 6 hours. After centrifuging the flux at 980 oC, the bar-shape single crystals were obtained. The crystal tends to grow along the axis and the typical size is mm3. The crystals are robust against air and water, but sensitive to acid. The remaining flux was removed mechanically from the crystal.
For the single-crystal x-ray diffraction measurement, the data were collected to a maximum value of using the angle scans. For all structure analyses, the program suite SHELX was used for structure solution and least-squares refinement Sheldrick . Platon was used to check for missing symmetry elements in the structures Spek . The obtained parameters are shown in Tables I and II. It was fairly consistent with those of the previous polycrystalline samples Rundqvist2 ; Liu2 . The occupancies estimated at each site were more than 99%, ensuring the high quality of the crystal.
| Formula | Mn3P |
|---|---|
| Crystal system | tetragonal |
| Space group | 4̄ (no.82) |
| (Å) | 9.182 |
| (Å) | 4.5655 |
| 8 | |
| Unique reflections | 579 |
| Residual factor | 0.0299 |
| 0.0679 |
| site | wyckoff | l.s. | x | y | z | (Å2) | occup. |
|---|---|---|---|---|---|---|---|
| Mn1 | 8g | 1 | 0.58059 | 0.60739 | 0.7714 | 0.49 | 1 |
| Mn2 | 8g | 1 | 0.85655 | 0.53203 | 0.0137 | 0.39 | 0.99 |
| Mn3 | 8g | 1 | 0.67197 | 0.71927 | 0.2468 | 0.43 | 1 |
| P | 8g | 1 | 0.7937 | 0.54463 | 0.5109 | 0.43 | 1 |
II Experimental methods
Magnetic susceptibility measurement was performed in a range of K by utilizing a Magnetic Property Measurement System (Quantum Design). Specific heat measurement was performed in a range of K by a Physical Property Measurement System (Quantum Design). We measured electrical resistivity using four probe AC method, in which electrical contacts of the wire were made by a spod-weld method. The high pressure up to 3.5 GPa for resistivity measurements was applied using an indenter-type pressure cell and Daphne 7474 oil as a pressure-transmitting medium indenter ; Murata . The low temperature for resistivity measurements was achieved using a homemade 3He cryostat, except for the data at 1.38 and 1.63 GPa, where a homemade dilution refrigerator was used. In the 3He cryostat, the pressure cell was soaked in the liquid, while it was cooled by thermal conduction in the dilution refrigerator. The temperature was measuremd from the resistivity of a calibrated RuO2 thermometer.
The neutron diffraction measurements at ambient and high pressures were performed on the time-of-flight diffractometer CORELLI at the Spallation Neutron Source at Oak Ridge National Laboratory.Ye High pressure up to 1 GPa was generated with a self-clamped piston-cylinder cell made of CuBe utilizing Daphne 7373 oil. The crystal dimensions were about 113 mm3. The pressure was monitored by measuring the lattice constant of a comounted NaCl crystal. The neutron diffraction measurements at ambient pressure were also performed on a triple-axis spectrometer HB-1 at the High Flux Isotope Reactor at Oak Ridge National Laboratory. Neutrons with an energy of 13.5 meV were used, together with a horizontal collimator sequence of 48’-80’-S-80’-240’. Contamination from higher-order beams was effectively eliminated using pyrolytic graphite filters. The single crystal was oriented in the (H, H, L) scattering plane and mounted in a closed-cycle 4He gas refrigerator.
We also performed NMR measurements through a conventional spin-echo method and band calculations through a full-potential LAPW (linear augmented plane wave) calculation within the LDA(local density approximation). The results of NMR and the band calculations are shown in the following sections in the Supplemental Material.
III Nuclear magnetic resonance for powdered sample
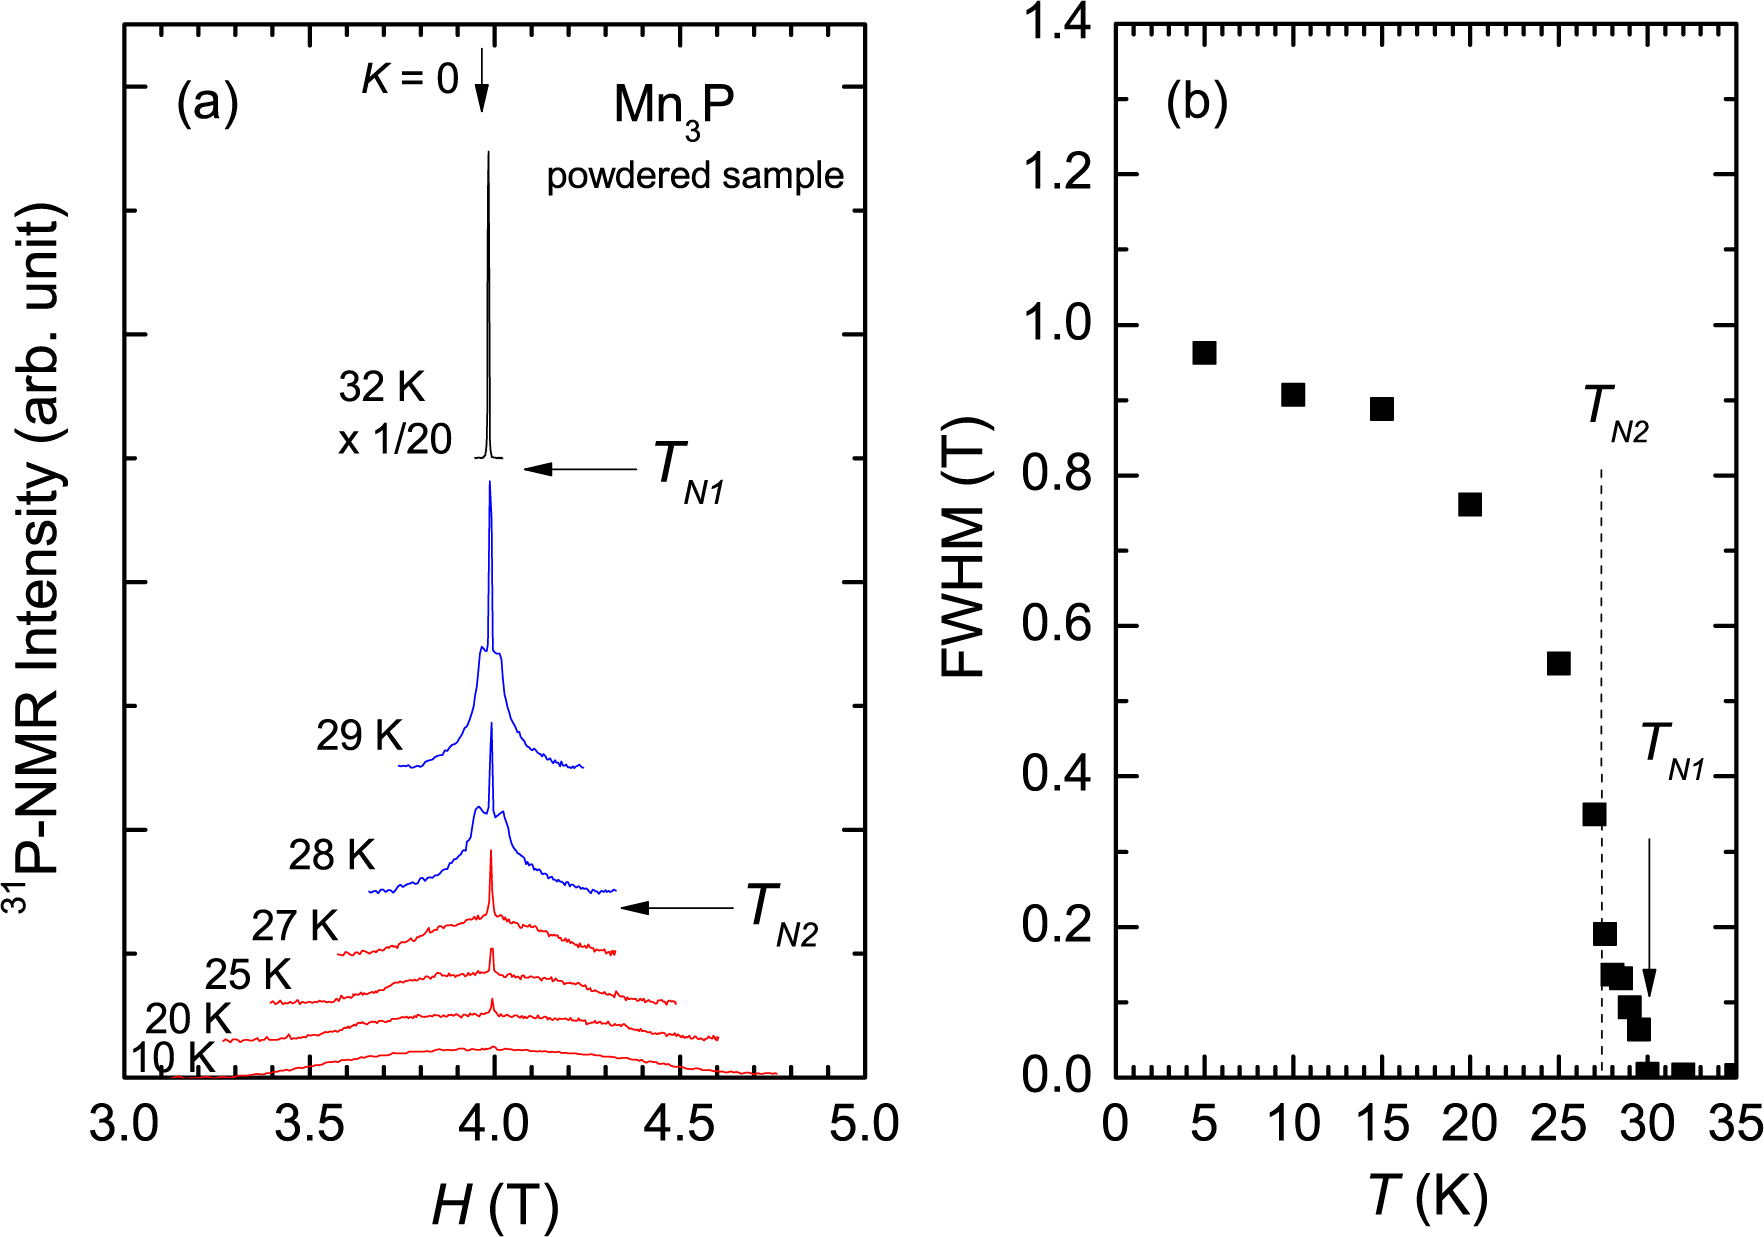
We performed NMR measurements to check that the double magnetic transition is intrinsic. Figure 1(a) shows 31P-NMR spectra measured at several temperatures using the unoriented powdered crystals. In the paramagnetic (PM) state, the sharp spectrum is observed near the position of zero Knight shift, . Below K, the spectrum is significantly broadened, and the symmetric broadening with respect to the position indicates the AF arrangement of the ordered moments. The sharp signal, where the internal field is quite weak, remains even below and also . A volume fraction of the remaining signal is about 5 at 29 K, which is too small to recognize that it is intrinsic. The intensity is gradually weakened as decreasing temperature, and the sharp signal does not change its shape when crossing . The origin of this remaining signal is unclear, but it is not relevant with the second transition at . What happened at is a change in the shape of the spectrum, which is already broadened below . Figure 1(b) displays the temperature dependence of the full-width at the half maximum, which is estimated with omitting the remaining sharp signals. Obviously, a two-step change is observed in the spectral width, which is consistent with the intensity of magnetic scattering shown in Fig. 3(a) in the main paper, suggesting that the both second-order like transitions occur at the identical P sites as the intrinsic property.
IV Band structure calculation
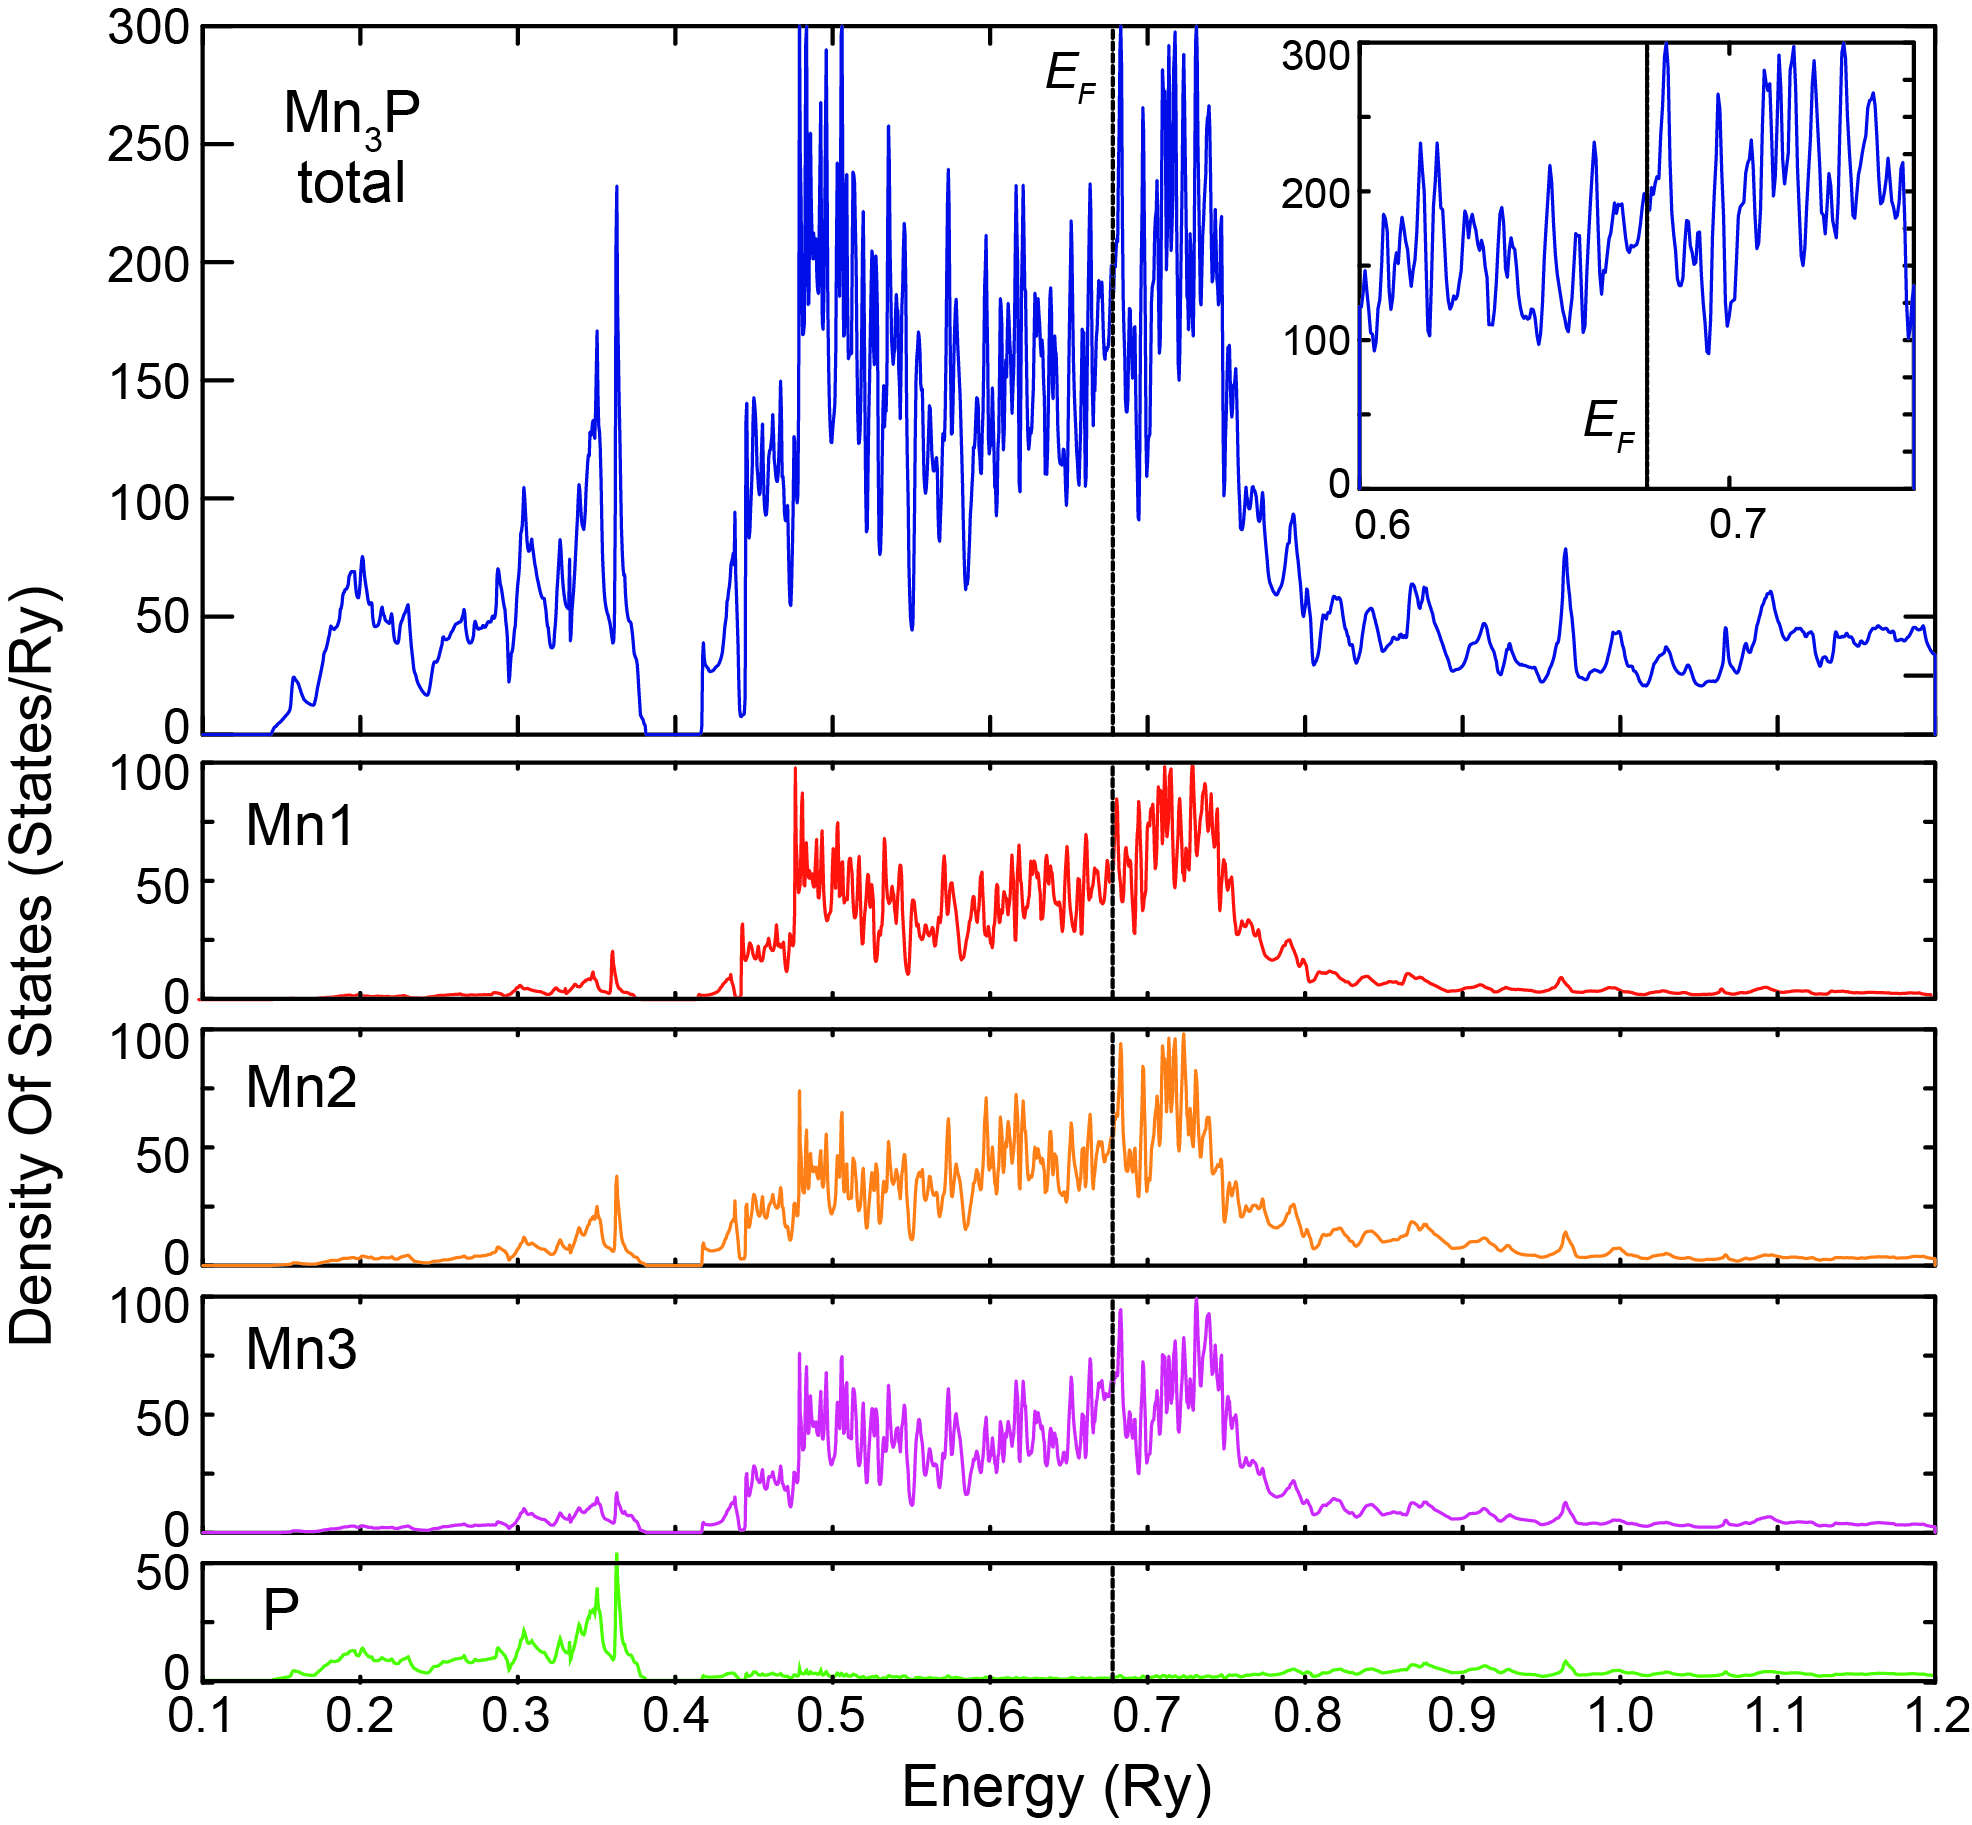
Band structure calculations were obtained through a full-potential LAPW (linear augmented plane wave) calculation within the LDA(local density approximation). Calculated density of states (DOS) for the PM state is shown in Fig. 2, where the partial DOS of the respective Mn sites and the P site are shown. The DOS at the Fermi energy originates in the orbitals of three Mn sites, and the contributions from each Mn site are similar. The -DOS including all orbitals roughly forms the rectangle shape with a bandwidth of Ry 4 eV, indicative of the itinerant character of the electrons. mJ/mol K2 is estimated in the PM state for a formula cell.
V Crystal and magnetic-structure analyses
The neutron diffraction measurements were performed on a time-of-flight neutron diffractometer CORELLI installed at Spallation Neutron Source at Oak Ridge National Laboratory. The single crystal was mounted with (0) in the horizontal scattering plane in the pressure cell. Thanks to the wide coverage of detectors vertically, Bragg reflections with finite were observed. The crystal and magnetic-structure analyses were performed using the FullProf fullprof2 and Jana Jana2 packages.
The observed Bragg reflection intensity () is proportional to the squared structure factor ().
| (1) |
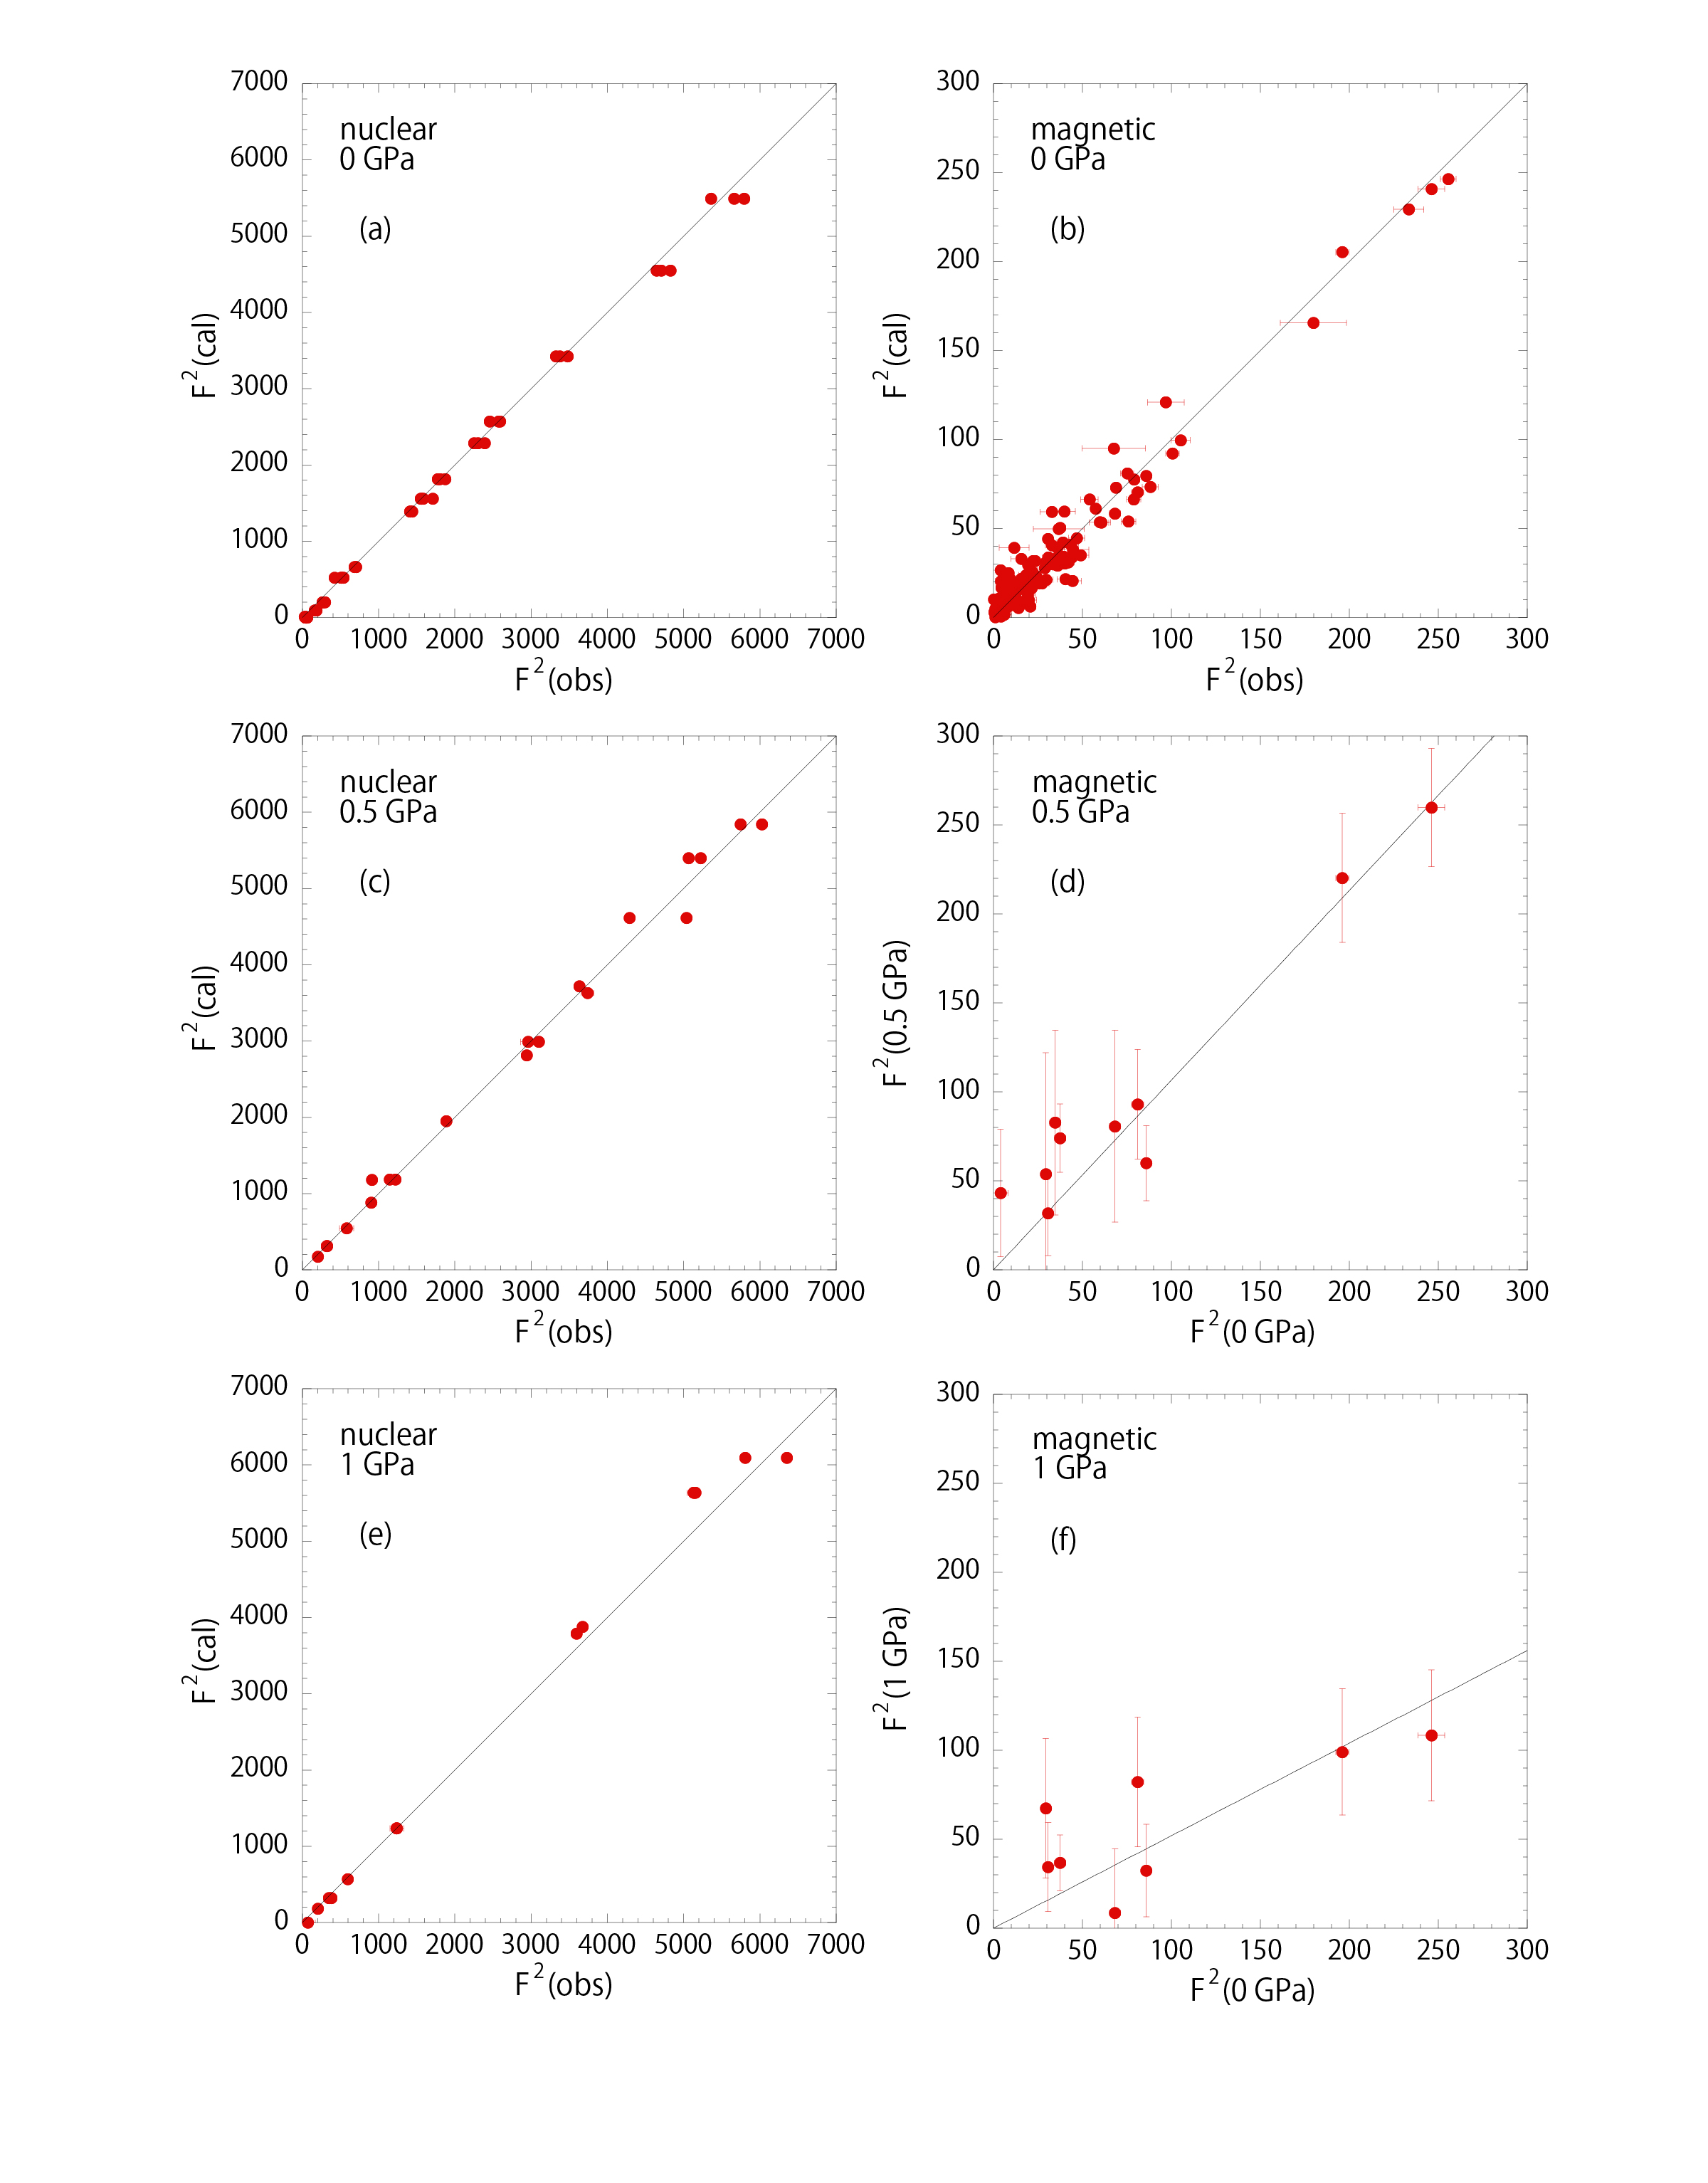
where , , , , , , , , and are constant, incident neutron beam flux, wavelength, sample absorption, extinction correction, Lorentz factor, half the scattering angle, calculated structure factor, and magnetic form factor, respectively. is unit for nuclear Bragg peaks. We first performed crystal structure analysis at each pressure to determine and in Eq. (1). As shown in Figs. 3(a), (c), and (e), the analysis of the nuclear Bragg intensities was performed reasonably well. The detailed magnetic structure analysis was performed at ambient pressure. The magnetic structure models were evaluated using the representation analysis with the program BasIreps in Fullprof Suite suite to determine the symmetry-allowed magnetic structure. The magnetic structure, shown in Figs. 1 and 4 in the main paper, was determined. The fitting was reasonably good, as shown in Fig. 3(b).
At 0.5 and 1 GPa, the number of observable magnetic Bragg peaks is quite limited due to large background signal and low beam transmission originating from the CuBe pressure cell. Therefore, we did not perform magnetic structure analysis for the data at the two high pressures. Instead, the observed magnetic Bragg intensities were compared with those at ambient pressure and the overall reduction factor for the magnetic moments was obtained, assuming that the overall magnetic structure does not change. Figs. 3(d) and (f) show the relation of observed magnetic structure factors at ambient and high pressures. The linearity is reasonably good at 0.5 and 1 GPa, suggesting that the above assumption is adequate. The square root of the slope of the linear curve corresponds to the reduction factor of the overall magnetic moments. The factor is 1.03(10) and 0.72(7) at 0.5 and 1 GPa, respectively. The magnetic moments do not change at 0.5 GPa but slightly decrease at 1.0 GPa.
VI Change in the wave vector at
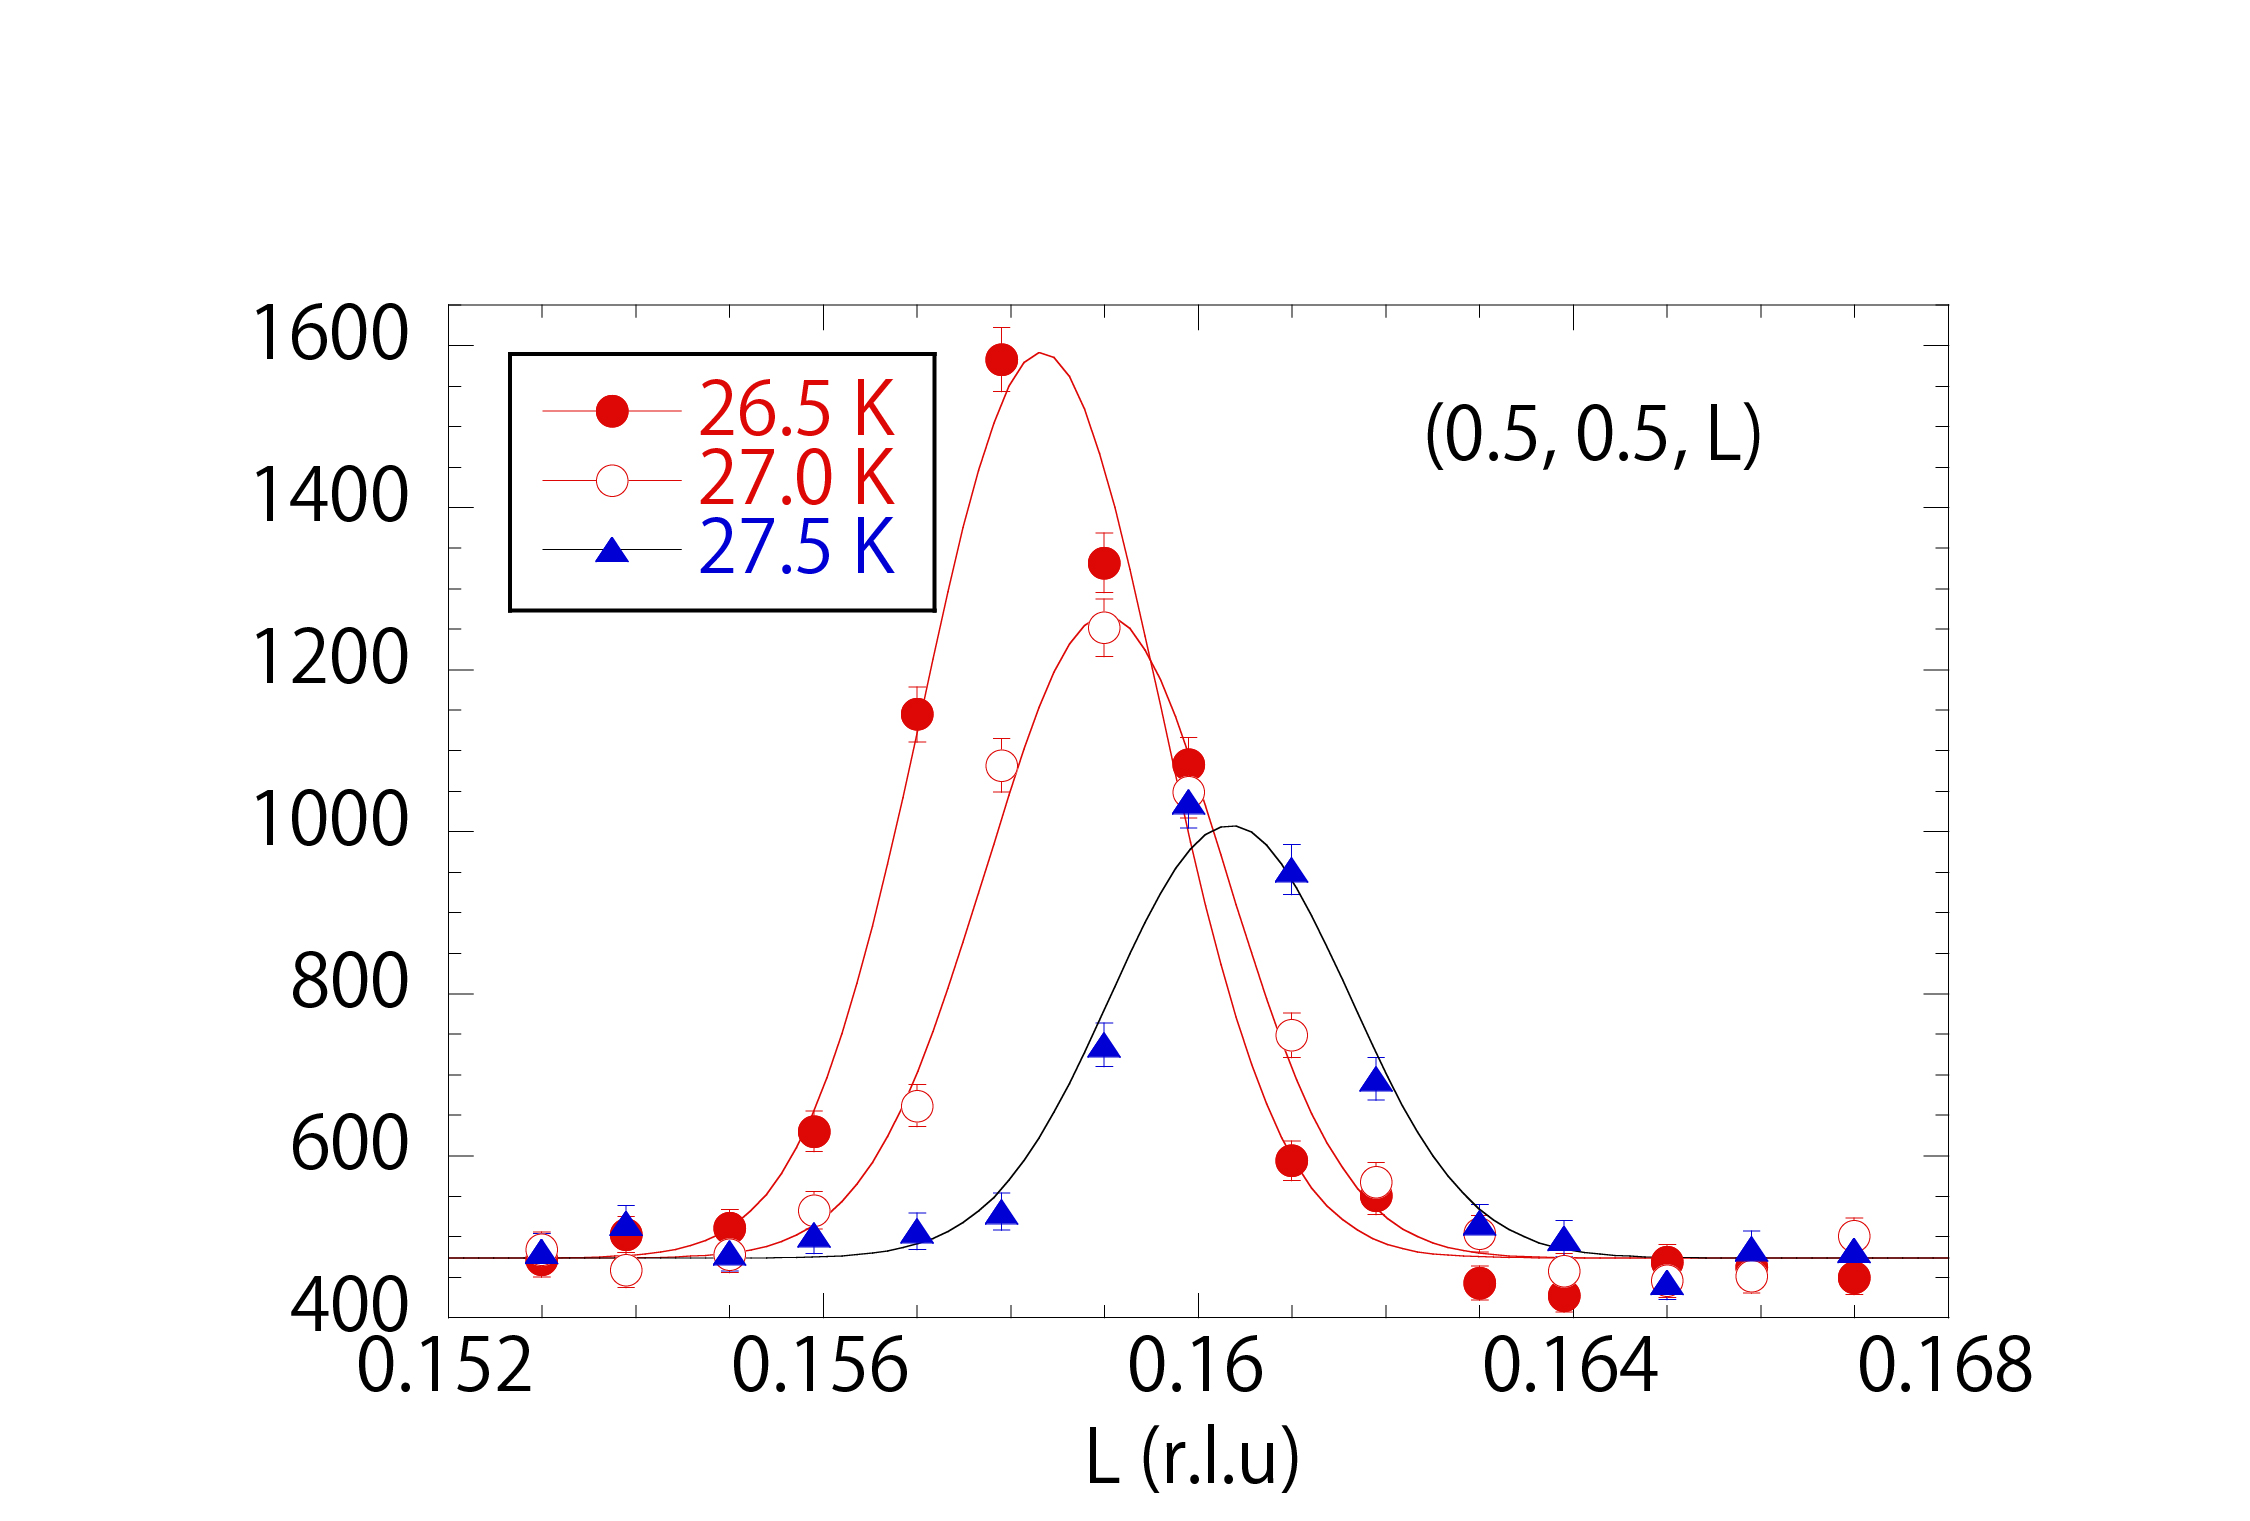
Figure 4 shows the magnetic Bragg intensities just below K. The wave vectors estimated from these data are plotted in Fig. 3(b) in the main paper. The wave vector decreases below without any signature of broadening or a splitting of the peak. The experimental data suggets that the transition at is continuous within the experimental resolution.
VII Magnetic structure in the intermediate phase
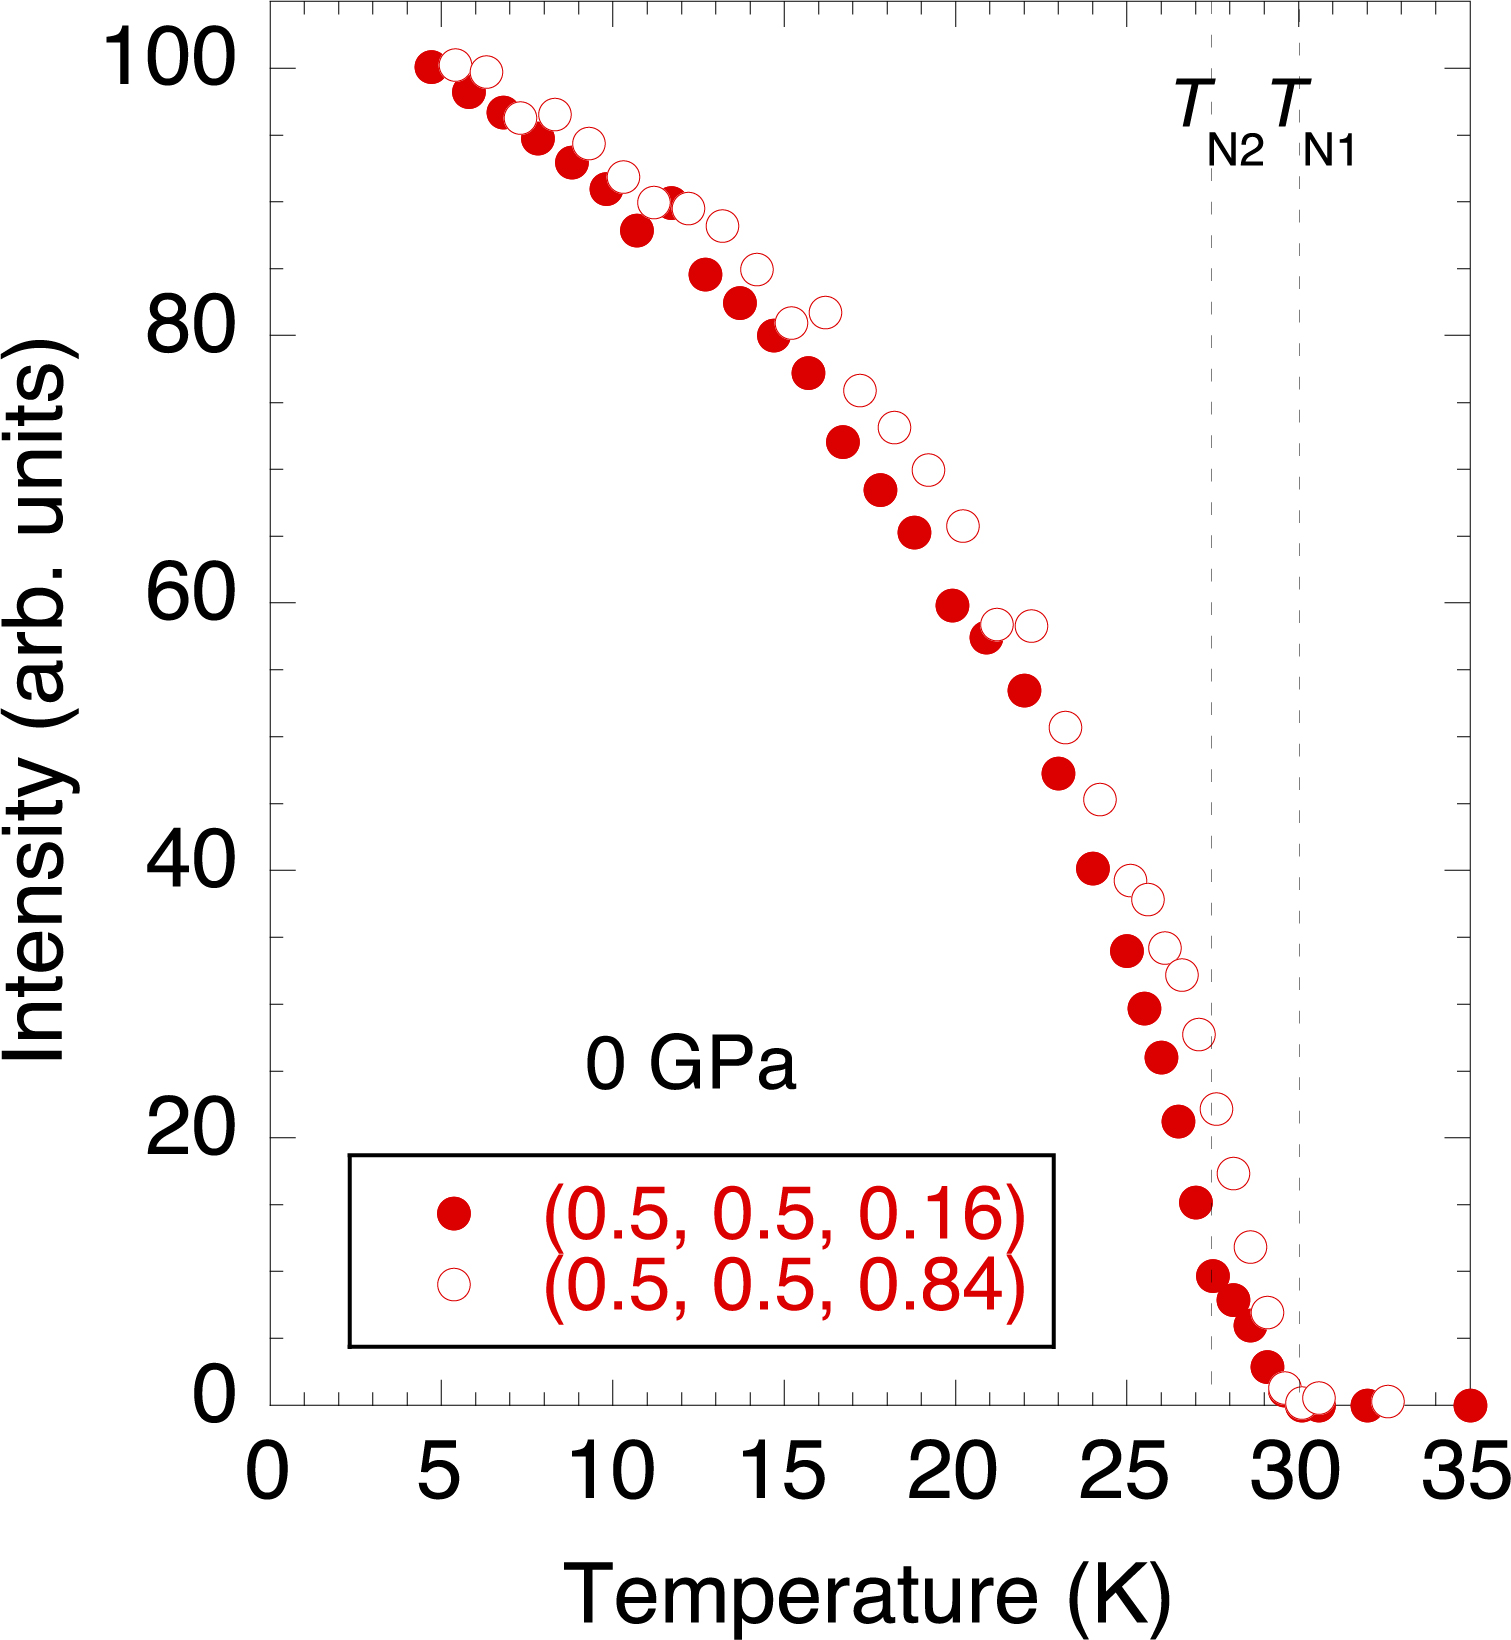
As described in the main paper, the magnetic structure analysis in the intermediate phase is challenging, since the magnetic Bragg intensities are very weak. In order to understand the magnetic structure in the intermediate phase qualitatively, we measured detailed temperature dependence of the two magnetic Bragg intensities around (0.5, 0.5, 0.16) and (0.5, 0.5, 0.84). The (0.5, 0.5, 0.16) reflection consists of 83% from the spin component in the plane () and 17% from the spin component along the axis (). On the other hand, the (0.5, 0.5, 0.84) reflection consists of 15% from and 85% from . Therefore, the former and latter reflections represent mostly and , respectively. [The (0.5, 2.5, 0.16) reflection, shown in Fig. 3(a) of the main paper, consists of 98.4% from and 1.6% from .] Figure 5 shows temperature dependence of magnetic Bragg peaks around (0.5, 0.5, 0.16) and (0.5, 0.5, 0.84) normalized at 5 K. We found that the (0.5, 0.5, 0.84) intensities are more than two times stronger than the (0.5, 0.5, 0.16) intensities in the intermediate phase, suggesting that is more dominant in the intermediate phase. If the Mn2b site also carries large in this phase as in the low temperature phase, the Mn2b moments might order mostly below and other moments might order below .
VIII Systematic resistivity data under pressure
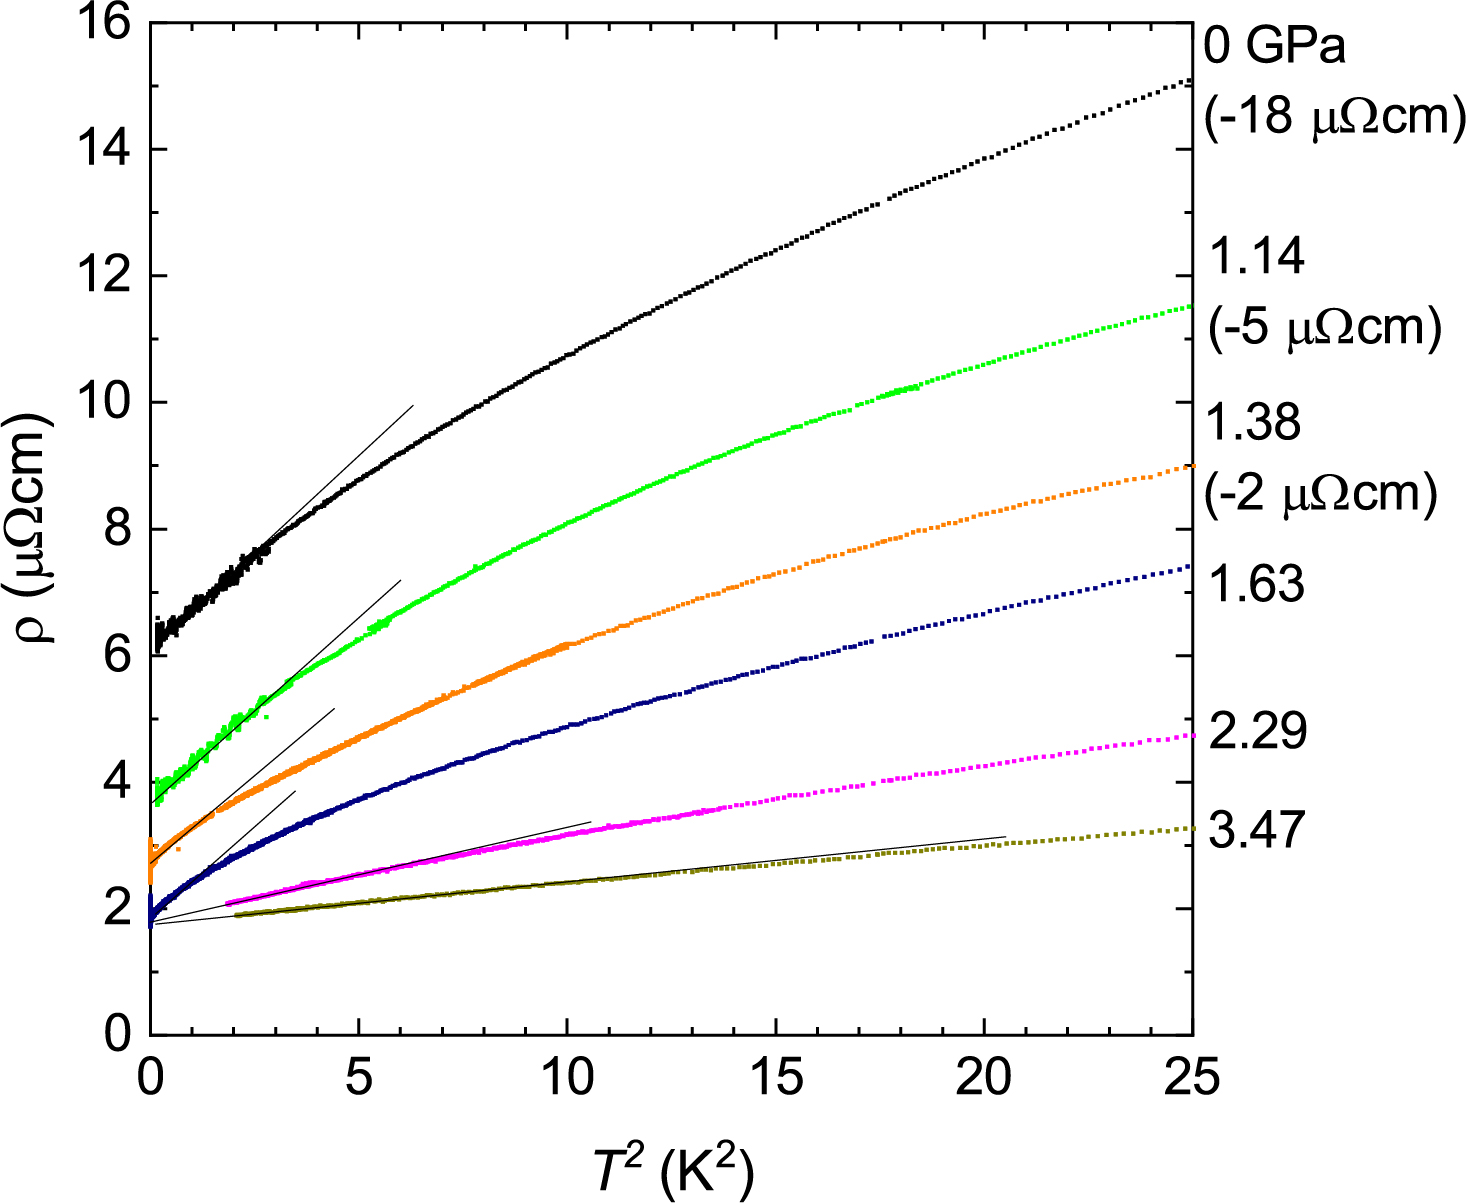
Figure 6 shows the vs plot for various pressures. At ambient pressure, the obeys a dependence at low temperatures, but it is acheived only below K. The estimated coefficient is cm/K2. The temperature range of the dependence shrinks near the QCP ( GPa). The large is maintained up to the pressure just above the QCP, and the decreases at higher pressure.
References
- (1) G. M. Sheldrick, Acta Crystallogr., Sect. A 64 (2008) 112.
- (2) A. L. Spek, J. Appl. Crystallogr. 36 (2003) 7.
- (3) S. Rundqvist, Acta Chem. Scand. 16, 992 (1962).
- (4) H. -p Liu, Y. Andersson, P. James, D. Satula, B. Kalska, L. Häggström, O. Eriksson, A. Broddefalk, P. Nordblad, J. Magn. Magn. Mater. 256, 117 (2003).
- (5) T. C. Kobayashi, H. Hidaka, H. Kotegawa, K. Fujiwara, and M. I. Eremets, Rev. Sci. Instrum. 78, 023909 (2007).
- (6) K. Murata, K. Yokogawa, H. Yoshino, S. Klotz, P. Munsch, A. Irizawa, M. Nishiyama, K. Iizuka, T. Nanba, T. Okada, Y. Shiraga, and S. Aoyama, Rev. Sci. Instrum. 79, 085101 (2008).
- (7) F. Ye, Y. Liu, R. Whitfield, R. Osborn and S. Rosenkranz, J. Appl. Crystallogr. 51, 315 (2018).
- (8) J. Rodriguez-Carvajal, Physica B 192, 55 (1993).
- (9) V. Petricek, M. Dusek, and L. Palatinus, Z. Kristallogr. 229(5), 345 (2014); V. Petricek et al., Z. Krist.-Cryst. Mater. 231, 301 (2016).
- (10) https://www.ill.eu/sites/fullprof/