The redshift and star formation mode of AzTEC2: a pair of massive galaxies at
Abstract
We combine observations from the Atacama Large Millimeter/submillimeter Array (ALMA) and the NOrthern Extended Millimeter Array (NOEMA) to assess the redshift and to study the star formation conditions in AzTEC2: one of the brightest sub-millimeter galaxies (SMGs) in the COSMOS field ( mJy). Our high-resolution observations confirm that AzTEC2 splits into two components (namely AzTEC2-A and AzTEC2-B) for which we detect [C II] and 12CO(54) line emission, implying a redshift of () for AzTEC2-A (AzTEC2-B) and ruling out previous associations with a galaxy at . We use the 12CO(54) line emission and adopt typical SMG-like gas excitation conditions to estimate the molecular gas mass, which is for AzTEC2-A, and a factor four lower for AzTEC2-B. With the infrared-derived star formation rate of AzTEC2-A ( yr-1) and AzTEC2-B ( yr-1), they both will consume their current gas reservoir within Myr. We find evidence of a rotation-dominated [C II] disk in AzTEC2-A, with a de-projected rotational velocity of km s-1, velocity dispersion km s-1, and dynamical mass of . We propose that an elevated gas accretion rate from the cosmic web might be the main driver of the intense levels of star formation in AzTEC2-A, which might be further enhanced by gravitational torques induced by its minor companion (AzTEC2-B). These results strengthen the picture whereby the population of single-dish selected SMGs is rather heterogeneous, including a population of pairs of massive, highly-active galaxies in a pre-coalescence phase.
1 Introduction
Empirical and theoretical evidence indicate that the global production of stars in galaxies is mainly regulated by the steady accretion of gas from the intergalactic medium (IGM, e.g., Dekel et al., 2009b; L´Huillier et al., 2012; Hayward et al., 2012; Bouché et al., 2013), which drives widespread star formation in galactic disks over Gigayear (Gyr) time-scales (e.g., Daddi et al., 2010a; Genzel et al., 2010; Tacchella et al., 2016; Jiménez-Andrade et al., 2019). Such a process of galaxy evolution, known as the “cold gas accretion mode” of star formation, differs from the more intense production of stars during occasional starburst episodes of ten to few hundred Megayears (Myr) length (e.g., Daddi et al., 2010a; Genzel et al., 2010; Rodighiero et al., 2011). This is often due to major/minor mergers providing the energetic and baryonic input to abruptly enhance the star formation rate (SFR) of galaxies (e.g., Narayanan et al., 2010; L´Huillier et al., 2012; Ellison et al., 2013). Whereas both regimes of star formation have been widely explored out to intermediate redshifts (; e.g., Genzel et al., 2010; Wuyts et al., 2011; Magnelli et al., 2012, 2014; Daddi et al., 2015; Elbaz et al., 2018; Jiménez-Andrade et al., 2019), the relative role of the cold gas accretion and merger mode in driving the intense production of stars in galaxies at higher redshifts () remains an open issue (e.g., Carilli et al., 2010; Hayward et al., 2012; Hodge et al., 2012; Hayward et al., 2018; Jiménez-Andrade et al., 2018; Tadaki et al., 2018).
Exploring such early cosmic epochs has been possible thanks to a strong, negative K-correction that makes high-redshift star-forming galaxies (SFGs) easier to detect at sub-millimeter (sub-mm) wavelengths (e.g., Blain et al., 2002; Casey et al., 2014).
These sub-mm selected galaxies (SMGs) are, in general, massive star-bursting systems with SFR up to yr-1 and stellar masses () of
(e.g., Barger et al., 2012; Smolčić et al., 2015; Gómez-Guijarro et al., 2018; Harrington et al., 2018; Jiménez-Andrade et al., 2018; Lang et al., 2019). SMGs have acquired particular relevance to probe the merger and cold gas accretion mode in the yet unexplored regime (e.g., Carilli et al., 2010; Hayward et al., 2012). Although the “canonical” formation scenario of these massive starbursts involves major gas-rich mergers (e.g., Tacconi et al., 2006, 2008; Engel et al., 2010; Bothwell et al., 2010; Narayanan et al., 2010; Ivison et al., 2012; Bothwell et al., 2013), recent observational (and theoretical) evidence indicates that highly active star-forming disks can also lead to SMG-like luminosities (e.g., Davé et al., 2010; Hodge et al., 2012, 2016; Narayanan et al., 2015; Hayward et al., 2018; Tadaki et al., 2018; Hodge et al., 2019).
A heterogeneous SMG population, i.e., secular disks and major mergers, could also explain the diversity of quiescent massive galaxies at (e.g., Gobat et al., 2012; Toft et al., 2012, 2017). Whereas the structure and dynamics of most of those quiescent systems seem to be a result of compact, merger-driven SMGs at (Toft et al., 2014; Ikarashi et al., 2015; Fudamoto et al., 2017; Gómez-Guijarro et al., 2018), the progenitors of quiescent disk galaxies at (Newman et al., 2012; Toft et al., 2017) might have hosted enhanced star formation distributed across a massive rotating disk.
Despite the necessity to characterize the properties of massive, star-forming disks, only limited/small samples of such galaxies exist (e.g., Hodge et al., 2012; De Breuck et al., 2014; Jones et al., 2017; Shao et al., 2017). For instance, out of the 118 SFGs at in the recent ALPINE [C II] survey, no more than 15% of them are rotating disks (Le Fèvre et al., 2019). Among the hundreds of SMGs across the two square degree COSMOS field (e.g., Casey et al., 2013; Brisbin et al., 2017), only AzTEC1 (), AzTEC/C159 (), J10000234 (), and Vd17871 () exhibit convincing evidence for gas-dominated rotating disks (Jones et al., 2017; Tadaki et al., 2018). Consequently, these systems emerge as key laboratories to investigate the role of cold gas accretion in driving star formation at , which is the cosmic epoch when the cosmological gas accretion rate onto galaxies is expected to be maximal (e.g., Kereš et al., 2005).
Here, we use high-resolution observations of the Atacama Large Millimeter Array (ALMA) and NOrthern Extended Millimeter Array (NOEMA) to unveil the redshift and conditions for star formation in AzTEC2. This source is one of the brightest SMGs in the COSMOS field, which is composed by a massive, star-forming disk and a smaller companion galaxy at . We use [C II] and line observations to probe the gas content, star formation efficiency, and gas dynamics of AzTEC2 within the context of cold gas accretion and merger-driven star formation in the early Universe. This manuscript is organized as follows. In §2, we introduce the AzTEC2 source, while in §3, we describe the observations and data reduction. In §4, we present the analysis and results. The implications of this work are discussed in §5. We adopt a flat CDM cosmology with , , and .
2 AzTEC2: a bright, multi-component SMG
AzTEC2 was originally identified in the two surveys undertaken with the camera AzTEC at 1.1 mm over an area of degs2 in the COSMOS field (Scott et al., 2008; Aretxaga et al., 2011). In the first survey, obtained with the camera AzTEC mounted at the James Clerk Maxwell Telescope (JCMT), it was identified as the second brightest source in the survey: AzTEC2 (Scott et al., 2008). Later, with the camera AzTEC on the Atacama Submillimeter Telescope Experiment (ASTE), it was identified as AzTEC/C3, i.e., the third brightest source in the survey (Aretxaga et al., 2011). This bright SMG was also detected in the deep Herschel/HerMES survey
(250-500 m maps) and SCUBA-2 at both 450 m and 850 m (Casey et al., 2013).
AzTEC2 was recently cataloged as the second brightest SMG in the IRAM/GISMO 2 mm deep survey (over 250 arcmin Magnelli et al., 2019) and as the brightest galaxy in the ALMA 2 mm mosaic in the COSMOS field (with an area of 155 arcmin2; Casey et al. in prep.; Zavala et al. in prep.).
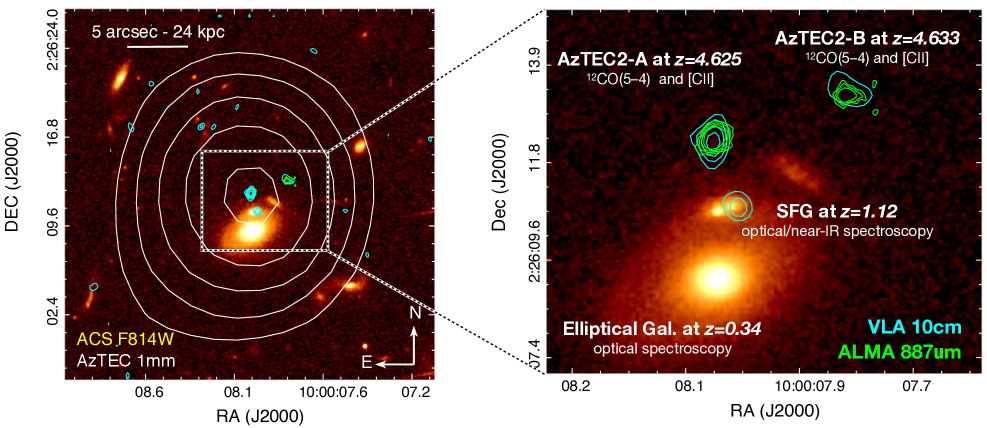
Recent imaging with ALMA (Brisbin et al., 2017) revealed that AzTEC2 is composed of two components separated by 3 arcsec (see Fig. 1): namely component AzTEC2-A and AzTEC2-B. Both sources were also detected with signal-to-noise ratio (SNR) in the 3 GHz radio continuum imaging with the Very Large Array (VLA) at arcsec resolution (Miettinen et al., 2017). Neither of the two components have a robust optical/near-infrared (IR) counterpart (Fig. 1; Laigle et al., 2016), hindering the redshift determination of the AzTEC2 complex. While a spectroscopic redshift solution of has been adopted for AzTEC2 in past studies (e.g., Smolčić et al., 2012, 2017; Miettinen et al., 2015, 2017; Brisbin et al., 2017), recent optical/near-IR spectroscopy revealed that such a redshift value corresponds to a bright foreground SFG at only 1.5 arcsec to the south of AzTEC2 (Casey et al., 2017, see Fig. 1). High-resolution observations at sub-mm/mm wavelengths (probing the cold star-forming interstellar medium) are hence crucial to unambiguously constrain the redshift of AzTEC2-A and AzTEC2-B, as well as to investigate the conditions for star formation in these bright SMGs.
3 Observations and data reduction
ALMA Band 7 observations (project 2015.1.00568.S, PI: C. Casey) were conducted on April 23 and September 1, 2016. The 12 m main array was used in two different configurations to obtain sub-arcsecond angular resolution without losing sensitivity at larger scales (maximum recoverable angular scale of arcsec).
The spectral setup, originally designed to only detect dust continuum emission, covered the frequency ranges of 335.5 339.5 GHz and 347.5 351.5 GHz. Data reduction and imaging were performed following the standard steps of the ALMA reduction pipeline scripts with CASA. During the imaging process, a Briggs weighting (robust=0.5) was used since it provided a good compromise between angular resolution and noise.
We reached a final sensitivity of 1 mJy beam-1
for a 50 MHz channel width (corresponding to ) and a median restoring beam of arcsec2 (PA=51∘). These observations allow us to pinpoint the emission from the different sources in this crowded field, and to spatially resolve the emission of AzTEC2-A.
A preliminary analysis of the ALMA data revealed a serendipitous line detection at the edge of our spectral windows, which was associated with [C II] at (see details in §4). To confirm the redshift, we then analyzed observations taken with the Redshift Search Receiver (RSR; Erickson et al. 2007) on the Large Millimeter Telescope. AzTEC2 was targeted as part of the Early Science Phase observations between 2014 and 2015 with a 32-m antenna (projects YUNM020 and HUGD024, PIs: M. Yun and D. Hughes, respectively). A total on-source time of 5 hrs led to a noise r.m.s of 1.0 mJy beam-1 per channel, with a spectral resolution of 31 MHz/100 km s-1 and spatial resolution of arcsec. Data reduction was performed in a similar way as described in Zavala et al. (2015, 2018). The final spectrum, covering the frequency range 73111 GHz, revealed a tentative detection of the 12CO line emission at . Although its low SNR (2) prevented us from firmly confirming the redshift, this tentative line detection allowed us to request further observations.
Follow-up observations were hence taken with NOEMA in Band 1 over two tracks on January 26 and 29, 2019 (project W18EU, PI: E.F. Jiménez-Andrade). A total observing time of 3.3 hours was reached using 10 antennas in A-configuration. We used the PolyFix correlator to cover the frequency range 84.9 – 92.7 GHz and 100.2–108.0 GHz, targeting the 12CO() line at . The data reduction was performed with the software GILDAS using the NOEMA standard pipeline, while imaging was done with the package mapping using natural weighting. The achieved spatial resolution of arcsec () suffices to resolve the two components of AzTEC2 separated by 3 arcsec (Fig. 1). The spectral data cube was smoothed to a 34 MHz resolution (i.e., km s-1), reaching a sensitivity of 0.13 mJy beam-1 per channel.
4 Data analysis and Results
4.1 Gravitational lensing magnification
Although there are no clear indications of gravitational amplification in our high-resolution ALMA data (Fig. 2), there are two foreground galaxies which could magnify the emission of both AzTEC2 components (Fig. 1). We use the Visilens code (Spilker et al., 2016) to estimate the gravitational amplification factor as follows. We model each foreground source separately, adopting a lens mass profile parameterized as an isothermal ellipsoid and assuming the Einstein mass to be (Auger et al., 2009). Given the relatively large offset between the foreground and background galaxies ( arcsec), second-order parameters of the lens mass profiles such as shape and ellipticity are found to be not relevant for the analysis. At the position of both AzTEC2-A and AzTEC2-B, the foreground galaxy at produces a negligible amplification while using a stellar mass upper limit of . On the other hand, the amplification produced by the more massive, elliptical galaxy (; Laigle et al., 2016) at is estimated to be () at the position of AzTEC2-A (AzTEC2-B). We adopt these magnification factors throughout the rest of the paper.
4.2 12CO(54) and [CII] line detections in AzTEC2 at
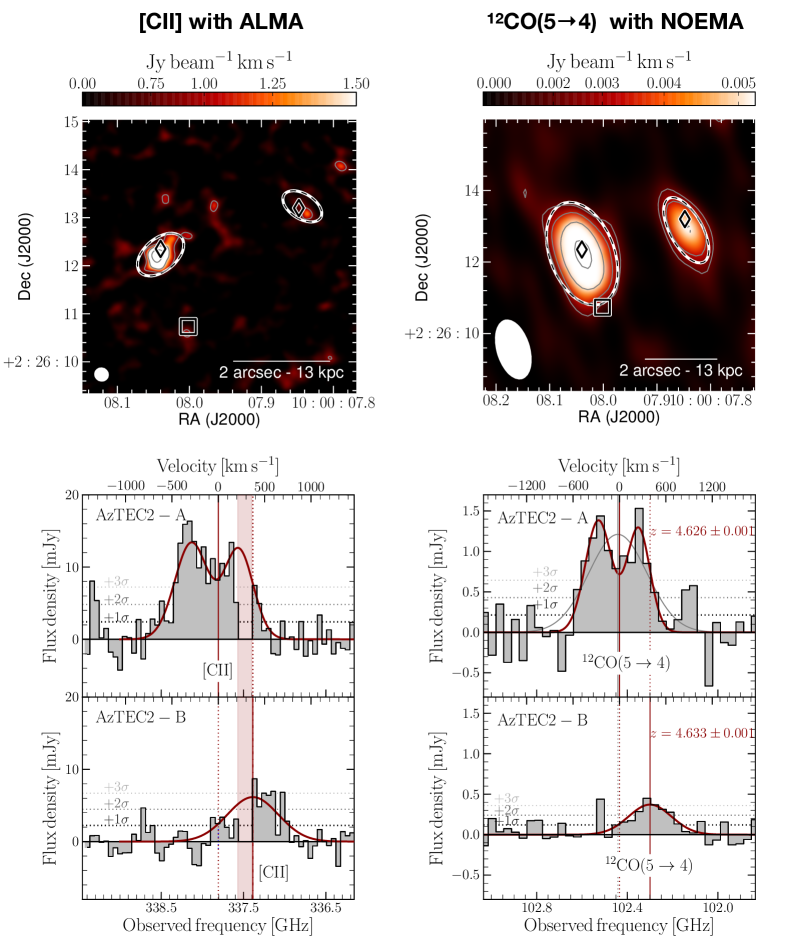
The NOEMA spectrum reveals emission at the position of AzTEC2-A and AzTEC2-B peaking at GHz. By collapsing the data cube within the frequency range 102.2 102.7 GHz, which encompasses the full emission line, we derive the intensity map shown in the upper-right panel of Fig. 2. A 2D Gaussian fit indicates that AzTEC2-A is resolved by our observations, with a deconvolved full width at half maximum of arcsec along the major axis. We use an aperture that is a factor 1.5 larger than the convolved FWHM of AzTEC2-A to retrieve most of the emission and extract the 12CO() line spectrum. Since AzTEC2-B appears as a point-like (unresolved) source, we integrate emission across a region that equals the size of the synthesized beam to obtain the spectrum (lower-right panel of Fig. 2). We identify a broad (FWHM km s-1), double-peaked emission line centered at GHz associated with AzTEC2-A. Through a least-squares algorithm (Levenberg-Marquardt), we find that a model with two Gaussian components describes better the line profile than a single Gaussian curve (yielding a reduced of 2.0 and 2.6, respectively). We thus adopt the former model and derive an integrated flux density of mJy km s-1. We also identify an line detection at the locus of AzTEC2-B that is centered at GHz. A single Gaussian model (reduced ) leads to an integrated flux density of mJy km s-1 (Table 1).
By averaging line-free channel maps in the 12CO() data cube, we also detect dust continuum emission from both components (peak SNR10) at the observed wavelength of . A 2D Gaussian fitting gives a total flux density of and for AzTEC2-A and AzTEC2-B, correspondingly (Table 1). Limited by our arcsec resolution, the dust continuum emission of both components is not spatially resolved by these NOEMA observations.
Significant line emission is detected at GHz towards both AzTEC2 components in the ALMA data cube (upper-left panel of Fig. 2). The velocity-integrated intensity map shows that these sources are resolved. AzTEC2-A, in particular, exhibits extended emission distributed across spatial resolution elements. A 2D Gaussian fit indicates a deconvolved FWHM of arcsec along the major axis for AzTEC2-A, and arcsec for AzTEC2-B (Table 1). To extract the line spectra we use an aperture that is a factor larger than the measured FWHM, allowing us to recover most of the extended line emission. As illustrated in the lower-left panel of Fig. 2, these ALMA line detections lie at the edges of the spectral windows used in our observations, preventing us from recovering/inspecting their total line profiles. There is tentative evidence, however, of a double-peaked line profile in AzTEC2-A as that observed at 103 GHz with NOEMA. During the fitting procedure, the relative amplitude and FWHM of the two peaks from this ALMA [CII] line detection are fixed to the values of the line emission.
The fit indicates a total integrated flux density of Jy km s-1 and central frequency of GHz. On the other hand, we use the FWHM of our 103 GHz line detection as a prior to model the profile of that at GHz in AzTEC2-B (reduced ), which gives a total integrated flux density of Jy km s-1 and central frequency of GHz.
Finally, we average line-free channel maps in the [C II] data cube and detect dust continuum emission for both AzTEC2 sources (peak SNR13) at the observed wavelength of (see Fig. 1). By fitting a 2D Gaussian model we derive a total flux density of and for AzTEC2-A and AzTEC2-B, correspondingly (Table 1). The model also indicates that the dust continuum emission of both components is spatially resolved by these ALMA observations, with a deconvolved FWHM of arcsec (Table 1).
By combining the line detections towards AzTEC2-A at 102.5 GHz and 337.5 GHz, we can unambiguously associate them with 12CO(54) and [C II], respectively, leading to a redshift solution of . Similarly, for AzTEC2-B we estimate a redshift of , implying a velocity offset of km s-1 with respect to AzTEC2-A. These robust line detections and counterpart association rule out the preliminary redshift solution of for AzTEC2 adopted in past studies (e.g., Smolčić et al., 2012, 2017; Miettinen et al., 2015; Brisbin et al., 2017; Miettinen et al., 2017).
4.3 Molecular gas content and star formation rate of AzTEC2
We use the 12CO(54) line detections to estimate the 12CO(10) line luminosity, , and hence infer the molecular gas mass in the AzTEC2 complex. We first consider that due to the higher temperature of the CMB at , the intrinsic value of the 12CO(54) line, , is a factor [1/0.8] higher (da Cunha et al., 2013) than the one measured from our observations. In using this factor, we assume that both AzTEC2-A and AzTEC2-B harbor a dense interstellar medium (ISM) with elevated gas kinetic temperature () – as the majority of SMGs (e.g., Magnelli et al., 2012; Cañameras et al., 2018). Therefore, we find that is mJy km s-1 ( mJy km s-1) for AzTEC2-A (AzTEC2-B). The corresponding line luminosity is subsequently derived following Carilli & Walter (2013, Sect. 2.4). We adopt typical SMG-like gas excitation conditions to convert the 12CO(54) line luminosity, , to . Then, (e.g., Bothwell et al., 2013; Carilli & Walter, 2013), which gives and for AzTEC2-A and AzTEC2-B, respectively (see Table 1). Finally, the molecular gas mas, , can be inferred through the CO-to-H2 () conversion factor: . The value of depends on the physical and chemical conditions of the ISM (e.g., Papadopoulos et al., 2012a, b). While low values ( K-1 km-1 s pc-2) are consistent with the turbulent and extreme ISM conditions of, for example, ultra-luminous infrared galaxies (ULIRGs; e.g., Downes & Solomon, 1998), higher vales ( K-1 km-1 s pc-2) are consistent with a self-gravitating gas configuration as observed in star-forming disks (e.g., Magnelli et al., 2012). Here we adopt a mean K-1 km-1 s pc-2111We refer the reader to §5.2 where we discuss in more detail the nature of to better compare AzTEC2-A and AzTEC2-B with the heterogeneous population of SMGs, which includes both mergers and star-forming disks (e.g., Hayward et al., 2018). We find a molecular gas mass of in AzTEC2-A, and a factor four lower in AzTEC2-B (see Table 1). The lensing-corrected gas mass budget of AzTEC2-A, , is consistent with the massive gas reservoir of others SMGs like AzTEC1, AzTEC3, AzTEC/C159, J10000234, and GN20 (Schinnerer et al., 2008; Carilli et al., 2010; Riechers et al., 2010; Hodge et al., 2012; Yun et al., 2015; Jiménez-Andrade et al., 2018; Tadaki et al., 2018), for which the median is .
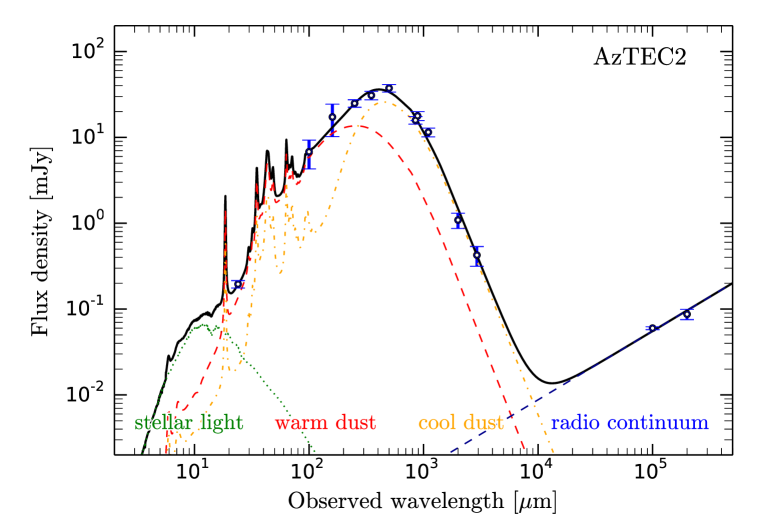
We derive the infrared luminosity , integrated over the wavelength range of m) and dust mass of the AzTEC2 complex by fitting its mid-IR–to–mm SED. This is done by following the SED fitting procedure presented by Liu et al. (2018), and by combining our dust continuum measurements at 887 m and 2.92 mm with information from the COSMOS photometric catalog compiled by Jin et al. (2018) and Liu et al. (2018). In the case of AzTEC2, this catalog includes photometric measurements at (see Table 1): (Le Floc’h et al., 2009), , (Lutz et al., 2011), , , (Oliver et al., 2012), (Geach et al., 2016), (Aretxaga et al., 2011), 10 cm (Schinnerer et al., 2010) and 21 cm (Smolčić et al., 2017). The photometric measurement at 2 mm recently obtained with the GISMO-2 bolometer camera (Magnelli et al., 2019) is also included in the analysis.
Since most photometric data towards the AzTEC2 complex do not have sufficient resolution to deblend the emission of AzTEC2-A and AzTEC2-B (Table 1), we use the combined monochromatic flux densities of both components even if high-resolution observations are available. We then fit the SED with five components: a stellar template from the Bruzual & Charlot (2003) models, an active galactic nuclei (AGN) template from Mullaney et al. (2011), warm and cold dust templates from Draine & Li (2007). The fifth component is a radio power law tailored to the dust IR luminosity with , where is the median value for the ratio between far-infrared and radio luminosity of SFGs (e.g., Magnelli et al., 2015; Delhaize et al., 2017). The fitting is performed through Monte Carlo sampling (with , following Liu et al. (2018)), from which the distribution and uncertainties are obtained. Our analysis indicates that a model with no AGN component provides the best fit to our data points, albeit more photometric information is needed to confirm the (apparently) negligible AGN activity in AzTEC2. Finally, we derive a total infrared luminosity of and dust mass of for the AzTEC2 complex.
To disentangle the contribution of AzTEC2-A and AzTEC2-B to the total and , we use our high-resolution photometric data at m and m. These observations independently trace the peak and Rayleigh-Jeans regime of the SED of both components (Table 1), allowing us to infer the contribution of AzTEC2-A and AzTEC2-B to the total IR SED.
Then, since the ratio between the IR flux density of the two components at m and m is , we estimate and for AzTEC2-A. For AzTEC2-B we derive and .
We note that the above reasoning assumes that the intrinsic SED of AzTEC2-A and AzTEC2-B are similar. While this is supported by the consistent flux density ratios at m and m, the properties that have been inferred from the scaled SEDs are subject to a high degree of uncertainty. Therefore, to add an independent constraint on the of AzTEC2-A and AzTEC2-B that is not affected by source blending, we use their [C II] line luminosity to estimate via the empirical luminosity ratio (e.g., Maiolino, R. et al., 2009; Lagache et al., 2018). We assume that the physical properties of AzTEC2-A and AzTEC2-B are similar to the ones of bright SMGs at similar redshifts (), for which (see compilation in Table B.1 of Lagache et al., 2018). With , we estimate for AzTEC2-A. Likewise, for AzTEC2-B we find and . Although here we neglect possible differences in the ratio of AzTEC2-A and AzTEC2-B arising from distinct physical conditions of the ISM (e.g., ultraviolet radiation field and/or metal enrichment; Katz et al., 2017; Rybak et al., 2019), these new and independent estimates corroborate those derived via SED fitting.
We infer the SFR of both components following the calibration from Kennicutt (1998): SFR[ yr-1]. Assuming a Chabrier Initial Mass Function, we derive yr-1 for AzTEC2-A, while for AzTEC2-B we find yr-1. The lensing-corrected SFR of AzTEC2-B ( yr-1) is consistent with the average for
SMGs at similar redshifts ( yr-1; e.g., Smolčić et al., 2015; Gómez-Guijarro et al., 2018; Jiménez-Andrade et al., 2018; Magnelli et al., 2019). The extreme IR-based SFR of AzTEC2-A (SFR= yr-1) is comparable to those of the massive, star-forming disks GN20 and AzTEC1 at (Carilli et al., 2010; Magnelli et al., 2012; Tadaki et al., 2018).
On the other hand, we use our estimates to infer the molecular gas mass of AzTEC2-A and AzTEC2-B. We assume that these SMGs have solar metallicity and, consequently, that they harbor a gas-to-dust ratio of (following the – metallicity relation derived by Leroy et al. (2011)). Then, for AzTEC2-A and for AzTEC2-B. These values are in good agreement with the estimates derived from our 12CO line observations assuming a mean of 2.5 , which are and for AzTEC2-A and AzTEC2-B, correspondingly.
4.4 Mode of star formation in AzTEC2
The ratio gives an indication of how efficient the production of stars in galaxies is for a given molecular gas reservoir. We estimate a ratio of for AzTEC2-A and for AzTEC2-B (see Table 1). The star formation efficiency of AzTEC2-A is larger than
those of nearby and star-forming disks (20100 ; Daddi et al., 2010a; Genzel et al., 2010), but it is in agreement with the ratio of star-forming disks like GN20 and AzTEC/C159 (180220 ; Hodge et al., 2012; Jiménez-Andrade et al., 2018).
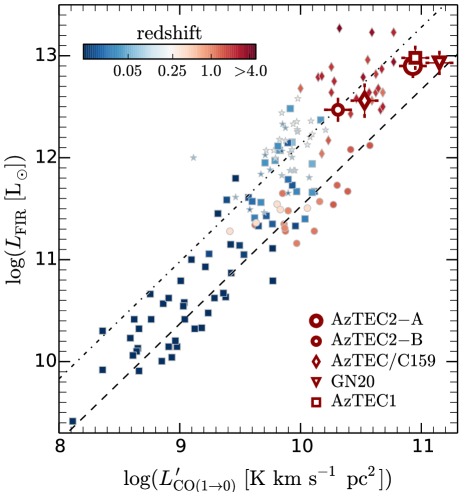
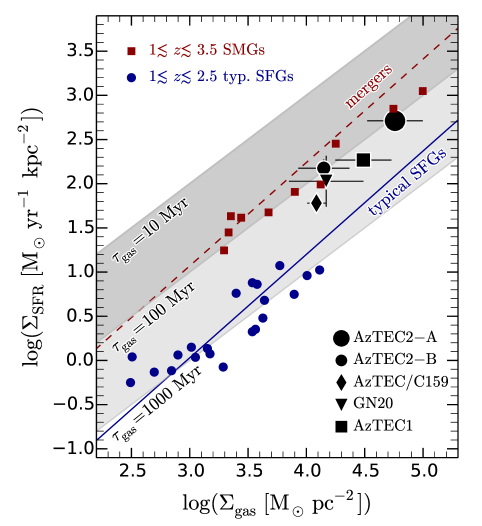
To better compare the star formation efficiency of AzTEC2-A and AzTEC2-B with respect to the overall SFG’s population, in Fig. 4 we present the relation for star-forming disks and merger-driven starbursts derived by Genzel et al. (2010). For this exercise, we estimate the far-IR (FIR) luminosity () of the AzTEC2 complex by integrating the total IR SED (Fig. 3) over the wavelength range 42.5 – 122.5 m (following Helou et al., 1985). Then, the of AzTEC2-A and AzTEC2-B are inferred from the relative ratio of their dust-continuum flux density at m and m (as done for in §4.3). We estimate for AzTEC2-A, and for AzTEC2-B (see Table 1). Combining these values with our estimates, we plot the locus of
AzTEC2-A and AzTEC2-B in the plane. We also include compilations of nearby normal and starburst galaxies (Solomon et al., 1997; Gao & Solomon, 2004), star-forming disks (Daddi et al., 2010a; Geach et al., 2011; Magnelli et al., 2012), SMGs (Bothwell et al., 2013), and massive star-forming disks at (Carilli et al., 2010; Hodge et al., 2012; Jones et al., 2017; Jiménez-Andrade et al., 2018; Tadaki et al., 2018). This comparison indicates that most of the reported SMGs, like AzTEC2-B, lie on/above the empirical relation for mergers. Despite being at the high-end of the plane, AzTEC2-A (as well as GN20 and AzTEC1) approaches the relation of normal, star-forming disk galaxies (see Fig. 4; e.g., Genzel et al., 2010).
Another indicator of star formation efficiency is the ratio (e.g., Daddi et al., 2015), which
traces the dense, warm molecular gas (cm-3) that is closely linked to massive star formation. We find that AzTEC2-A (AzTEC2-B) exhibits a ratio that is 1.6 (2.5) larger than local star-forming and main sequence (MS) galaxies (e.g., Liu et al., 2015).
This suggests that AzTEC2-A consumes its star-forming gas faster than secular star-forming disks, but at a more moderate rate than typical SMGs like AzTEC2-B.
Given their available gas reservoir, AzTEC2-A (AzTEC2-B) will be able to sustain their current SFR for a period of 110 Myr (80 Myr) (assuming a mean K-1 km-1 s pc-2). The gas depletion time-scale () of AzTEC2-A, in particular,
exhibit a mild excess with respect to the average for SMGs at similar redshifts ( Myr; Aravena et al., 2016), but resembles the one of the massive, star-forming disk galaxies GN20, AzTEC/C159 and AzTEC1 at (Hodge et al., 2012; Jiménez-Andrade et al., 2018; Tadaki et al., 2018).
Overall, the properties of AzTEC2-A and AzTEC2-B are consistent with the intense star formation activity observed in bright SMGs at (Schinnerer et al., 2008; Riechers et al., 2010; Yun et al., 2015; Jiménez-Andrade et al., 2018; Tadaki et al., 2018). AzTEC2-A resembles –to some extent– the properties of massive, star-forming disks at lower and similar redshifts (e.g., Daddi et al., 2010a; Genzel et al., 2010; Hodge et al., 2012), which form stars through the cold gas accretion mode of star formation.
4.5 A rapidly rotating, massive disk in AzTEC2-A
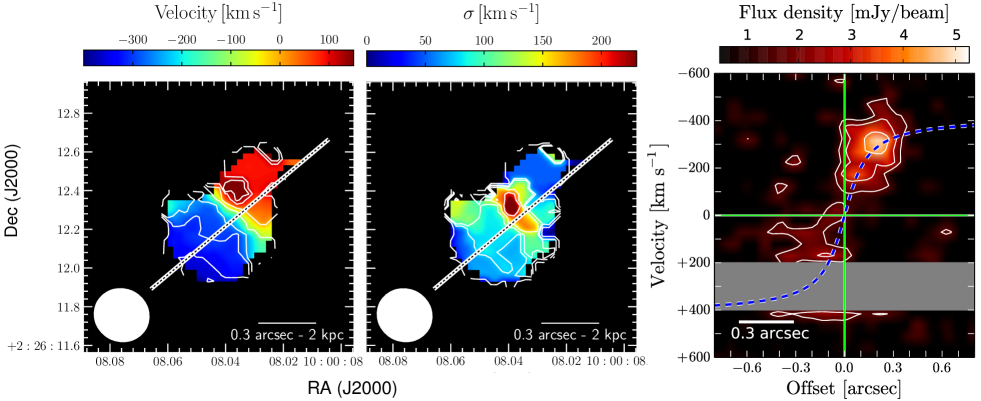
Predictions from numerical simulations (e.g., Kohandel et al., 2019) and observations of high-redshift galaxies (e.g., Jones et al., 2017) have suggested that a double-peaked [C II] line profile, like that of AzTEC2-A (Fig. 2), can be consistent with a rotating disk galaxy. We then use the high-resolution [C II] line observations to explore the kinematics of AzTEC2-A, for which the high SNR of the detection enables us to derive the velocity field and velocity dispersion of the gas. As observed in Fig. 5, AzTEC2-A exhibits a smooth velocity gradient that appears to be consistent with rotationally dominated kinematics. To parameterize its motion, we derive the position-velocity (pv) diagram (Fig. 5) along the major-axis of the [C II] line emission using a 0.3 arcsec width aperture.
There exist several parameterizations (or models) that can describe the rotation curves of galaxies, including the basic 2-parameter arctan function, the more elaborate “multi-parameter function” (Courteau, 1997), and the “universal rotation curve” (Persic et al., 1996). The empirically motivated arctan model is given by (e.g., Courteau, 1997; Willick, 1999), where is the asymptotic rotational velocity and is the transition radius between the rising and flat part of the rotation curve. With only two free parameters, the arctan function provides an adequate description to rotation curves of low- and high-redshift galaxies (Courteau, 1997; Willick, 1999; Miller et al., 2011; Swinbank et al., 2012; De Breuck et al., 2014; Drew et al., 2018), while avoiding strong covariances between the fitted parameters of more complex models (Courteau, 1997).
We thus adopt the arctan model to fit the rotation curve of AzTEC2-A. As observed in Fig. 5, this function offers a reasonable description of the observed portion of the PV diagram. Our fit, limited by the lack of velocity channels above km s-1, suggests an asymptotic velocity of km s-1 and kpc. To derive the intrinsic (de-projected) rotational velocity, , we need to infer the disk inclination (). This can be derived from the apparent ellipticity of the galaxy: i.e., , where the respective FWHM values can be derived from the surface brightness distribution of the [C II] line. However, as observed in Fig. 5, the absence of velocity channels above km s-1 biases the spatial distribution of the [C II] line emission. Assuming a co-spatial distribution of interstellar dust and gas, the inclination of the [C II] disk can be approximated from the ellipticity of the dust continuum emission revealed by our high-resolution ALMA observations (§4.2). We then derive , which leads to an intrinsic rotational velocity of km s-1. Such a high rotational speed is consistent with the one of the rapidly spinning, star-forming disks GN20, AzTEC/C159 and J1000+0234 at ( km s-1; Carilli et al., 2010; Hodge et al., 2012; Jones et al., 2017).
To evaluate the rotational-to-dispersion support ( of the disk, we inspect the line-of-sight velocity dispersion () map in Fig. 5. We anticipate that at the innermost region of the galaxy, the measured is highly enhanced by “beam smearing”222At the innermost region of galaxies, the measured line width is boosted by large-scale motions occurring within the region traced by a relatively coarse (finite) Point Spread Function (PSF). (e.g., Davies et al., 2011; Stott et al., 2016). Since such a contribution is expected to be modest at the outermost radii, we adopt km s-1 (from the contour levels in the map, Fig. 5) as an upper limit for the intrinsic velocity dispersion of the gas in the disk. Then, we derive , indicating that AzTEC2-A is rather an unperturbed, rotation-dominated disk that resembles the ratio of more evolved disk galaxies at (e.g., Di Teodoro et al., 2016, and references therein). This finding, therefore, provides more evidence of kinematically mature disks that can be found at even , such as GN20 (Hodge et al., 2012), ALESS 73.1 (De Breuck et al., 2014), AzTEC/C159, J10000234, (Jones et al., 2017; Jiménez-Andrade et al., 2018) and AzTEC1 (Tadaki et al., 2018).
Finally, by assuming that the kinematics of the disk is mainly dominated by the gravitational potential of AzTEC2-A, its dynamical mass () can be estimated through the relation: , where is the rotation velocity at radius and is the gravitational constant. Using arcsec that encompasses the full extent of the [C II] line emission, and that equals the size of the aperture used to obtain the spectrum, we find . This mass budget roughly agrees with that expected for the molecular gas mass (), indicating that AzTEC2-A is a massive gas-rich disk possibly assembled through an enhanced accretion of gas from the cosmic web (e.g., Bournaud & Elmegreen, 2009; Dekel et al., 2009a, b; Romano-Díaz et al., 2014). A post-merger scenario, however, can not be excluded, given that disks could survive or re-form rather quickly after a gas-rich merger (e.g., Springel & Hernquist, 2005; Hammer et al., 2009; Hopkins et al., 2009).
Simulated disk galaxies that formed via gas-rich mergers can resemble the observed properties (kinematics, SFR, gas surface density) of disks (Robertson & Bullock, 2008). Furthermore, a coarse PSF (like ours, kpc) diminishes the contrast between disturbed kinematics and rotation-dominated disks (Hung et al., 2016). Deeper [CII] line observations with sub-kpc scale resolution are thus needed to accurately derive the kinematic properties of AzTEC2-A and, hence, to isolate the formation scenario of its rotating gas disk.
5 Implications for galaxy evolution at high redshift
The redshift identification and subsequent dynamical characterization of AzTEC2-A add new evidence on the existence of massive vigorously star-forming disks in the early Universe. By including AzTEC2-A, the sample of SMGs at with robust evidence of rotation has now increased to seven sources: AzTEC2-A, AzTEC/C159, AzTEC1, Vd-17871, J10000234, ALESS 73.1, and GN20 (Carilli et al., 2010; Hodge et al., 2012; De Breuck et al., 2014; Jones et al., 2017; Tadaki et al., 2018). The former galaxies represent more than half the population of spectroscopically confirmed SMGs within the two square degrees of the COSMOS field (Smolčić et al., 2012, 2015). Here, we discuss the implications of these findings within the context of cold gas accretion and merger-driven star formation in massive, high-redshift galaxies.
5.1 A heterogeneous SMG population
The enhanced production of stars in SMGs has been largely attributed to gas-rich galaxy mergers (e.g., Tacconi et al., 2008; Younger et al., 2010; Engel et al., 2010; Riechers et al., 2011; Iono et al., 2016), which is compatible with the merger-driven starbursts in local ULIRGs (e.g., Sanders & Mirabel, 1996). In the case of AzTEC2, and as observed in Fig. 1, our current ALMA dust continuum imaging does not reveal clear signs of disturbance/interaction between AzTEC2-A and AzTEC2-B (e.g., strong tidal tails and/or bridges). Although this could be a result of the surface brightness limit of these observations, the clear spatial separation between AzTEC2-A and AzTEC2-B (20 kpc) and the relative velocity offset of 350 km s-1 suggest that these galaxies undergo a pre-coalescence (first approach) phase (e.g., Calderón-Castillo et al., 2019). This might indicate that the vigorous SFR in AzTEC2-A is not dominated by merging activity. Instead, the gas velocity fields, , and ratio point towards a smoother mode of star formation that drives a massive, star-forming disk (e.g., Dekel et al., 2009a, b; Carilli et al., 2010; Hodge et al., 2012; Romano-Díaz et al., 2014). Certainly, the properties of AzTEC2 resemble those of the well-characterized star-forming disk GN20 at similar redshift (Carilli et al., 2010; Hodge et al., 2012).
These results strengthen the scenario in which single-dish selected SMGs are a heterogeneous population (e.g., Hayward et al., 2011, 2013), including major mergers (e.g., Engel et al., 2010; Riechers et al., 2014), isolated disk galaxies and pairs of (likely infalling) galaxies that are blended into a single sub-mm source as observed in AzTEC2. As discussed by Hayward et al. (2011), this heterogeneity is linked to the SMG selection function. Since sub-mm surveys lead to flux (SFR) limited samples of galaxies (e.g., Scott et al., 2008; Aretxaga et al., 2011), at high redshift (), only SFGs harboring a SFR can be selected with typical single-dish surveys (e.g., Magnelli et al., 2019). Therefore, this selection function tends to identify the extreme and massive end of the SFG population at high redshifts, including both merger-driven and massive star-forming disks that sustain vigorous star formation activity leading to SMG-like IR luminosities (e.g., Hayward et al., 2012).
5.2 The cold gas accretion and merger mode of star formation at
The evidence of rotation-dominated, gas-rich, star-forming disks at (e.g., Carilli et al., 2010; Hodge et al., 2012; De Breuck et al., 2014; Jones et al., 2017; Tadaki et al., 2018) indicates that high-redshift SMGs are not only merging, strongly perturbed systems (Tacconi et al., 2008; Younger et al., 2010; Engel et al., 2010; Riechers et al., 2011; Menéndez-Delmestre et al., 2014; Chen et al., 2015; Jones et al., 2017; Chang et al., 2018). High-resolution (0.07 arcsec) dust continuum imaging with ALMA has even shown evidence for spiral arms, bars, and rings in SMGs (Hodge et al., 2019).
The remaining question is what are the mechanisms leading to the intense production of stars in such massive, star-forming disks in the early Universe. We thus infer the locus of AzTEC2-A (and AzTEC2-B) in the Kennicutt-Schmidt plane (Fig. 6) and use them as an observational diagnostic for constraining the global conditions for star formation in these systems.
We use the spatial extent of the dust continuum emission from our ALMA observations (see §4.2) to infer the galaxy-averaged SFR surface density: . The effective radius containing half of the total emission, , is approximated as (Murphy et al., 2017), assuming an exponentially declining surface brightness distribution as observed in disk galaxies.
In order to approximate the galaxy-averaged molecular gas surface density (), we use our estimate based on (§4.3) and . Although the rotation-dominated gas disk of AzTEC2-A favors a higher value (e.g., Papadopoulos et al., 2012a, b; Jiménez-Andrade et al., 2018), we require more robust constraints (e.g., dynamical mass, metallicity, excitation conditions) to validate this scenario. We thus consider the uncertainties of associated to the unknown value by illustrating in Fig. 6 the range given by varying from 0.8 to .
We also recall that in deriving , and hence , we have assumed typical SMG-like gas excitation conditions, as previously observed in other massive, highly star-forming rotating disks like GN20 and AzTEC/C159 (Carilli et al., 2010; Hodge et al., 2012; Jiménez-Andrade et al., 2018). By combining our and estimates we find that AzTEC2-A lies at the upper end of the Kennicutt-Schmidt relation for typical SFGs (Fig. 6 Genzel et al., 2010). This is consistent with the properties of the massive, star-forming disks GN20 (Carilli et al., 2010; Hodge et al., 2012) and AzTEC/C159 (Jones et al., 2017; Jiménez-Andrade et al., 2018) at similar redshift. These systems arise as scaled (more active) versions of star-forming disks at lower redshifts ( e.g., Daddi et al., 2010a, b; Genzel et al., 2010, and references therein). Qualitatively, this is in agreement with the systematically higher gas fractions (e.g., Genzel et al., 2015; Schinnerer et al., 2016; Tacconi et al., 2018; Liu et al., 2019) and enhanced specific SFR of galaxies with increasing redshift (e.g., Karim et al., 2011; Speagle et al., 2014; Schreiber et al., 2015; Lehnert et al., 2015).
Fig. 6 also suggests that massive, star-forming disks like AzTEC2-A, GN20, and AzTEC/C159 seem to harbor a systematically lower gas depletion time-scale than their analogs at lower redshifts; which is compatible with the redshift evolution of of massive MS galaxies (e.g., Saintonge et al., 2013; Schinnerer et al., 2016; Tacconi et al., 2018; Liu et al., 2019). Such an efficient regime of star formation, that approaches that of merger-driven starbursts (Fig. 6), could be explained by the turbulent ISM and rapid dynamical evolution that characterize high-redshift disks (e.g., Förster Schreiber et al., 2009; Bournaud et al., 2012; Swinbank et al., 2012). In this context, the enhanced stellar birth rate of early star-forming disks is a result of their inherent large gas reservoirs and –to some extent– a higher star formation efficiency ().
Numerical simulations predict that at the enhanced gas accretion from the cosmic web can maintain a gravitationally unstable gas-rich disk, which breaks into giant clumps and forms stars at a high rate (Bouché et al., 2007; Hodge et al., 2012; Romano-Díaz et al., 2014). Additionally, star formation in AzTEC2-A might be further enhanced due gravitational interaction (torques) with its (minor) companion galaxy, AzTEC2-B, during the ongoing pre-coalescence phase – as inferred from hydrodynamic merger simulations (e.g., Cox et al., 2008; Moreno et al., 2015) and observations of galaxy pairs (Scudder et al., 2012). Although evidence of such tidal interactions could be inferred from an asymmetric (perturbed) velocity field of the gas (e.g., Kronberger et al., 2007), the incomplete coverage of the [C II] velocity field of AzTEC2-A prevent us from confirming this scenario.
6 Summary
We have used multi-wavelength spectroscopic and photometric data to constrain the redshift and conditions for star formation in AzTEC2: the second brightest SMG (at 1.1 and 2 mm) in the COSMOS field. Our results are listed below:
-
•
AzTEC2 splits into two components (AzTEC2-A and AzTEC2-B) for which we detect 12CO(54) and [CII] line emission, leading to a redshift of and for AzTEC2-A and AzTEC2-B, respectively;
-
•
The emission of AzTEC2-A and AzTEC2-B is mildly magnified by a foreground, massive elliptical galaxy at located at arcsec to the south of AzTEC2-A,B. We estimate a magnification factor of and for AzTEC2-A and AzTEC2-B, respectively;
-
•
Based on the 12CO(54) line emission of AzTEC2-A we have derived , implying a molecular gas mass of . The FIR luminosity of AzTEC2-A leads to , ratio of , and ;
-
•
Correspondingly, for AzTEC2-B we have found that , , , , and ;
-
•
We have revealed a rotation-dominated [CII] disk in AzTEC2-A, with an intrinsic (de-projected) rotational velocity of km s-1, velocity dispersion of km s-1 and dynamical mass of .
Our results indicate that AzTEC2-A hosts a massive, rotation-dominated disk where star formation occurs at intense levels. This indicates that even disk galaxies, that harbor vast gas reservoirs, could sustain intense star formation activity that resembles that of merger-driven SMGs. This supports the emerging consensus whereby the population of single-dish selected SMGs is rather heterogeneous, including both interacting systems and galaxies that form stars through a smoother mode of star formation sustained by cold gas accretion.
A more systematic study of high-redshift star-forming disks is required to verify this scenario, allowing us to probe their properties within the framework of the cold and merger mode of star formation in the early Universe.
Appendix A Properties of AzTEC2
| Properties | Units | AzTEC2-A | AzTEC2-B | ||
|---|---|---|---|---|---|
| 12CO(54) | [CII] | 12CO(54) | [CII] | ||
| FWHM | km s-1 | 890 150 | … | 650 150 | … |
| Peak flux | mJy/beam | 1.2 0.2 | 0.4 0.1 | ||
| Integrated flux | Jy km s-1 | 1.07 0.06a | 0.26 0.03a | ||
| Central frequency | GHz | 102.43 0.03 | 102.30 0.02 | ||
| 4.626 0.001 | 4.633 0.001 | ||||
| 1.5 | 1.35 | ||||
| RA, Dec | hh:mm:ss.sss, dd:mm:ss.ss | 10:00:08.042 02:26:12.19 | 10:00:07.842 02:26:13.32 | ||
| arcsec/kpc | / | / | |||
| arcsec/kpc | / | ||||
| arcsec/kpc | / | / | |||
| c | K km s-1 pc2 | ||||
| K km s-1 pc2 | |||||
| (K km s-1 pc2)-1 | |||||
| SFR | yr-1 | ||||
| ( | |||||
| Myr | |||||
| mJy | |||||
| mJy | |||||
| mJy | |||||
| mJy | |||||
| mJy | |||||
| mJy | |||||
| mJy | |||||
| mJy | |||||
| mJy | |||||
| mJy | |||||
| mJy | |||||
| mJy | |||||
| mJy | |||||
References
- Aravena et al. (2016) Aravena, M., Spilker, J. S., Bethermin, M., et al. 2016, MNRAS, 457, 4406. https://academic.oup.com/mnras/article/457/4/4406/2589079
- Aretxaga et al. (2011) Aretxaga, I., Wilson, G. W., Aguilar, E., et al. 2011, MNRAS, 415, 3831. http://mnras.oxfordjournals.org/content/415/4/3831.abstract
- Auger et al. (2009) Auger, M. W., Treu, T., Bolton, A. S., et al. 2009, ApJ, 705, 1099. http://dx.doi.org/10.1088/0004-637X/705/2/1099
- Barger et al. (2012) Barger, A. J., Wang, W.-H., Cowie, L. L., et al. 2012, ApJ, 761, 89. http://stacks.iop.org/0004-637X/761/i=2/a=89
- Blain et al. (2002) Blain, A. W., Smail, I., Ivison, R. J., Kneib, J.-P., & Frayer, D. T. 2002, Phys. Rep., 369, 111. https://www.sciencedirect.com/science/article/abs/pii/S0370157302001345?via%3Dihub
- Bothwell et al. (2010) Bothwell, M. S., Chapman, S. C., Tacconi, L., et al. 2010, MNRAS, 405, 219. https://doi.org/10.1111/j.1365-2966.2010.16480.x
- Bothwell et al. (2013) Bothwell, M. S., Aguirre, J. E., Chapman, S. C., et al. 2013, ApJ, 779, 67. http://dx.doi.org/10.1088/0004-637X/779/1/67
- Bothwell et al. (2013) Bothwell, M. S., Smail, I., Chapman, S. C., et al. 2013, MNRAS, 429, 3047. https://academic.oup.com/mnras/article/429/4/3047/1011515
- Bouché et al. (2013) Bouché, N., Murphy, M. T., Kacprzak, G. G., et al. 2013, Science, 341, 50. http://science.sciencemag.org/content/341/6141/50.abstract
- Bouché et al. (2007) Bouché, N., Cresci, G., Davies, R., et al. 2007, ApJ, 671, 303. http://stacks.iop.org/0004-637X/671/i=1/a=303
- Bournaud & Elmegreen (2009) Bournaud, F., & Elmegreen, B. G. 2009, ApJL, 694, L158. http://dx.doi.org/10.1088/0004-637X/694/2/L158
- Bournaud et al. (2012) Bournaud, F., Juneau, S., Floc’h, E. L., et al. 2012, ApJ, 757, 81. https://doi.org/10.1088%2F0004-637x%2F757%2F1%2F81
- Brisbin et al. (2017) Brisbin, D., Miettinen, Oskari, Aravena, Manuel, et al. 2017, A&A, 608, A15. https://doi.org/10.1051/0004-6361/201730558
- Bruzual & Charlot (2003) Bruzual, G., & Charlot, S. 2003, MNRAS, 344, 1000. http://dx.doi.org/10.1046/j.1365-8711.2003.06897.x
- Cañameras et al. (2018) Cañameras, R., Yang, C., Nesvadba, N. P. H., et al. 2018, A&A, 620, A61. https://doi.org/10.1051/0004-6361/201833625
- Calderón-Castillo et al. (2019) Calderón-Castillo, P., Nagar, N. M., Yi, S., et al. 2019, A&A, in press., arXiv:1904.09300
- Carilli & Walter (2013) Carilli, C. L., & Walter, F. 2013, ARA&A, 51, 105. https://www.annualreviews.org/doi/10.1146/annurev-astro-082812-140953
- Carilli et al. (2010) Carilli, C. L., Daddi, E., Riechers, D., et al. 2010, ApJ, 714, 1407. http://iopscience.iop.org/article/10.1088/0004-637X/714/2/1407/meta
- Casey et al. (2014) Casey, C. M., Narayanan, D., & Cooray, A. 2014, Phys. Rev, 541, 45. https://www.sciencedirect.com/science/article/abs/pii/S0370157314000477?via%3Dihub
- Casey et al. (2013) Casey, C. M., Chen, C.-C., Cowie, L. L., et al. 2013, MNRAS, 436, 1919. http://dx.doi.org/10.1093/mnras/stt1673
- Casey et al. (2017) Casey, C. M., Cooray, A., Killi, M., et al. 2017, ApJ, 840, 101. http://stacks.iop.org/0004-637X/840/i=2/a=101
- Chang et al. (2018) Chang, Y.-Y., Ferraro, N., Wang, W.-H., et al. 2018, 865, 103. http://dx.doi.org/10.3847/1538-4357/aadd18
- Chen et al. (2015) Chen, C.-C., ALESS, & ALMA-S2CLSconsortia. 2015, in Revolution in astronomy with ALMA: the third year, ed. D. Iono, K. Tatematsu, A. Wootten, & L. Testi, Vol. 499. http://aspbooks.org/custom/publications/paper/499-0013.html
- Courteau (1997) Courteau, S. 1997, AJ, 114, 2402. http://articles.adsabs.harvard.edu/full/1997AJ....114.2402C
- Cox et al. (2008) Cox, T. J., Jonsson, P., Somerville, R. S., Primack, J. R., & Dekel, A. 2008, MNRAS, 384, 386
- da Cunha et al. (2013) da Cunha, E., Groves, B., Walter, F., et al. 2013, ApJ, 766, 13. http://stacks.iop.org/0004-637X/766/i=1/a=13
- Daddi et al. (2010a) Daddi, E., Bournaud, F., Walter, F., et al. 2010a, ApJ, 713, 686. http://stacks.iop.org/0004-637X/713/i=1/a=686
- Daddi et al. (2010b) Daddi, E., Elbaz, D., Walter, F., et al. 2010b, ApJ, 714, L118. http://dx.doi.org/10.1088/2041-8205/714/1/L118
- Daddi et al. (2015) Daddi, E., Dannerbauer, H., Liu, D., et al. 2015, A&A, 577, A46. https://www.aanda.org/articles/aa/abs/2015/05/aa25043-14/aa25043-14.html
- Davé et al. (2010) Davé, R., Finlator, K., Oppenheimer, B. D., et al. 2010, MNRAS, 404, 1355. http://dx.doi.org/10.1111/j.1365-2966.2010.16395.x
- Davies et al. (2011) Davies, R., Schreiber, N. M. F., Cresci, G., et al. 2011, ApJ, 741, 69. https://doi.org/10.1088%2F0004-637x%2F741%2F2%2F69
- De Breuck et al. (2014) De Breuck, C., Williams, R. J., Swinbank, M., et al. 2014, A&A, 565, A59. http://dx.doi.org/10.1051/0004-6361/201323331
- Dekel et al. (2009a) Dekel, A., Sari, R., & Ceverino, D. 2009a, ApJ, 703, 785. http://stacks.iop.org/0004-637X/703/i=1/a=785
- Dekel et al. (2009b) Dekel, A., Birnboim, Y., Engel, G., et al. 2009b, Nature, 457, 451. http://dx.doi.org/10.1038/nature07648
- Delhaize et al. (2017) Delhaize, J., Smolčić, V., Delvecchio, I., et al. 2017, A&A, 602, A4. https://doi.org/10.1051/0004-6361/201629430
- Di Teodoro et al. (2016) Di Teodoro, E. M., Fraternali, F., & Miller, S. H. 2016, A&A, 594, A77. https://doi.org/10.1051/0004-6361/201628315
- Downes & Solomon (1998) Downes, D., & Solomon, P. M. 1998, ApJ, 507, 615. http://stacks.iop.org/0004-637X/507/i=2/a=615
- Draine & Li (2007) Draine, B. T., & Li, A. 2007, ApJ, 657, 810. http://stacks.iop.org/0004-637X/657/i=2/a=810
- Drew et al. (2018) Drew, P. M., Casey, C. M., Burnham, A. D., et al. 2018, ApJ, 869, 58. https://doi.org/10.3847%2F1538-4357%2Faaedbf
- Elbaz et al. (2018) Elbaz, D., Leiton, R., Nagar, N., et al. 2018, A&A, 616, A110. https://doi.org/10.1051/0004-6361/201732370
- Ellison et al. (2013) Ellison, S. L., Mendel, J. T., Scudder, J. M., Patton, D. R., & Palmer, M. J. D. 2013, MNRAS, 430, 3128. https://doi.org/10.1093/mnras/sts546
- Engel et al. (2010) Engel, H., Tacconi, L. J., Davies, R. I., et al. 2010, ApJ, 724, 233. http://stacks.iop.org/0004-637X/724/i=1/a=233;http://adsabs.harvard.edu/abs/2010ApJ...724..233E
- Erickson et al. (2007) Erickson, N., Narayanan, G., Goeller, R., & Grosslein, R. 2007, in Astronomical Society of the Pacific Conference Series, Vol. 375, From Z-Machines to ALMA: (Sub)Millimeter Spectroscopy of Galaxies, ed. A. J. Baker, J. Glenn, A. I. Harris, J. G. Mangum, & M. S. Yun, 71. http://aspbooks.org/custom/publications/paper/375-0071.html
- Förster Schreiber et al. (2009) Förster Schreiber, N. M., Genzel, R., Bouché, N., et al. 2009, ApJ, 706, 1364. http://dx.doi.org/10.1088/0004-637X/706/2/1364
- Fudamoto et al. (2017) Fudamoto, Y., Ivison, R. J., Oteo, I., et al. 2017, MNRAS, 472, 2028. http://dx.doi.org/10.1093/mnras/stx1956
- Gao & Solomon (2004) Gao, Y., & Solomon, P. M. 2004, ApJ, 606, 271. https://doi.org/10.1086%2F382999
- Geach et al. (2011) Geach, J. E., Smail, I., Moran, S. M., et al. 2011, ApJ, 730, L19. https://iopscience.iop.org/article/10.1088/2041-8205/730/2/L19
- Geach et al. (2016) Geach, J. E., Dunlop, J. S., Halpern, M., et al. 2016, ArXiv e-prints, arXiv:1607.03904
- Geach et al. (2016) Geach, J. E., Narayanan, D., Matsuda, Y., et al. 2016, ApJ, 832, 37. http://stacks.iop.org/0004-637X/832/i=1/a=37
- Genzel et al. (2010) Genzel, R., Tacconi, L. J., Gracia-Carpio, J., et al. 2010, MNRAS, 407, 2091. https://academic.oup.com/mnras/article/407/4/2091/998428
- Genzel et al. (2015) Genzel, R., Tacconi, L. J., Lutz, D., et al. 2015, ApJ, 800, 20. https://iopscience.iop.org/article/10.1088/0004-637X/800/1/20
- Gobat et al. (2012) Gobat, R., Strazzullo, V., Daddi, E., et al. 2012, ApJL, 759, L44. http://stacks.iop.org/2041-8205/759/i=2/a=L44
- Gómez-Guijarro et al. (2018) Gómez-Guijarro, C., Toft, S., Karim, A., et al. 2018, ApJ, 856, 121. http://stacks.iop.org/0004-637X/856/i=2/a=121
- Hammer et al. (2009) Hammer, F., Flores, H., Puech, M., et al. 2009, A&A, 507, 1313. https://doi.org/10.1051/0004-6361/200912115
- Harrington et al. (2018) Harrington, K. C., Yun, M. S., Magnelli, B., et al. 2018, MNRAS, 474, 3866. http://dx.doi.org/10.1093/mnras/stx3043
- Hayward et al. (2012) Hayward, C. C., Jonsson, P., Kereš, D., et al. 2012, MNRAS, 424, 951. http://dx.doi.org/10.1111/j.1365-2966.2012.21254.x
- Hayward et al. (2011) Hayward, C. C., Kereš, D., Jonsson, P., et al. 2011, ApJ, 743, 159. http://stacks.iop.org/0004-637X/743/i=2/a=159
- Hayward et al. (2013) Hayward, C. C., Primack, J. R., Moreno, J., et al. 2013, MNRAS, 434, 2572. https://doi.org/10.1093/mnras/stt1202
- Hayward et al. (2018) Hayward, C. C., Bremer, M. N., Chen, C.-C., et al. 2018, MNRAS, 476, 2278. https://doi.org/10.1093/mnras/sty304
- Helou et al. (1985) Helou, G., Soifer, B. T., & Rowan-Robinson, M. 1985, ApJL, 298, 7
- Hodge et al. (2012) Hodge, J. A., Carilli, C. L., Walter, F., et al. 2012, ApJ, 760, 11. http://stacks.iop.org/0004-637X/760/i=1/a=11
- Hodge et al. (2016) Hodge, J. A., Swinbank, A. M., Simpson, J. M., et al. 2016, ApJ, 833, 103. http://stacks.iop.org/0004-637X/833/i=1/a=103
- Hodge et al. (2019) Hodge, J. A., Smail, I., Walter, F., et al. 2019, ApJ, 876, 130. http://dx.doi.org/10.3847/1538-4357/ab1846
- Hopkins et al. (2009) Hopkins, P. F., Cox, T. J., Younger, J. D., & Hernquist, L. 2009, ApJ, 691, 1168. http://stacks.iop.org/0004-637X/691/i=2/a=1168
- Hung et al. (2016) Hung, C.-L., Hayward, C. C., Smith, H. A., et al. 2016, ApJ, 816, 99. http://dx.doi.org/10.3847/0004-637X/816/2/99
- Ikarashi et al. (2015) Ikarashi, S., Ivison, R. J., Caputi, K. I., et al. 2015, ApJ, 810, 133. http://stacks.iop.org/0004-637X/810/i=2/a=133
- Iono et al. (2016) Iono, D., Yun, M. S., Aretxaga, I., et al. 2016, ApJL, 829, L10. http://stacks.iop.org/2041-8205/829/i=1/a=L10
- Ivison et al. (2012) Ivison, R. J., Smail, I., Amblard, A., et al. 2012, MNRAS, 425, 1320. https://doi.org/10.1111/j.1365-2966.2012.21544.x
- Jiménez-Andrade et al. (2018) Jiménez-Andrade, E. F., Magnelli, B., Karim, A., et al. 2018, A&A, 615, A25. https://doi.org/10.1051/0004-6361/201732186
- Jiménez-Andrade et al. (2019) Jiménez-Andrade, E. F., Magnelli, B., Karim, A., et al. 2019, A&A, 625, A114. https://doi.org/10.1051/0004-6361/201935178
- Jin et al. (2018) Jin, S., Daddi, E., Liu, D., et al. 2018, ApJ, 864, 56. http://dx.doi.org/10.3847/1538-4357/aad4af
- Jones et al. (2017) Jones, G. C., Carilli, C. L., Shao, Y., et al. 2017, ApJ, 850, 180. http://stacks.iop.org/0004-637X/850/i=2/a=180
- Karim et al. (2011) Karim, A., Schinnerer, E., Martínez-Sansigre, A., et al. 2011, ApJ, 730, 61. http://stacks.iop.org/0004-637X/730/i=2/a=61
- Katz et al. (2017) Katz, H., Kimm, T., Sijacki, D., & Haehnelt, M. G. 2017, MNRAS, 468, 4831. https://doi.org/10.1093/mnras/stx608
- Kennicutt (1998) Kennicutt, J. R. C. 1998, ARA&A, 36, 189
- Kereš et al. (2005) Kereš, D., Katz, N., Weinberg, D. H., & Davé, R. 2005, MNRAS, 363, 2. http://dx.doi.org/10.1111/j.1365-2966.2005.09451.x
- Kohandel et al. (2019) Kohandel, M., Pallottini, A., Ferrara, A., et al. 2019, MNRAS, 487, 3007. https://doi.org/10.1093/mnras/stz1486
- Kronberger et al. (2007) Kronberger, T., Kapferer, W., Schindler, S., & Ziegler, B. L. 2007, A&A, 473, 761. https://doi.org/10.1051/0004-6361:20077696
- Lagache et al. (2018) Lagache, G., Cousin, M., & Chatzikos, M. 2018, A&A, 609, A130. https://doi.org/10.1051/0004-6361/201732019
- Laigle et al. (2016) Laigle, C., McCracken, H. J., Ilbert, O., et al. 2016, ApJSS, 224, 24. http://stacks.iop.org/0067-0049/224/i=2/a=24
- Lang et al. (2019) Lang, P., Schinnerer, E., Smail, I., et al. 2019, ApJ, 879, 54. http://dx.doi.org/10.3847/1538-4357/ab1f77
- Le Fèvre et al. (2019) Le Fèvre, O., Béthermin, M., Faisst, A., et al. 2019, submitted to A&A, arXiv:1910.09517
- Le Floc’h et al. (2009) Le Floc’h, E., Aussel, H., Ilbert, O., et al. 2009, ApJ, 703, 222. http://dx.doi.org/10.1088/0004-637X/703/1/222
- Lehnert et al. (2015) Lehnert, M. D., van Driel, W., Le Tiran, L., Di Matteo, P., & Haywood, M. 2015, A&A, 577, A112. https://doi.org/10.1051/0004-6361/201322630
- Leroy et al. (2011) Leroy, A. K., Bolatto, A., Gordon, K., et al. 2011, ApJ, 737, 12. http://stacks.iop.org/0004-637X/737/i=1/a=12
- L´Huillier et al. (2012) L´Huillier, B., Combes, F., & Semelin, B. 2012, A&A, 544, A68. https://doi.org/10.1051/0004-6361/201117924
- Liu et al. (2015) Liu, D., Gao, Y., Isaak, K., et al. 2015, ApJ, 810, L14. http://dx.doi.org/10.1088/2041-8205/810/2/L14
- Liu et al. (2018) Liu, D., Daddi, E., Dickinson, M., et al. 2018, ApJ, 853, 172. http://dx.doi.org/10.3847/1538-4357/aaa600
- Liu et al. (2019) Liu, D., Schinnerer, E., Groves, B., et al. 2019, submitted to ApJ, arXiv:1910.12883
- Lutz et al. (2011) Lutz, D., Poglitsch, A., Altieri, B., et al. 2011, A&A, 532, A90. https://doi.org/10.1051/0004-6361/201117107
- Magnelli et al. (2012) Magnelli, B., Saintonge, A., Lutz, D., et al. 2012, A&A, 548, A22. http://dx.doi.org/10.1051/0004-6361/201220074
- Magnelli et al. (2014) Magnelli, B., Lutz, D., Saintonge, A., et al. 2014, A&A, 561, A86. https://doi.org/10.1051/0004-6361/201322217
- Magnelli et al. (2015) Magnelli, B., Ivison, R. J., Lutz, D., et al. 2015, A&A, 573, A45. https://doi.org/10.1051/0004-6361/201424937
- Magnelli et al. (2019) Magnelli, B., Karim, A., Staguhn, J., et al. 2019, ApJ, 877, 45. http://dx.doi.org/10.3847/1538-4357/ab1912
- Maiolino, R. et al. (2009) Maiolino, R., Caselli, P., Nagao, T., et al. 2009, A&A, 500, L1. https://doi.org/10.1051/0004-6361/200912265
- Menéndez-Delmestre et al. (2014) Menéndez-Delmestre, K., Blain, A. W., Swinbank, M., et al. 2014, in XIV Latin American Regional IAU Meeting, ed. A. Mateus, J. Gregorio-Hetem, & R. Cid Fernandes, Vol. 44, 85. http://www.astroscu.unam.mx/rmaa/RMxAC..44/PDF/RMxAC..44_GAL_menendez-delmestre.pdf
- Miettinen et al. (2015) Miettinen, O., Smolčić, V., Novak, M., et al. 2015, A&A, 577, A29. https://doi.org/10.1051/0004-6361/201425032
- Miettinen et al. (2017) Miettinen, O., Delvecchio, I., Smolčić, V., et al. 2017, A&A, 597, A5. https://doi.org/10.1051/0004-6361/201628128
- Miller et al. (2011) Miller, S. H., Bundy, K., Sullivan, M., Ellis, R. S., & Treu, T. 2011, ApJ, 741, 115. https://doi.org/10.1088%2F0004-637x%2F741%2F2%2F115
- Moreno et al. (2015) Moreno, J., Torrey, P., Ellison, S. L., et al. 2015, MNRAS, 448, 1107. http://dx.doi.org/10.1093/mnras/stv094
- Mullaney et al. (2011) Mullaney, J. R., Alexander, D. M., Goulding, A. D., & Hickox, R. C. 2011, MNRAS, 414, 1082. https://doi.org/10.1111/j.1365-2966.2011.18448.x
- Murphy et al. (2017) Murphy, E. J., Momjian, E., Condon, J. J., et al. 2017, ApJ, 839, 35. http://stacks.iop.org/0004-637X/839/i=1/a=35
- Narayanan et al. (2010) Narayanan, D., Hayward, C. C., Cox, T. J., et al. 2010, MNRAS, 401, 1613. http://mnras.oxfordjournals.org/content/401/3/1613.abstract
- Narayanan et al. (2015) Narayanan, D., Turk, M., Feldmann, R., et al. 2015, Nature, 525, 496. http://dx.doi.org/10.1038/nature15383
- Newman et al. (2012) Newman, S. F., Genzel, R., Förster-Schreiber, N. M., et al. 2012, ApJ, 761, 43. http://stacks.iop.org/0004-637X/761/i=1/a=43
- Oliver et al. (2012) Oliver, S. J., et al. 2012, MNRAS, 424, 1614
- Papadopoulos et al. (2012a) Papadopoulos, P. P., van der Werf, P., Xilouris, E., Isaak, K. G., & Gao, Y. 2012a, ApJ, 751, 10. http://stacks.iop.org/0004-637X/751/i=1/a=10
- Papadopoulos et al. (2012b) Papadopoulos, P. P., van der Werf, P. P., Xilouris, E. M., et al. 2012b, MNRAS, 426, 2601. http://dx.doi.org/10.1111/j.1365-2966.2012.21001.x
- Persic et al. (1996) Persic, M., Salucci, P., & Stel, F. 1996, MNRAS, 281, 27
- Riechers et al. (2011) Riechers, D. A., Hodge, J., Walter, F., Carilli, C. L., & Bertoldi, F. 2011, ApJL, 739, L31. http://stacks.iop.org/2041-8205/739/i=1/a=L31
- Riechers et al. (2010) Riechers, D. A., Capak, P. L., Carilli, C. L., et al. 2010, ApJL, 720, L131. http://stacks.iop.org/2041-8205/720/i=2/a=L131
- Riechers et al. (2014) Riechers, D. A., Carilli, C. L., Capak, P. L., et al. 2014, ApJ, 796, 84. http://stacks.iop.org/0004-637X/796/i=2/a=84
- Robertson & Bullock (2008) Robertson, B. E., & Bullock, J. S. 2008, ApJ, 685, L27. http://stacks.iop.org/1538-4357/685/i=1/a=L27
- Rodighiero et al. (2011) Rodighiero, G., Daddi, E., Baronchelli, I., et al. 2011, ApJL, 739, L40. http://stacks.iop.org/2041-8205/739/i=2/a=L40
- Romano-Díaz et al. (2014) Romano-Díaz, E., Shlosman, I., Choi, J.-H., & Sadoun, R. 2014, ApJL, 790, L32. http://stacks.iop.org/2041-8205/790/i=2/a=L32
- Rybak et al. (2019) Rybak, M., Rivera, G. C., Hodge, J. A., et al. 2019, ApJ, 876, 112. https://doi.org/10.3847%2F1538-4357%2Fab0e0f
- Saintonge et al. (2013) Saintonge, A., Lutz, D., Genzel, R., et al. 2013, ApJ, 778, 2. https://doi.org/10.1088%2F0004-637x%2F778%2F1%2F2
- Sanders & Mirabel (1996) Sanders, D. B., & Mirabel, I. F. 1996, ARA&A, 34, 749. https://www.annualreviews.org/doi/abs/10.1146/annurev.astro.34.1.749?journalCode=astro
- Schinnerer et al. (2008) Schinnerer, E., Carilli, C. L., Capak, P., et al. 2008, ApJ, 689, L5. http://stacks.iop.org/1538-4357/689/i=1/a=L5
- Schinnerer et al. (2010) Schinnerer, E., Sargent, M. T., Bondi, M., et al. 2010, ApJSS, 188, 384. http://dx.doi.org/10.1088/0067-0049/188/2/384
- Schinnerer et al. (2016) Schinnerer, E., Groves, B., Sargent, M. T., et al. 2016, ApJ, 833, 112. http://stacks.iop.org/0004-637X/833/i=1/a=112
- Schreiber et al. (2015) Schreiber, C., Pannella, M., Elbaz, D., et al. 2015, A&A, 575, A74. https://doi.org/10.1051/0004-6361/201425017
- Scott et al. (2008) Scott, K. S., et al. 2008, MNRAS, 385, 2225. https://academic.oup.com/mnras/article/385/4/2225/1036374
- Scudder et al. (2012) Scudder, J. M., Ellison, S. L., Torrey, P., Patton, D. R., & Mendel, J. T. 2012, MNRAS, 426, 549. https://doi.org/10.1111/j.1365-2966.2012.21749.x
- Shao et al. (2017) Shao, Y., Wang, R., Jones, G. C., et al. 2017, ApJ, 845, 138. http://stacks.iop.org/0004-637X/845/i=2/a=138
- Smolčić et al. (2017) Smolčić, V., Novak, M., Bondi, M., et al. 2017, A&A, 602, A1. https://doi.org/10.1051/0004-6361/201628704
- Smolčić et al. (2012) Smolčić, V., Aravena, M., Navarrete, F., et al. 2012, A&A, 548, A4. http://dx.doi.org/10.1051/0004-6361/201219368
- Smolčić et al. (2015) Smolčić, V., Karim, A., Miettinen, O., et al. 2015, A&A, 576, A127. http://dx.doi.org/10.1051/0004-6361/201424996
- Smolčić et al. (2017) Smolčić, V., Miettinen, O., Tomičić, N., et al. 2017, A&A, 597, A4. https://doi.org/10.1051/0004-6361/201526989
- Solomon et al. (1997) Solomon, P. M., Downes, D., Radford, S. J. E., & Barrett, J. W. 1997, ApJ, 478, 144. https://iopscience.iop.org/article/10.1086/303765
- Speagle et al. (2014) Speagle, J. S., Steinhardt, C. L., Capak, P. L., & Silverman, J. D. 2014, ApJSS, 214, 15. http://stacks.iop.org/0067-0049/214/i=2/a=15
- Spilker et al. (2016) Spilker, J. S., Marrone, D. P., Aravena, M., et al. 2016, ApJ, 826, 112. http://dx.doi.org/10.3847/0004-637X/826/2/112
- Springel & Hernquist (2005) Springel, V., & Hernquist, L. 2005, ApJ, 622, L9. http://stacks.iop.org/1538-4357/622/i=1/a=L9
- Stott et al. (2016) Stott, J. P., Swinbank, A. M., Smail, I., et al. 2016, MNRAS, 457, 1888. https://doi.org/10.1093/mnras/stw129
- Swinbank et al. (2012) Swinbank, A. M., Sobral, D., Smail, I., et al. 2012, MNRAS, 426, 935. https://doi.org/10.1111/j.1365-2966.2012.21774.x
- Tacchella et al. (2016) Tacchella, S., Dekel, A., Carollo, C. M., et al. 2016, MNRAS, 457, 2790. http://dx.doi.org/10.1093/mnras/stw131
- Tacconi et al. (2006) Tacconi, L. J., Neri, R., Chapman, S. C., et al. 2006, ApJ, 640, 228. http://stacks.iop.org/0004-637X/640/i=1/a=228
- Tacconi et al. (2008) Tacconi, L. J., Genzel, R., Smail, I., et al. 2008, ApJ, 680, 246. http://stacks.iop.org/0004-637X/680/i=1/a=246
- Tacconi et al. (2018) Tacconi, L. J., Genzel, R., Saintonge, A., et al. 2018, ApJ, 853, 179. http://stacks.iop.org/0004-637X/853/i=2/a=179
- Tadaki et al. (2018) Tadaki, K., Iono, D., Yun, M. S., et al. 2018, Nature, 560, 613. https://doi.org/10.1038/s41586-018-0443-1
- Toft et al. (2012) Toft, S., Gallazzi, A., Zirm, A., et al. 2012, ApJ, 754, 3. http://stacks.iop.org/0004-637X/754/i=1/a=3
- Toft et al. (2014) Toft, S., Smolčić, V., Magnelli, B., et al. 2014, ApJ, 782, 68. http://stacks.iop.org/0004-637X/782/i=2/a=68
- Toft et al. (2017) Toft, S., Zabl, J., Richard, J., et al. 2017, Nature, 546, 510. http://dx.doi.org/10.1038/nature22388
- Willick (1999) Willick, J. A. 1999, ApJ, 516, 47. https://doi.org/10.1086%2F307108
- Wuyts et al. (2011) Wuyts, S., Schreiber, N. M. F., van der Wel, A., et al. 2011, ApJ, 742, 96. http://stacks.iop.org/0004-637X/742/i=2/a=96
- Younger et al. (2010) Younger, J. D., Fazio, G. G., Ashby, M. L. N., et al. 2010, MNRAS, 407, 1268. http://dx.doi.org/10.1111/j.1365-2966.2010.16984.x
- Yun et al. (2015) Yun, M. S., et al. 2015, MNRAS, 454, 3485. https://academic.oup.com/mnras/article/454/4/3485/992500
- Zavala et al. (2015) Zavala, J. A., et al. 2015, MNRAS, 452, 1140. https://academic.oup.com/mnras/article/452/2/1140/1059247
- Zavala et al. (2018) Zavala, J. A., Montaña, A., Hughes, D. H., et al. 2018, Nature Astronomy, 2, 56. https://doi.org/10.1038/s41550-017-0297-8